Coping Strategies to Deal with Environmental Variability and Extreme Climatic Events in the Peruvian Anchovy Fishery

Abstract
: The Peruvian anchovy fishery is the largest worldwide in terms of catches. The fishery started during the mid 1950s, and since then it has been highly dependent on natural stock fluctuations, due to the sensitivity of anchovy stocks to ocean-climate variability. The main driver of anchovy stock variability is the El Niño Southern Oscillation (ENSO), and three extreme ENSO warm events were recorded in 1972–1973, 1983–1984 and 1997–1998. This study investigates the evolution of coping strategies developed by the anchovy fisheries to deal with climate variability and extreme ENSO events. Results showed eight coping strategies to reduce impacts on the fishery. These included: decentralized installation of anchovy processing factories; simultaneous ownership of fishing fleet and processing factories; use of low-cost unloading facilities; opportunistic utilization of invading fish populations; low cost intensive monitoring; rapid flexible management; reduction of fishmeal price uncertainty through controlled production based on market demand; and decoupling of fishmeal prices from those of other protein-rich feed substitutes like soybean. This research shows that there are concrete lessons to be learned from successful adaptations to cope with climate change-related extreme climatic events that impact the supply of natural resources. The lessons can contribute to improved policies for coping with climate change in the commercial fishery sector.1. Introduction
Capture fisheries and aquaculture supplied the world with about 142 million tons of fish food in 2008 and provided 3 billion people with at least 15% of their average per capita animal protein intake [1] These fishery activities, so important for nourishing and ensuring the livelihoods of large sectors of the world population, are closely linked to weather and climate dynamics, and are more affected by these than any other category of food production [2]. While weather conditions directly affect fishing, environmental climate variability determines the distribution, migration and abundance of fish [3]. Fisheries-climate links have been the subject of research since at least the establishment of the International Council of the Exploration of the Sea (ICES) in 1902 [4]. More than a century later, the United Nations Food and Agriculture Organization (FAO) states that “the fisheries sector is not unfamiliar with the issue of climate variability and it is experienced in dealing with variability on a range of time scales” [5].
The Peruvian anchovy fishery has been described as the largest fishery that has ever existed on earth [6-8] and as the most intense and successful fishery worldwide [9]. Annual current catches are around 7–8 million tons [10] captured by almost 1200 purse seiners locally known as bolicheras [11]. Ninety nine percent of anchovy catches are reduced to fishmeal and fish oil by around 140 processing factories [6,12]. The fishery is mono-specific [13,14]; since at least 90% of the catches consist of one fish species: anchovy or anchoveta (Engraulis ringens).
Peruvian anchovy, like any other pelagic fish species, are highly sensitive to ocean-climate variability and show drastic stock fluctuations [9,15-17]. Historical landings statistics show that the fishery went through a first phase of frenzy and uncontrolled growth from its establishment in the mid-1950s until its collapse in 1972. After the collapse, a second phase from 1973 to 1984 was characterized by unfavorable warm ocean conditions and low catches. A third phase, from 1984 to the present, with propitious ocean-environmental conditions and modern governance, can be further divided into a second growth period (1984–1994) and a sustainable landings period (1995 to present) [10, 18, 19].
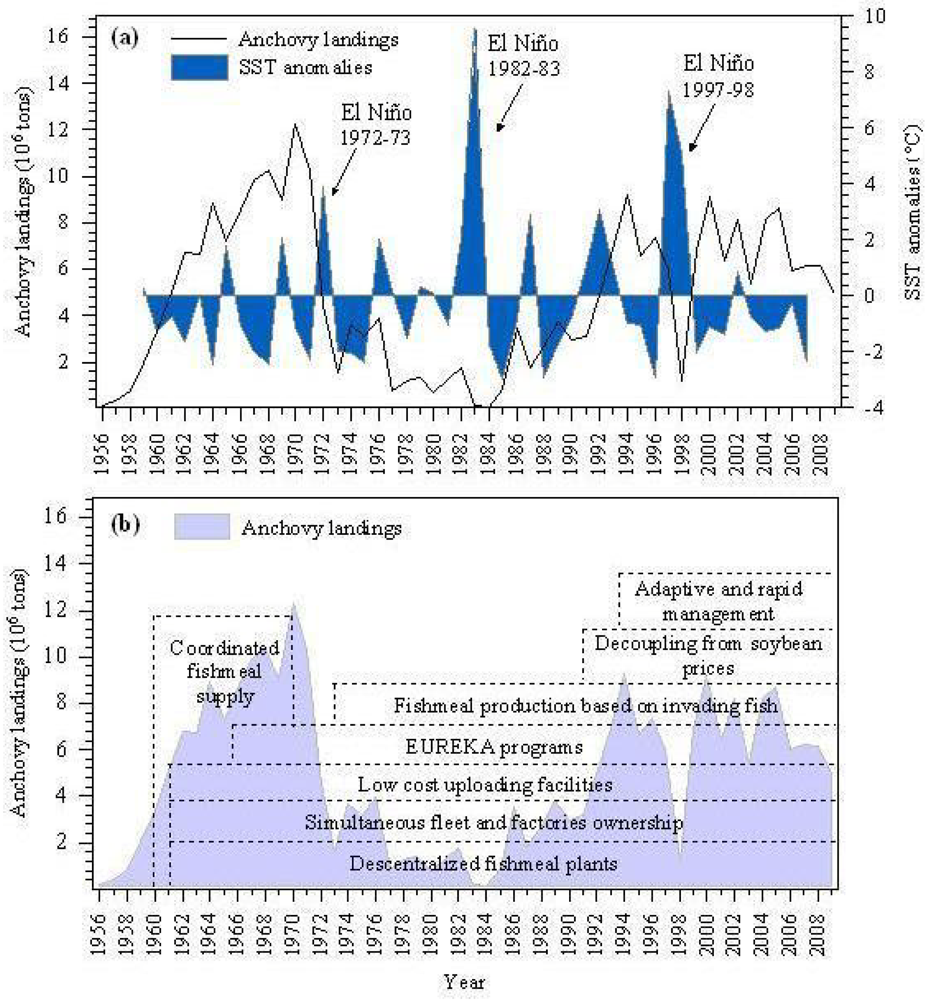
Thus, anchovy catches in Peru are dependant on inter-annual and multi-decadal variability driven by climatic conditions in the Pacific Ocean [9]. The most important climatic factor affecting this geographical area is the Pacific coupled ocean-atmospheric circulation pattern known as El Niño Southern Oscillation (ENSO) [3,20]. The ENSO cycle consists of a warm period (El Niño) and a cold period (La Niña) and is characterized by respectively anomalous cooling or warming of the eastern Pacific. In Peruvian waters, El Niño (the warm ENSO period) usually lasts for a few weeks to a few months. Sometimes an extremely warm event can develop lasting for a much longer time [21]. The effects of El Niño events in Peru have long been observed and three major impacts have been identified: (i) it increases coastal sea temperature by up to 8 °C, (ii) it reduces plankton productivity and (iii) it creates a more tropical predator-prey environment [3]. As a result, anchovy catches are, broadly, negatively correlated to sea surface temperature (SST) anomalies; SST is the principal indicator used to measure the duration and intensity of El Niño events in Peruvian waters (Figure 1a).
Unfortunately for purposes of prediction, the interval between El Niño events is very irregular. It is not uncommon to have six or seven years' interval, but some events have been separated by as little as one year [22] Although current understanding and modeling of El Niño has improved remarkably over the last decade [23,24], the predictability of El Nino is still an open question [25]; and our ability to forecast its evolution is far from perfect [24].
Three El Niño episodes of exceptional intensity and duration were recorded in 1972–1973, 1982–1983 and 1997–1998 [3,14,26] (Figure 1a). Although the relation between climate change and El Niño events has been debated during the last decades [27-32], recent research has revealed that 43% of extreme El Niño events have occurred since the start of the 20th century and 30% during the post-1940 period [33]. These results suggest that ENSO may operate differently under natural (pre-industrial) and anthropogenic background states [33]. The aim of this study is to investigate the evolution of coping strategies developed by the Peruvian anchovy fishery to deal with environmental variability and extreme El Niño events, whose frequency can be expected to increase under current climate change scenarios [33,34].
2. Field Study Methodology
The study area was the Peruvian coast between latitudes 03°30′ S to 18°20′ S and longitudes 72°W to 84°W, which is dominated by the Humboldt–Peru eastern boundary current system. The coastal ecosystem is characterized on the marine side by intense upwelling and associated high productivity, which however are variable between years and decades [35]; and on the land side by an almost 2,250 km long narrow desert strip.
Semi-structured interviews with key informants were carried out during October 2008 and November 2009. Interviews were carried out at the Vice-Ministry of Fisheries (10 interviews), the Instituto del Mar del Perú or IMARPE (8 interviews) and the private fishery sector (9 interviews) (Annex 1). Interviewees were selected on the basis of length of experience and period of time in post, in order to obtain information covering at least the period during and between the last two strong ENSO events in 1982–1983 and 1997–1998. Since the interviewer herself worked for IMARPE between 1994 and 2001, interviewees were approached via email or telephone with support from ex-colleagues currently working directly for the government or the fishing industry. All government officials were interviewed at their offices with previous permission from their superiors.
Extensive documentary analysis based mainly on internal reports, yearbooks, fishery magazines and grey literature was also undertaken. Historical fishery data was gathered from the anchovy database at the Pelagic Resources Department of IMARPE.
As an output of the interviews, four impacts of extreme El Niño events on the anchovy fishery were identified and used to analyze the evolution of coping strategies. These impacts were as follows:
First Impact: Changes in distribution of anchovy shoals with consequent relocation of anchovy fishing grounds
Second Impact: Decrease in anchovy biomass and invasion of foreign tropical species into anchovy fishing grounds
Third Impact: Management regulations rapidly out-of-date
Fourth Impact: Uncertain changes in fishmeal prices
3. Results and Discussion
The fishery system can be broken down into three interacting subsystems: resource, resource users and resource management [36] or resource units produced by the fishery, the users of that system and the governance system [37]. Our results show that Peruvian fishing companies (resource users) and anchovy management authorities (resource management) have together developed at least eight strategies to cope with the impacts of climate variability and extreme El Niño events (Table 1).
Five of the eight strategies were developed at the start of the rapid growth phase of the fishery during the 1960s (Figure 1b). These strategies were a response to seasonal stock variability and the impacts of minor El Niño events in 1965 and 1969 [22,38]; however, they played an important role in diminishing the effects of subsequent, more extreme events. One strategy was put in place as the fishery started to collapse during the extreme 1972–1973 El Niño event. The remaining two strategies have been developed since 1994, during the sustainable landings phase of the fishery [18].
3.1. First Impact: Changes in Distribution of Anchovy Shoals with Consequent Relocation of Anchovy Fishing Grounds
The sensibility of anchovy shoals to climate variability was identified on a very early stage of the fishery and was documented in the second “historical report” of Instituto de Investigaciones de Recursos Marinos or IREMAR in 1962. This report records a sharp decline in landings in ports of northern Peru during January 1962, and suggests this was likely due to the migration of anchovy shoals or to changes in local sea temperature [39]. Some years later Roemer [40] noted that “anchovy fishing is not uniformly good along the coast and the fortunes of any one zone vary from season to season or even from month to month”. As a result of this observed variability, before the onset of the first extreme 1972–1973 El Niño and even prior to the minor events of 1965 and 1969, three coping strategies to deal with changes in the relocation of anchovy fishing grounds were early on put in place.
3.1.1. Coping Strategy 1: Scatter Geographical Distribution of Fishmeal Plants along the Coast
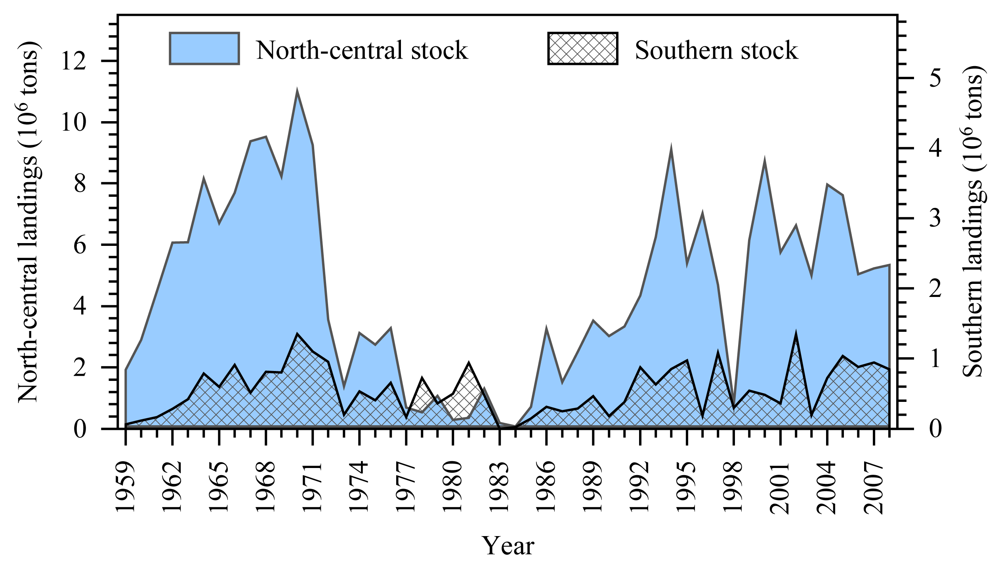
The Peruvian anchovy is a small, short-living, fast growing surface dweller widely distributed along the coast of South America [35]. Off Peru two population units are recognized: the north-central stock, from about latitude 4° S to 15° S, and the southern stock from 15° S to the southern limit of the Peruvian maritime domain [10,35,41]. Fishing usually takes place between latitudes 5° S and 14° S, targeting on the north-central anchovy stock, which is by far the most productive [10] (Figure 2).
Anchovy fishing and processing started in 1955 in the port of Chimbote (09°05′ S), and in Callao (12°05′ S), the port that serves Lima [42]. In 1960, when anchovy landings started to increase rapidly, fishmeal processing was concentrated around Callao, where 31 factories (of a total of 85) were in operation [40]. Two years later, the first official census of fishmeal factories carried out by IREMAR reported 110 fishmeal plants operating at 15 different locations. Only three of the 110 factories were situated south of latitude 14° S (southern Peru) but a tendency to decentralize towards the south was observed [43,44]. In 1963, the number of processing plants increased to 149, with eight located south of 14° S. At that time, 15 fishing companies were responsible for 52% of total fishmeal production, of which 11 owned at least two factories in different locations [45].
The El Niño 1965 caused the number of fishmeal factories in operation to decrease from 157 in 1964 to 131 in 1967 [40] but the number increased again to 185 in 1968 [46]. This year, ten out of 63 fishing companies were responsible for 50% of total fishmeal production, and all of them owned at least two factories located in different areas [42]. The largest fishing company, which produced 15.3% of total fishmeal, owned nine fishmeal plants, which were located in the ports of Chicama (07°50′ S), Chimbote (09°05′ S), Supe (10°48′ S), Callao (12°05′ S) and Pisco (13°42′ S) [42].
Thus, unpredictable changes in fishing grounds motivated fishing companies to own more than one fishmeal plant and to locate them strategically at different sites along the coast. The companies recognized that the only long-run protection against poor fishing as a result of anchovy stock movements was to spread the risk by operating plants in two or more zones [40]. The flat Peruvian desert provided spacious building sites for factories and space for huge inventories, which need little or no protection due to the stable arid weather [47]. On the other hand, lack of water supply, electricity, manpower and landing facilities were important factors that limited the expansion [48]. Nevertheless fishmeal plants increased from 27 in 1956 to 171 in 1966, and when the first fishing quota limit of 9.5 million ton of anchovy was set up by the government in 1967, total processing capacity was able to handle 3.8 times the given quota. Excess capacity had clearly become a problem [40]. Since then, overcapacity of the anchovy fleet and processing capacity has been a consistent feature of the anchovy fishery [11,12,46,49].
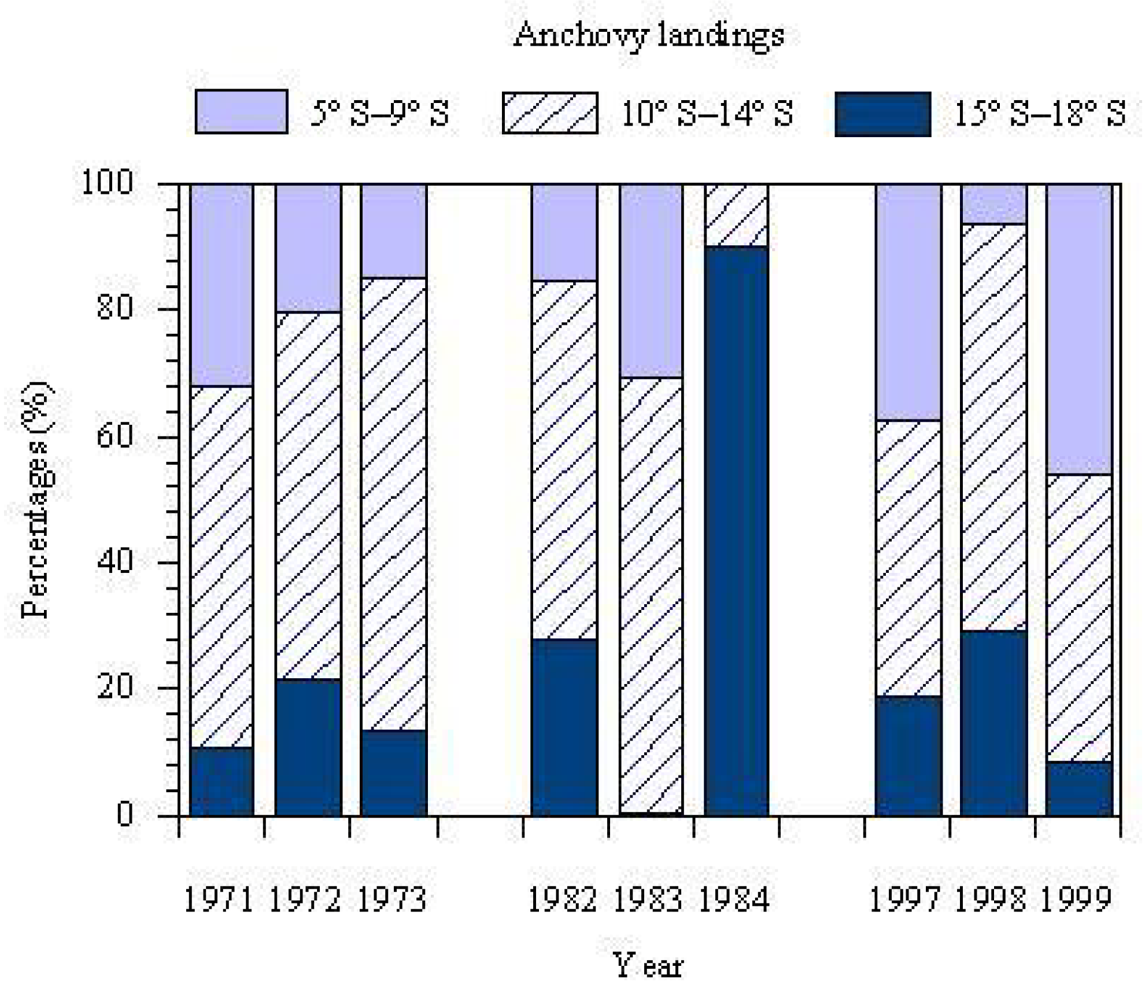
During El Niño 1972–1973, when anchovy availability decreased in the north fishing grounds, the fishery migrated to the south. This was made possible by the availability of fishmeal processing facilities along the entire coast. As shown in Figure 3, landings in the south (1972) and in the center grounds (1973) increased when anchovy moved from their northern fishing grounds. In 1984, anchovy landings in the north of Peru were banned; and 90% of landings were reported in southern Peru. The same pattern was observed in 1998 when 94% of the landings came from south latitude 10° S.
3.1.2. Coping Strategy 2: Simultaneous Ownership of Fishing Fleet and Processing Factories
In response to the high risk element inherent in the availability of fish, anchovy processing companies attempted to achieve greater control over raw material supply by operating their own fishing fleets [40]. This practice of vertical integration also developed during the 1960s and, by 1962, 61% of fishing vessels were fishing to supply fishmeal plants owned by the same company [44]. In 1966, a sample of 51 fishmeal plants processing 60% of the catch revealed that 70% of the anchovy caught were landed by boats belonging to fishmeal plants [40]. An important consideration was the desire to avoid being reliant on independent fishermen. Fishermen could otherwise make life difficult for processing companies by taking a hard line in the negotiation of landed anchovy prices. They could decide to sell their catches to other companies or, even more critically, to migrate away from areas of poor fishing. Roemer [40] states that:
The consensus among plant owners is that they would prefer not to worry about the additional organization and higher fixed costs involved in operating individual fleets. However the independent fishermen have proved unreliable, not always keeping to their contracts and quickly deserting areas of poor fishing. Thus a plant maintains a fleet to guard against low capacity utilization or shut down in case the fishing in its area worsens.
3.1.3. Coping Strategy 3: Low Cost Uploading Facilities
In places where harbor facilities were in bad condition, not sufficient or did not exist at all, which was the case at most of the ports locations, a system of unloading barges known locally as chatas was set up to assist the transport of anchovy from the fishing vessel. A chata consists of a floating platform about 20 m long, which supports a long pipeline that is used to transport the anchovy from a fishing vessel offshore to the factory (Figure 4) The longest pipeline attached to a chata in Peru is 1 km long and was built in Puerto Chicama (07°42′ S), where rough sea conditions are unfavorable for unloading procedures. By 1962, 36% of the fishing vessels used chatas to unload their anchovy catches [44].
3.2. Second Impact: Decrease in Anchovy Biomass and Invasion of Foreign Tropical Species into Anchovy Fishing Grounds
As reported by Ñiquen and Bouchón (2004) [14], a remarkable decrease in anchovy biomass and increase in the biomass of other pelagic species was observed in Peruvian waters during the 1972–1973, 1982–1983, 1997–1998 events. During extreme events, two important anchovy predators migrate deeper into the anchovy area, horse mackerel (Trachurus murphyyi) [22] and jack mackerel (Scomber japonicus) [50]. The biomass of both species in the anchovy habitat more than doubles; at the peak of the 1972 and 1976 El Niño events it increased 3.5-fold [3]. At the same time, sardines (Sardinops sagax) move closer to the coast [51] and seem to do well or even thrive during El Niño events [3].
3.2.1. Coping Strategy 4: Diversification within and beyond Fishmeal Production
As a result of decreases in anchovy biomass, the fishery is forced to diversify its catches to target other pelagic resources like sardine, jack or Pacific mackerel, and long-nose anchovy (Anchoa nasus) [14], and use these foreign species to produce fishmeal.
This behavior was first recorded later than the previous strategies described, during the onset of the extreme event of 1972–1973 (Figure 1b). In 1962, less than 1% of the fishmeal production came from fish species other than anchovy [48]. This percentage did not change until 1973, when landings of other pelagic fish suddenly increased [52] (Table 2). During the El Niño 1972–1973, three million tons of sardines, horse and jack mackerel were reduced to fishmeal to prop up the industry [53].
Between 1980 and 1985, anchovy stocks were at their lowest carrying capacity, the results of a regime shift that turned the ecosystem from an anchovy to a sardine dominated environment [54]. This period lasted from 1970 to 1985, when anchovy landings started to recover, and is linked to an ecosystem dynamic related to the movement of warm subtropical oceanic waters towards or away from the coasts of Peru and Chile [26]. Under these circumstances, a new sardine fishery developed in Peru from 1977 to 1990 with a landing peak of 3.5 million tons of sardines in 1988 [19]. The sardine fishery was only for human consumption and the high percentage of sardine landings during El Niño 1982–1983 (Table 2) is due to this fishery. Following the 1982–1983 El Niño, anchovy landings reached a historical low of 25,000 tons in 1984 (Figure 1a), but there is no evidence that other pelagic species were exploited to maintain the collapsed fishery during this period.
During the extreme 1997–1998 El Niño sardines and mackerels again contributed to sustaining the fishmeal industry (Dioses and Cárdenas, pers. comm.). Sardines were illegally used for fishmeal production in preference to the long-nose anchovy, which is not considered an edible fish in Peru. Higher percentages of mackerel landings from 1999 to the present (Table 2) are a response to the efforts of the government and Peruvian fishing companies to promote diversification towards fishing for the human consumption market.
Thus the strategies of the fishing companies to cope with dramatic resource variability have been to first keep the fishmeal industry supplied with tropical fish species that invade anchovy fishing grounds during extreme El Niño events. Fishmeal production, in contrast to the seafood fishery, does not depend on the abundance of specific species and can opportunistically switch from anchovy to other fish when necessary. Secondly, fishmeal companies will diversify and direct their fishing activities to human consumption target species.
3.3. Third Impact: Management Regulations Rapidly Out-of-Date
From 1965, the management of the anchovy fishery in Peru was based on a system of fishing quotas, closed seasons and other restrictions on fishing effort [12,55,56]. Government management and control is responsibility of the Ministry of Production (PRODUCE) and the Vice-Ministry of Fisheries. Management decisions are taken based on reports from the government' S marine research institute IMARPE, whose institutional objective is to provide scientific support for the sustainable management of marine resources. The government applies two different management schemes for the northern-central and the southern anchovy stock, the latter being exploited simultaneously by Peru and Chile [57].
Between two and four acoustic surveys to assess the abundance and distribution of pelagic fish populations and to estimate the quota or Total Allowable Catch (TAC) for both anchovy stocks have been carried out yearly by IMARPE since 1983 [13]. TACs are calculated from current biomass estimations and draw upon the results of biological monitoring that is carried out at all landing sites [10]. Once the TAC is reached, the Vice-Ministry of Fisheries orders the closure of the fishing season, banning not only anchovy fishing but also fishmeal processing. Fishing of the northern stock is usually divided into two fishing seasons, each with its own quota: a summer season from October to March and a winter season from April to September [12]. In the case of the southern anchovy stock, usually no TAC is applied and the fishing season is open almost all year around. Temporary closures of landing ports, for a minimum of three days, are also imposed when the reported presence of juveniles (<10 cm long) exceeds 10% of total catches [18]. Reports come from daily real-time verification of landings.
A management system of Individual Vessel Quotas (IVQ), locally referred to as Maximum Catch Limits per Vessel (MCLV), was established in July 2008 (Legislative Decree Nr. 1086) and is currently being implemented for both anchovy stocks [6,9].
During extreme El Niño events, routine application of catch quotas and fishing closures is no longer effective and management regulations have to adjust fast to rapidly changing conditions. For example, the El Niño 1997–1998 developed so rapidly that each month from June to December 1997 a new monthly record high was set for SST in the eastern equatorial Pacific [58]. In response to such rapid change in the environment, the management and governance system is forced to mirror the dynamics of the ecosystem and become just as rapid in order to increase the chances of survival of the fishing industry. Two strategies have been developed by the Peruvian fisheries management agencies to deal with such fast changing situations: low cost additional monitoring and flexible fisheries regulations.
3.3.1. Coping Strategy 5: Low Cost Monitoring
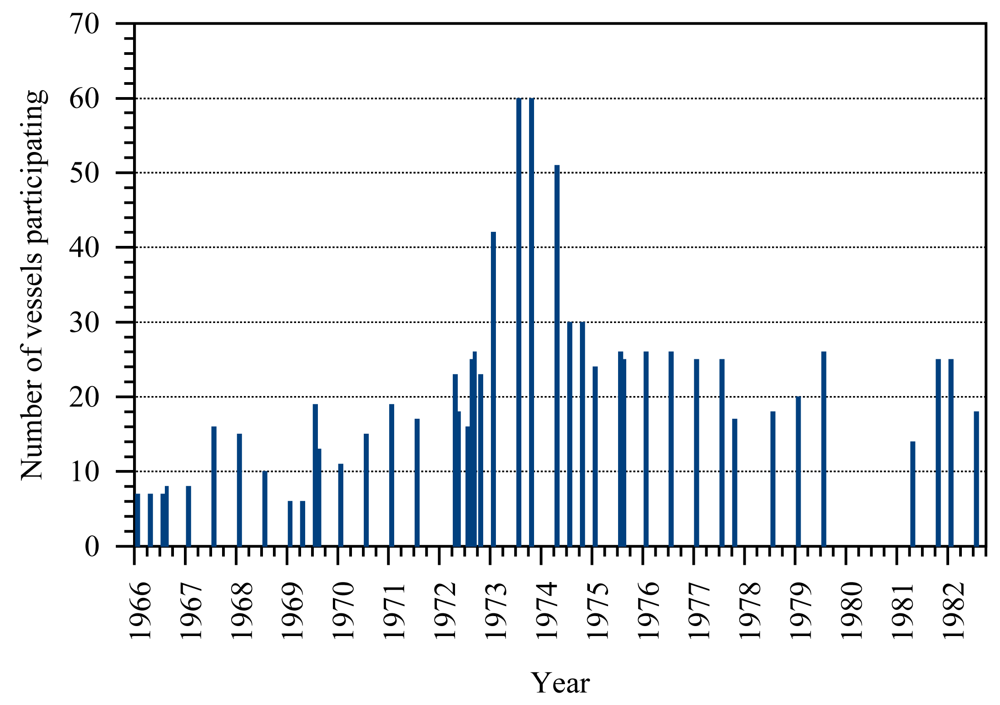
The first strategy developed to cope with rapidly changing conditions at sea was to attain additional monitoring capacity. This was achieved through the establishment of the so-called EUREKA cruises in 1966 [41,59] (Figure 1b). Revenues from taxes imposed on the industry based on the value of landed anchovy are, by law, allocated to directly cover operational and research costs of the Vice-Ministry of Fisheries and IMARPE. When anchovy shoals suddenly decrease, tax collection also falls and is not enough to cover the additional monitoring that is required to determine when fishing can restart. In these circumstances, so-called EUREKA cruises are undertaken. EUREKA cruises are based on legal agreements by which the fishing companies allow IMARPE to use their fleet as scientific platforms in order to monitor biological conditions and anchovy stocks in real time [10]. Scientific and technical personnel from IMARPE are sent to the main fishing ports, from where anchovy vessels set sail simultaneously to perform oceanographic sampling and carry out experimental fishing. Fishing companies that take part are selected from among those entitled to sign an agreement by drawing lots. The costs of these cruises are totally covered by the companies, thus notably reducing not only governmental expenses but also the delays involved in planning and implementing conventional large scale research cruises. The fishing companies involved are allowed to process the anchovy catches obtained from the experimental fishing to recover some of the associated financial costs.
The first EUREKA program was carried out in February 1966, in response to the onset of the mild El Niño event in December 1965. From then until 1982, when the first large acoustical evaluation cruise was undertaken, 59 operations were carried out. As shown in Figure 5, the number of EUREKA cruises increased in frequency during El Niño 1972–1973, as well as the monitoring effort, shown in this case by the number of vessels taking part. Since 1982, monitoring of anchovy stocks and conditions at sea has been carried out by an annual program of acoustic surveys and one ichtyoplankton survey, supplemented by at least two annual oceanographic cruises. However, when necessary EUREKA cruises are still implemented; the most recent one was undertaken in April 2010.
3.3.2. Coping Strategy 6: Rapid Management and Flexible Legal Instruments
Rapid management of the Peruvian anchovy fisheries is a response to the impossibility of calculating a long term optimal catch and the challenge of coping with rapid and unpredictable environmental change. Uncertainty arrives with every El Niño, since no two El Niño events are exactly alike [60] and each El Niño always behaves different from its predecessor. For example, it forms more quickly, or at a different time of the year, and has different impacts on marine species; so researchers and forecasters are surprised once again [61]. “Loose” or flexible management rules are a response to this uncertainty.
Management and control of Peruvian fisheries activities is currently regulated according to the most recent General Fisheries Act of 1992. This law requires that a management plan for each fishery should be applied in accordance with principles of long-term sustainable use and maximum economic and social benefits (Chapter 2, Law Decree 25977). Since the enactment of the most recent Fisheries Act Implementing Regulations in 2001 (Supreme Decree 029-2001-PE), management plans have been established for almost all commercial fisheries. These plans have been implemented for the demersal hake fishery since 2003; the giant squid fishery since 2001; highly migratory tuna-like fishery since 2001 (revised 2003); and even for the pelagic jack and horse mackerel fishery since 2001 (revised 2007). However there is no management plan in operation for the anchovy fishery. This is not accidental or unintended but reflects the intention of the government to avoid the use of legal instruments that could restrict or delay a rapid management decision process. Legally, anchovy is managed under “Provisional Fishing Regimes”, drawn up in accordance with IMARPEs scientific recommendations, and approved by the signature of the Minister of Production.
An example of rapid management of the anchovy fishery is the provisional closure of landing harbors when juveniles account of more than 10% of the catches. According to IMARPE scientists, it takes the government less than two days from the delivery of a report by IMARPE of high juvenile capture rates, to the resulting closure of the port concerned. The legal department of the Vice-Ministry of fisheries draws up the ministerial resolution one day after the arrival of IMARPE' S report; the same day the minister signs it, and the next day the resolution is published in the daily official Peruvian newspaper “El Peruano”. The port is closed on the same day after the publication in the newspaper. According to Chavez et al. (2008) [9]:
Fisheries decisions in Peru are made in quasi real time using the most recent observations. It is probably the only place in the world where this rapidly “adaptive ” management style is possible. Government bureaucracy and slow data analysis usually mean that the management decisions are implemented for yesterday' S conditions and problems.
3.4. Fourth Impact: Uncertain Changes in Fishmeal Prices
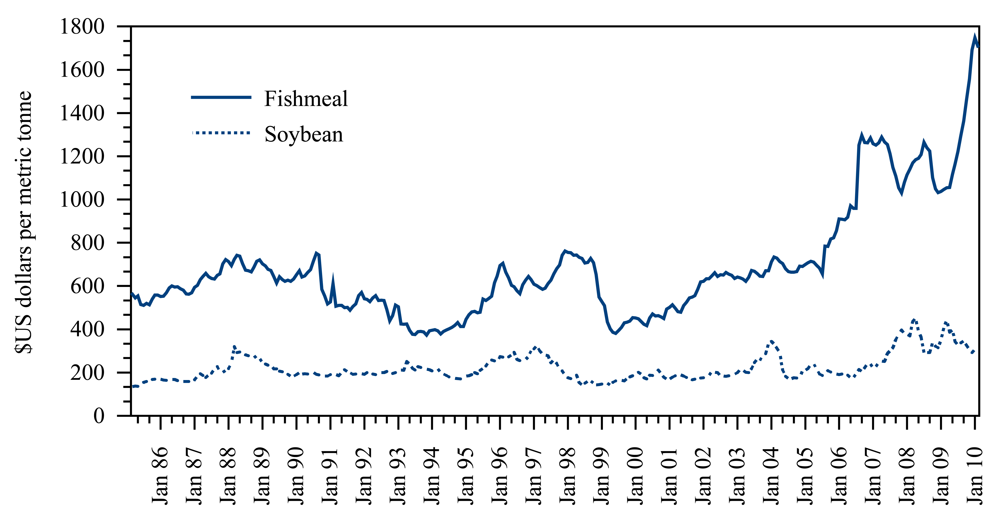
As in all market-based economic activity, commercial fisheries are beset by both supply side and demand side problems [62]. Thus market prices for fishmeal are determined by the interaction of delicately sensitive market demand and supply curves; and have fluctuated violently during the entirely history of the fishery [47]. When due to El Niño events, fishmeal production supply decreases, prices should increase and vice versa. As a result of a drop in catches due to El Niño 1965, fishmeal prices went up from an average price of US$ 108.50 per metric ton in 1964 to US$ 207.50 in early 1965 [47]. Prices then fell as catches increased and oceanographic conditions returned to normal. This scenario changed when prices of other protein feed substitutes like soybean, sunflower, palm kernel, cotton seed, entered the market. The existence of substitute products means that if fishmeal harvesting inefficiencies become excessive and as a result prices increase, fishmeal is replaced by other products from the world protein market [47].
Based on monthly data of fishmeal and soybean prices between 1981 and 1999, it was found that fishmeal and soybean were strong rich protein meal substitutes [63] and that total supply and demand of these two protein meals were determinants of fishmeal prices. Given the vast environmental variability exacerbating the supply side for the anchovy industry, it is not surprising that mechanisms to cope with the demand side were evolved. Fishing companies developed two strategies to cope with unpredictable changes in fishmeal prices.
3.4.1. Coping Strategy 7: Coordinated Fishmeal Supply
In 1960 the problem of excessive supply and subsequently lower prices (fishmeal price fell from US$ 174 to US$ 60 per metric ton) was met by establishing a system of export quotas for each fishing company [40]. This was implemented at a national level by the Peruvian Fisheries Consortium [55,64], which represented at least 80% of fishing companies in Peru and functioned as a sales cooperative; and at an international level by the Fishmeal Exporters Organization (FEO) [40,65]. FEO, an association of the most important fishmeal exporting countries, was responsible for promoting sales of fishmeal, acting as a clearing house for information on fishmeal production and markets and establishing a system of export quotas for participating nations [40]. Increasing demand for fishmeal in the international market some years later led to the abandonment of the quota system [40]. The Consortium' S operation ended in 1970, when the Peruvian government, prior to nationalizing the industry, set up the Empresa Publica de comercialización de Harina y Aceite de Pescado or EPCHAP (State Company for Fishmeal and Fish-oil Marketing) and any unauthorized, independent sale of fishmeal was banned. EPCHAP ceased operations in 1978, leaving fishmeal marketing once again in hands of the producers. FEO is still functioning nowadays under the name of International Fishmeal and Fish-oil Organization, or IFFO.
3.4.2. Coping Strategy 8: Reducing Linkage of Fishmeal Price with Soybean Production
The second measure to combat market price uncertainty by the Peruvian industry was the decoupling of the fishmeal price from dependence on prices of soybean meal. Kristofersson and Andersen [66] found that the historically strong price relationship between fishmeal and soybean meal has weakened since the late 1990s (Figure 6). For these authors, the most likely reason for this change was increased demand for specialty uses of fishmeal, not only from aquaculture but also from the pork and poultry industries. The study however did not take account of the fact that during the 1990s, Peruvian fishmeal producers took the risk of investing in new technologies to improve fishmeal protein quality and digestibility. By offering a better quality product, which could not be substituted with soybean meal, high fishmeal prices would no longer be dependant on soybean crops levels. The period between 1992 and before the onset of the 1997–1998 event, known by the anchovy fishmeal sector as the period of “industrial re-conversion” was characterized by an increase of special high-protein meal production from 40,000 metric tons in 1992 to 366,000 metric tons in 1994 [67]. “Special or high protein fishmeal” is an improved quality fishmeal used to principally supply the aquaculture market. This fishmeal, commercially known as prime meal, super prime meal or LT-94 (low temperature, 94% digestibility), is made from fresh anchovies, and dried using indirect steam or vacuum dryers. It has protein contents between 68% and 72% and digestibility values between 92% and 94%. The name was given to distinguish them from the conventional or standard fishmeal “Fair Average Quality” or FAQ fishmeal, which is dried using hot air and has protein contents between 65% and 67%.
During the same period a decrease in the conversion rate, that is, tons of anchovy needed for the production of one ton of fishmeal, took place. This conversion rate fell from the standard historic average of 5.11 in 1992 to 4.7 in 1996. This change was only possible as a result of private investment in fleet and processing equipment estimated at US$ 400 million between 1991 and 1995 [68]. The investment decision was also taken partly in response to a promising increase in demand for good quality fishmeal from the aquaculture sector, mainly from China.
4. Recent Trends
Anchovy landings collapsed after the El Niño 1972–1973 and reached their lower historical records after the 1982–1983 event, however the fishery recovered rapidly after the extreme event of 1997–1998 (Figure 1a). Several factors contributed to this rapid recovery. On the anchovy stock or resource side, a healthier anchovy population fished much more carefully and under improved management together with appropriate cooler oceanographic conditions reduced the minimal impact of the 1997–1998 extreme event. On the resource users and resource management or governance side [36,37]; the availability of coping strategies developed since the onset of the fishery also played an important role, as discussed bellow:
4.1. Adaptation to Changes in Anchovy Fishing Grounds
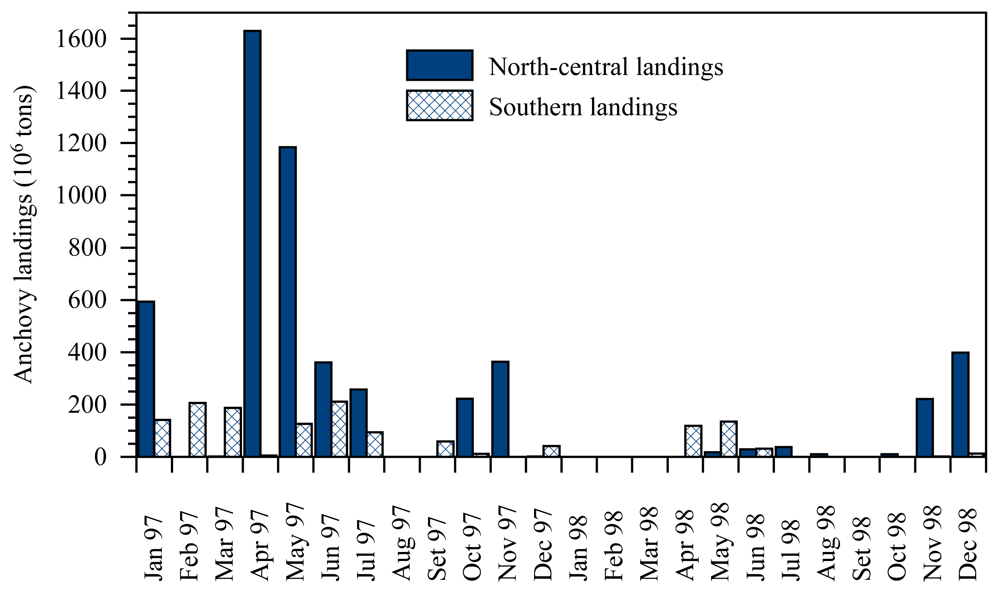
After the 1972–1973 and 1982–1983 El Niño events, the southerly migration by anchovy during the first months following the onset of a strong El Niño episode was recognized as a predictable pattern [35]. El Niño 1997–1998 arrived around March 1997 and low catches of anchovy in the north started to be reported on June (Figure 7). Catches in the north-central area did not recover until the end of the warm SST anomalies in August 1998. During the first semester of 1998 it was only the landings in southern Peru that sustained the fishery; and 70% of the catches were registered south of latitude 14° S. This behavior was largely expected and facilitated by fishing fleet migration and the availability of 10 fishmeal plants located south of latitude 14° S at that time [69].
Recent data indicates that there are currently 142 fishmeal processing plants at 24 locations along the Peruvian coast [70]. In 2008, 40 fishing companies with authorization for fishmeal reduction were officially registered, of which seven were responsible for 68% of total fishmeal production [71]. These most productive companies owned 281 fishing vessels and 72 processing factories equivalent to 54% of total Peruvian fishing vessels holding capacity and 66% of processing capacity, respectively [71]. Each company works with their own chatas. Table 3 shows the currently spatial distribution and reduction capacity of fishmeal factories belonging to the principal fishing companies.
Geographical distribution of fishmeal plants shows a processing power concentration between latitudes 9° S and 11° S and 8% of their processing capacity located south of latitude 14° S. This distribution of processing capacity enables the industry to adapt to drastic changes in distribution of anchovy fishing grounds.
4.2. Adaptation to Changes in Abundances of Fish Stocks
Before 1997, heavy lobbying from the fishmeal industry had given rise to a series of government regulations that allowed the use of sardines for fishmeal reduction, whatever its capture size (Ministerial Resolutions No. 678, 772 and 798-97-PE). However this practice was politically unpopular in a country where human food insecurity is still a problem. In 1998, when Ministerial Resolution 409-98-PE issued permits for sardine fishing, but exclusively for the canning industry, these permits were illegally used to supply the fishmeal industry, concerned by the scarcity of anchovies. A more general ban on the use of edible fish species like sardines and mackerel for fishmeal reduction was introduced in 2002. The ban aims to support the canning industry for local consumption (Supreme Decree 001-2002).
In response to these politically motivated changes, the anchovy industry has two options. Firstly, they can supply their processing plants with other anchovy-like fish species that arrive during ENSO warm events. The use of the long-nose anchovy during 1997–1998 (Table 2) shows that to some extent this is already happening. Secondly, the industry can diversify to reduce its reliance on fishmeal production. Again this process is already underway. During the last decade, the most productive fishing companies in Peru have started to invest in equipment to process canned and frozen fish.
4.3. Adaptation by Improved Monitoring and Flexible Management
The 1982–1983 El Niño focused international attention on the study of the origin, prediction and impacts of the El Niño around the world [61]. During 1997–98, international agencies provided support for research projects by IMARPE, under the umbrella of “El Niño research”. In 2000, the Inter-American Development Bank and the World Bank financed a project to locate four oceanographic buoys to monitor oceanographic conditions along the Peruvian coast; and two Fish Aggregating Devices attached to oceanographic detection equipment. These installations send real-time oceanographic information to El Niño research institutes in Peru. A further project finances the salaries of scientific personnel for the expanded ENSO monitoring program that has been underway since 1998.
During the last decade, the Peruvian government has enforced the law to use revenues from the anchovy fishery to cover the overall costs of fisheries management [72], regardless of the fishery involved. This applies to revenues from the auction of fishing rights for other species to international fishing fleets. These auctions are held when, for example, large biomasses of giant squids or tunas are detected within the Peruvian Economic Exclusive Zone, for which the country does not possess the appropriate fleet and processing facilities. As in the case of the fishmeal production, which is no longer dependent on only one fish species, here again there is opportunistic behavior, in this case by the government management agency. This helps to ensure a steady income to cover fishery management costs, even during periods of drastic environmental change.
At the height of the 1997–1998 El Niño, the number of ministerial resolutions related to quotas and fishing closures in the anchovy fishery recorded its historical peak of 28 [18], reflecting a rapid response in changes in management regulations according to environmental conditions.
4.4. Adaptation to Changes in Fishmeal Prices
When the 1997–1998 El Niño arrived, high-protein fishmeal accounted for 45% of total exports compared to standard fishmeal. Fishmeal prices reached their peak of US$ 700 per metric ton between the end of 1997 and beginning of 1998, a price that had not been recorded since 1973 [73]. Landings after El Niño 1997–1998 recovered rapidly to 7.8 million metric tons in 1999 and 9.9 million metric tons in 2000; and the economic impact on the industry was notable moderate. According to Santivañez and Santivañez (2003) [67], it was the improvement in conversion rate and export price increment of high protein fishmeal that gave the industry capacity to mitigate the economically impact of the last extreme El Niño.
The conversion rate between 2001 and 2005 has been reported to be at 4.45 [74]. In 2008, Peruvian fishing companies placed on the market 625,400 metric tons (44%) of fishmeal quality FAQ and 783,100 metric tons (56%) of high-protein fishmeal [70], and prices have risen their historical records at about US$ 1500 per metric ton. China is the major customer accounting for more than half of total Peruvian fishmeal exports. [75].
4. Conclusions
The development of coping strategies to deal with environmental variability and extreme events in the Peruvian anchovy fishery has been a long and dynamic process with strategies emerging or receding during different phases of the fishery. The process has not been a painless one, and strategies have sometimes led to conflicts between the fishery sector and Peruvian fishery policies. Conflicts in the fishery sector have arisen for instance with governmental attempts to promote fisheries of edible species to improve local fish consumption; or to reduce overcapitalization of fishmeal factories due to both uncontrollable growth of processing capacity and the importance of having the capacity to move south during an El Nino event. In these cases a trade-off between the resource users and the governance subsystems appears to offer a resolution. It will be very difficult for the anchovy fishery to use edible fish for fishmeal production with the arrival of the next El Niño; however, the Peruvian government will probably not interfere with the dilemma of overcapitalization of fishmeal factories.
It is also clear that the strategies presented here have developed to cope with short term perturbations like El Niño and may be less efficient to deal with variability at larger scales of environmental change. For research and policies in the commercial fishery sector, there are however some important lessons to be learned from this experience. The first one concerns the advantages of a “division of labor” in the development of coping strategies to deal with extreme events. Some resources will be more robust or resilient to new environmental conditions. In our case study, anchovy stocks have evolved diverse adaptations to cope with El Niño effects which include opportunistic feeding [76] and migration to coastal, deeper and southern cooler waters [77]. On top of these adaptations, resource users and management authorities have evolved their own coping strategies. Although our list of strategies is most likely not exhaustive, it shows that the process was clearly system-wide, sometimes reactive, sometimes bottom-up; and included high levels of information transfer between the resource, the resource users and the resource management subsystems. New technologies like the investment for high protein fishmeal processing equipment or the use of acoustic equipment to evaluate anchovy populations; and innovative ideas like low cost uploading barges have also played an important role.
Second, fishermen have always adapted to changes in their environment by using their knowledge accumulated through past experiences and have been force to react to surprises. Fishermen' S past experience alone will no longer be a reliable guide to the extent of change predicted by climate change. This case study suggests that it was prior experience of adaptation that prepared the Peruvian fishery to cope relatively successfully with the three extreme events that took within a period of 15 years between each event, forcing the evolution of coping strategies in a relative short period compared with the life-history of the fishery. The strategies continue to diminish the effects of minor events like the 2002–2003 El Niño. However as is commonly stated in Peru: “the only thing we know about El Niño is that sooner or later it is going to come”. The same could be stated for climate change and the only aspect that we can be sure is that it is going to come and we should prepare ourselves for that time. A culture of preparedness is tangible in the Peruvian society and the challenge will be to foster this way of life to prepare societies for climate change.


| Impact | Coping strategy | Implementation |
|---|---|---|
| Changes in the distribution of anchovy shoals | Scatter geographical distribution of fishmeal plants along the coast | Fishery companies |
| Simultaneous ownership of fishing vessels and processing factories | Fishery companies | |
| Low-cost uploading facilities | Fishery companies | |
| Invasion of foreign species into anchovy fishing grounds | Fishmeal production based on invading fish | Fishery companies |
| Management regulations rapidly out-of-date | EUREKA program | Management authorities |
| Rapid and flexible management | Management authorities | |
| Uncertain changes in fishmeal prices | Fishmeal production based on market demand | Fishery companies |
| Reducing price dependence from soybean production | Fishery companies |
| Year | Anchovy | Sardines | Horse mackerel | Jack Mackerel | Long-nose anchovy |
|---|---|---|---|---|---|
| 1969 | 99.9 | 0.0 | 0.0 | 0.1 | 0.0 |
| 1970 | 99.9 | 0.0 | 0.0 | 0.1 | 0.0 |
| 1971 | 99.8 | 0.1 | 0.1 | 0.1 | 0.0 |
| 1972 | 99.2 | 0.1 | 0.4 | 0.2 | 0.0 |
| 1973 | 86.3 | 7.5 | 2.4 | 3.7 | 0.0 |
| 1974 | 93.1 | 1.9 | 3.4 | 1.6 | 0.0 |
| 1980 | 30.2 | 62.1 | 5.2 | 2.5 | 0.0 |
| 1981 | 47.5 | 49.8 | 1.5 | 1.3 | 0.0 |
| 1982 | 52.1 | 45.7 | 1.5 | 0.7 | 0.0 |
| 1983 | 9.4 | 82.8 | 6.1 | 1.8 | 0.0 |
| 1984 | 0.8 | 90.4 | 6.0 | 2.8 | 0.0 |
| 1985 | 19.9 | 76.7 | 2.0 | 1.4 | 0.0 |
| 1996 | 83.3 | 11.6 | 4.2 | 0.6 | 0.3 |
| 1997 | 80.9 | 11.1 | 5.3 | 2.5 | 0.2 |
| 1998 | 30.7 | 36.9 | 9.5 | 11.5 | 11.5 |
| 1999 | 88.9 | 4.4 | 1.1 | 5.2 | 0.4 |
| 2000 | 94.8 | 1.5 | 2.5 | 1.1 | 0.1 |
| 2001 | 83.8 | 0.6 | 10.7 | 4.3 | 0.5 |
| Latitude | Tecnologia de Alimentos S.A. | Corporation Inca S.A. | Pesquera Exalmar S.A. | CFG Investment S.A.C. | Pesquera Diamante | Pesquera Hayduk | Austral Group S.A. | Total percentage (%) |
|---|---|---|---|---|---|---|---|---|
| 5° S | 150 | 170 | 70 | 138 | 528 (9%) | |||
| 6° S | ||||||||
| 7° S | 352 | 259 | 60 | 80 | 180 | 931 (15%) | ||
| 8° S | ||||||||
| 9° S | 374 | 407 | 90 | 164 | 125 | 100 | 80 | 1,340 (22%) |
| 10° S | 80 | 142 | 76 | 80 | 60 | 113 | 551 (9%) | |
| 11° S | 391 | 80 | 134 | 80 | 202 | 120 | 100 | 1,107 (18%) |
| 12° S | ||||||||
| 13° S | 249 | 100 | 40 | 178 | 80 | 120 | 767 (13%) | |
| 14° S | ||||||||
| 15° S | 140 | 140 (2%) | ||||||
| 16° S | 141 | 145 | 80 | 366 (6%) | ||||
| 17° S | 131 | 90 | 78 | 100 | 399 (7%) |
Acknowledgments
We would like to acknowledge the program “Global Change in the marine realm” (GLOMAR) of the Bremen International Graduate School for Marine Sciences at the University of Bremen, to kindly provide the financial support to carry out the interviews and documentary analysis involved in the present research. In Peru, invaluable support was received from Mariano Gutierrez, Federico Iriarte and Benito Rossi from the Peruvian anchovy fishing industry, Richard Inurritegui from the Sociedad Nacional de Pesqueria (SNP), Marco Espino from the Vice-Ministry of Fisheries and Godofredo Cañote and Renato Guevara from the Instituto del Mar del Peru. We thank also Michael Flitner for his overall supervision and comments and Andrew Halliday for his many significant improvements to our manuscript. The authors would also like to acknowledge two anonymous reviewers for their valuable comments on the last version of the manuscript.
Annex 1
List of interviewees:
From The Vice-Ministry of Fisheries
Director General de Extracción y Procesamiento Pesquero
Subdirector de Consumo Humano
Subdirector de Consumo Humano Indirecto
Jefe de Oficina de Base de Datos
Ex-director General de Extracción y Procesamiento Pesquero
Director General de Seguimiento Control y Vigilancia
Director de Inspección y Fiscalización
Director de Seguimiento, Vigilancia y Sanciones
Jefe oficina de Sistema de Seguimiento Satelital
Asesor Programa de Control y Vigilancia para la Pesca Marítima
From the Instituto del Mar del Perú (IMARPE)
Director Ejecutivo
Asesor Director Ejecutivo
Director Científico
Asesor Director Científico
Director de Investigaciones de Recursos Pelágicos, Neríticos y Oceánicos
Jefe de Unidad de Investigaciones en Recursos Transzonales y Altamente Migratorios
Jefe de Unidad de Investigaciones en Dinámica de Poblaciones
Jefe de Laboratories Costeros
From the fishing private sector
Gerente General de la Sociedad Nacional de Pesquería (SNP)
Jefe de la Oficina de Economía y Estadística Pesquera (SNP)
Jefe de Oficina de Asuntos Ambientales (SNP)
Representante de la SNP en Consejo Directivo del IMARPE
Ex-gerente de PESCA PERU
Director de Flota y Abastecimiento – Pesquera Hayduk S.A.
Director de Investigación, Planificación y Desarrollo – Pesquera Diamante S.A.
Jefe del Departamento de Flota – CFG Investment S.A.C.
Departamento de Flota - Pesquera Austral
References and Notes
- FAO. The State of the World Fisheries and Aquaculture 2010; FAO Fisheries and Aquaculture Department: Rome, Italy, 2010; p. 197. [Google Scholar]
- Laevastu, T. Marine Climate, Weather and Fisheries; Blackwell Scientific Publications Ltd.: London, UK, 1993. [Google Scholar]
- Lehodey, P.; Alheit, J.; Barange, M.; Baumgartner, T.; Beaugrand, G.; Drinkwater, K.; Fromentin, J.M.; Hare, S.R.; Ottersen, G.; Perry, R.I.; et al. Climate Variability, Fish, and Fisheries. J. Clim. 2006, 19, 5009–5030. [Google Scholar]
- Rozwadowski, H. Science, the sea, and marine resource management: Researching the international council for the exploration of the sea. Public Hist. 2004, 26, 41–64. [Google Scholar]
- FAO. The State of the World Fisheries and Aquaculture 2008; FAO Fisheries and Aquaculture Department: Rome, Italy, 2009; p. 176. [Google Scholar]
- Aranda, M. Developments on fisheries management in Peru: The new individual vessel quota system for the anchoveta fishery. Fish. Res. 2009, 96, 308–312. [Google Scholar]
- Bakun, A.; Weeks, S.J. The marine ecosystem off Peru: What are the secrets of its fishery productivity and what might its future hold? Prog. Oceanogr. 2008, 79, 290–299. [Google Scholar]
- Heileman, S.; Guevara-Carrasco, R.; Chavez, F.P.; Bertrand, A.; Soldi, H. XVII-56 Humboldt Current: LM#13. In The UNEP Large Marine Ecosystem Report: A Perspective on Changing Conditions in LMEs of the World' S Regional Seas; Sherman, K., Hempel, G., Eds.; UNEP Regional Seas Report and Studies, United Nation Environment Programme: Nairobi, Kenya, 2009; pp. 749–762. [Google Scholar]
- Chavez, F.P.; Bertrand, A.; Guevara-Carrasco, R.; Soler, P.; Csirke, J. The northern humboldt current system: Brief history, present status and a view towards the future. Prog. Oceanogr. 2008, 79, 95–105. [Google Scholar]
- Barange, M.; Bernal, M.; Cergole, M.C.; Cubillos, L.A.; Daskalov, G.M.; de Moor, C.L.; De Oliveira, M.; Dickey-Collas, D. Currents Trends in the Assessment and Management of Stocks. In Climate Change and Small Pelagic Fish; Checkley, D.J., Alheit, J., Oozeki, Y., Roy, C., Eds.; Cambridge University Press: Cambridge, UK, 2009; pp. 191–255. [Google Scholar]
- Aranda, M. Evolution and state of the art of fishing capacity management in Peru: The case of the anchoveta fishery. Pan-Am. J. Aquat. Sci. 2009, 4, 146–153. [Google Scholar]
- Fréon, P.; Bouchon, M.; Mullon, C.; García, C.; Ñiquen, M. Interdecadal variability of anchoveta abundance and overcapacity of the fishery in Peru. Prog. Oceanogr. 2008, 79, 401–412. [Google Scholar]
- Bertrand, S.; Díaz, E.; Lengaigne, M. Patterns in the spatial distribution of Peruvian anchovy (Engraulis ringens) revealed by spatially explicit fishing data. Prog. Oceanogr. 2008, 79, 379–389. [Google Scholar]
- Ñiquen, M.; Bouchon, M. Impact of El Niño events on pelagic fisheries in Peruvian waters. Deep-Sea Res. Part II 2004, 51, 563–574. [Google Scholar]
- Alheit, J.; Hagen, E. The Effect of Climatic Variation on Pelagic Fish and Fisheries. In History and Climate. Memories of the Future? Jones, P.D., Ogilvie, A.E.J., Davies, T.D., Briffa, K.R., Eds.; Kluwer Academic/Plenum Publishers: New York, NY, USA, 2001; pp. 247–265. [Google Scholar]
- Checkley, D.J.; Bakun, A.; Barange, M.; Castro, L.R.; Freón, P.; Guevara-Carrasco, R.; Herrick, S.F.; NacGall, A.D.J.; Osmer, R.; Oozeki, Y. Synthesis and Perspective. In Climate Change and Small Pelagic Fish; Checkley, D.J., Alheit, J., Oozeki, Y., Roy, C., Eds.; Cambridge University Press: Cambridge, UK, 2009; pp. 344–351. [Google Scholar]
- Wolff, M.; Wosnitza-Mendo, C.; Mendo, J. The Humbold Current Upwelling System-Trends in Exploitation, Protection and Research. In Large Marine Ecosystems of the World—Trends in Exploitation, Protection and Research; Hempel, G., Sherman, K., Eds.; Elsevier Science: Amsterdam, The Netherlands, 2003; pp. 279–309. [Google Scholar]
- Arias Schreiber, M. The evolution of legal instruments and the sustainability of the Peruvian anchovy fishery. Mar. Policy 2011. [Google Scholar] [CrossRef]
- Csirke, J.; Guevara-Carrasco, R.; Cárdenas, G.; Ñiquen, M.; Chipollini, A. Situatión de los recursos anchoveta (Engraulis ringens) y sardina (Sardinops sagax) a principios de 1994 y perspectivas para la pesca en el Perú, con particular referencia a las regiones norte y centro de la costa peruana. Bol. Inst. Mar. Perú 1996, 15, 1–23. [Google Scholar]
- Jin, F.F. An equatorial ocean recharge paradigm for ENSO. Part II: A stripped-down coupled model. J. Atmos. Sci. 1997, 54, 830–847. [Google Scholar]
- Pidwirny, M.; Vranes, K. El Niño, La Niña and the Southern Oscillation. In Encyclopedia of Earth; Cleveland, C.J., Ed.; Environmental Information Coalition, National Council for Science and the Environment: Washington, DC, USA, 2010. [Google Scholar]
- Laws, E.A. El Niño and the Peruvian Anchoveta; Sausalito, University Science Books: Sausalito, CA, USA, 1997. [Google Scholar]
- Galanti, E.; Tziperman, E.; Harrison, M.; Rosati, A.; Sirkes, Z. A study of ENSO prediction using a hybrid coupled model and the adjoin method for data assimilation. Mon. Weather Rev. 2003, 131, 2748–2764. [Google Scholar]
- Morss, R.E.; Battisti, D.S. Designing efficient observing networks for ENSO prediction. J. Clim. 2004, 17, 3074–3089. [Google Scholar]
- Mazzarella, A.; Giuliacci, A. The El Niño events: Their classification and scale-invariance laws. Ann. Geophys. 2010, 52, 517–522. [Google Scholar]
- Alheit, J.; Ñiquen, M. Regime shifts in the humboldt current ecosystem. Prog. Oceanogr. 2004, 60, 201–222. [Google Scholar]
- Collins, M. El Niño- or La Niña-like climate change? Clim. Dyn. 2005, 24, 89–104. [Google Scholar]
- Fedorov, A.V.; Philander, S.G. Is El Niño changing? Science 2000, 288, 1997–2002. [Google Scholar]
- Merryfield, W.J. Changes to ENSO under CO2 doubling in a multimodel ensemble. J. Clim. 2006, 19, 4009–4027. [Google Scholar]
- Timmermann, A.; Oberhuber, J.; Bacher, A.; Each, M.; Latif, M.; Roeckner, E. ENSO response to greenhouse warming. Nature 1999, 398, 694–697. [Google Scholar]
- Trenberth, K.E.; Hoar, T.J. El Niño and climate change. Geophys. Res. Lett. 1997, 24, 3057–3060. [Google Scholar]
- Zhang, Q.; Guan, Y.; Yang, H. ENSO amplitude change in observation and coupled models. Adv. Atmos. Sci. 2008, 25, 361–366. [Google Scholar]
- Gergis, J.; Fowler, A. A history of ENSO events since A.D. 1525: Implications for future climate change. Clim. Change 2009, 92, 343–387. [Google Scholar]
- Clarke, G.K.C.; Le Treut, H.; Lindzen, R.S.; Meleshko, V.P.; Mugara, R.K.; Palmer, T.N.; Pierrehumbert, R.T.; Sellers, P.J.; Trenberth, K.E.; Willebrand, J. Physical Climate Processes and Feedbacks. In Climate Change 2001: The Scientific Basis. Contribution of Working Group I to the Third Assessment Report of the Intergovernmental Panel on Climate Change; Houghton, J.T., Ding, Y., Griggs, D.J., Noguer, M., van der Linden, P.J., Dai, X., Maskell, K., Johnson, C.A., Eds.; Cambridge University Press: Cambridge, UK, 2001; pp. 663–745. [Google Scholar]
- Checkley, D.J.; Ayón, P.; Baumgartner, T.; Bernal, M.; Coetzee, J.C.; Emmett, R.; Guevara-Carrasco, R.; Hutchings, L.; Ibaibarriaga, L.; Nakata, H. Habitats. In Climate Change and Small Pelagic Fish; Checkley, D.J., Alheit, J., Oozeki, Y., Roy, C., Eds.; Cambridge University Press: Cambridge, UK, 2009; pp. 12–44. [Google Scholar]
- Defeo, O.; McClanahan, T.R.; Castilla, J.C. A Brief History of Fisheries Management with Emphasis on Societal Participatory Roles. In Fisheries Management—Progress towards Sustainability; McClanahan, T.R., Castilla, J.C., Eds.; Blackwell Publishing Ltd.: Oxford, UK, 2007; pp. 3–21. [Google Scholar]
- Ostrom, E. Sustainable Social-Ecological Systems: An Impossibility? Presented at the Annual Meetings of the American Association for the Advancement of Science “Science and Technology for Sustainable Well-Being”, San Francisco, CA, USA, 15 February 2007.
- Gulland, J.A. Peruvian anchoveta -- optimal management. Mar. Policy 1980, 4, 78–79. [Google Scholar]
- Doucet, W.F.; Saetersdal, G.; Vásquez, I. La pesca de anchoveta—Estadística de Pescay esfuerzo en Enero, Febrero y Marzo de 1962; Instituto de Investigatión de los Recursos Marinos: Callao, Peru, 1962; p. 9. [Google Scholar]
- Roemer, M. Fishing for Growth, Export Led Development in Peru, 1950–1967; Harvard University Press: Cambridge, MA, USA, 1970. [Google Scholar]
- Clark, G.W. The lessons of the Peruvian anchoveta fishery. CA Coop. Ocean Fish. Invest. Rep. 1976, XIX, 57–63. [Google Scholar]
- Abramovich, J. La Industria PESQUERA en el Perú: Génesis, Apogeo y Crisis; Imprenta La Popular S.A.: Lima, Perú, 1973. [Google Scholar]
- Tilic, I. La Ubicación de la Industria Peruana de Harina de Pescado; Instituto de Investigaciones de Recursos Marinos: Callao, Perú, 1962; p. 20. [Google Scholar]
- Tilic, I. Material Estadístico Sobre la Industria de Harina de Pescado; Instituto de Investigación de los Recursos marinos: Callao, Perú, 1963; p. 51. [Google Scholar]
- Anonymous. Los 15 grandes de la anchoveta. Pesca 1965, X, 19–20. [Google Scholar]
- Jordán, R. La anchoveta y su captura frente a las costas del Perú. Monografías Biológicas 1982, 2, 51–63. [Google Scholar]
- Paulik, G. Anchovies, Birds, and Fishermen in the Peru Current. In Resource Management and Environmental Uncertainty: Lessons from Coastal Upwelling Fisheries; Glantz, M.H., Thompson, J.D., Eds.; John Wiley and Sons: New York, NY, USA, 1981; pp. 35–80. [Google Scholar]
- Arnesen, E.; Sánchez, J. Anílisis Técnico de la Harina y Aceite de Pescado en el Perú; Instituto de Investigación de los Recursos Marinos: Callao, Lima, 1963; p. 31. [Google Scholar]
- Thorp, R.; Bertran, G. Perú: 1890-1977. Crecimiento y Políticas en una Economía Abierta; Columbia University Press: New York, NY, USA, 1978. [Google Scholar]
- Muck, P.; Sánchez, G. The Importance of Mackerel and Horse Mackerel Predation for the Peruvian Anchoveta Stock (a Population and Feeding Model). In The Peruvian anchoveta and its Upwelling Ecosystem: Three Decades of Change; Pauly, D., Tsukayama, I., Eds.; International Center for Living Aquatic Resources Management: Manila, Philippines, 1987; pp. 276–293. [Google Scholar]
- Yanez, E.; Barbieri, M.A.; Silva, C.; Nieto, K.; Espindola, F. Climate variability and pelagic fisheries in northern Chile. Prog. Oceanogr. 2001, 49, 581–596. [Google Scholar]
- Agüero, M. Bioeconomic Model of the Peruvian Pelagic Fishery. In The Peruvian Anchoveta and its Upwelling Ecosystem: Three Decades of Change; Pauly, D., Tsukayama, I., Eds.; International Center for Living Aquatic Resources Management: Manila, Philippines, 1987; pp. 307–324. [Google Scholar]
- Guillén, O.; Callienes, R. Biological Productivity and El Niño. In Resource Management and Environmental Uncertainty: Lessons from Coastal Upwelling Fisheries; Glantz, M.H., Thompson, J. D., Eds.; John Wiley and Sons: New York, NY, USA, 1981; pp. 255–284. [Google Scholar]
- Chavez, F.P.; Ryan, J.; Lluch-Cota, S.E.; Ñiquen, C.M. From anchovies to sardines and back: Multidecadal change in the Pacific Ocean. Science 2003, 299, 217–221. [Google Scholar]
- Bartholomew, D.M. Peru leads the fishmeal market. J. Am. Oil Chem. Soc. 1970, 47, 568–572. [Google Scholar]
- Ñiquen, M.; Bouchon, M.; Cahuín, S.; Diaz, E. Pesquería de anchoveta en el mar Peruano. 1950-1999. Bol. Inst. Mar. Perú 2000, 19, 117–123. [Google Scholar]
- Agüero, M.; Gonzalez, E. Managing Transboundary Stocks off Small Pelagic Fish. Problems and Options; World Bank Discussion Paper No. 329; Wold Bank: Washington, DC, USA, 1996. [Google Scholar]
- McPhaden, M.J. Genesis and evolution of the 1997–98 El Niño. Science 1999, 283, 950–954. [Google Scholar]
- Villanueva, R. The Peruvian EUREKA Programme, Rapid Acoustic Surveys Using Fishing Vessels. Proceedings of Technical Conference on Fish Finding, Purse Seining and Aimed Trawling, Reykjavik, Iceland, 24–30 May 1970; FAO, FII: F70/5. p. 12.
- McPhaden, M.J. Evolution of the 2002/03 El Niño. Bull. Am. Meteorol. Soc. 2004, 85, 677–695. [Google Scholar]
- Glantz, M.H. Currents of Change: Impacts of El Niño and La Niña on Climate and Society, 2nd ed.; Cambridge University Press: Cambridge, UK, 2001. [Google Scholar]
- Pontecorvo, G. ENSO, Regime Shifts, the Peruvian Anchoveta Catch: Some Preliminary Observations Microbehavior and Macroresults. Proceedings of Tenth Biennial Conference of the International Institute of Fisheries Economics and Trade, Corvallis, OR, USA, 10–14 July 2000.
- Asche, F.; Tveteras, S. On the relationship between aquaculture and reduction fisheries. J. Agric. Econ. 2004, 55, 245–265. [Google Scholar]
- Smetherman, B.B. Peruvian Fisheries: Conservation and development. Econ. Dev. Cult. Change 1973, 21, 338–351. [Google Scholar]
- Anonymous. Triunfó la anchoveta en Paris. Pesca 1960, I, 29–30. [Google Scholar]
- Kristofersson, D.; Anderson, J.L. Is there a relationship between fisheries and farming? Interdependence of fisheries, animal production and aquaculture. Mar. Policy 2006, 30, 721–725. [Google Scholar]
- Santivañez, F.; Santivañez, F. La Apuesta por el Perú: Reconversión Industrial del Sector. In El libro de oro de la Pesquería Peruana; Trillo, P., Ed.; Biblios S.A.: Lima, Peru, 2003; pp. 159–207. [Google Scholar]
- Thorpe, A.; Ibarra, A.A.; Reid, C. The new economic model and marine fisheries development in Latin America. World Dev. 2000, 28, 1689–1702. [Google Scholar]
- Anonymous. Plantas de harina de pescado (t/h). Pesca 1998, 64, 14–17. [Google Scholar]
- Pesquería, S.N.D. SNP Memoria Anual 2008; Lito Offset Samamé S.A.: Lima, Perú, 2009. [Google Scholar]
- Bendezú, S. Concentratión de la propiedad de la flota y de plantas de harina de pescado en el Perú. Pesca 2008, 95, 4–9. [Google Scholar]
- Ibarra, A.A.; Reid, C.; Thorpe, A. The Political Economy of Marine Fisheries Development in Peru, Chile and Mexico. J. Latin Am. Stud. 2000, 32, 503–527. [Google Scholar]
- Huapaya, A. Los precios de la harina de pescado: Ene.-Dic. 1998. Pesca 1998, 64, 14–15. [Google Scholar]
- Péron, G.; François Mittaine, J.; Le Gallic, B. Where do fishmeal and fish oil products come from? An analysis of the conversion ratios in the global fishmeal industry. Mar. Policy 34, 815–820.
- Boisset, K.; Lem, A.; Sabatini, P. Fishmeal—Weaker Demand Puts Downward Pressure on Prices. In Globefish Highlights; FAO: Rome, Italy, 2010; pp. 41–42. [Google Scholar]
- Espinoza, P.; Bertrand, A. Revisiting Peruvian anchovy (Engraulis ringens) trophodynamics provides a new vision of the Humboldt Current system. Prog. Oceanogr. 2008, 79, 215–227. [Google Scholar]
- Ganoza, F.; Castillo, P.; Marín, D. Variaciones estacionales en la distribución y biomasa de anchoveta entre 1983 y 2000. Bol. Inst. Mar. Perú 2000, 19, 157–178. [Google Scholar]
- Conflict of Interest: The authors declare no conflict of interest.
© 2011 by the authors; licensee MDPI, Basel, Switzerland. This article is an open access article distributed under the terms and conditions of the Creative Commons Attribution license (http://creativecommons.org/licenses/by/3.0/).
Share and Cite
Arias Schreiber, M.; Ñiquen, M.; Bouchon, M. Coping Strategies to Deal with Environmental Variability and Extreme Climatic Events in the Peruvian Anchovy Fishery. Sustainability 2011, 3, 823-846. https://doi.org/10.3390/su3060823
Arias Schreiber M, Ñiquen M, Bouchon M. Coping Strategies to Deal with Environmental Variability and Extreme Climatic Events in the Peruvian Anchovy Fishery. Sustainability. 2011; 3(6):823-846. https://doi.org/10.3390/su3060823
Chicago/Turabian StyleArias Schreiber, Milena, Miguel Ñiquen, and Marilú Bouchon. 2011. "Coping Strategies to Deal with Environmental Variability and Extreme Climatic Events in the Peruvian Anchovy Fishery" Sustainability 3, no. 6: 823-846. https://doi.org/10.3390/su3060823