Analysis on Energy Consumption and Indoor Environment in Kunming, China

Graduate School of Engineering, Tohoku University, Aoba 6-6-11-1201, Sendai 980-8579, Japan
*
Author to whom correspondence should be addressed.
Sustainability 2012, 4(10), 2574-2585; https://doi.org/10.3390/su4102574
Submission received: 29 August 2012
/
Revised: 28 September 2012
/
Accepted: 1 October 2012
/
Published: 8 October 2012
Abstract
:The purposes of this study are to investigate and analyze the actual conditions of the urban residential energy consumption, and hence to ascertain what will be the important factors that influence the annual energy consumption in Kunming, which has a mild climate. The questionnaire surveys reveal building characteristics, housing appliances, household characteristics, indoor thermal environment and aspects of life style, during winter and summer seasons. The questionnaire analyses show that only 5% of the investigated households have air conditioning, and 12% have heating appliances. Most households use solar energy as a water heater energy source because the sunshine hours in Kunming are long. The energy consumption analyses show that the average annual energy consumption of households in Kunming reached 12.2 GJ, and cooking accounted for 5.3 GJ, which is the largest part. Most of the time in summer, the outdoor temperature is lower than living room and bedroom temperatures; thus, natural ventilation is a useful cooling method for households in Kunming. The absolute humidity in summer is about 11 g/kg, while in winter it is about 5 g/kg. The influence factor analyses show that building construction year, water heater type and annual income are important influential factors on annual energy consumption.
1. Introduction
The energy consumption of China has been increasing rapidly due to the recent economic growth and development. This leads to serious environmental problems such as air pollution and acid rains. The residential sector of China consumed 318.9 million tons of standard coal in 2008 [1]. The residential energy consumption would be more than double by 2020, from 6.6 EJ in 2000 to 15.9 EJ in 2020 [2]. In order to achieve a good balance among energy consumption, natural environment and economic development, it is very important to know the actual situation regarding energy consumption and its influential factors, indoor environment and usage of household appliances, so as to estimate the future trend of residential energy consumption and indoor environment requirement, as well as the possibilities and the strategies of energy saving in China.
Some researchers have made investigations to master the actuality of residential energy consumption in China. Yu et al. made a large-scale questionnaire and simulation in the northeast, middle and east of China. They generated an equation to calculate the energy used for district heating of households in Shenyang, Dalian, Beijing and Luoyang [3]. Chen et al. analyzed the energy consumption in summer and the influence factors in seven cities. They described the characteristics of energy consumption in summer, and revealed the important factors influencing energy consumption in summer [4]. However, research on characteristics of annual energy consumption and their influential factors, and indoor environment in moderate climate zone is lacking. For the above-mentioned reason, an investigation is deemed to be necessary in order to obtain meaningful as well as useful results for preparing programs to minimize energy in a moderate climate zone. This research not only analyzed the annual energy consumption characteristics in residential sector, but also revealed the correlated influential factors on energy use. No such research has been reported before. This study aims to understand residential energy use characteristics in a year and their influential factors of moderate climate zones in China.
2. Outline of the Survey
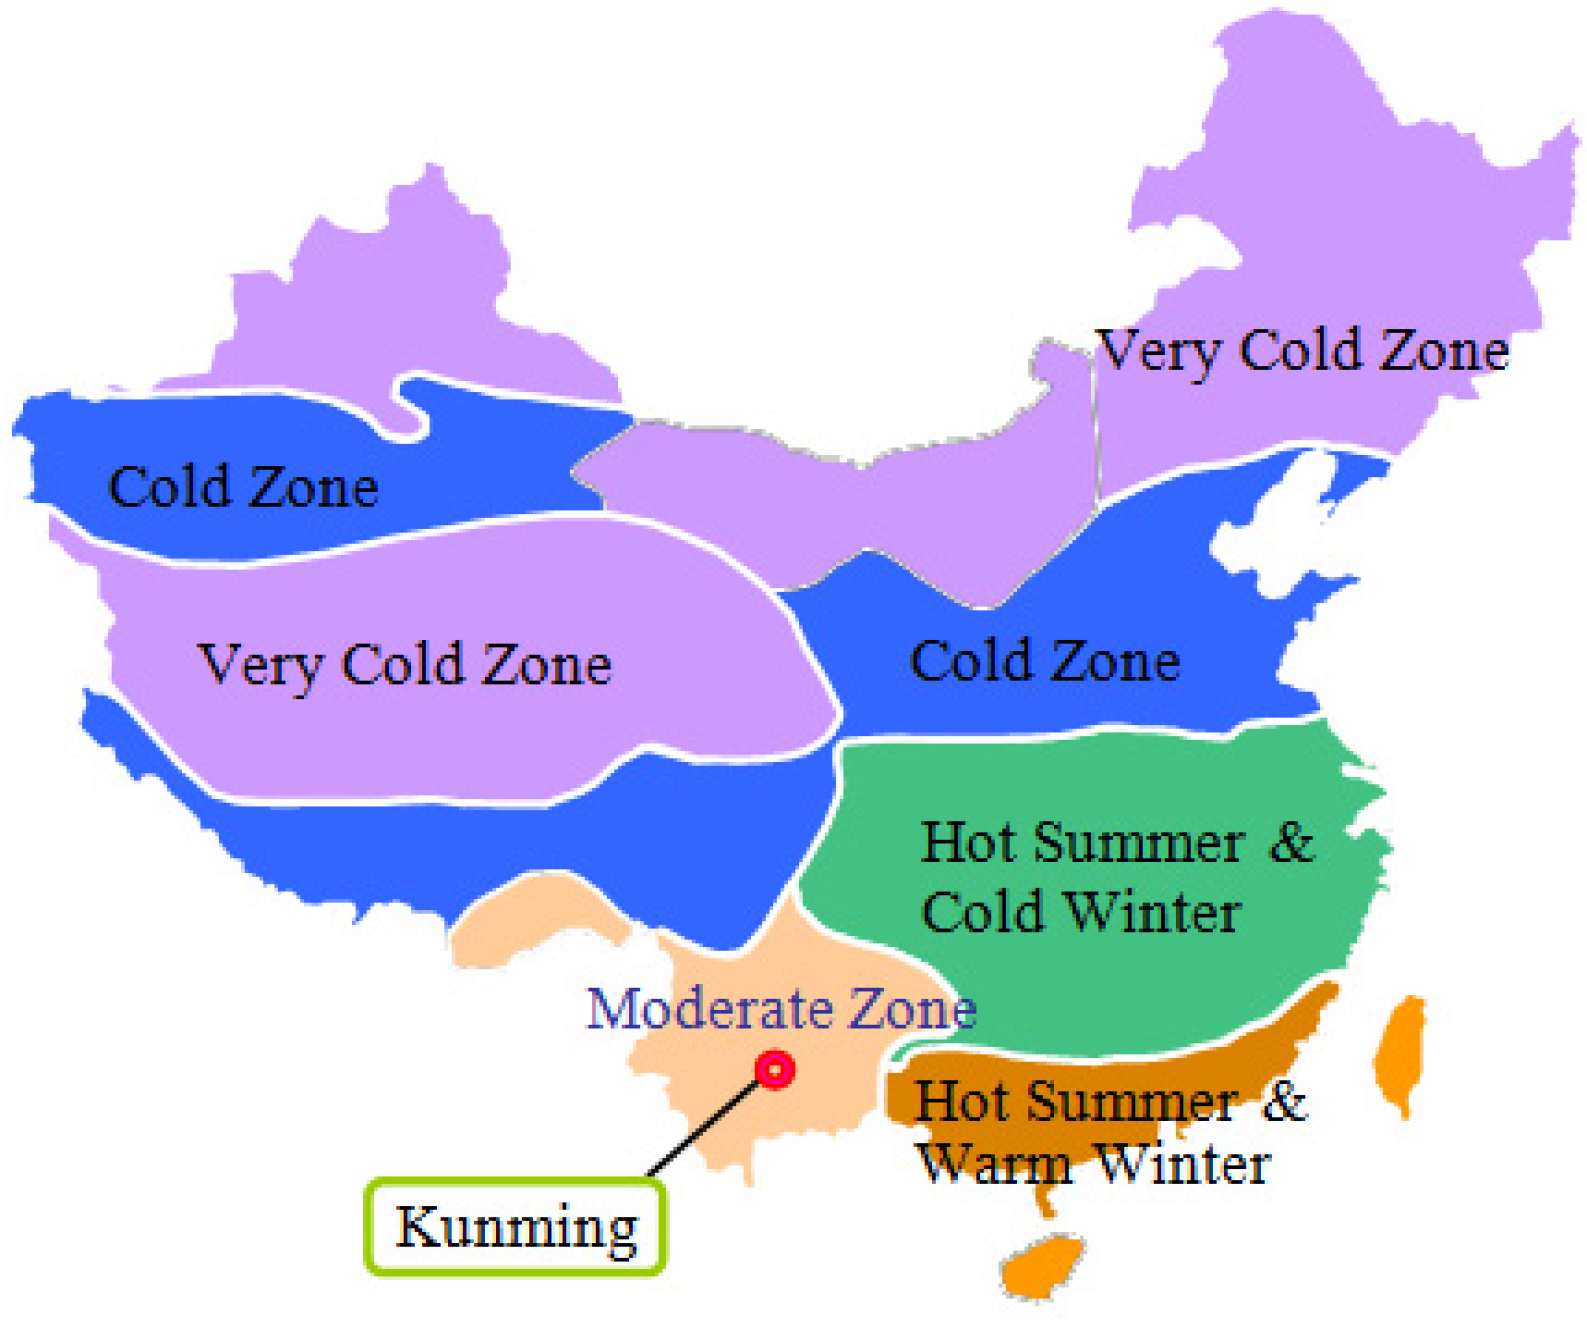
The survey is conducted in the urban areas of Kunming. Figure 1 shows the location of city. Kunming is located in the moderate climate zone of China. The investigated city is a major city in the moderate climate zone of China [5].
Figure 1.
Location of the investigated cities.
This study was done using a questionnaire survey. The questionnaires were distributed as well as collected through the cooperative researchers in a local university. A total number of 90 families (in 90 buildings) living in urban area were selected by the researchers. Table 1 lists the investigation date, and number of the distributed questionnaire, feedback and meter readings. Each family is asked to answer a questionnaire for the summer and winter seasons, including basic information related to the characteristics of their building, heating & cooling periods, daily operation time, usage of heating & cooling appliances, number of occupants, annual income and thermal sensation as shown in Table 2. In addition, the monthly consumptions of electricity & gas and of each family in a year are collected by the meter readings, and field measurement data of humidity & temperature in a year are obtained by small sensors with a data logger.

| Climate zone | Survey period | Distributed questionnaires | Feedbacks (summer/winter) | Meter reading |
|---|---|---|---|---|
| Moderate zone | 2008/10–2009/9 | 90 | 84/80 | 74 |
| Item | Contents |
|---|---|
| Building characteristic | Construction year, structure, floor areas, window |
| Housing appliance | Heating & cooling system, appliance of hot-water supply |
| Family characteristic | Number of occupants, annual income |
| Life style | Heating & cooling period, heating & cooling time, number of staying persons |
| Satisfaction rating | Satisfaction of environment and indoor environment |
| Energy consumption | Electricity & gas consumption, satisfaction of energy costs |
The families are taken as samples, and all the items in the questionnaire are taken as variables. For the processing methods for the missing data please refer to the methods in research in [4]. The numbers of feedbacks of questionnaire and meter readings shown in Table 1 are the valid sample quantities.
3. Results and Discussions
3.1. Building Characteristics
Table 3 shows the building characteristics among the investigated households. Most of the investigated buildings were built in the 90s, accounting for 43% in total, and 29% of the buildings were built after the year of 2000.
Concerning the floor area, 27.4% of the dwelling units are between 60 m2 and 80 m2, which is the largest part. Twenty five percent of the dwelling units are between 100 m2 and 120 m2. The average floor area is 111.3 m2. It was about 80 m2 in the year 2004 [6], and has increased by about 31 m2 in four years.
For the building envelop, 29.7% of the investigated buildings use reinforced concrete as building structure, and 52.0% use brick concrete as a building structure. Sixty two percent of the buildings use aluminum as a window frame, and 3% use plastic steel as a window frame. Most of buildings use single glass as window panes. Eighty six percent of the external wall of the buildings is a 240 mm thick brick wall while most households in very cold and cold zones use a 490 mm thick brick wall. This is because Kunming is in a moderate climate zone.
Regarding the sun shading, 64.3% of the investigated households use a curtain as a sun shading measure, and 17.9% use blinds.
| Item | Categories | Percentage (%) |
|---|---|---|
| Construction year | Before 1980 | 7.8 |
| 80s | 20.7 | |
| 90s | 42.9 | |
| After 2000 | 28.6 | |
| Floor area | <60 m2 | 3.6 |
| 60 – 80 m2 | 27.4 | |
| 80 – 100 m2 | 21.4 | |
| 100 – 120 m2 | 25.0 | |
| Structure | >120 m2 | 22.7 |
| Brick concrete | 29.7 | |
| Reinforced | 52.0 | |
| Other | 8.3 | |
| Window frame | Aluminum | 62.0 |
| Plastic steel | 23.0 | |
| Wood | 3.0 | |
| Iron | 12.0 | |
| Window pane | Single glass | 75.0 |
| Double glass | 25.0 | |
| Sun shading | Curtain | 64.3 |
| Blind | 17.9 | |
| Awning | 9.5 | |
| Other | 8.3 |
3.2. Building Appliances
Twelve percent of the investigated households have air conditioning. Fourteen percent of the households have fans. Only 5% of the households have domestic heating appliances. The possession rate of heating and cooling is less because the winter in Kunming is not cold and summer is not hot. Seventy five percent of the households use an individual water heater.
Because the duration of sunshine in Kunming is very long, 55% of the investigated households use solar energy as an energy source of their water heater. Nineteen percent and 26% of the households use gas and electricity as energy source of water heater, respectively.
3.3. Operation of Heating and Cooling
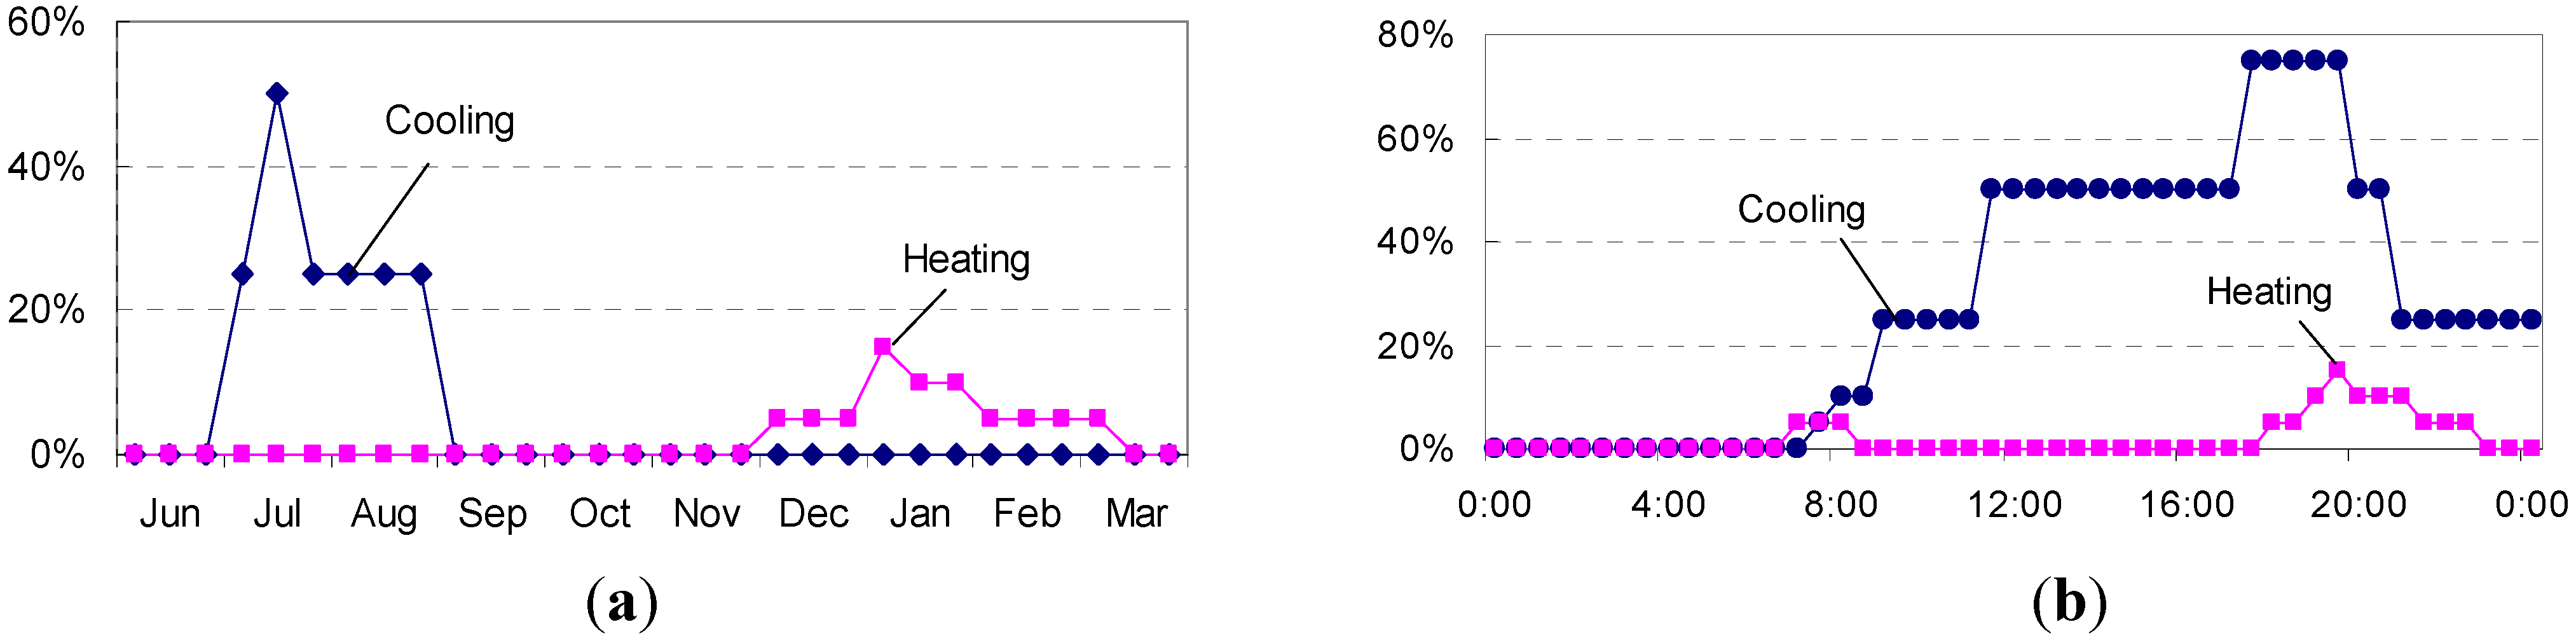
Figure 2 (a) shows the operation ratio of heating and cooling in winter and summer respectively. The heating period is from December to March. Almost 15% of the households use heating in January and 10% from December to March of the following year. As for the cooling operation period, it is from July to August. Fifty percent of the households operate cooling appliances in July; and 25% use cooling in June and August.
Figure 2 (b) shows the daily operation ratio of heating and cooling. Five percent of the residences use heating at around 8:00; and almost 10% use heating from 19:00 to 21:00. As for daily operation of cooling, the peak appears from 17:30 to 19:30, with a percentage of 75% of the households which have cooling appliances. Fifty percent of the households use cooling from 11:30 to 17:00.
Figure 2.
(a) Operation ratio of heating and cooling. (b) Daily operation ratio of heating and cooling.
Figure 2.
(a) Operation ratio of heating and cooling. (b) Daily operation ratio of heating and cooling.

3.4. Family Characteristics
Regarding the number of family members, three is the average number of people in the investigated families (accounting for 54%). The average family size is 2.9 people, and this is same as the average Chinese urban family size in 2008 [7]. The households with annual income above 150,000 RMB, between 100,000 and 150,000, and between 50,000 and 100,000, were 9%, 4% and 37% respectively.
3.5. Energy Consumption
All kinds of energy sources are converted into caloric value, and the unit caloric values of different energy sources are shown in Table 4 [8].
| Energy source | Electricity | LPG | City gas |
|---|---|---|---|
| Calorific values of units | 3.6 MJ/kWh | 46.2 MJ/kg | 27.3 MJ/m³ |
Monthly measurement data of gas & electricity consumption in a year are obtained. Energy consumption of space heating is not included in this study, because very few households use space heating in winter, as shown in Figure 2.
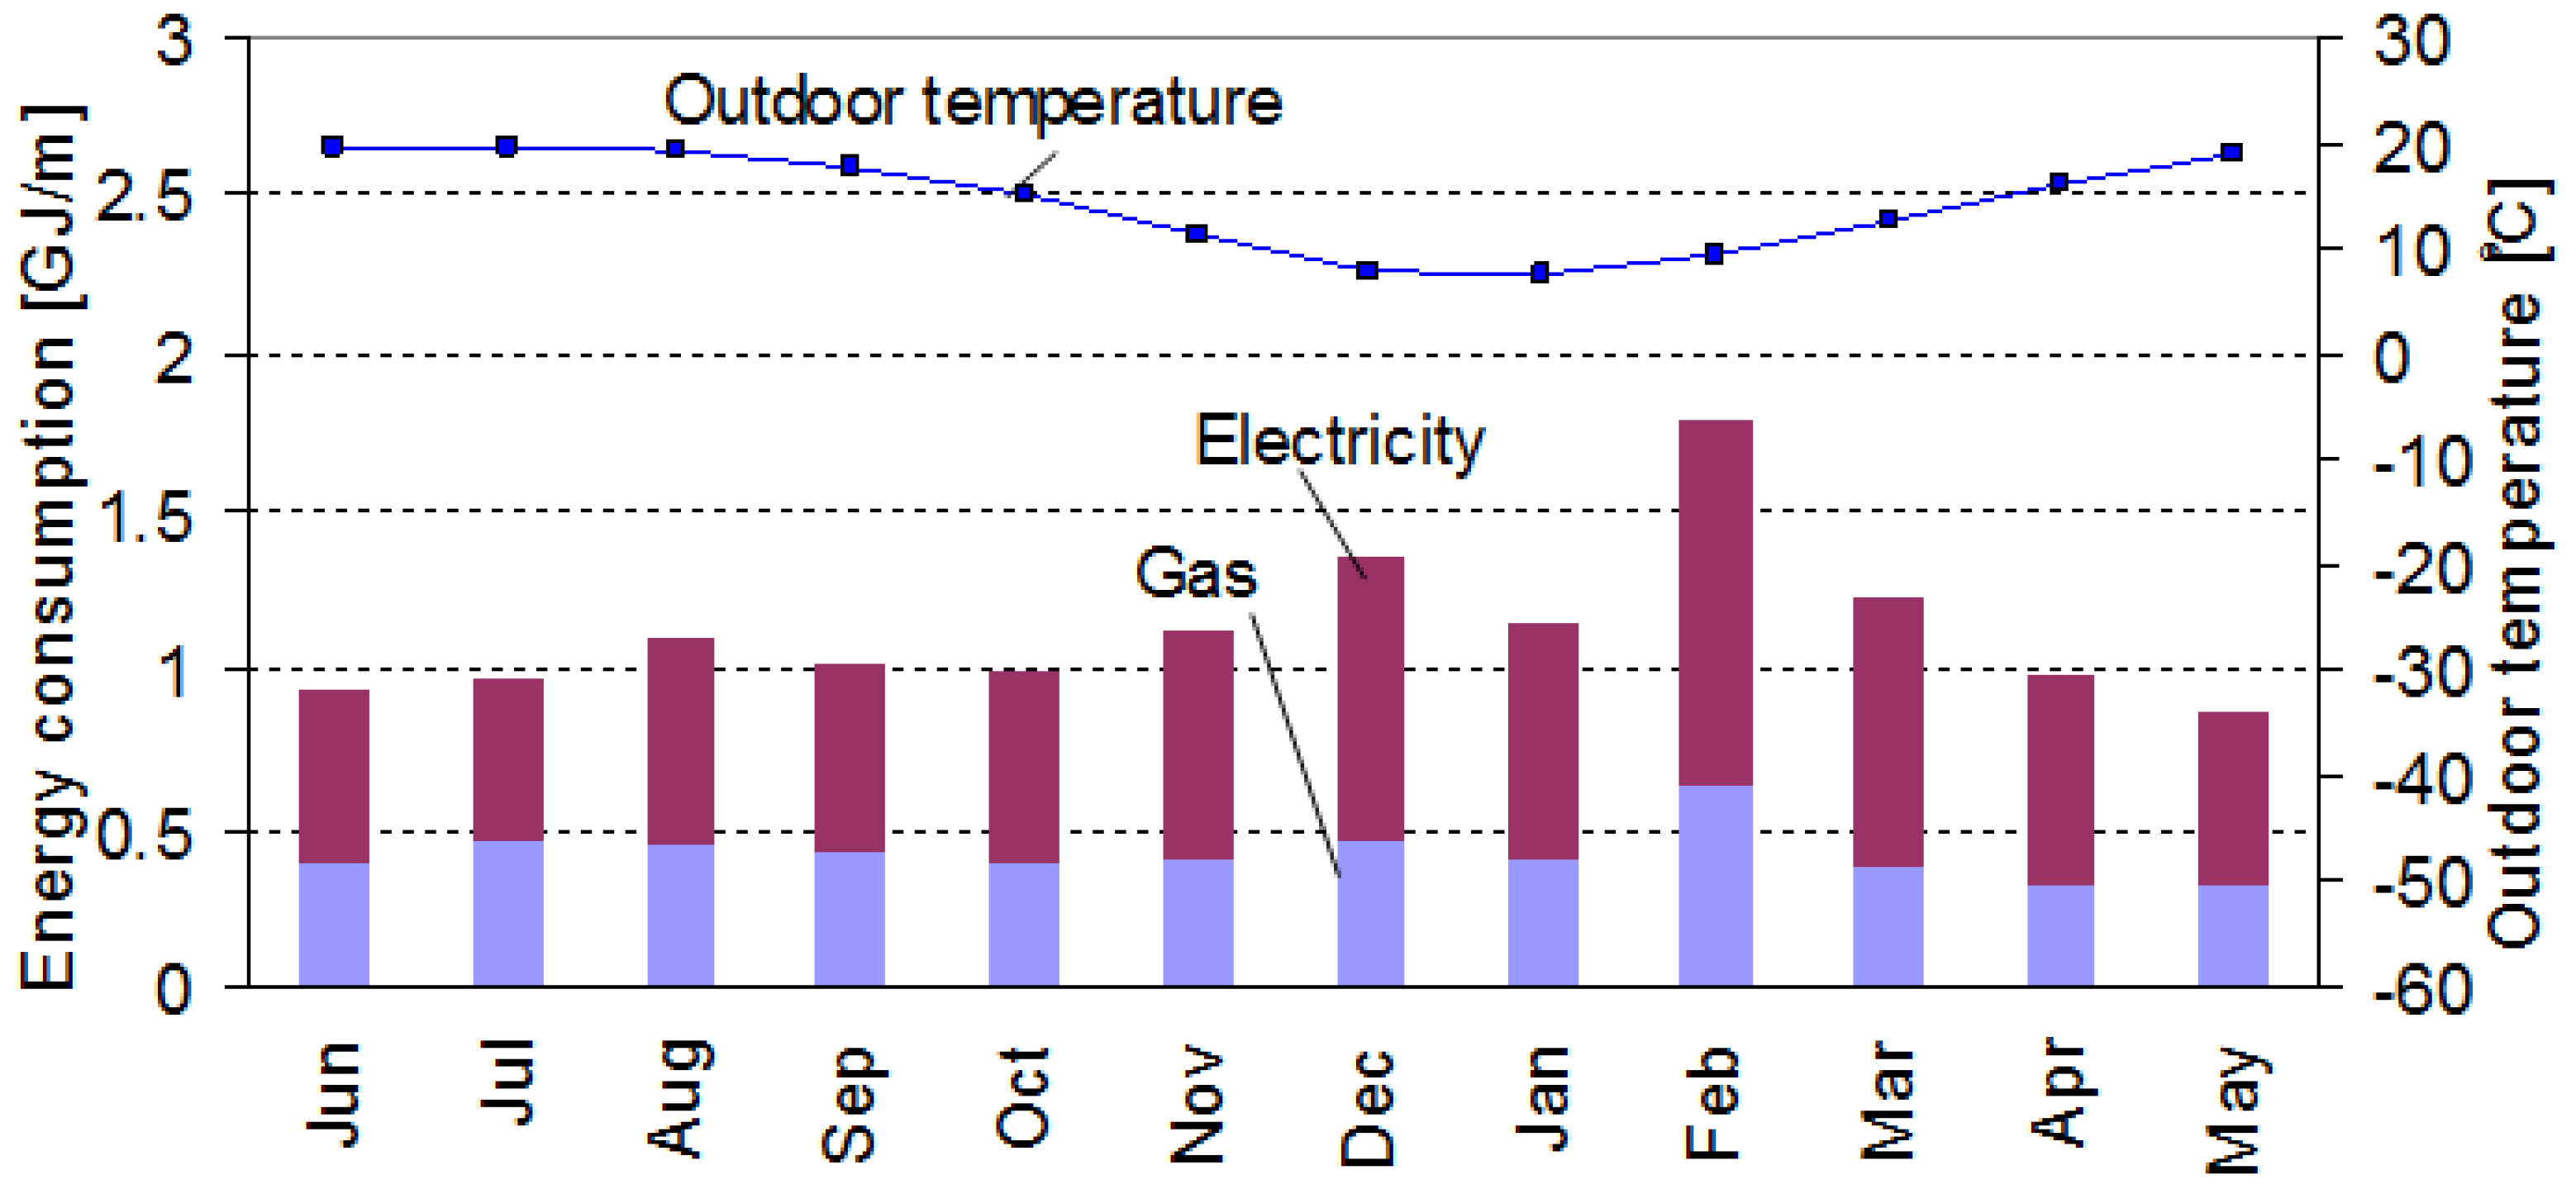
For the average monthly energy consumption shown on Figure 3, the peak appears in February with the value of 1.76 GJ/month per household because the Chinese spring festival is in February. Generally, people cook more delicious food during that festival and the time spent at home is also much longer than other months. The second largest energy consumption month is in December with the value of 1.35 GJ/month, and the electricity consumption is almost twice that of gas consumption. In the other 10 months, energy consumption is almost the same, except in August and March.
Figure 3.
Monthly energy consumption per household.
There are two types of energy use by households in each city. Type 1 has 14 households and Type 2 has 3 households. The classification of the end use of energy consumption is shown in Table 5. Based on the information in this table, the energy consumption of end use is speculated by using the method as follows;
| Type | Energy source | End use | Sample size |
|---|---|---|---|
| Type 1 | Electricity | Heating & cooling, lighting, others | 14 |
| Gas | Cooking, hot water | ||
| Typ 2 | Electricity | Heating & Cooling, lighting, hot water others | 3 |
| Gas | Cooking |
In the case of Type 1, the energy consumption for cooling was speculated by using the electricity consumptions (Type 1) in winter and summer minus the average consumption of mild seasons (spring and autumn) respectively, because typical weather for spring and autumn in China is generally comfortable, there is no need for cooling [9], and the lighting consumption does not vary much between the four seasons [10]. Energy consumption for hot water was speculated by using gas consumption of Type 1 minus that of Type 2 because the cooking habits of residents is alike in the same city; the energy consumptions of Type 1 and Type 2 for cooking can be regarded as the same. Energy consumption of Type 1 can be divided into space heating, space cooling, hot water, cooking and others by the method above.
Figure 4.
Correlation between consumptions of cooling and floor area.
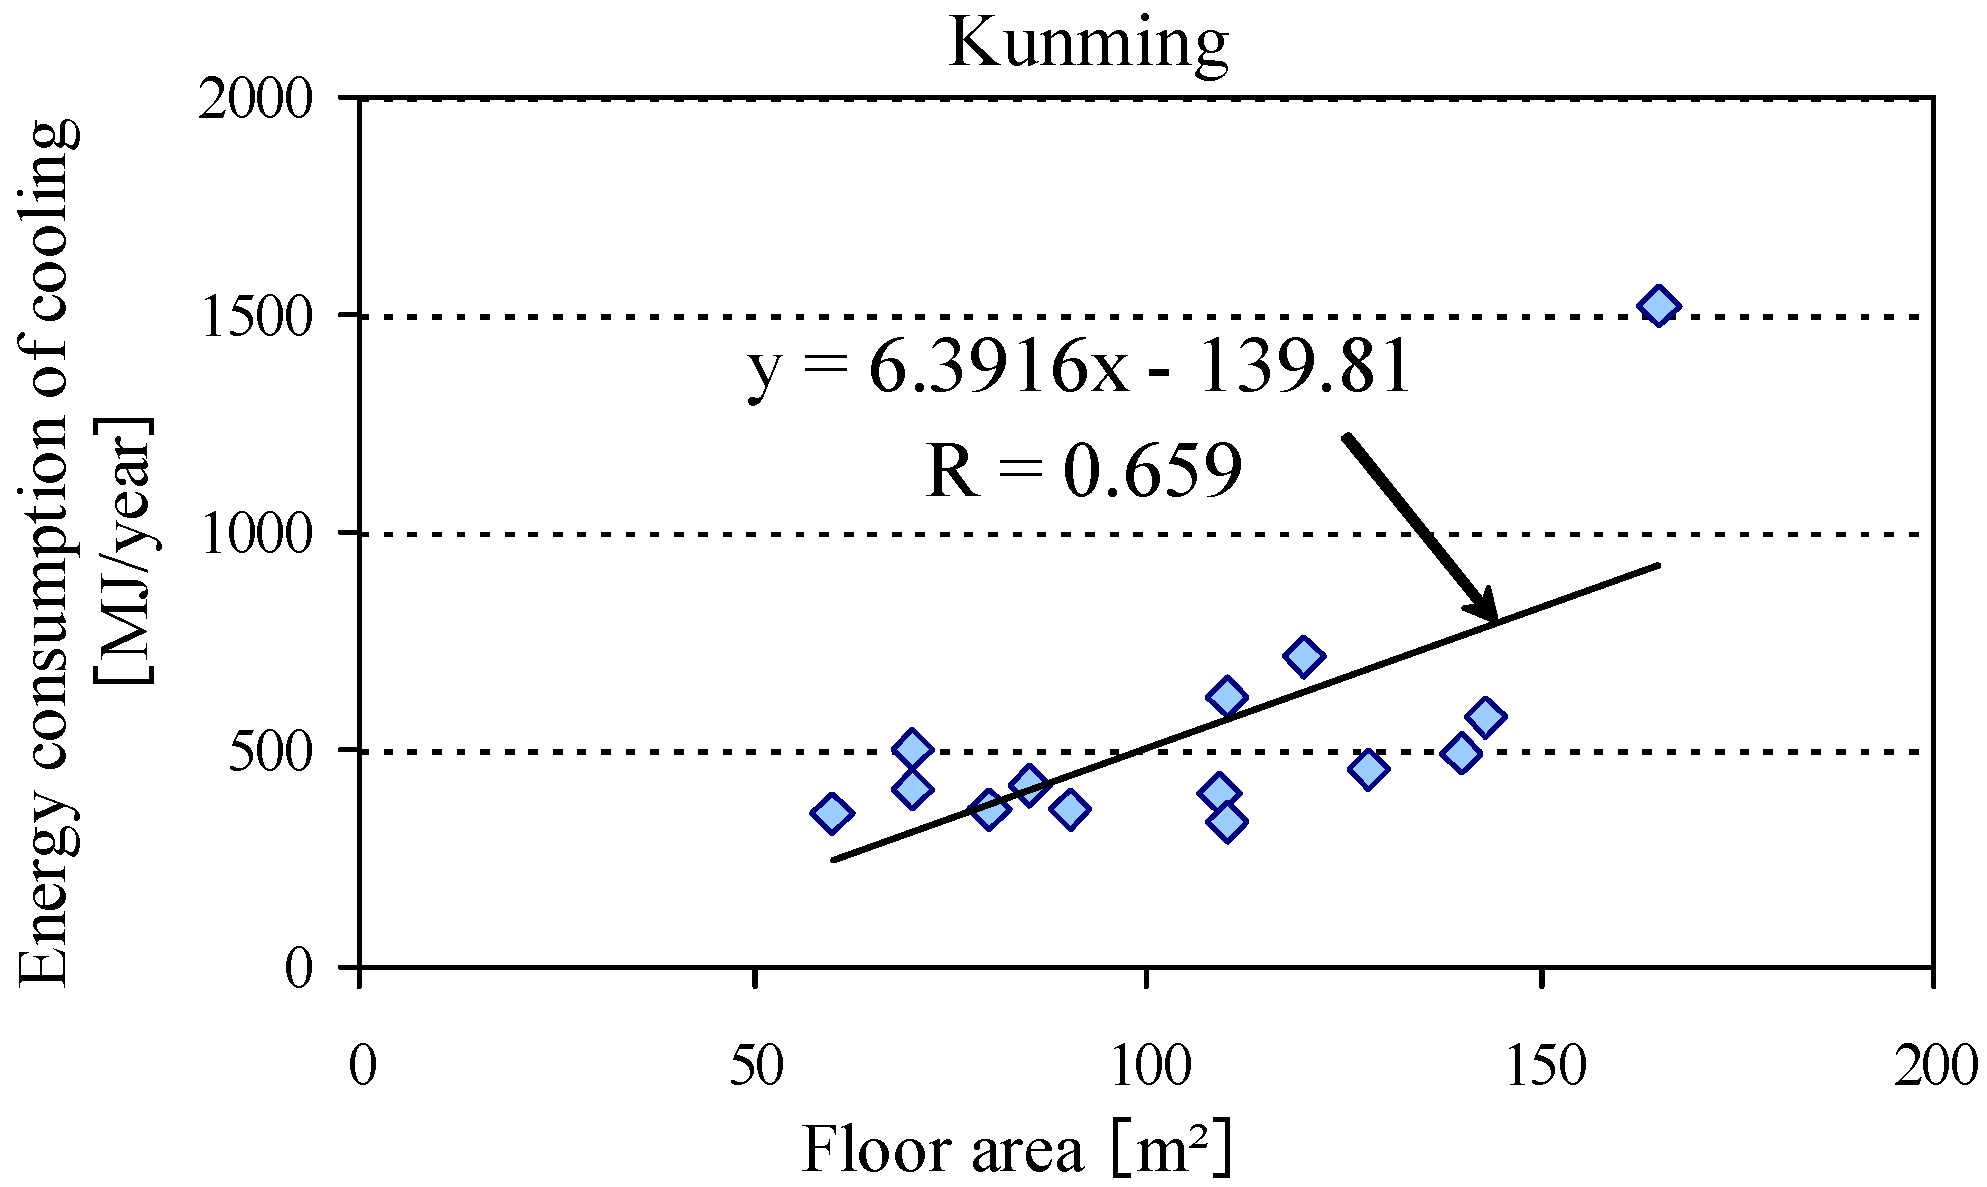
Based on the information from the survey, the correlation between energy consumption of cooling and floor area was analyzed, and the results are given in Figure 4. For the case of Type 2, the energy consumption for Heating & cooling cannot be speculated using the method that was adopted in the case of Type 1. This is because the energy consumption of hot water varies from season to season in China. However, energy consumption for cooling can be calculated by the equation of regression between energy consumption of cooling and floor area in Type 1 (Yoshino et al., 2008). Consumption of gas was used for cooking. Annual energy consumption of hot water can be considered to be the same as in Type 1 and Type 2 in the same city. Energy consumption of Type 2 was divided into space cooling, cooking and others by using the above-mentioned method for Type 2. Hence, the average consumptions of space heating, space cooling, hot water, cooking and others can be calculated by the mean value of Type 1 and Type 2, respectively.
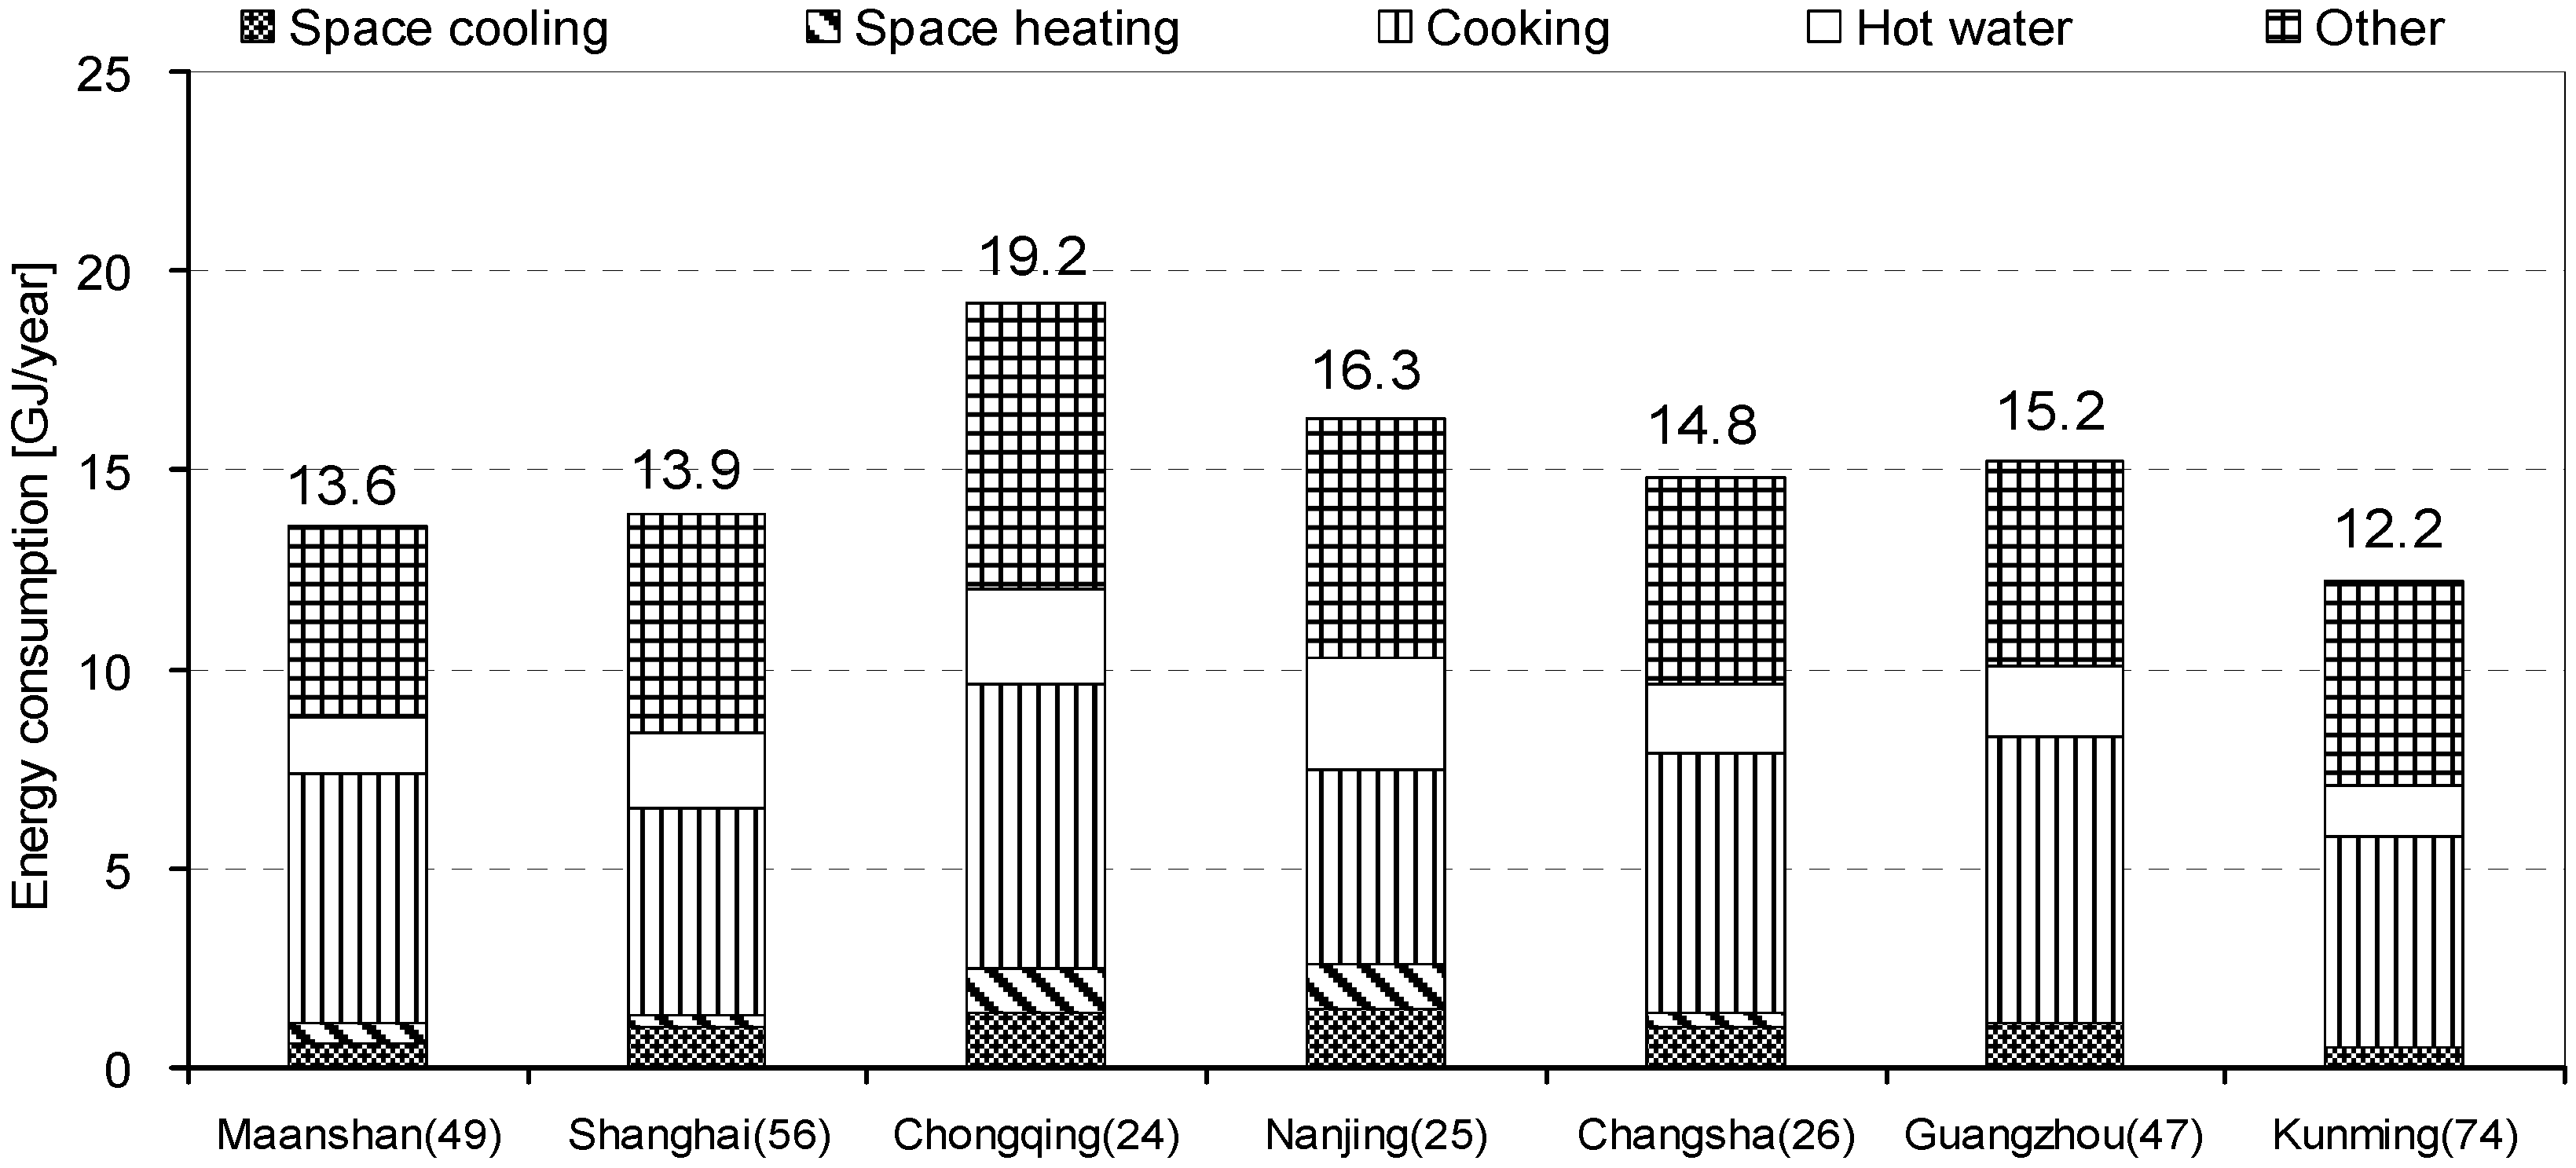
Annual energy consumption reaches 12.2 GJ/year per household, and consumption of cooking accounts for 5.3 GJ/year, which is the largest part of total energy consumption, as shown on Figure 5. The annual energy consumption is low compared to Shanghai, Changsha, Maanshan, Chongqing and Guangzhou [9].
Figure 5.
Annual energy consumption per household.
3.6. Humidity and Temperature
One typical household in the investigated city was selected for the measurement of humidity and temperature by a researcher of a local university. The measured points are set in the living room, master bedroom and outdoors. The small sensor with a data logger records humidity and temperature every 30 minutes.
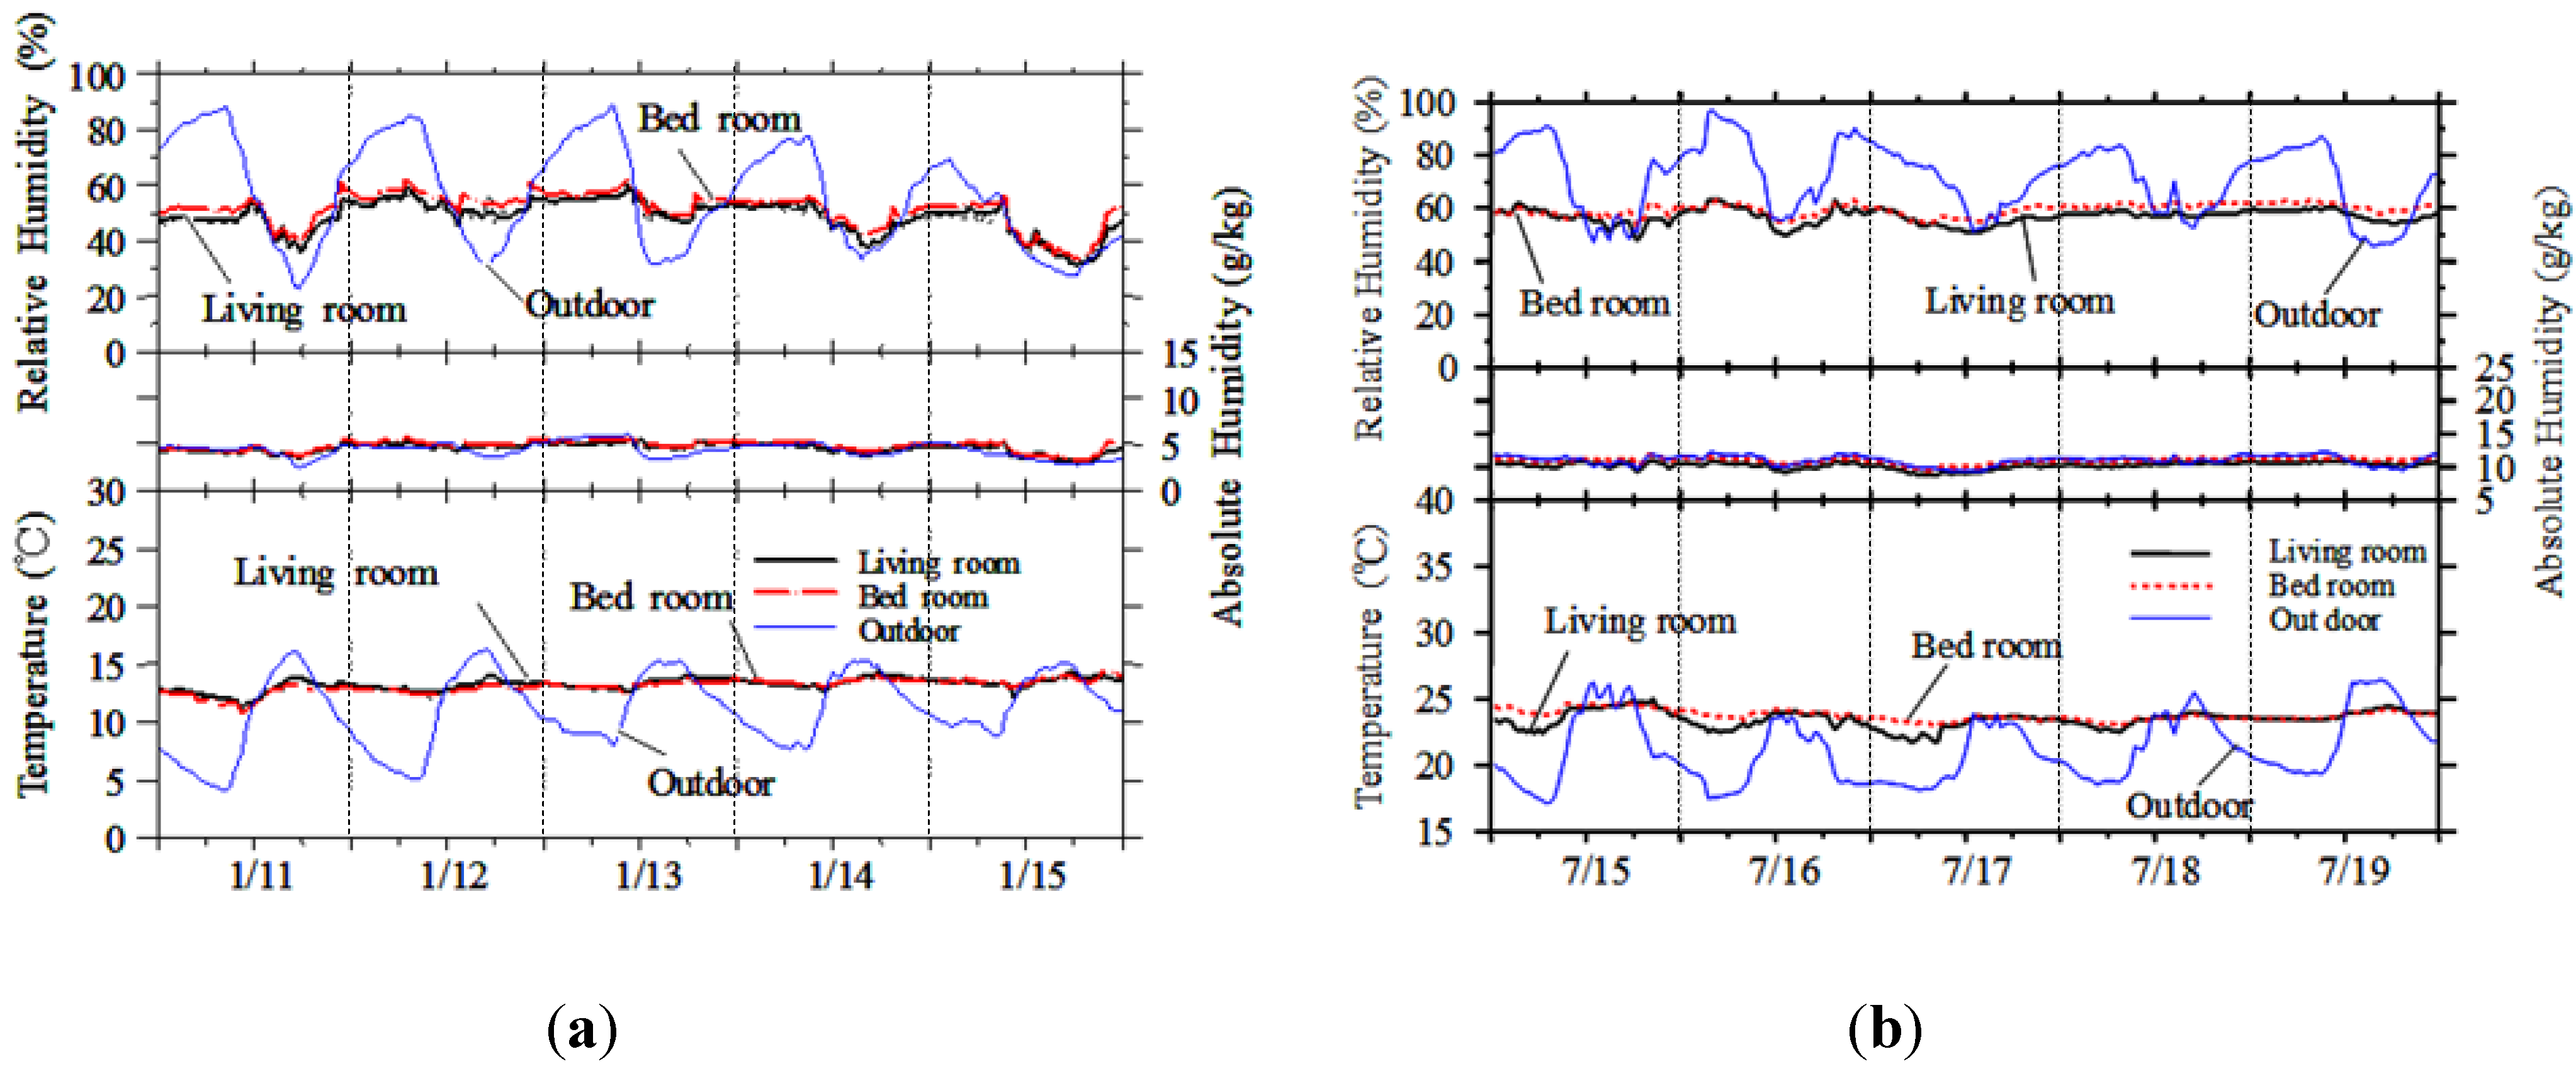
Figure 6 (a) shows the results of humidity and temperature for a household in winter which includes the coldest day. The indoor fluctuating curve of temperature is more even than that of the outdoor. The relative humidity in the bedroom is slightly higher than the living room. As for the indoor temperature, the living room is almost the same as the bedroom, varying from 11 °C to 14 °C.
Figure 6 (b) shows the results of humidity and temperature for the same household in summer which includes the hottest day. Most of the time, the outdoor humidity is higher than that in the living room and bedroom. The outdoor temperature is lower than that in the living room and bedroom, thus natural ventilation is a useful cooling method for the household in Kunming. The absolute humidity in winter is about 5 g/kg, while in summer it is about 11 g/kg.
Figure 6.
(a) Humidity and temperature in winter. (b) Humidity and temperature in summer.
3.7. Analysis on the Influence Factors to Energy Consumption
3.7.1. Model of Analysis on Influence Factors
In this analysis, the qualitative and quantitative variables of annual energy consumption are analyzed based on Quantification Theory I. Quantification Theory I is a multidimensional mathematic-statistical analysis theory which predicts dependent variables, and analyzes the influence of independent variables (qualitative and quantitative) to dependent variables [11,12]. It can analyze not only the influence of qualitative independent variables to dependent variables, but also the influence of each category in the same qualitative independent variables to dependent variables by quantifying the qualitative data. The analysis of influence factors is a very important domain for the application of Quantification Theory I. It was mainly used in metric sociology at the very beginning, and then extended to the fields of forestry, the mining industry and clinical medicine [13,14]. In recent years, some researchers in Japan and China use Quantification Theory I to analyze energy consumption and have obtained useful results [4,15,16].
The Quantification Theory I includes three important indexes for analysis of influential factors, namely score of category, partial correlation coefficient and significance probability. The partial correlation coefficient of Quantification Theory I is usually used as an important index to evaluate contribution extents of independent variables to the dependent variable. The significance probability is taken to judge to what extent the partial correlation coefficient would be, and then which factors will have an effect on residential energy consumption. The significance probability is higher, the partial correlation coefficient is lower, and the factor that affects residential energy consumption is less. In the model, it is assumed that if the significance probability is less than 0.05, the factor has an influence on energy consumption [17]. The score of each variable is used to analyze the influence extent of all the categories of qualitative variables and quantitative variables on the dependent variable. The larger the value is, the more the energy is used.
The qualitative and quantitative independent variables used in this analytic model refer to building unit characteristics, family characteristics and housing appliances. The annual energy consumption amount of each family sample is taken as the dependent variable. Software of SPSS (Statistical Program for Social Sciences) is used for calculation [17].
3.7.2. Analysis of the Influential Factors of Energy Consumption
Table 6 shows the results of the influential factors on annual energy consumption. All the investigated 74 families compose the sample collectivity in the model. According to the assumption that the significance probability is smaller than 0.05, the factor has influence on energy consumption. It can be seen that the construction year, the water heater type, annual income and the number of family members all contribute to the annual energy consumption. The construction year, the building, the water heater type annual income are the three important influential factors on annual energy consumption based on their values of the significance probability. The water heater type is the most important factor influencing annual energy consumption since its value of significance probability is the lowest and the value of partial correlation coefficient is the largest. The score of category is used to judge the extent of the influence of categories of qualitative variables. A larger value indicates that this category leads to larger energy use. Thus, electric water heaters had the largest score in this category, which indicated that the households using electricity-driven water heaters in these cities consumed the most energy. The households using solar energy, on the other hand, consumed the least energy. Regarding the construction year, the older buildings had the larger score of category; therefore the older buildings consumed larger energy since newer buildings have better insulation characteristics. The buildings built after the 90s were distinctly more energy-efficient than those constructed before the 90s, based on their values of category score. By analyzing on the questionnaire and energy consumption, it was found that the 75% of investigated buildings built after 1993 were distinctly more energy efficient than those constructed before 1993. One of the reasons for this is that the Department of Construction of the PRC issued a national standard “Thermal design code for civil building”, GB 50176-93 in 1993 [5]. Regarding the building structure, the building built by brick concrete use less energy than the other structures. Ninety percent of the investigated buildings built after the year 2000 use brick concrete as building structure. Ninety five percent of the buildings which use brick concrete as building structure were built after 1993 and adopted the new energy conservation design standard GB 50176-93, this is one of the reasons why they consume less energy. Regarding window frames, wood and plastic steel windows save more energy than the other types because their heat transfer coefficients are lower than the others. As for the quantitative variables, the larger the floor area is, the higher annual income is, and the larger the number of family members is, the more energy is used.
 |
4. Conclusions
This study investigated the urban residential energy consumption under actual conditions using a questionnaire survey on Chinese families that reside in a moderate climate zone. Emphasis was particularly placed on seeking a complete understanding of residential end-use characteristics and their influential factors in Kunming, China. The following are the key findings of this study:
- 1)
- Most of the investigated buildings were built in 90s. Floor area in 27.4% of the dwelling units is between 60 m2 and 80 m2. The possession rate of heating and cooling is less because the winter is not cold and summer is not hot. Most of the households are equipped with solar water heaters since the sunshine hours are long.
- 2)
- The annual energy consumption reaches 12.2 GJ/year per household, and cooking use 5.3 GJ/year, accounting for 43.3% of total energy use. The peak energy consumption appears in February with 1.76 GJ/month per household.
- 3)
- Most of the time in summer, the outdoor temperature is lower than in the living room and bedroom; thus, natural ventilation is a useful cooling method for households in Kunming. The absolute humidity in summer is about 11 g/kg, while in winter it is about 5 g/kg.
- 4)
- The construction year, the water heater type, annual income and the number of family members all contribute to the annual energy consumption. The construction year, the water heater type and annual income are the three important influential factors on annual energy consumption.
- 5)
- The investigated buildings built after the 90s are distinctly more energy efficient than before the 90s. One of the reasons is that the Department of Construction of PRC issued a national enforcement standard “Thermal design code for civil building”, GB 50176-93 in 1993 [5].
Acknowledgments
Many thanks to the academics, students related to this survey from Kunming University of Science and Technology, and residences in urban area involved in the survey. They gave us sincere help.
References
- National Bureau of Statistics. China Statistical Yearbook 2010; China Statistics Press: Beijing, China, 2011.
- Zhou, N.; Nishida, M.; Gao, W. Current Status and Future Scenarios of Residential Building Energy Consumption in China; Lawrence Berkeley National Laboratory: Berkeley, USA, 2008. [Google Scholar]
- Yu, L.; Watanabe, T.; Hiroshi, Y.; Gao, W. Research on energy consumption of urban apartment buildings in China. J. Environ. Eng. 2008, 73, 183–190. [Google Scholar]
- Chen, S.; Yoshino, H.; Li, N. Statistical analyses on summer energy consumption characteristics of residential buildings in some cities of China. Energ. Buildings 2010, 42, 136–146. [Google Scholar] [CrossRef]
- Department of Construction of the PRC, Thermal Design Code for Civil Buildings GB50176-93; China Plan Press: Beijing, China, 1993.
- Yoshino, H.; Yoshino, Y.; Zhang, Q.; Mochida, A.; Li, N.; Li, Z.; Miyasaka, H. Indoor thermal environment and energy saving for urban residential buildings in China. Energ. Buildings 2006, 1308–1319. [Google Scholar]
- National Bureau of Statistics. China Statistical Yearbook 2009; China Statistics Press: Beijing, China, 2010.
- Xiang, Y. Common-Use Data Handbook in Gas Thermodynamic Engineering; China Architecture and Building Press: Beijing, China, 2000. [Google Scholar]
- Hu, T.; Yoshino, H.; Jiang, Z.; Zhou, J. Questionnaire Survey on Residential Indoor Environment and Energy Consumption in Different Climate Zones in China. In Conference of the Society of Heating, Air-conditioning and Sanitary Engineers of Japan, Yamaguchi, Japan, 1–3 September 2010; pp. 505–508.
- Yoshino, H.; Jiang, Z.; Li, Z.; Li, N.; Liu, J.; Lu, W.; Pei, Q.; Zhen, J.; Zhu, Y. Investigation of Urban Residential Energy Consumption in China. In Proceedings of the First International Conference on Building Energy and Environment, Dalian, China, 4–6 August 2008; pp. 284–291.
- Dong, W.; Zhou, G.; Xia, L. Quantification Theory and its Application; Jilin People’s Press: Changchun, China, 1979. [Google Scholar]
- Yu, X.; Ge, J.; Xu, Z. The modification and fitting of district output model by quantification theory. Industry and Technology 2005, 25, 16–18. [Google Scholar]
- Cao, G. Quantitative analysis of cryphonectria parasitica and primary factors of habitat and management. Journal of Jiangxi Agricultural University 2004, 26, 207–273. [Google Scholar]
- Zhang, X. Study on comprehensive criteria for regional prediction of coal and gas outburst. J. Coal Sci. Eng. 2003, 28, 251–255. [Google Scholar]
- Nakamura, S.; Yoshino, H.; Murakami, S.; Bohgaki, K.; Matsunawa, K.; Kametani, S.; Takguchi, H.; Hanzawa, H.; Okumiya, M.; Kubo, T.; et al. Study on the environmental load database (DECC) for buildings Part 55: Basic (level 1) database analysis result of office buildings (investigation in fiscal year 2008). Trans. Architec. Inst. Jpn. 2010, 9, 1179–1180. [Google Scholar]
- Xie, J. Long-term detail measurement of residential energy consumption and the research on energy conservation potential based on the simulation. PhD Thesis, Department of Architecture and Building Science, Tohoku University, Japan, 2006. [Google Scholar]
- Zhang, W. Statistical Application; Advanced Education Press: Beijing, China, 2004. [Google Scholar]
© 2012 by the authors; licensee MDPI, Basel, Switzerland. This article is an open-access article distributed under the terms and conditions of the Creative Commons Attribution license ( http://creativecommons.org/licenses/by/3.0/).
Share and Cite
MDPI and ACS Style
Hu, T.; Yoshino, H. Analysis on Energy Consumption and Indoor Environment in Kunming, China. Sustainability 2012, 4, 2574-2585. https://doi.org/10.3390/su4102574
AMA Style
Hu T, Yoshino H. Analysis on Energy Consumption and Indoor Environment in Kunming, China. Sustainability. 2012; 4(10):2574-2585. https://doi.org/10.3390/su4102574
Chicago/Turabian StyleHu, Tianchi, and Hiroshi Yoshino. 2012. "Analysis on Energy Consumption and Indoor Environment in Kunming, China" Sustainability 4, no. 10: 2574-2585. https://doi.org/10.3390/su4102574