The Importance of Considering Product Loss Rates in Life Cycle Assessment: The Example of Closure Systems for Bottled Wine


Abstract
:1. Introduction
Context and Objectives
2. Method
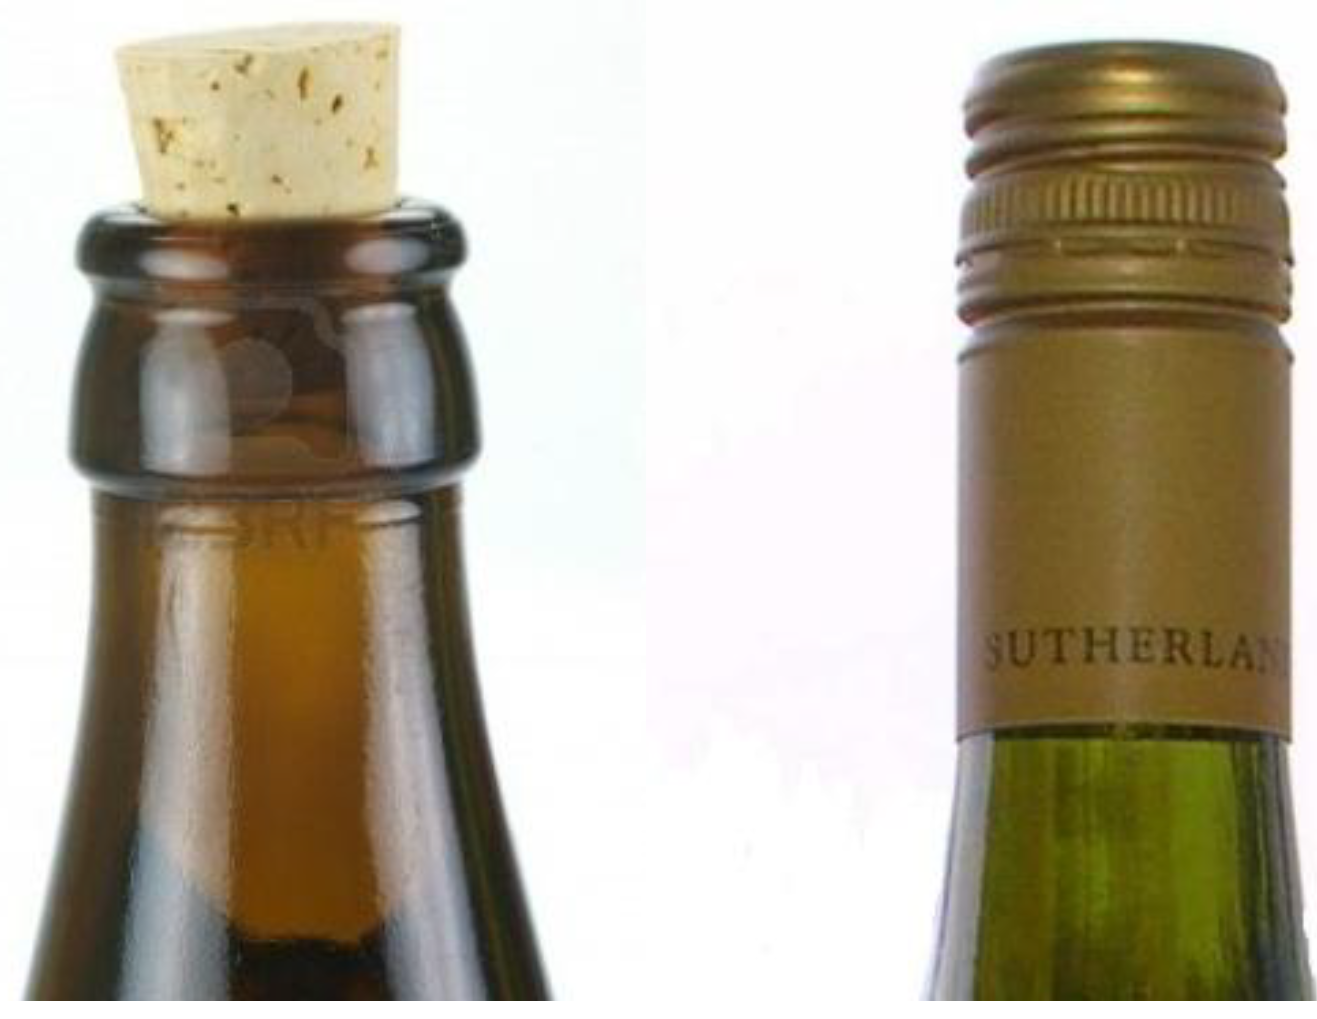
2.1. Closure Systems Considered and Functional Unit
- - wine bottle production
- - 750 mL of wine
- - wine closure production
- - wine loss associated with the closure systems
- - wine poured down the drain
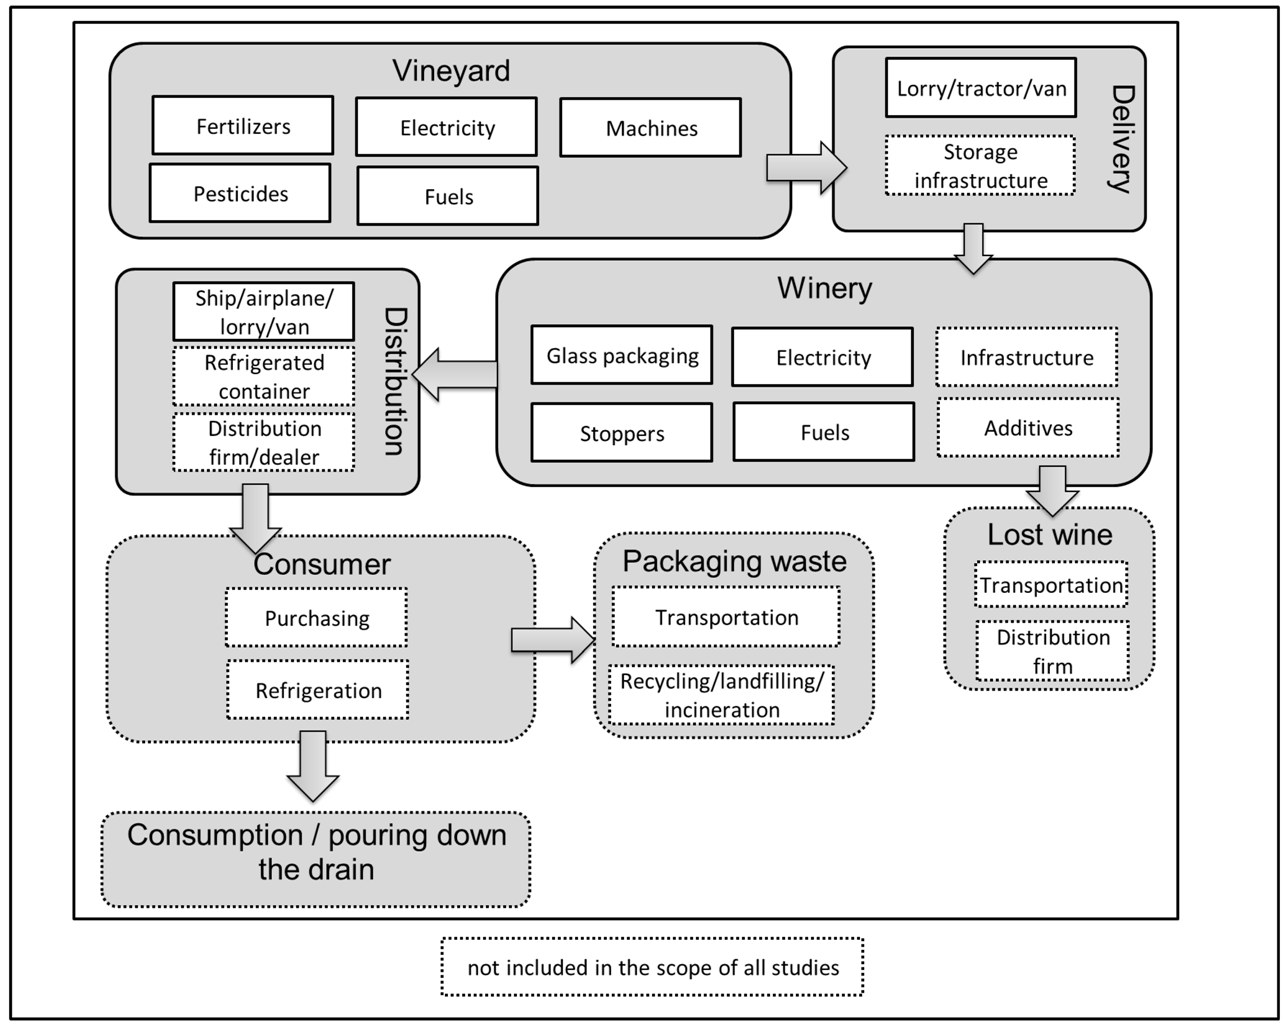
2.2. System Boundaries and Bottled Wine Production

- Global warming over 100 years (in kg CO2eq)
- Non-renewable primary energy use (in MJ)
- Atmospheric acidification (in g H+ eq)
- Photo-oxidant formation (in kg ethylene eq)
- Eutrophication of surface water (in kg PO43- eq)
2.3. Wine Closure Production
2.4. Wine Loss Associated with the Closure Systems
- Percentage of bottles with an altered taste (Section 2.4.1). This parameter depends on the type of closure as well as wine conservation failures during its life cycle.
- Percentage of the bottles with an altered taste that are actually thrown away by the consumer (Section 2.4.2 on consumer behavior). This parameter depends on the consumer, their expertise and sensitivity to recognize the altered taste (due to the wide range of alteration intensity).
2.4.1. Taste Alterations Considered and Fraction of Bottles with Altered Tastes
- an undesirable odor due to failures at different life cycle stages (e.g., incorrect transport or storage in inappropriate locations before and after the bottling process);
- an unfavorable taste due to conservation problems (e.g., being stored too long);
- a “corked” taste.
- A “true corked taste”—or “goût de bouchon”—is due to the presence of the fungus Armillaria mellea [22] and is characterized by a powerful taste which makes the wine undrinkable; this is also known as “yellow stain”;
- A “taste of cork” occurs when wine elements are affected by the cork. The wine is considered altered when it is too intense;
- A “false corked taste” is due to 2,4,6-trichloroanisol (TCA), which is synthesized by the fungi Penicillium from chlorophenols, which can enter cork during its production and/or storage.
2.4.2. Consumer Behavior
- Drinking the bottle (considered unlikely for a strongly “corked” bottled wine)
- Disposal of the wine down the drain (or returning it to the store before eventual disposal at the store) and opening a new bottle. Thus, this particular behavior increases the amount of wine needed to fulfill the functional unit
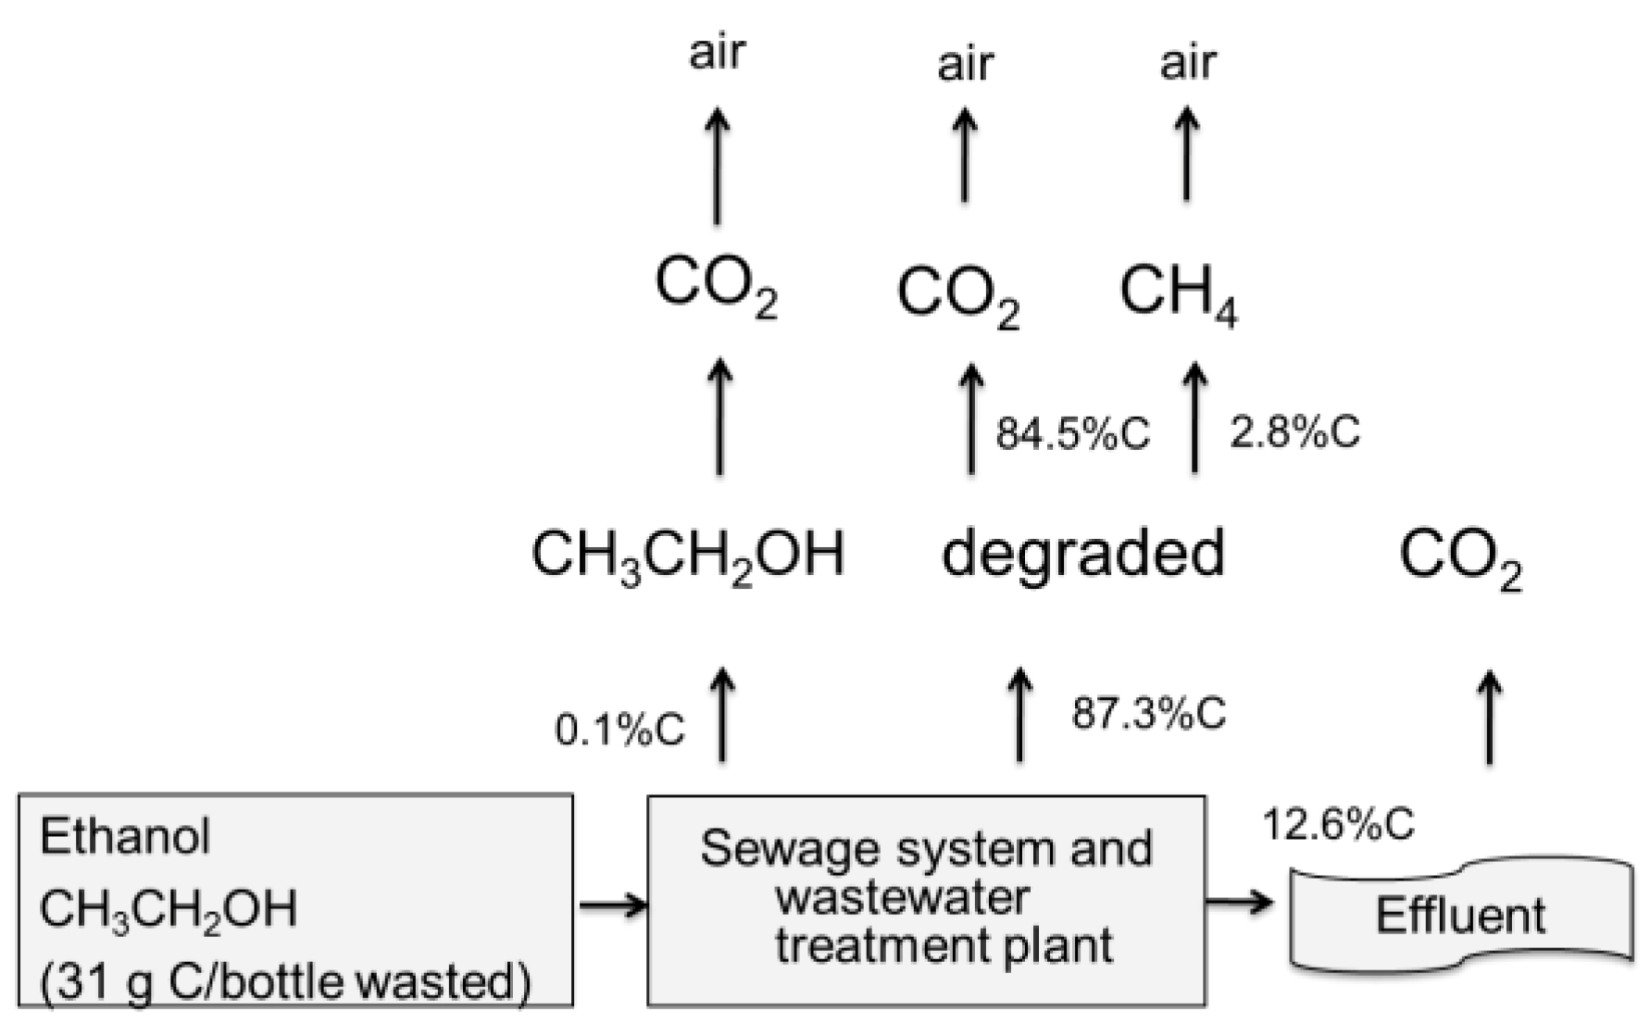
2.5. Impacts of Wine Poured Down the Drain
3. Results
3.1 Impact Scores for Wine Production, Closures and Wine Poured Down the Drain

| Impact category studied | 750 ml bottled wine production [1,2,3,4,5,6,7,8,9,10] | Closure production [17] | Wine poured down the drain (recalculated based on ecoinvent v2.2) | ||
|---|---|---|---|---|---|
| average | range | Cork stopper | Screw cap | For 750 mL of wine | |
| Global warming (kg CO2eq) | 3.3 | 1.0-4.0 | 2.0E-3 | 3.7E-2 | 2.9E-2 |
| Non-renewable energy use (MJ) | 47 | 16-58 | 0.10 | 0.44 | 1.1E-3 |
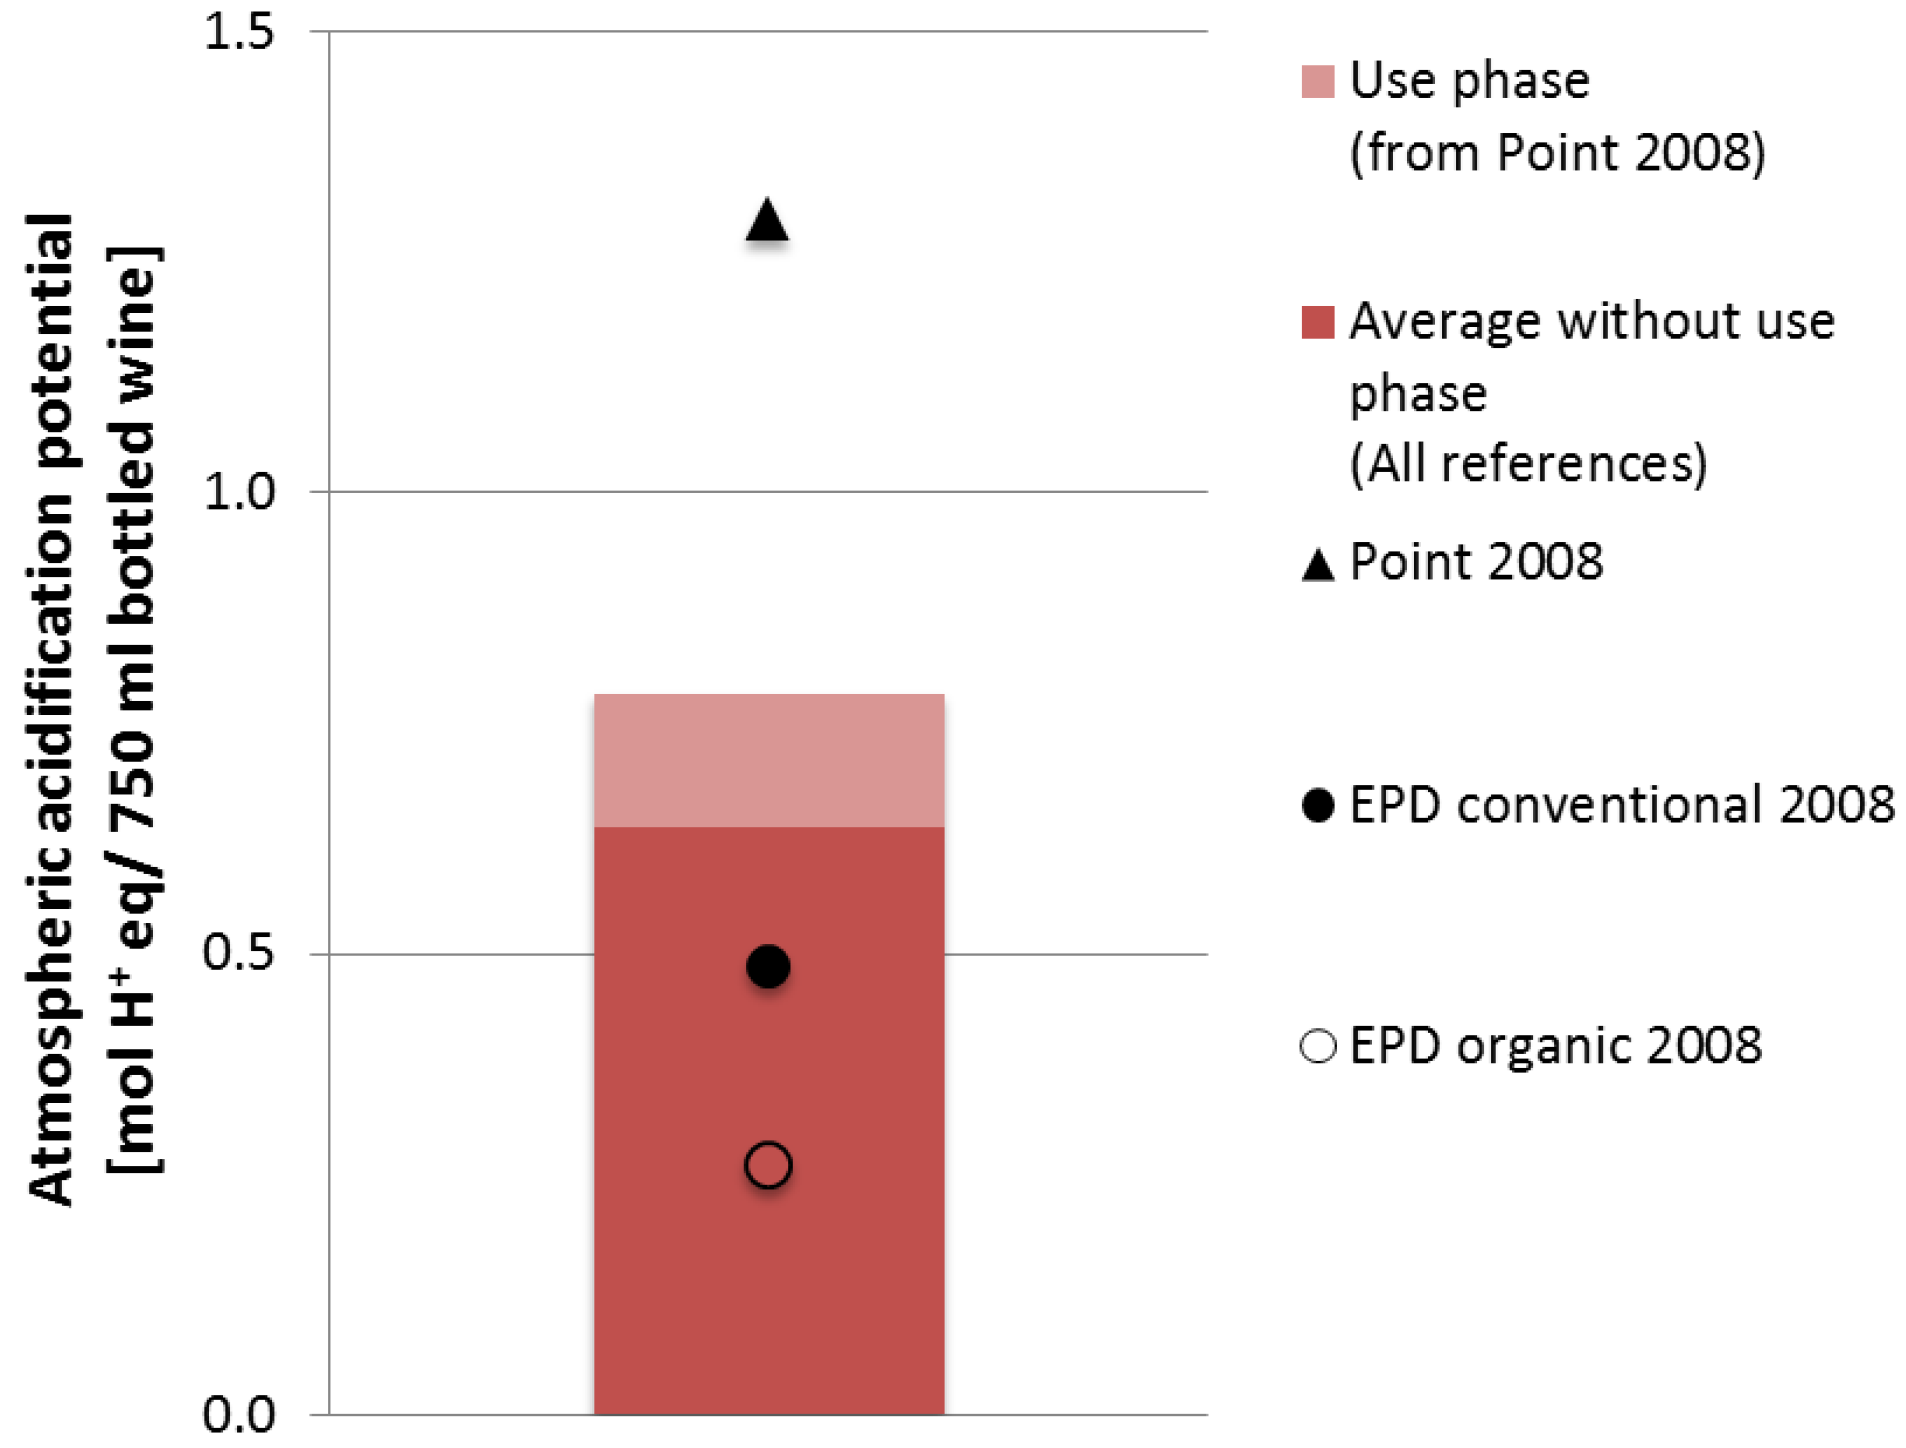
| Atmospheric acidification (g H+ eq) | 0.78 | 0.27-1.3 | 1.3E-3 | 8.2E-3 | 2.7E-4(Modeled with TRACI [36]) |
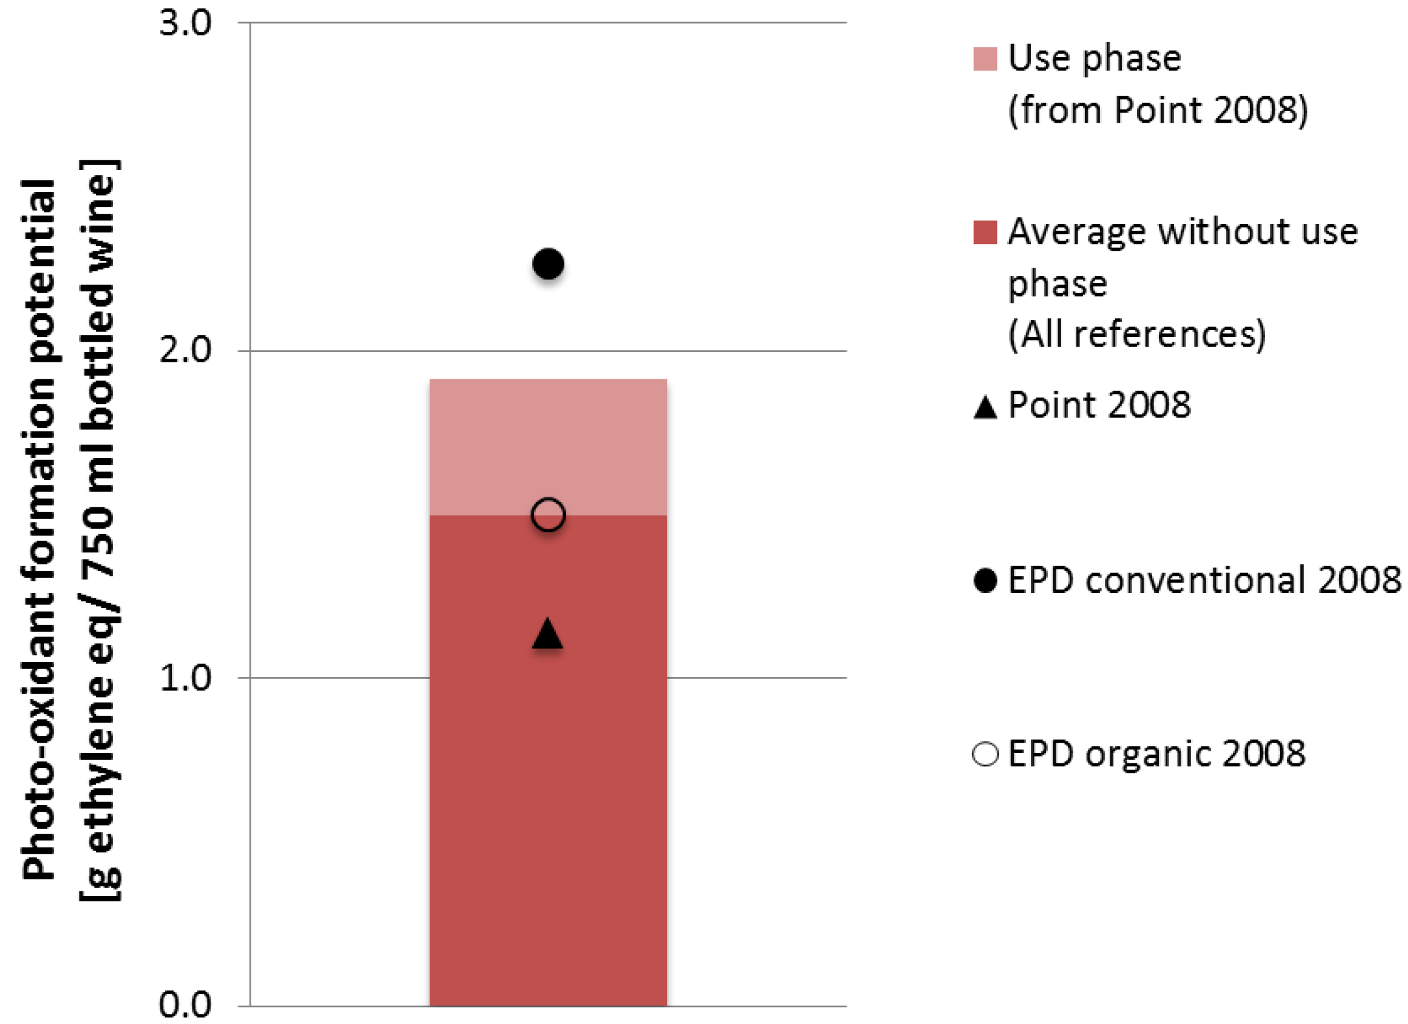
| Photo-oxidant formation (kg ethylene eq) | 1.9E-03 | 1.1E-3-2.3E-3 | 3E-6 | 1.4E-5 | 1.6E-7 |
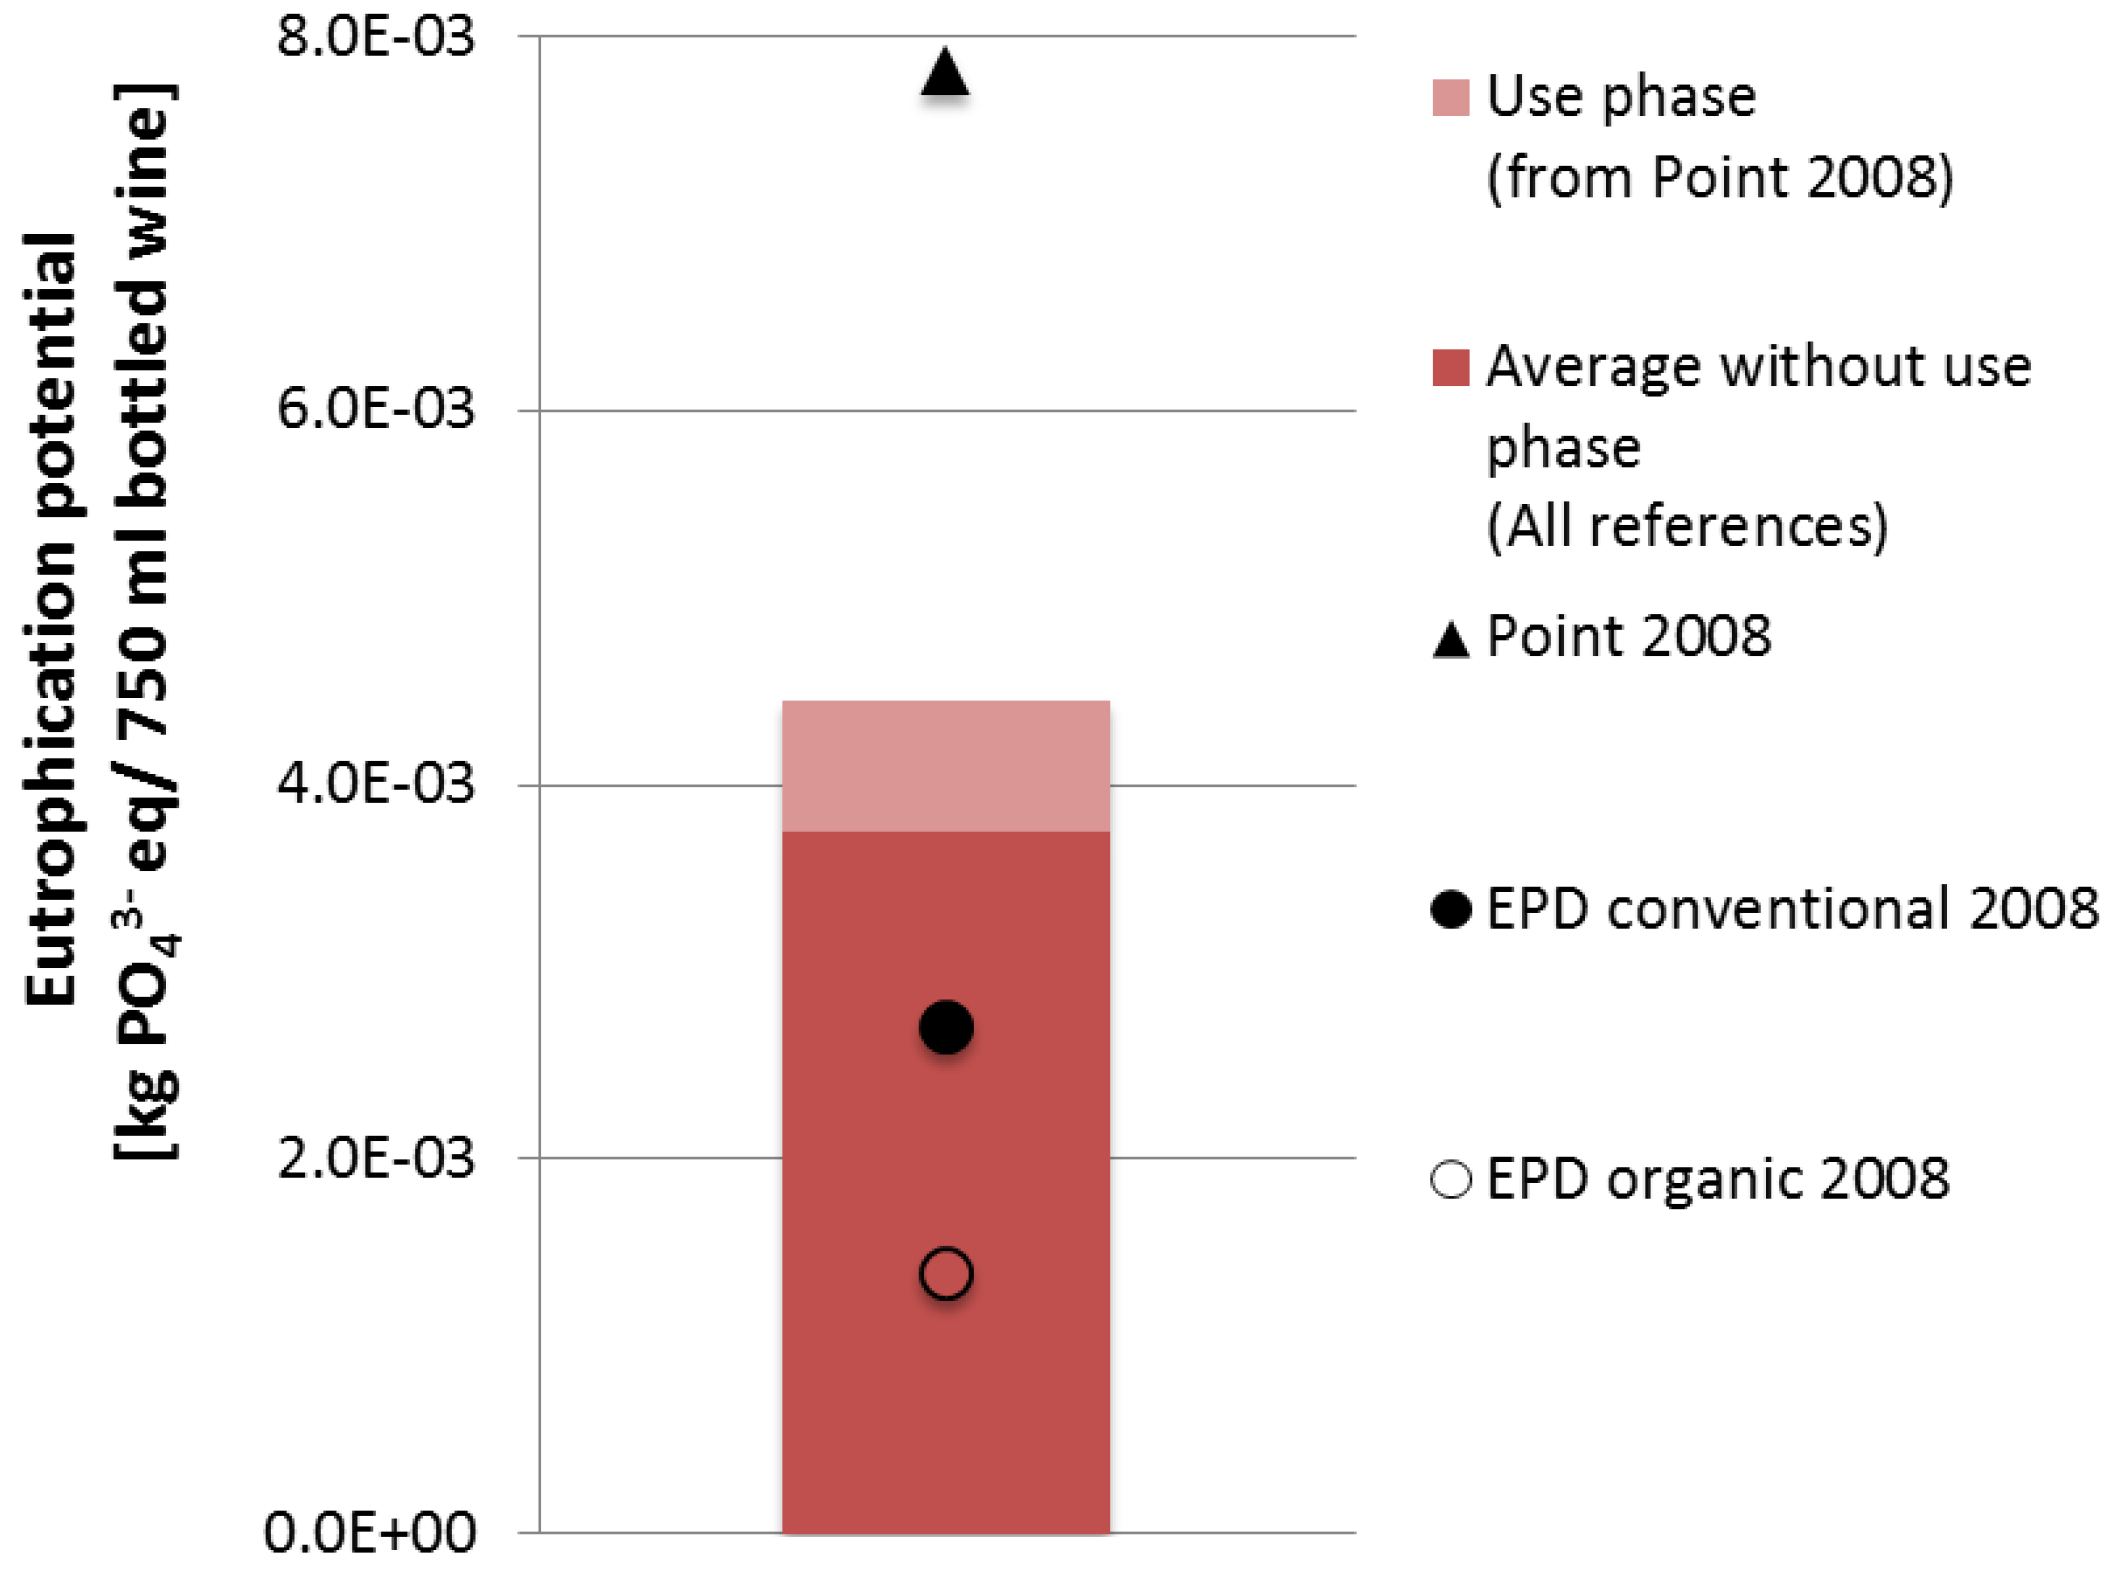
| Eutrophication (kg PO43-eq) | 4.5E-03 | 1.4E-3-7.8E-3 | 6E-7 | 7E-7 | 3.5E-4 |
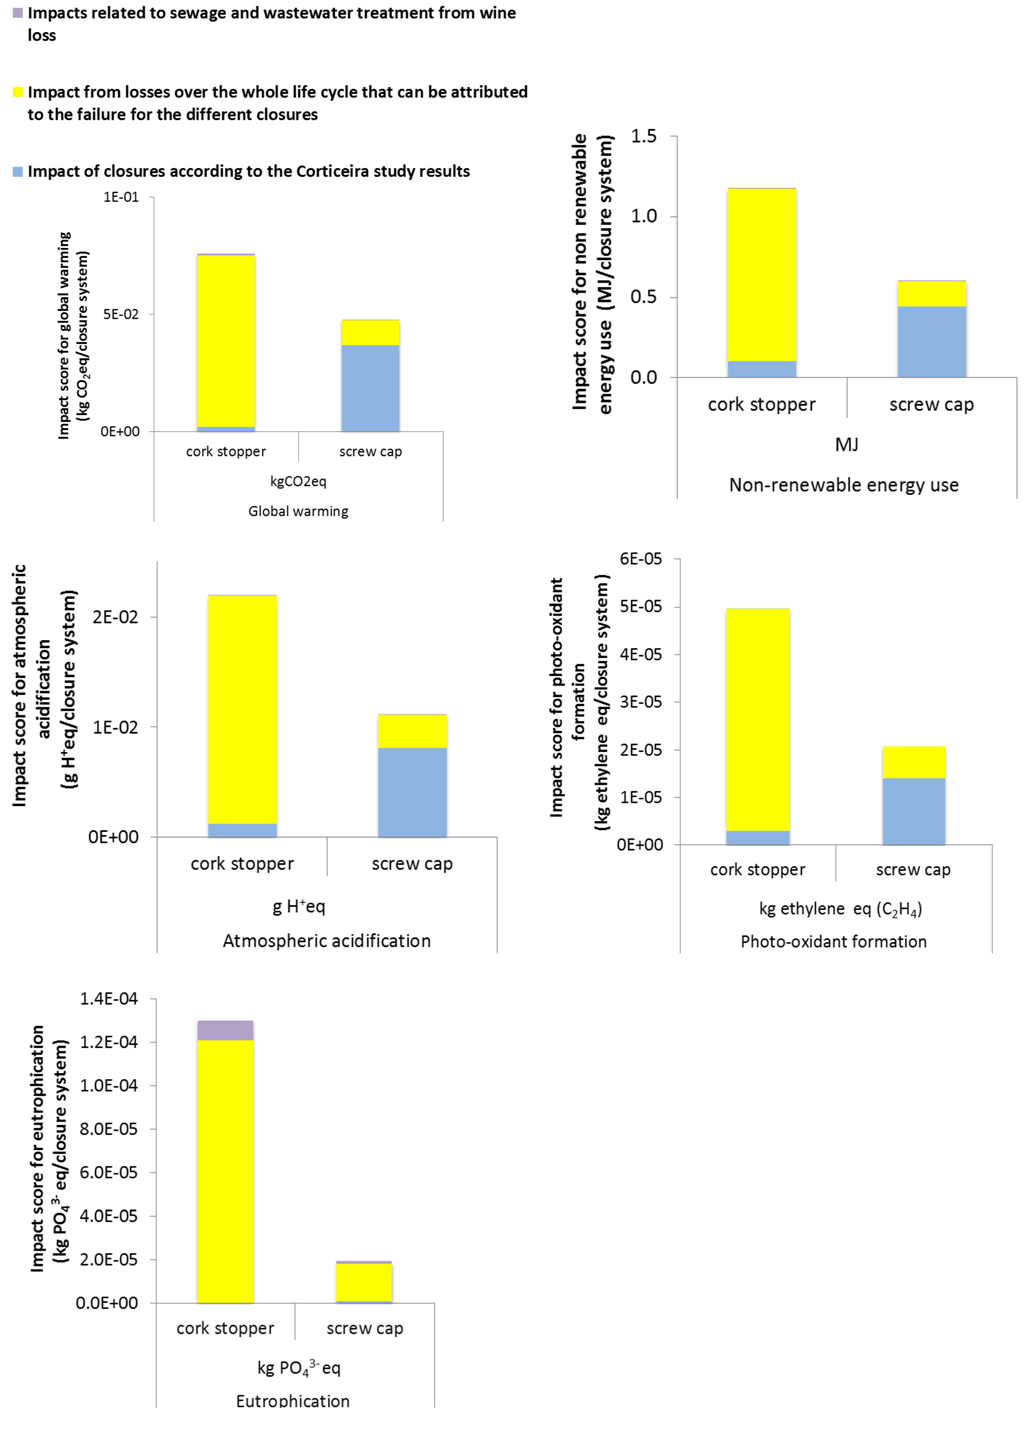
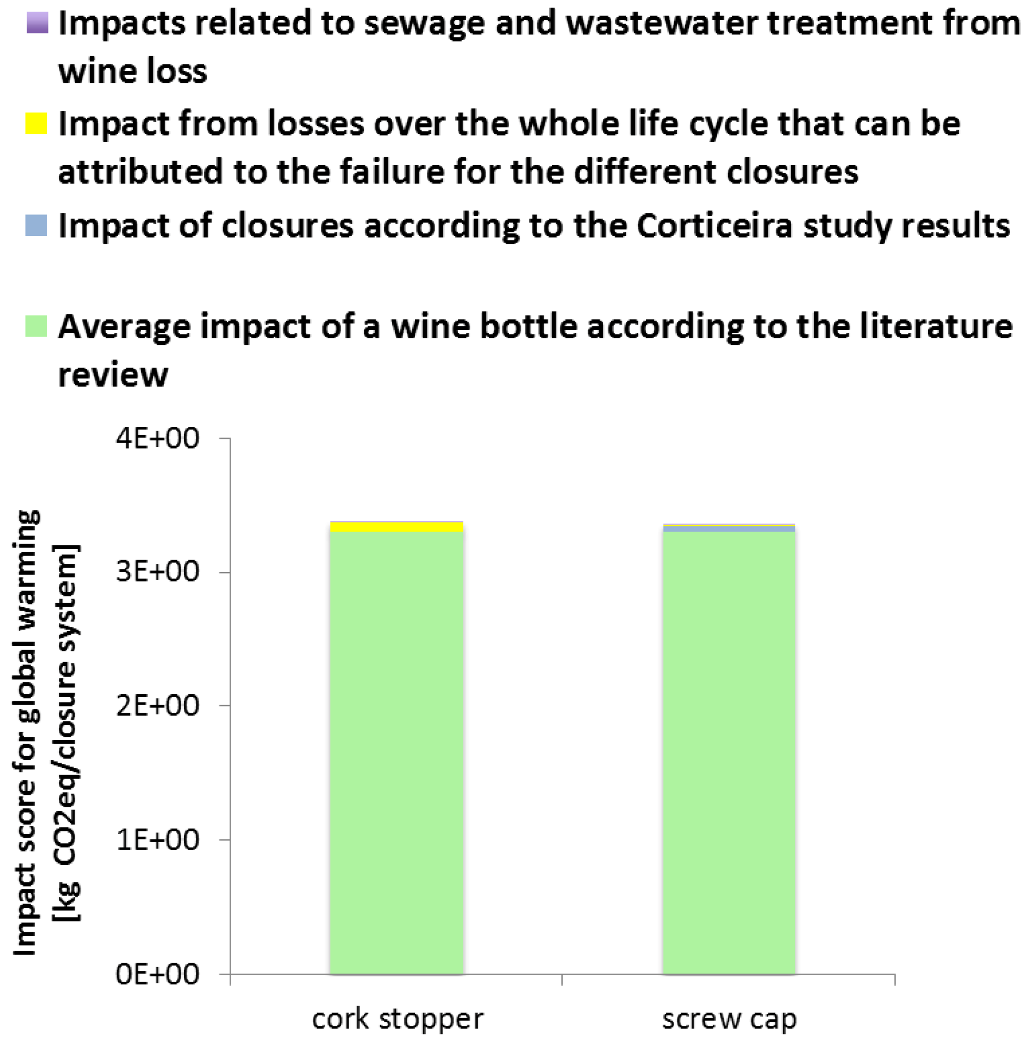
3.2. Influence of the Wine Loss Rate Due to Different Closures
- Losses at the consumer due to altered taste
- Closure impacts according to the results of the Corticeira study [17]
- Impacts related to sewage and wastewater treatment from wine loss
3.2.1. Reference Scenario


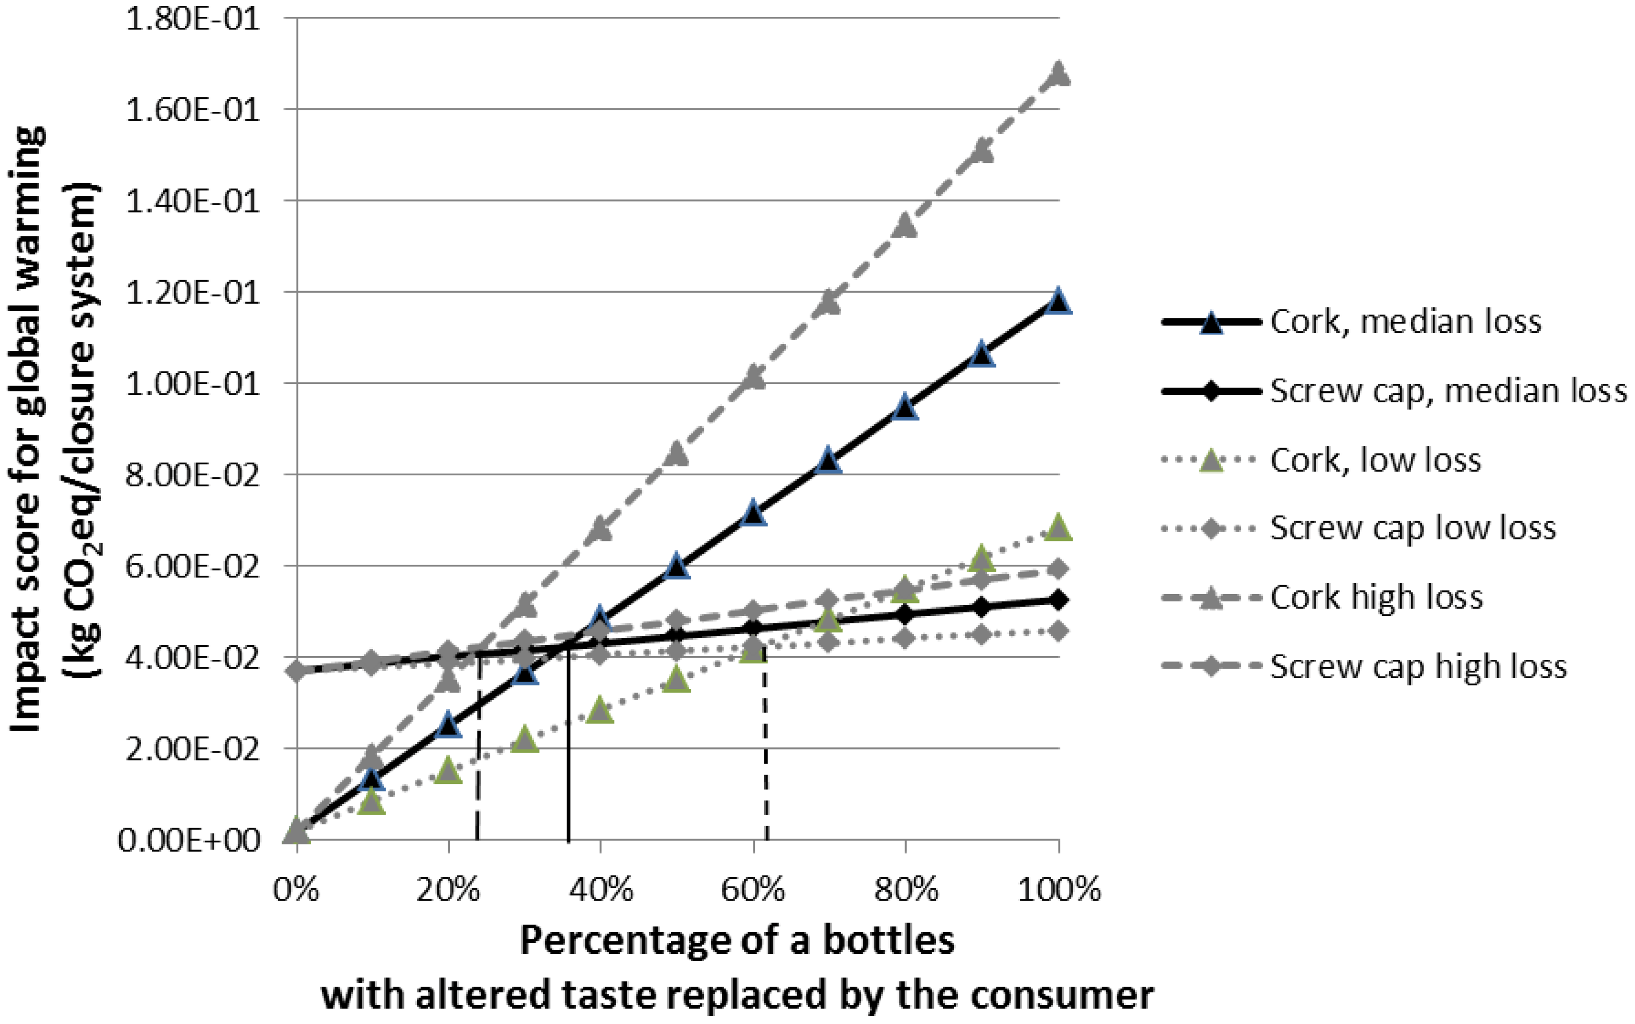
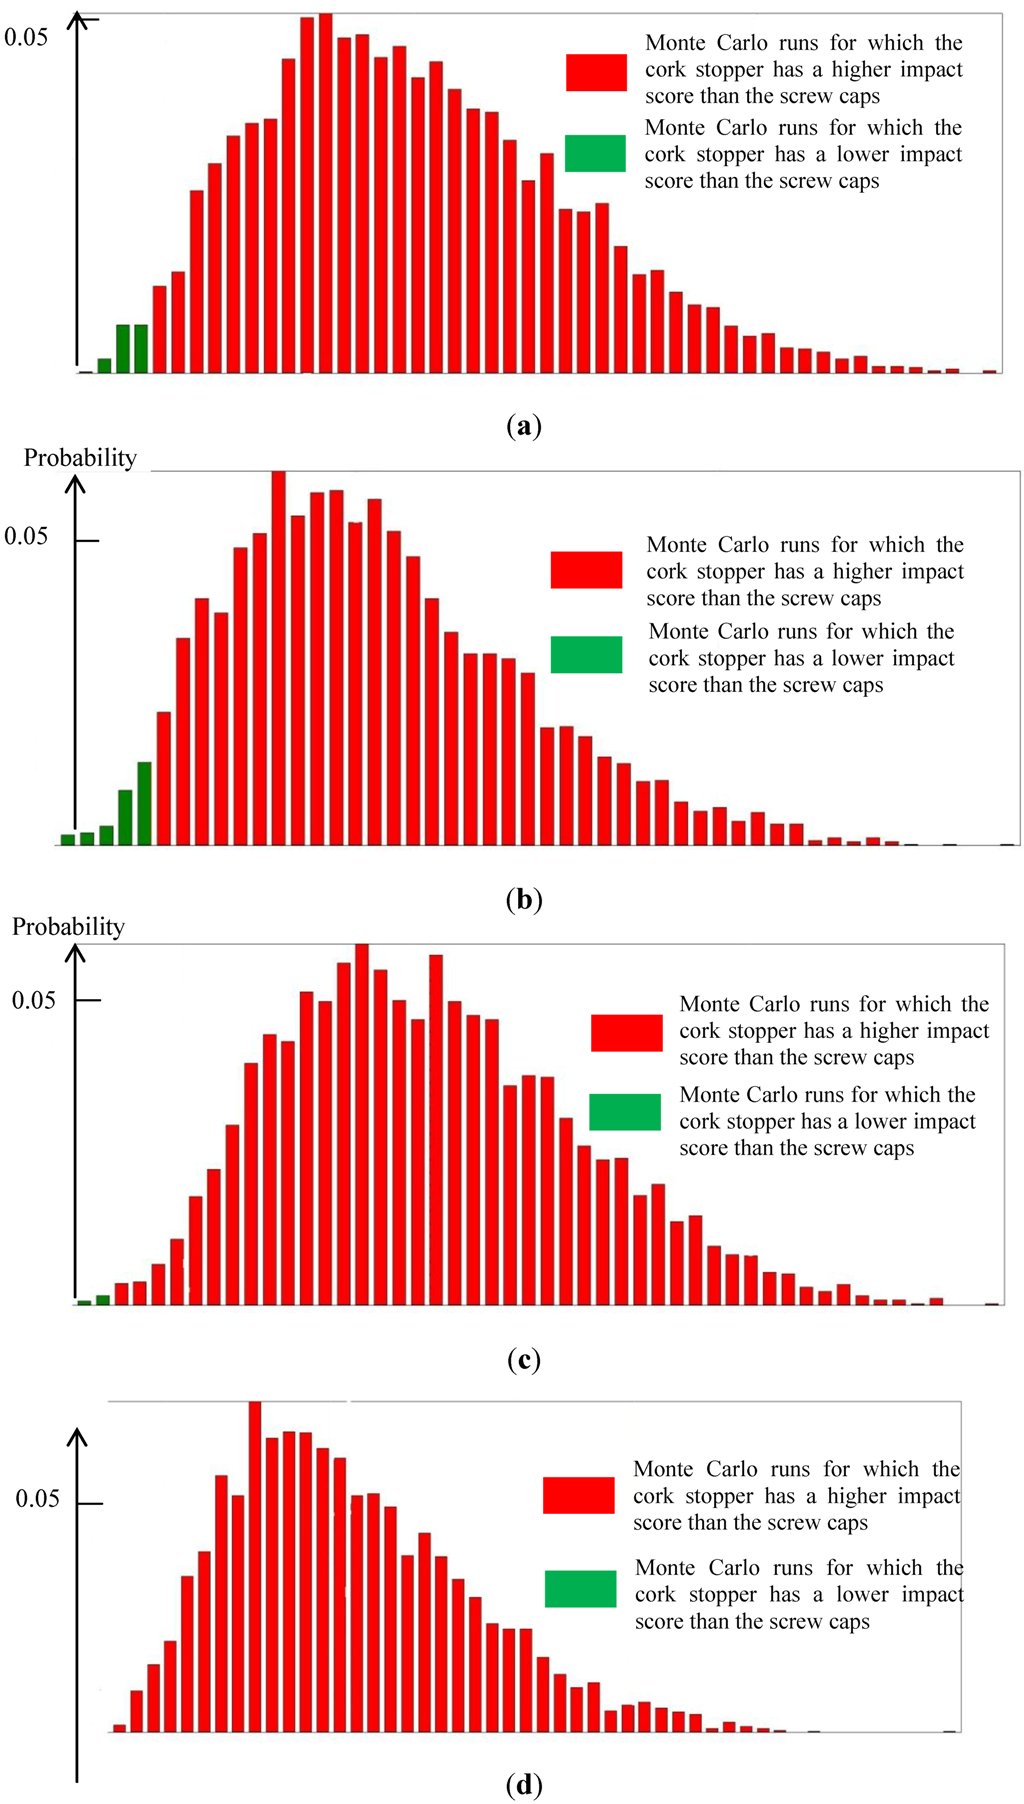
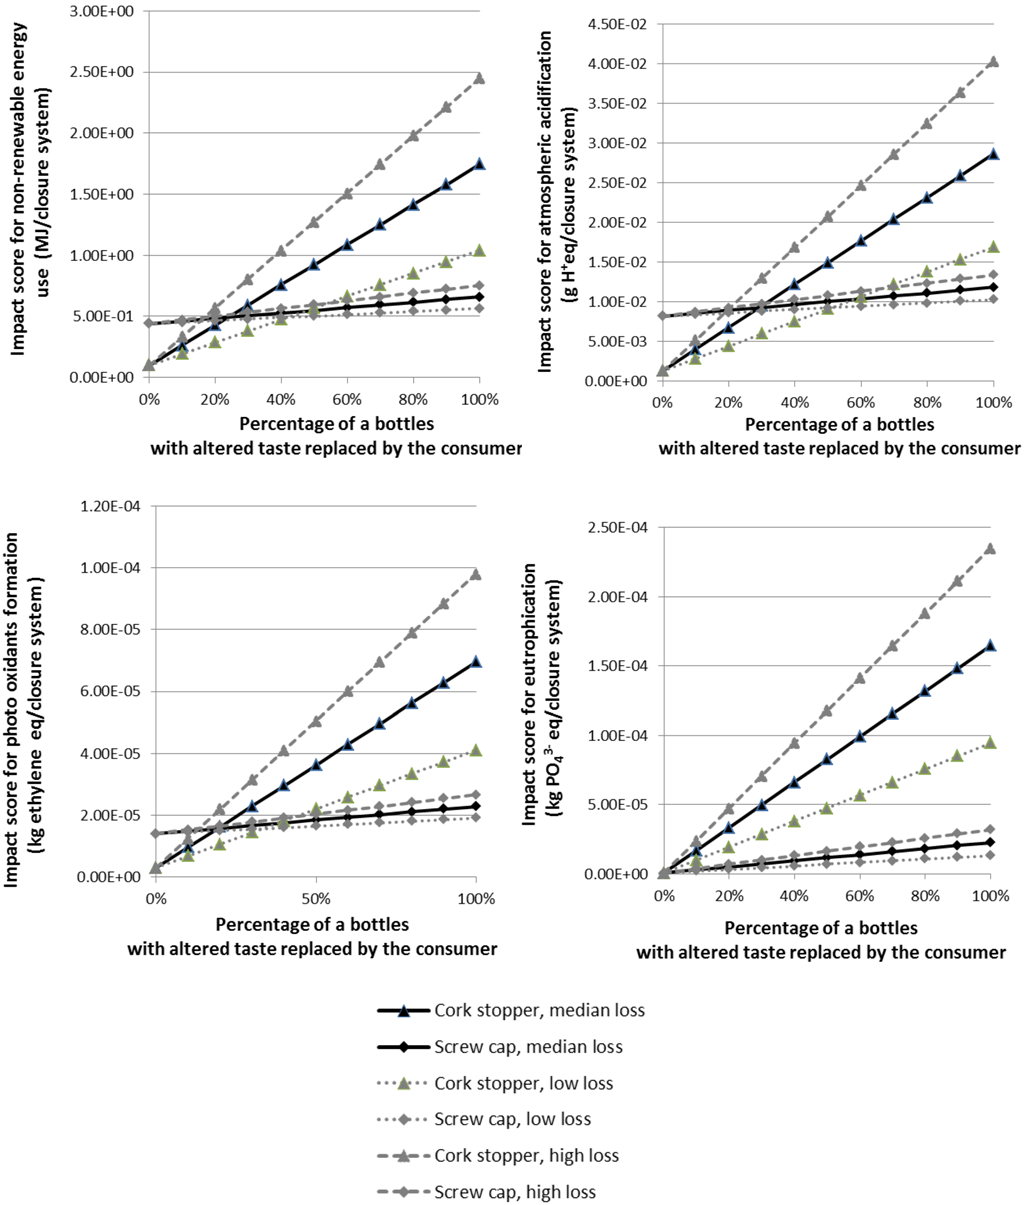
3.2.2. Sensitivity Study

3.2.3. Results Summary
| Reference scenario | Sensitivity analysis | ||
|---|---|---|---|
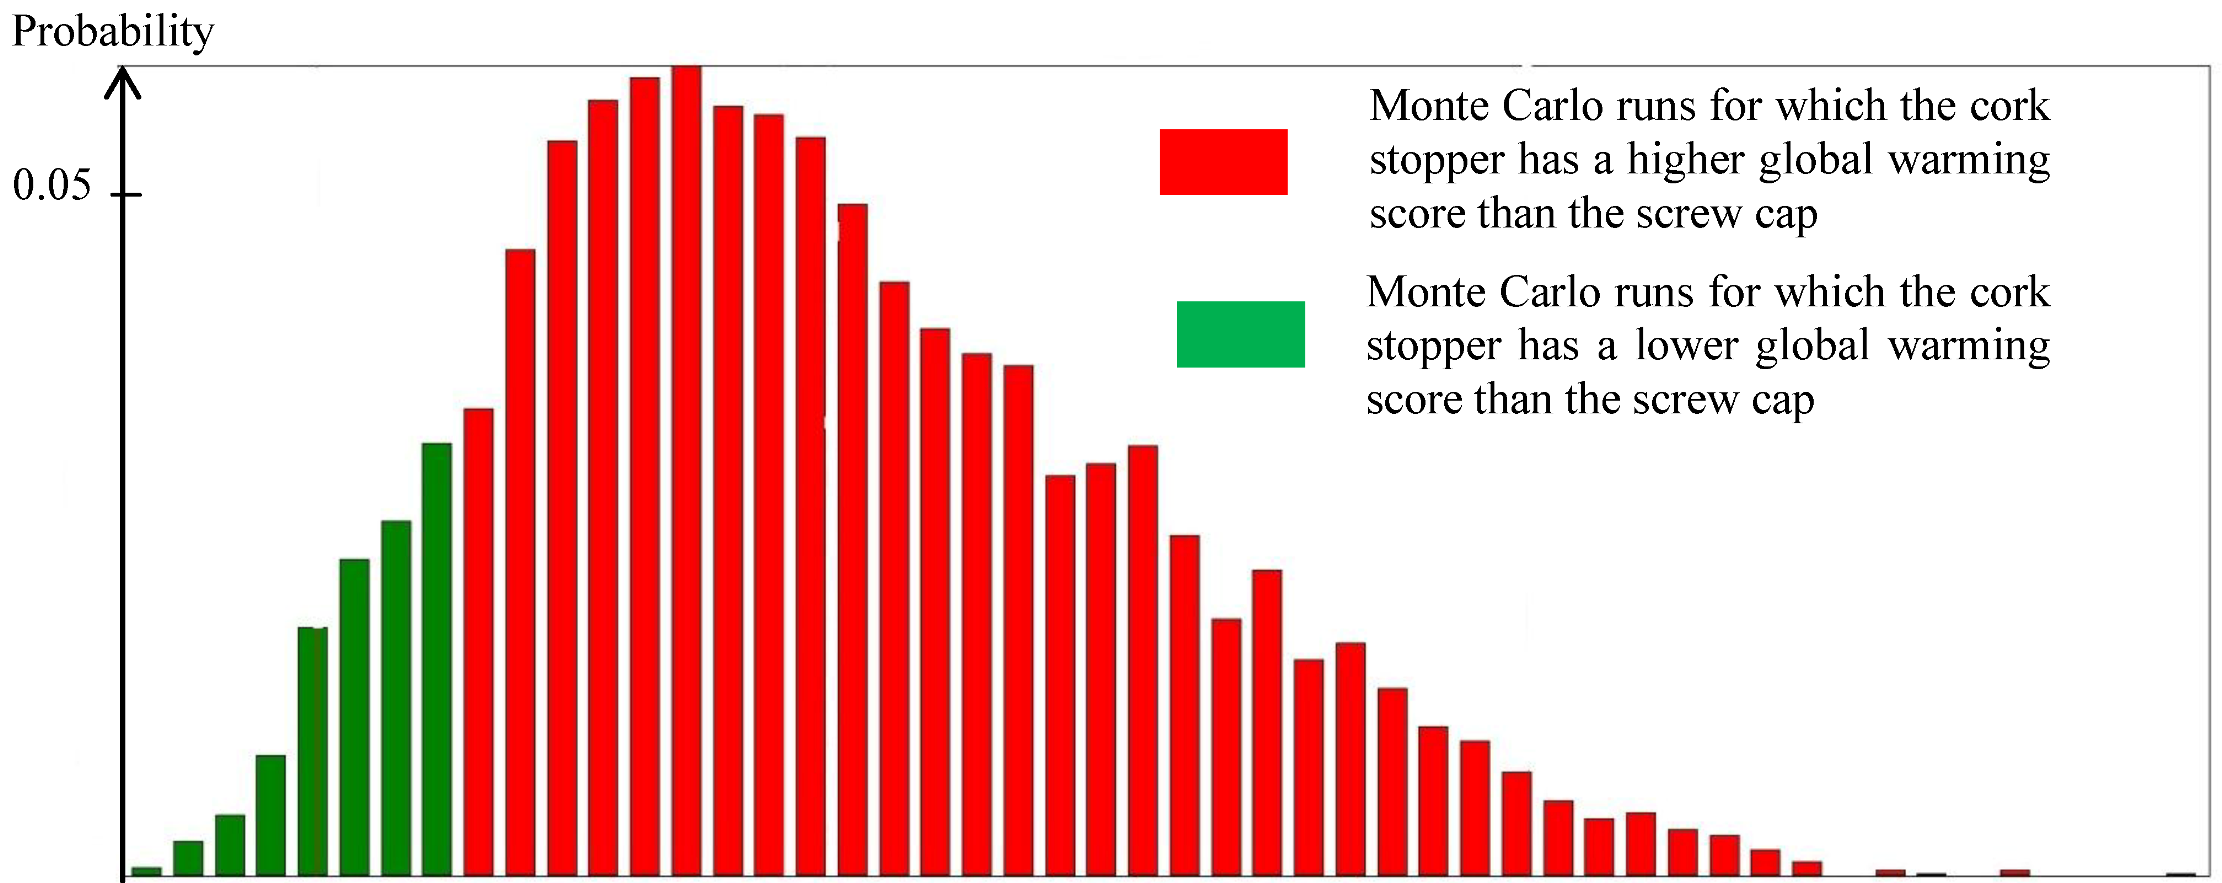
| Indicator | Monte Carlo analysis: % runs for which the impact score for cork stoppers is higher than for screw caps | Break-even replacement rates for which the impact of the screw cap is equal to the impact of the cork stopper (bottles with altered taste estimated as 3% for cork stoppers and as 0.5% for screw caps) | Break-even effective loss rates for which the impact of screw cap is equal to the impact of the cork stopper |
| Global warming (kg CO2eq) | 89.6% | 35% of consumers replace the bottle | Cork stopper: 1.2% of wine bottles |
| Screw cap: 0.16% of wine bottles | |||
| Non-renewable energy use (MJ) | 98.4% | 24% of consumers replace the bottle | Cork stopper: 0.83% of wine bottle |
| Screw cap: 0.11% of wine bottles | |||
| Atmospheric acidification (g H+ eq) | 96.9% | 29% of consumers replace the bottle | Cork stopper: 1.0% of wine bottle |
| Screw cap: 0.14% of wine bottles | |||
| Photo-oxidant formation (kg ethylene eq) | 99.8% | 19% of consumers replace the bottle | Cork stopper: 0.67% of wine bottle |
| Screw cap: 0.09% of wine bottles | |||
| Eutrophication (kg PO43-eq) | 100% | 0.07% of consumers replace the bottle | Cork stopper: 0.0026% of wine bottle |
| Screw cap: 0.00034% of wine bottles | |||
4. Discussion and Conclusions
4.1. Achievements
- The different closures and associated wine losses represent less than 5% of the total life cycle impact of bottled wine. The recently published article by Point [14] confirms that the cork stopper contribution to the total bottled wine system represents between 0.4% and 5%. Impacts related to bottled wine are composed of a several dozens of processes (Point 2008) that contribute to the global impact. While recognizing that the closure impacts are only one element of the overall system, it is only by optimizing the thousands of products and product parts that we are using in our everyday lives that we can move towards sustainability. Reducing closure-related impact represents an easily implementable impact reduction opportunity. Other system parts should also be considered (e.g., bottle production, consumer transport) for further impact reduction opportunities.
- The wine loss rate resulting from the type of closure and its specific properties is a key parameter to consider when assessing the impact of different wine closures and can result (especially for cork stoppers) in a higher impact than the closure itself. The reduction of wine closures impacts demonstrates the trade-off between the impact of closure and the associated losses.
- In the case of a cork stopper, the impact of wine loss is larger than the impact of the cork stopper production itself for all examined life cycle impact categories.
- When the impact of wine loss is considered in addition to the impact of the closure itself, the cork stopper has a higher environmental impact score than the screw cap in all impact categories, provided the effective loss rate of cork stoppers is higher than 1.2%.
- The functional unit used as a reference to estimate the environmental impacts of packaged food should represent an equivalent function among all types of packaging and thus must consider the different associated loss rates.
4.2. Limitations
4.3. Further Needs
- The estimation of wine taste alteration rates induced by the cork stoppers and screw caps can be refined in future studies by sampling wines and studying their individual taste alteration rate according to key parameters, such as the type of wine, closure or cap quality, and storage conditions.
- A comprehensive survey on consumer behavior once an altered taste has been identified is needed to better quantify replacement rates and to examine which fraction of the wine is still reused for alternative purposes such as cooking.
- Several differences linked to closure functionality or closure and bottle characteristics (e.g., the additional amount of glass which is needed to accommodate a cork stopper inside the bottle) need to be analyzed and incorporated in further studies.
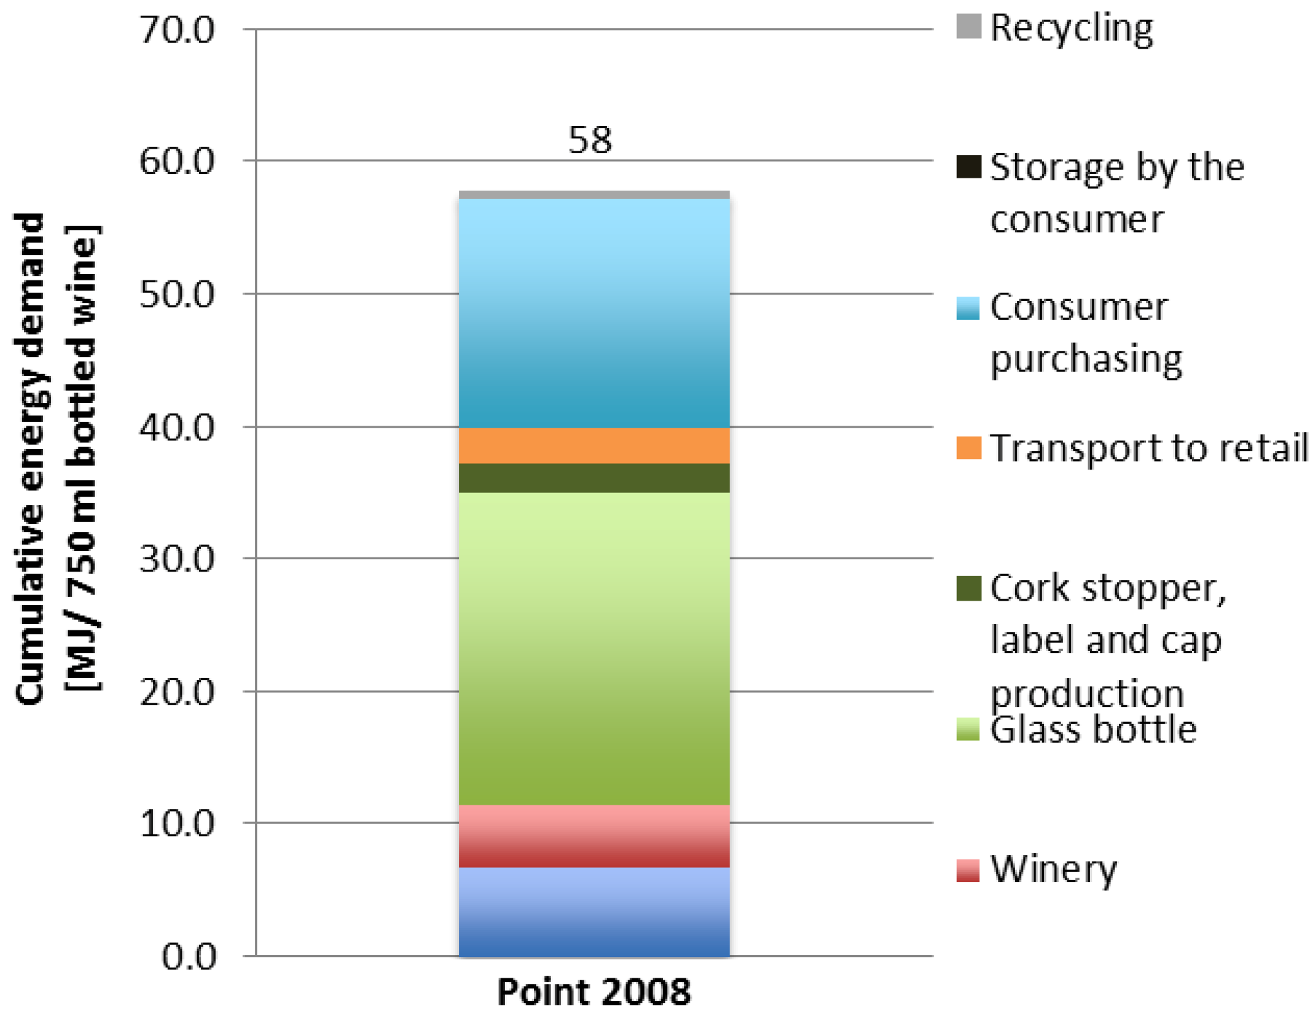
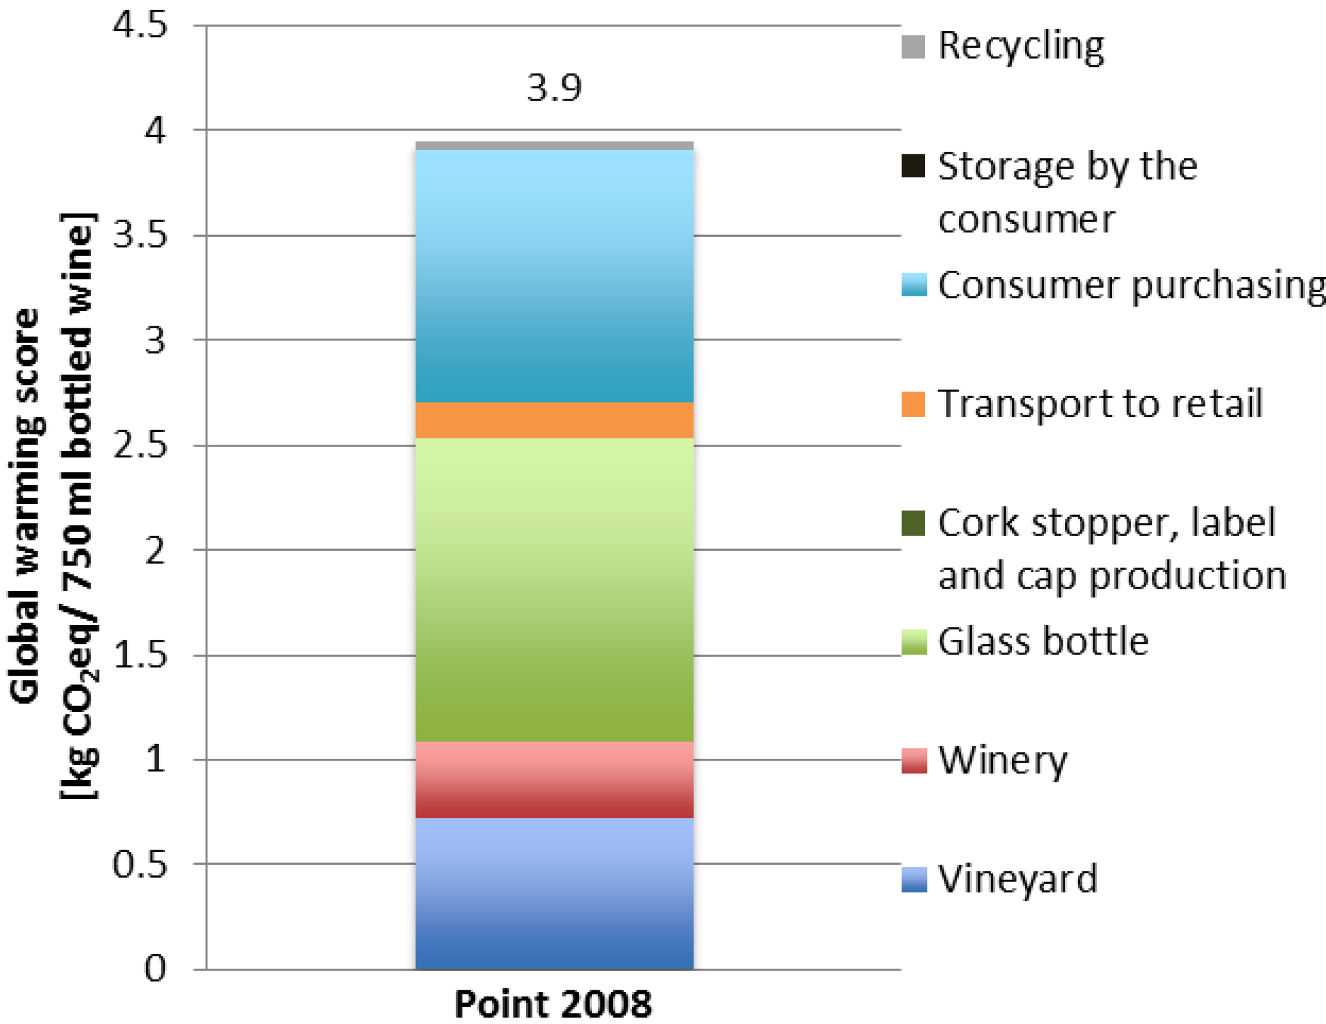
- The results shown in Figure 6 indicate that there is an opportunity to further improve the environmental performance of other components such as the glass bottle itself, the consumer purchasing trip, vineyard operations, winery processing and transportation, before focusing further on the wine closure system.
- In order to derive conclusions regarding the environmental superiority of closure systems that could be used in a comparative assertion, a comprehensive and full life cycle impact assessment of all indicators (midpoint and endpoint level) including the full functional equivalence must be carried out.
Acknowledgements
References
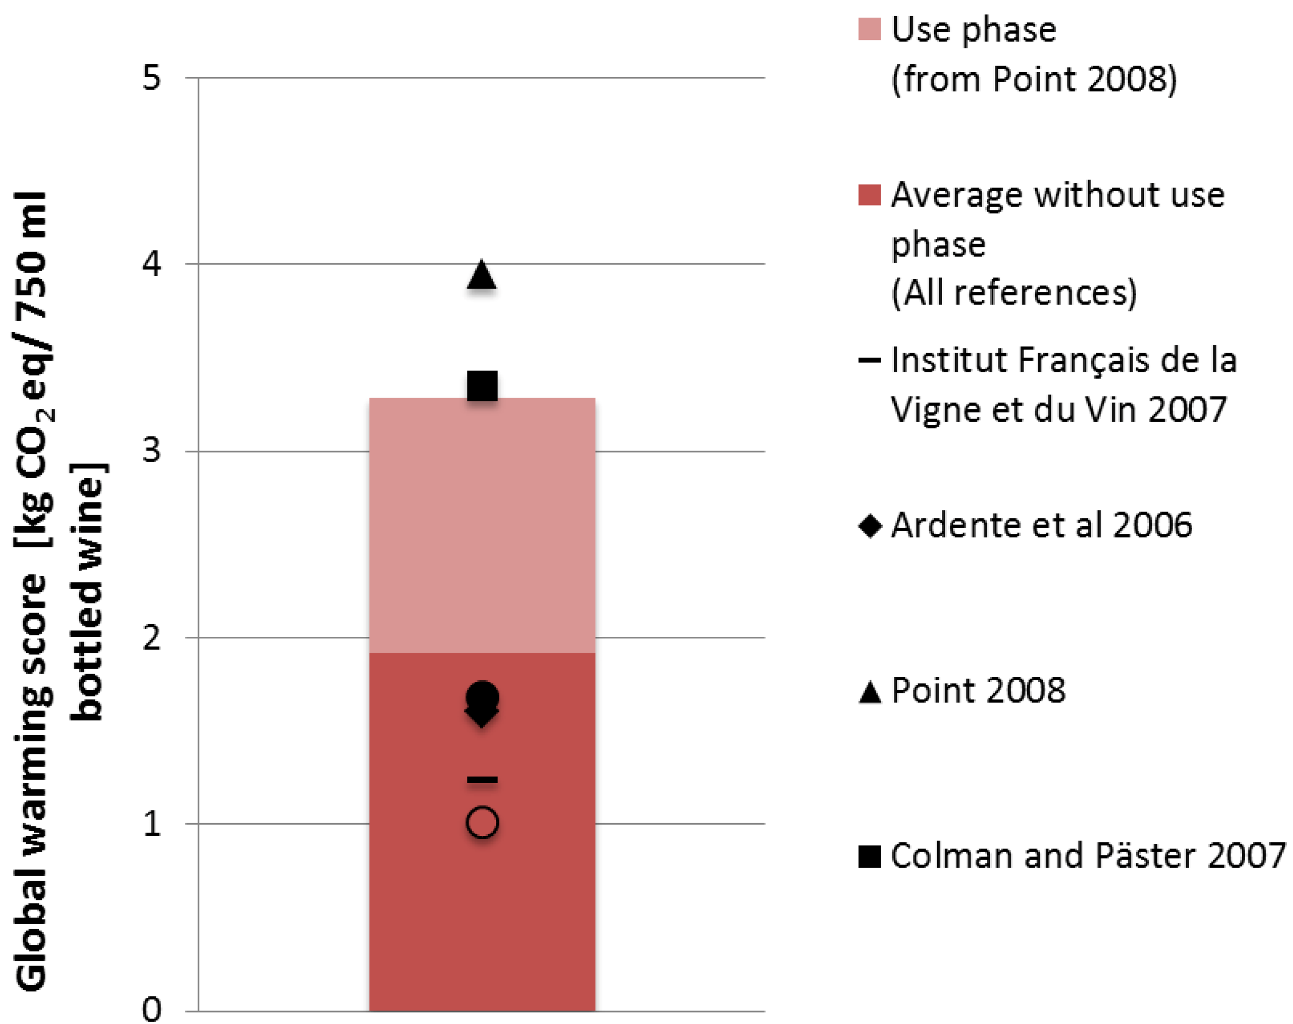
- Point, E.V. Life cycle environmental impacts of wine production and consumption in Nova Scotia, Canada. Master Thesis, Dalhousie University, Halifax, Nova Scotia, Canada, 2008. [Google Scholar]
- Aranda, A.; Zabalza, I.; Scarpellini, S. Economic and Environmental Analysis of the Wine Bottle Production in Spain by Means of Life Cycle Assessment; Indersience: Geneva, Switzerland, 2005. [Google Scholar]
- Ardente, F.; Beccali, G.; Cellura, M.; Marvuglia, A. POEMS: A case study of an Italian wine-producing firm. Environ. Manage. 2006, 38, 350–364. [Google Scholar] [CrossRef]
- Colman, T.; Paster, P. Red, White and “Green”: The Cost of Carbon in the Global Wine Trade; Working paper, American Association of Wine Economists: New York, NY, USA, 2007.
- Environmental Product Declaration. Bottled Red Sparkling Wine. Validated Environmental product declaration N° S-P-00109. Available online: http://gryphon.environdec.com/data/files/6/7505/EPD%20S-P-00109%20ingl-2008-def.pdf (accessed on 15 October 2012).
- Environmental Product Declaration, Bottled Organic Red Sparkling Wine. Validated Environmental Product Declaration N° S-P-00119. Available online: http://gryphon.environdec.com/data/files/6/7521/EPD_Fratello%20Sole_english%202008-def.pdf (accessed on 15 October 2012).
- Niccolucci, V.; Galli, A.; Kitzes, J.; Pulselli, R.M.; Borsa, S.; Marchettini, N. Ecological footprint analysis applied to the production of two Italian wines. Agr. Ecosyst. Environ. 2008, 128, 162–166. [Google Scholar] [CrossRef]
- Pizzigallo, A.C.I.; Granai, C.; Borsa, S. The joint use of LCA and emergy evaluation for the analysis of two Italian wine farms. J. Environ. Manage. 2008, 86, 396–406. [Google Scholar] [CrossRef]
- Institut Français de la Vigne et du Vin. Bilan carbone: de la vigne a la bouteille. 2007. Presentation. Available online: http://www.vignevin-sudouest.com/publications/itv-colloque/documents/COLLOQUE_bilan-carbone-vigne-bouteille.pdf (accessed on 15 October 2012).
- Gonzalez, A.; Klimchuk, A.; Martin, M. Life Cycle Assessment of Wine Production Process: Finding Relevant Process Efficiency and Comparison with Eco-Wine Production; Report, Royal Institute of Technology: Stockholm, Sweden, 2006.
- Pattara, C.; Raggi, A.; Cichelli, A. Life cycle assessment and carbon footprint in the wine supply-chain. Environ. Manage. 2012, 49, 1247–1258. [Google Scholar] [CrossRef]
- Gazulla, C.; Raugei, M.; Fullana-i-Palmer, P. Taking a life cycle look at crianza wine production in Spain: Where are the bottlenecks? Int. J. Life. Cycle. Ass. 2010, 15, 330–337. [Google Scholar] [CrossRef]
- Bosco, S.; Di Bene, C.; Galli, M.; Remorini, D.; Massai, R.; Bonari, E. Greenhouse gas emissions in the agricultural phase of wine production in the Maremma rural district in Tuscany, Italy. Ital. J. Agron. 2011, 6, 93–100. [Google Scholar]
- Point, E.; Tyedmers, P.; Naugler, C. Life cycle environmental impacts of wine production and consumption in Nova Scotia, Canada. J. Clean. Prod. 2012, 27, 11–20. [Google Scholar] [CrossRef]
- Vázquez-Rowe, I.; Villanueva-Rey, P.; Moreira, M.T.; Feijoo, G. Environmental analysis of Ribeiro wine from a timeline perspective: Harvest year matters when reporting environmental impacts. J. Environ. Manage. 2012, 98, 73–83. [Google Scholar] [CrossRef]
- WWF, Cork Screwed? Environmental and Economic Impacts of the Cork Stoppers Market; Report, WWF: Rome, Italy, 2006.
- Corticeira Amorim, Evaluation of the Environmental Impacts of Cork Stoppers versus Aluminium and Plastic Closures; Final Report, Corticeira Amorim: Mozelos, Portugal, 2008.
- Boudaoud, N.; Eveleigh, L.; Ruledge, D. Reconnaissance des Arômes et Nez Électronique. Ingénierie Analytique pour la Qualité des Aliments; Report; Institut National de Recherche en Agronomie (INRA): Versailles, France, 2003. [Google Scholar]
- Marin, A.; Jorgensen, E.; Kennedy, J.; Ferrier, J. Effects of bottle closure type on consumer perceptions of wine quality. Am. J. Enol. Viticult. 2007, 58, 182–191. [Google Scholar]
- Forum oenologie. Available online: http://www.oenologie.fr/ (accessed on 15 October 2012).
- European Commission, Joint Research Center, Institute for Environment and Sustainability. International Reference Life Cycle Data System (ILCD) Handbook—Framework and Requirements for Life Cycle Impact Assessment Models and Indicators; Publications Office of the European Union: Luxembourg, Luxembourg, 2010.
- Riboulet, J.-M. Goût de bouchon: Le point sur les origines et les recherches. Rev. Oenolog. 2003, 53, 41–43. [Google Scholar]
- Moreau, M. Les moisissures des bouchons. Acad. Agric. Fr. C. R. 1978, 64, 842–849. [Google Scholar]
- Davis, C.; Fleet, G.; Lee, T. The microflora of wine cork. Aust.Grape Wine 1981, 208, 42–44. [Google Scholar]
- Chatonnet, P. Etude de l’Australian Wine Research Institute sur les caractéristiques physico-mécaniques de différents obturateurs et la modification de la composition d’un vin blanc après 18 mois de conservation. Rev. Oenolog. 2002, 29, 11–16. [Google Scholar]
- Lumia, G.; Perre, C. Les fluides supercritiques, une innovation au service du liège, Partie 1/2. Rev. Oenolog. 2005, 32, 12–15. [Google Scholar]
- Lumia, G.; Aracil, J.M. Les fluides supercritiques, une innovation au service du liège, Partie 2/2. Rev. Oenolog. 2006, 33, 13–16. [Google Scholar]
- Descout, J. Evolution des connaissances sur le bouchage en liège des vins, les bouchons composites. Rev. Oenolog. 2008, 35, 28–31. [Google Scholar]
- MIS Trend. Etude sur le Marché du Vin en Suisse: Notoriété, Habitudes de Consommation et d'Achat, Image; Report; MIS Trend: Lausanne, Switzerland, 2008. Available online: http://www.mistrend.ch/articles/La_viticulture_suisse.pdf/ (accessed on 15 October 2012).
- Struijs, J. SimpleTreat 3.0: A Model to Predict the Distribution and Elimination of Chemicals by Sewage Treatment Plants; Report; National Institute of Public Health and the Environment: Bilthoven, The Netherlands, 1996.
- VROM, Protocol 8136 Afvalwater, t.b.v NIR 2008 uitgave maart 2008 6B: CH4 en N2O uit Afvalwater; Directie Klimaatverandering en Industrie: The Hague, the Netherlands, 2008.
- Daelman, M.; van Voorthuizen, E.; van Dongen, U.; Volcke, E.; van Loosdrecht, M. Methane emission during municipal wastewater treatment. Water Res. 2012, 46, 3657–3670. [Google Scholar] [CrossRef]
- IPCC, Contribution of Working Group I to the Fourth Assessment Report of the Intergovernmental Panel on Climate Change; Cambridge University Press: Cambridge, UK, 2007.
- Humbert, S.; Margni, M.; Jolliet, O. IMPACT 2002+: Methodology Description, Draft for Version 2.1, unpublished work.
Supporting Information
S1. Literature Review on Wine Environmental Impacts
| Author | Year | Scope | Functional unit | Global warming (kg/functional unit) | Non-renewable energy use (MJ/functional unit) | Others |
|---|---|---|---|---|---|---|
| Aranda et al. [1] | 2005 | Cultivation, delivery, winery, packaging, transportation, packaging elimination. Processing waste excluded | 0.75 liter of wine | - | - | Human health, Ecosystem quality and Resources |
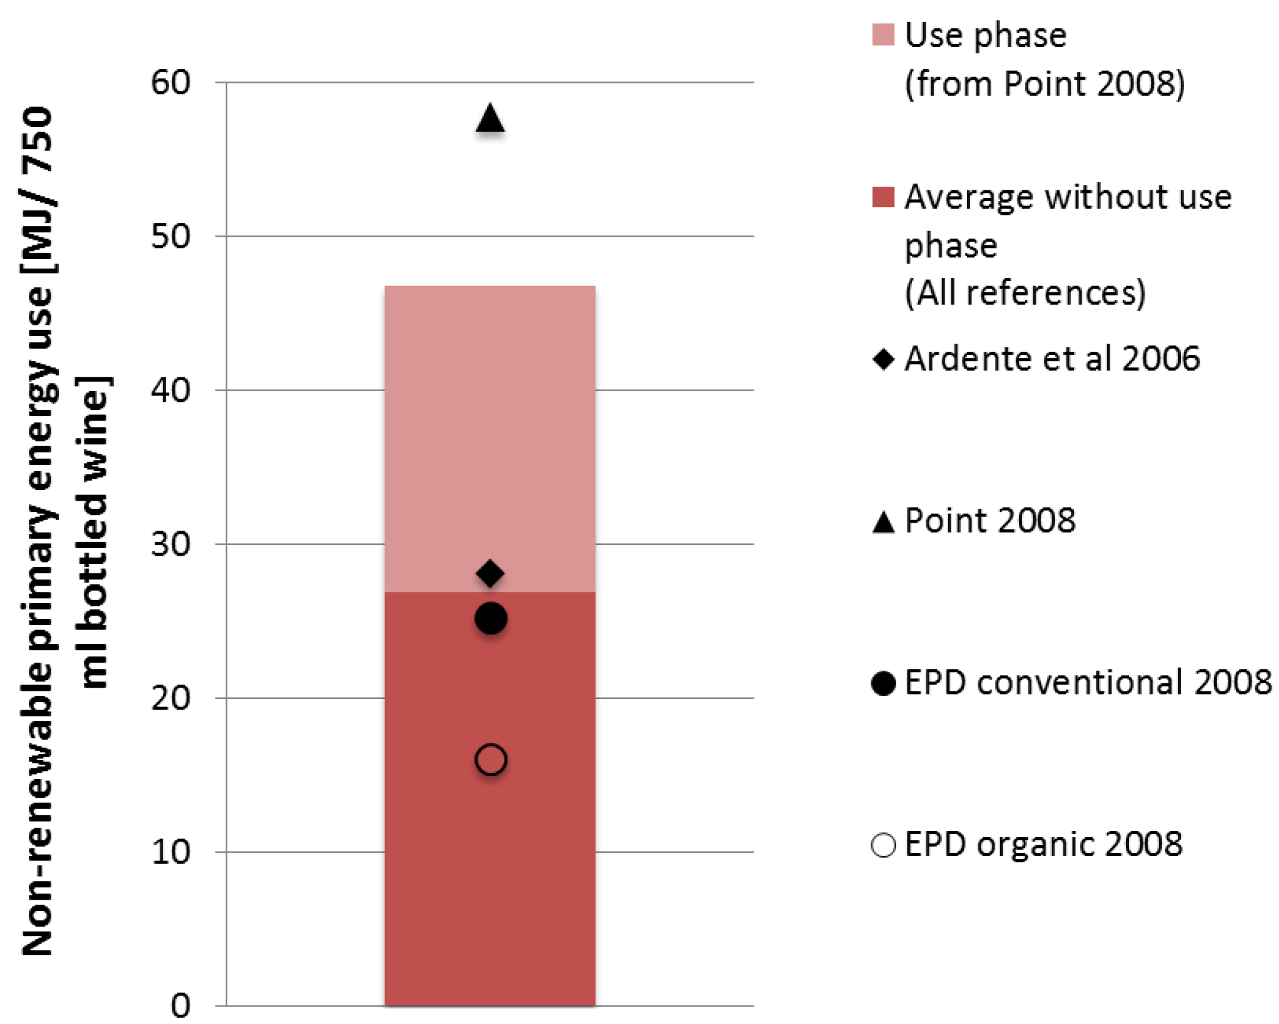
| Ardente et al. [2] | 2006 | Cultivation, delivery, winery, packaging, transport (to retail, truck in EU, ship overseas). Elimination not included | 0.75 liter of red wine | 1.6 | 28.1 | Solid waste generated |
| Colman and Päster [3] | 2007 | Vineyard, winery, packaging and distribution in US | 0.75 liter of wine | 3.35 | - | - |
| EPD conventional [4] | 2008 | Cultivation, delivery, winery, packaging, transportation, packaging elimination. Production waste excluded | 1 liter of Grasparossa Righi, sparkling red wine | 2.24 | - | Ozone depletion, Acidification, Eutrophication, Photochemical Photo-oxidant formation |
| EPD organic [5] | 2008 | Cultivation, delivery, winery, packaging, transportation, packaging elimination. Production waste excluded | 1 liter of organic lambrusco Grasparossa “Fratello Sole”, sparkling red wine | 1.35 | - | Ozone depletion, Acidification, Eutrophication, Photo-chemical oxidant formation |
| Gonzalez et al. [6] | 2006 | Cultivation, delivery, winery, packaging, transportation, packaging elimination | 1 liter of wine (glass bottle, cork stopper) | - | - | Graphic normalized midpoints results in point |
| Institut Français de la Vigne et du Vin [7] | 2007 | Cultivation, delivery, winery, packaging, transportation, packaging elimination | 1 bottle unit | 1.24 | - | - |
| Niccolucci et al. [8] | 2008 | Cultivation, delivery, winery, packaging | 1 ton of wine produced; 1 bottle of wine, 1 global hectare equivalent (gha) of a vineyard | - | - | Ecological footprint |
| Pizzigallo et al. [9] | 2006 | Cultivation, delivery, winery, packaging, transportation, packaging elimination | 1 ton of wine | - | - | 3.08E+15 sej organic farm 4.17E+15 sej semi-industrial farm sej = solar emjoules |
| Point [10] | 2008 | Cultivation, delivery, winery, packaging, transportation (to retail, consumer), refrigeration, packaging elimination. Infrastructure not included | 0.75 liter of wine | 3.95 | 57.8 | Abiotic resources depletion, Acidification potential, Eutrophication, Ozone depletion, Aquatic ecotoxicity, Terrestrial ecotoxicity, Photo--oxidant formation |
S1.1. Global Warming Score

S1.2. Non-Renewable Primary Energy Use


S1.3. Contribution to Atmospheric Acidification

S1.4. Contribution to the Formation of Photo-Oxidant
S1.5. Contribution to the Eutrophication of Surface Water
S2. References for Wine Taste Alteration Rate Estimation
- French federation of cork syndicates (Jean-Marie Aracil): 0.7%
- Australian Wine Research Institute (AWRI): 2-5.5%
- Vectoeur, a scientific laboratory for wine: 4%
- Oeneo, wine closure producer: 5%
- Korked, wine closure producer (Giovanni Capello): 3-5%
- University of Applied Sciences Changins (Christian Maurer): 2-4%
- University of Bordeaux (Pierre-Louis Teissedre): 1-2%
- Excell laboratory for closure quality control (Pascal Chatonnet): 10 times less than cork stoppers
- University of Applied Sciences Changins (Christian Maurer): minimum 5 times less than cork stoppers
- Cork stoppers: 2-5%
- Screw caps: 5-10 times less than cork stoppers, with the most probable value selected as 7.5 times less (0.3-0.7%)
S3. Estimation of the Life Cycle Stage at which the Failure Originated
| Closure type | Estimated fraction of wine taste alteration at consumer | ||
|---|---|---|---|
| Cork stopper | Screw cap | ||
| Stage at which the failure occurs and results in an altered taste or smell | Closure manufacture | 4/10 | 2/10 |
| Poor sorting, poor raw material quality | Inappropriate liner choice | ||
| Delivery | 1/10 | 1/10 | |
| Poor transport and storing conditions | |||
| Winery operations | 2/10 | 5/10 | |
| Poor storing of closures, poor calibration of the bottling machinery | |||
| Distribution | 1/10 | 1/10 | |
| Transport in inappropriate conditions (such as inappropriate temperature, sun exposure, humidity, etc.) | |||
| Consumer | 2/10 | 1/10 | |
| Conservation problem (such as storage over a long period of time) | |||
| Total wine taste alteration | 2%-5% | 0.3% -0.7% | |
S4. Estimations for the Wine Disposal Model
S4.1. Calculation of the Initial Carbon Mass

S4.2. Input and Output Parameters for SimpleTreat 3.1 Model
| Substance Identification | |
| General name | ethanol |
| CAS no. | 64-17-5 |
| Physical-Chemical Substance Properties | |
| Molecular weight | 46.07 g.mol-1 |
| Melting point | -87.84 oC |
| Vapour pressure at the temperature of the data set | 7.9E+03 Pa |
| Temperature at which vapour pressure was measured | 25 oC |
| Water solubility at the temperature of the data set | 1.0E+06 mg.L-1 |
| Temperature at which solubility was measured | 25 oC |
| Octanol-water partition coefficient | 4.9E-01- |
| Chemical class for Koc-QSAR | Alcohols- |
| Organic carbon-water partition coefficient | 1.58E+00 L.kg-1 |
| Degradation and Transformation Rates | |
| Characterization | |
| Biodegradability test result | readily biodegradable- |
| Rate constant for degradation in STP | d-1 |
| Total rate constant for degradation in surface water at env. temp | 8.0E-02 d-1 |
| Total rate constant for degradation in marine water at env. temp | d-1 |
| Total rate constant for degradation in bulk sediment at env. temp | 8.9E-03 d-1 |
| Rate constant for degradation in air | 2.1E-01 d-1 |
| Total rate constant for degradation in bulk soil at env. temp | 4.0E-02 d-1 |
| Summary of distribution | |
|---|---|
| to air | 0.1 |
| to water | 12.6 |
| via primary sludge | 0.0 |
| via surplus sludge | 0.0 |
| degraded | 87.3 |
| total | 100.0 |
S4.3. Calculation of Chemical Oygen Demand/Total Organic Carbon Ratio

S5. Reference Scenario: Uncertainty Analysis Parameters and Results


 is the impact score associated with the production of the closure and
  is the impact of 750 mL of wine.
 is a multiplication factor.
 : triangular distribution specified in Table S5
 : 3% with uniform distribution (minimum: 2%, maximum: 5%)
 : 77% with triangular distribution (minimum: 50%, maximum: 100%)
 : triangular distribution specified in Table S5
 : triangular distribution specified in Table S5: 0.13 times with a triangular distribution (minimum: 0.1, maximum: 0.2, which corresponds to the expert estimate that the impact of screw caps is 5-10 less than cork stoppers), and . The uncertainty on the closure impact is based on uncertainty factors (dimensionless) used for the development of ecoinvent v1.1 applied for technosphere inputs and outputs [14].
| Impact category | Type of closure | Literature review average impact scores results for typical bottled wine | Uncertainty on stopper impact | Impact of closure based on the Corticeira Amorim study | ||||
|---|---|---|---|---|---|---|---|---|
| minimum | average | maximum | minimum | average | maximum | |||
| Global warming (kg CO2eq) | Cork stoppers | 1.0 | 3.3 | 4.0 | +/-20% | 1.6E-3 | 2.0E-3 | 2.4E-3 |
| Screw caps | 3.0E-2 | 3.7E-2 | 4.4E-2 | |||||
| Non-renewable energy use (MJ) | Cork stoppers | 16 | 47 | 58 | +/-20% | 8.0E-2 | 1.0E-1 | 1.2E-1 |
| Screw caps | 3.5E-1 | 4.4E-1 | 5.3E-1 | |||||
| Atmospheric acidification (g H+eq) | Cork stoppers | 0.27 | 0.78 | 1.3 | +/-40% | 7.8E-4 | 1.3E-3 | 1.82E-3 |
| Screw caps | 4.9E-3 | 8.2E-3 | 1.2E-2 | |||||
| Photo-oxidant formation (kg ethylene eq) | Cork stoppers | 1.1E-3 | 1.9E-3 | 2.3E-3 | +/-60% | 1.2-6 | 3.0E-6 | 4.8E-6 |
| Screw caps | 5.6E-6 | 1.4E-5 | 2.2E-5 | |||||
| Eutrophication (kg PO43- eq) | Cork stoppers | 1.4E-3 | 4.5E-3 | 7.8E-3 | +/-60% | 2.4E-7 | 6.0E-7 | 9.6E-7 |
| Screw caps | 2.8E-7 | 7.0E-7 | 1.1E-6 | |||||

S6. Sensitivity Analysis: Break-Even Replacement and Effective Loss Rate Determination
 =
=  , which is calculated as follows:

References
References
- Aranda, A.; Zabalza, I.; Scarpellini, S. Economic and Environmental Analysis of the Wine Bottle Production in Spain by Means of Life Cycle Assessment; Indersience: Geneva, Switzerland, 2005. [Google Scholar]
- Ardente, F.; Beccali, G.; Cellura, M.; Marvuglia, A. POEMS: A case study of an Italian wine-producing firm. Environ. Manage. 2006, 38, 350–364. [Google Scholar] [CrossRef]
- Colman, T.; Paster, P. Red, White and “Green”: The Cost of Carbon in the Global Wine Trade; Working paper, American Association of Wine Economists: New York, NY, USA, 2007.
- Environmental Product Declaration. Bottled Red Sparkling Wine. Validated Environmental product declaration N° S-P-00109. Available online: http://gryphon.environdec.com/data/files/6/7505/EPD%20S-P-00109%20ingl-2008-def.pdf (accessed on 15 October 2012).
- Environmental Product Declaration, Bottled Organic Red Sparkling Wine. Validated Environmental Product Declaration N° S-P-00119. Available online: http://gryphon.environdec.com/data/files/6/7521/EPD_Fratello%20Sole_english%202008-def.pdf (accessed on 15 October 2012).
- Gonzalez, A.; Klimchuk, A.; Martin, M. Life Cycle Assessment of Wine Production Process: Finding Relevant Process Efficiency and Comparison with Eco-Wine Production; Report, Royal Institute of Technology: Stockholm, Sweden, 2006.
- Institut Français de la Vigne et du Vin. Bilan carbone: de la vigne a la bouteille. 2007. Available online: http://www.vignevin-sudouest.com/publications/itv-colloque/documents/COLLOQUE_bilan-carbone-vigne-bouteille.pdf (accessed on 15 October 2012).
- Niccolucci, V.; Galli, A.; Kitzes, J.; Pulselli, R.M.; Borsa, S.; Marchettini, N. Ecological footprint analysis applied to the production of two Italian wines. Agr. Ecosyst. Environ. 2008, 128, 162–166. [Google Scholar] [CrossRef]
- Pizzigallo, A.C.I.; Granai, C.; Borsa, S. The joint use of LCA and emergy evaluation for the analysis of two Italian wine farms. J. Environ. Manage. 2008, 86, 396–406. [Google Scholar] [CrossRef]
- Point, E.V. Life cycle environmental impacts of wine production and consumption in Nova Scotia, Canada. Master Thesis, Dalhousie University, Halifax, Nova Scotia, Canada, 2008. [Google Scholar]
- Boudaoud, N.; Eveleigh, L.; Ruledge, D. Reconnaissance des Arômes et Nez Électronique. Ingénierie Analytique pour la Qualité des Aliments; Report, Institut National de Recherche en Agronomie (INRA): Versailles, France, 2003.
- Marin, A.; Jorgensen, E.; Kennedy, J.; Ferrier, J. Effects of bottle closure type on consumer perceptions of wine quality. Am. J. Enol. Viticult. 2007, 58, 182–191. [Google Scholar]
- Struijs, J. SimpleTreat 3.0: A Model to Predict the Distribution and Elimination of Chemicals by Sewage Treatment Plants; Report, National Institute of Public Health and the Environment: Bilthoven, The Netherlands, 1996.
- Frischknecht, R.; Jungbluth, N.; Althaus, H.; Doka, G.; Dones, R.; Heck, T.; Hellweg, S.; Hischier, R.; Nemecek, T.; Rebitzer, G.; et al. The ecoinvent database: overview and methodological framework. Int. J. Life. Cycle. Ass. 2005, 10, 3–9. [Google Scholar] [CrossRef]
© 2012 by the authors; licensee MDPI, Basel, Switzerland. This article is an open-access article distributed under the terms and conditions of the Creative Commons Attribution license (http://creativecommons.org/licenses/by/3.0/).
Share and Cite
Kounina, A.; Tatti, E.; Humbert, S.; Pfister, R.; Pike, A.; Ménard, J.-F.; Loerincik, Y.; Jolliet, O. The Importance of Considering Product Loss Rates in Life Cycle Assessment: The Example of Closure Systems for Bottled Wine. Sustainability 2012, 4, 2673-2706. https://doi.org/10.3390/su4102673
Kounina A, Tatti E, Humbert S, Pfister R, Pike A, Ménard J-F, Loerincik Y, Jolliet O. The Importance of Considering Product Loss Rates in Life Cycle Assessment: The Example of Closure Systems for Bottled Wine. Sustainability. 2012; 4(10):2673-2706. https://doi.org/10.3390/su4102673
Chicago/Turabian StyleKounina, Anna, Elisa Tatti, Sebastien Humbert, Richard Pfister, Amanda Pike, Jean-François Ménard, Yves Loerincik, and Olivier Jolliet. 2012. "The Importance of Considering Product Loss Rates in Life Cycle Assessment: The Example of Closure Systems for Bottled Wine" Sustainability 4, no. 10: 2673-2706. https://doi.org/10.3390/su4102673