Environmental Performance of East Asia Summit Countries from the Perspective of Energy Security

Abstract
:1. Introduction
2. The Characteristics of China, Japan and Indonesia

| Socioeconomics | Energy | Environment | ||||||
|---|---|---|---|---|---|---|---|---|
| Pop Number | Pop Growth | GDP /capita | GDP—GDP growth | Tech achievement | Energy consumption | Energy resource | CO2 emission | |
| China | Largest | Low | High | Highest—Slowing | Adopter—High | Highest—Accelerating | Abundant | Highest |
| Japan | Large | Negative | Highest | Low—Stable | Leader | High—Stable | Scarce | High |
| Indonesia | Large | High | Low | High—Accelerating | Adopter—Low | Modest—Accelerating | Abundant | Low |
2.1. China
2.2. Japan
2.3. Indonesia
3. Simulation Model
3.1. Model
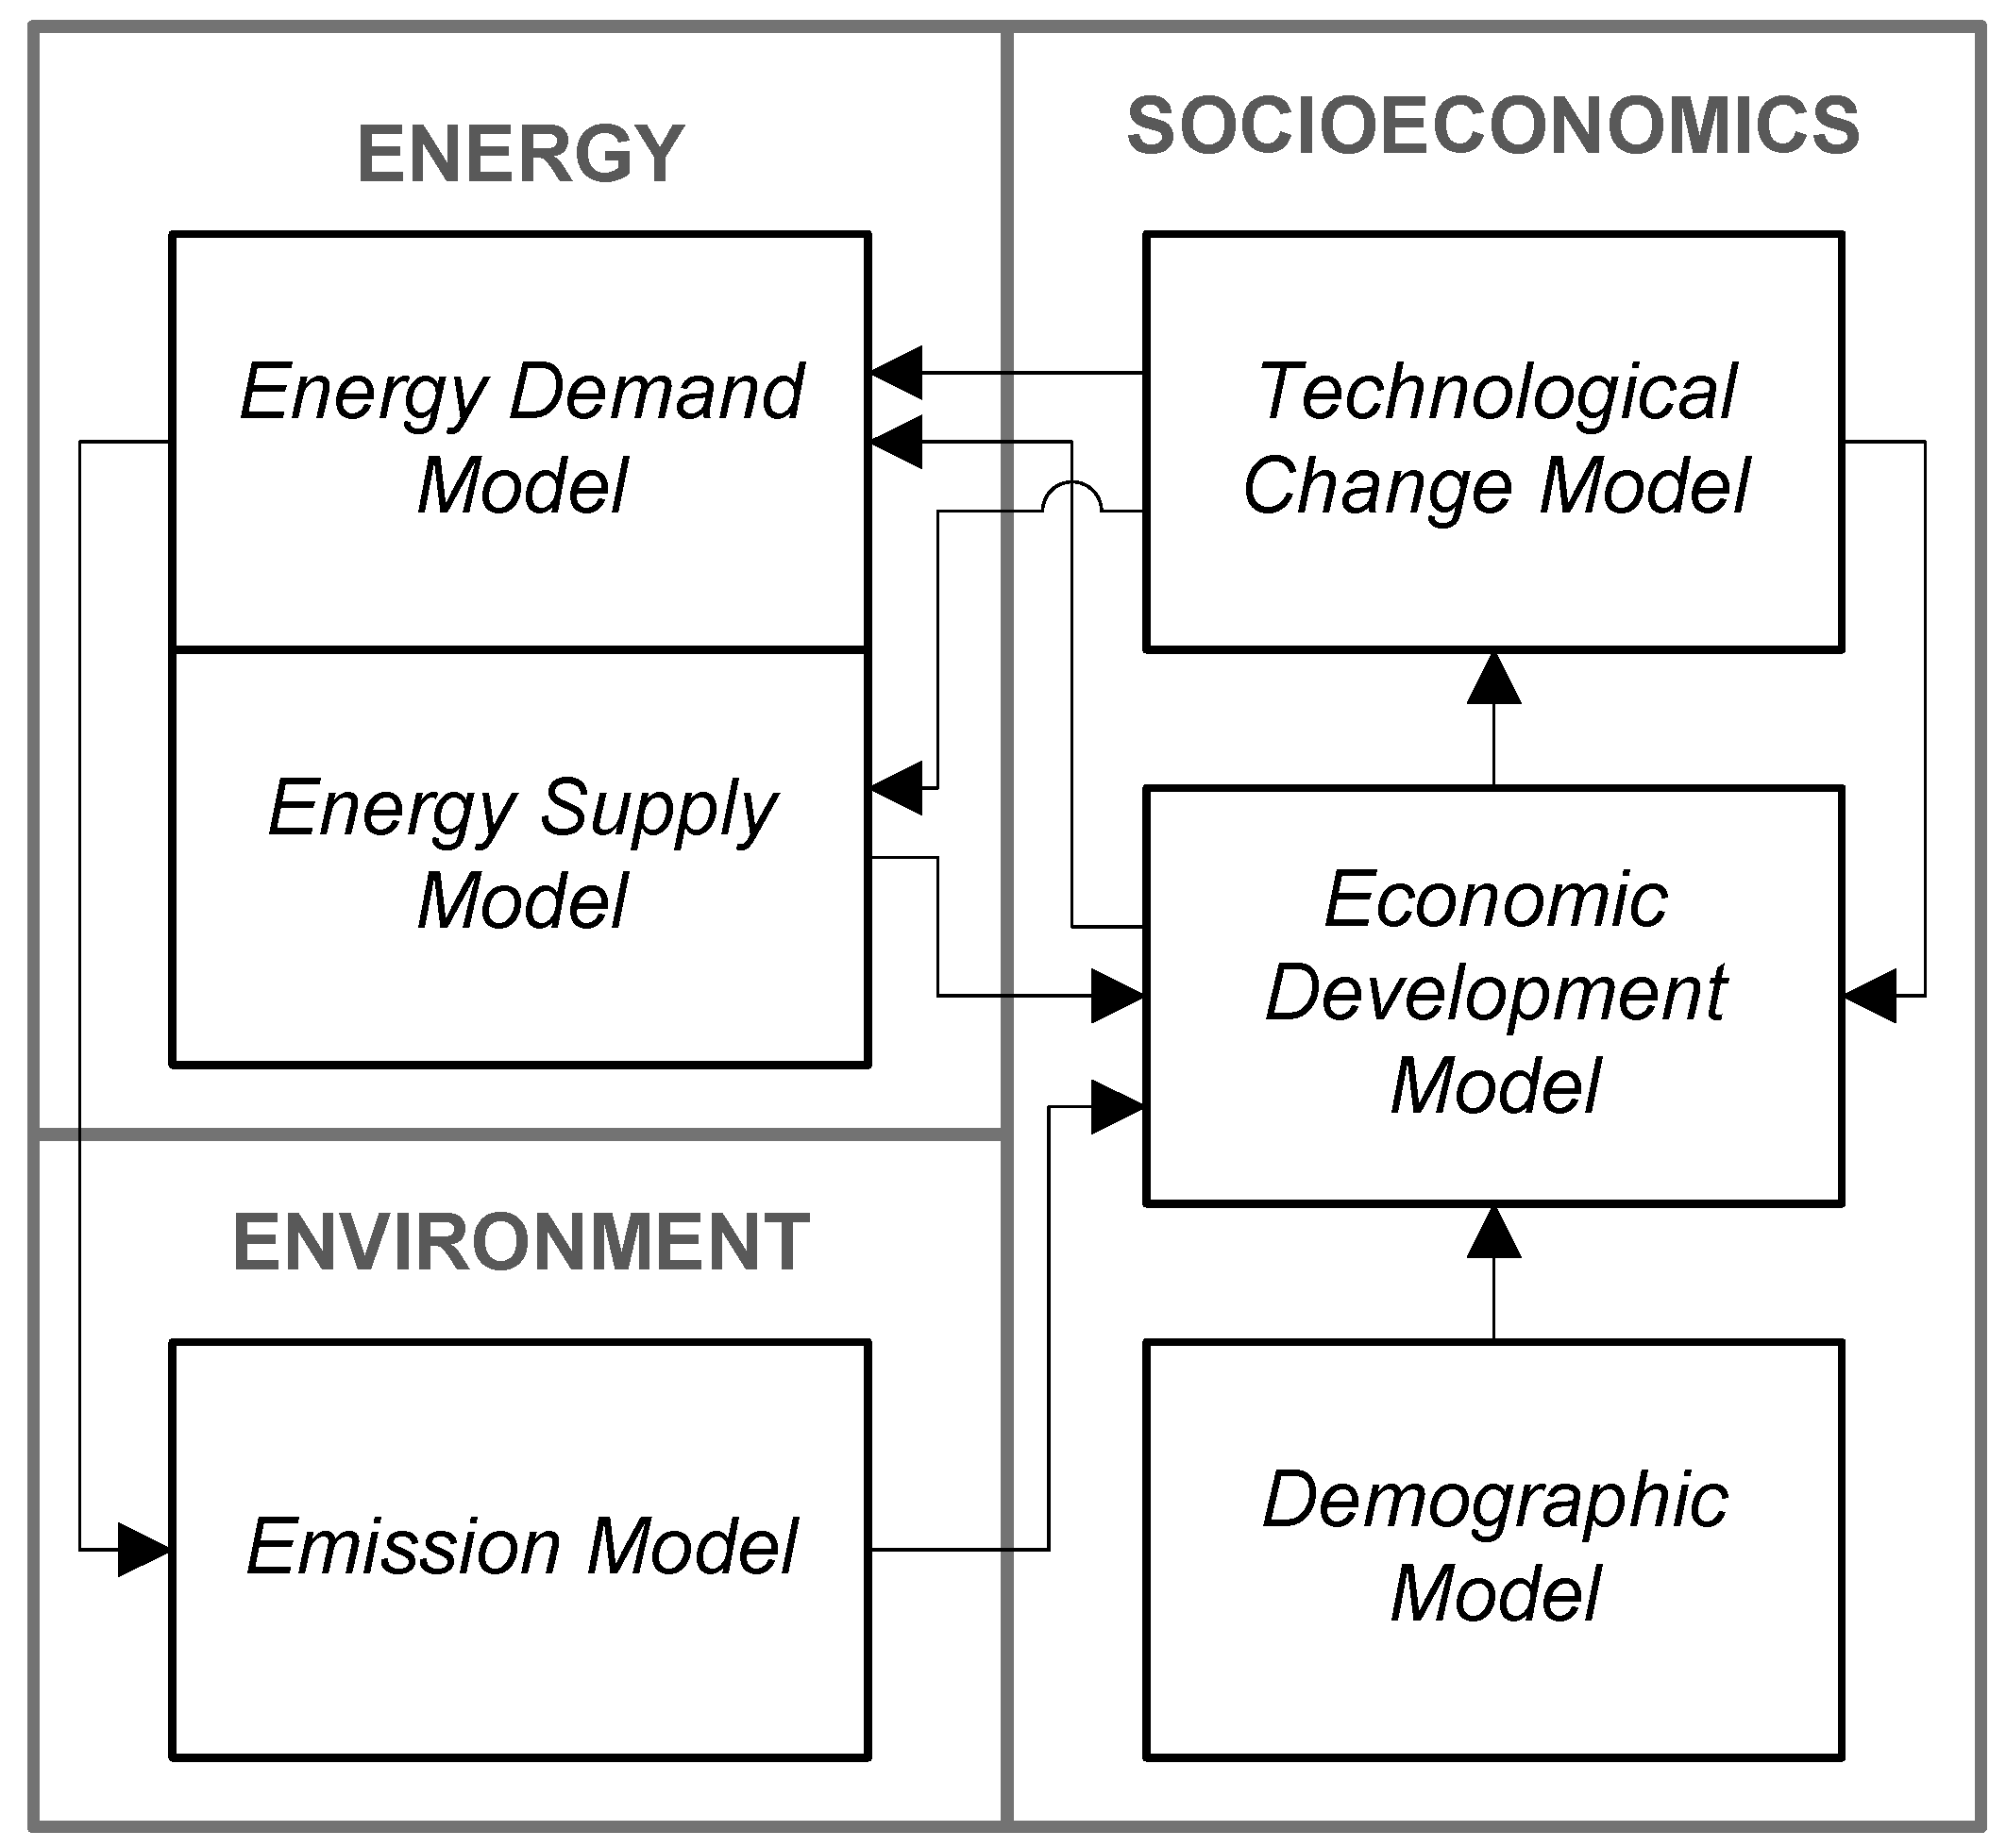
3.1.1. Structure
3.1.1.1. Energy Sector
3.1.1.2. Socioeconomic Sector
3.1.1.3. Environmental Sector
3.1.2. Feedback Loop
3.1.2.1. Energy Supply—Economic Development—Technological Change Loop
3.1.2.2. Energy Demand—Emission—Economic Development—Technological Change Loop
3.1.2.3. Energy Demand—Emission—Economic Development Loop
3.1.2.4. Technological Change—Economic Development Loop
3.1.3. Parameters
- Energy efficiency level. This parameter is provided for each energy consumption sector. This parameter is influenced by the Technology Advance variable. It allows simulation of higher or lower effects of technological advancement to energy consumption. It can be used to simulate energy efficient technology adoption by, for example, energy labeling and standards policies. The value of this parameter is set to 1 at year 2008.
- Solar, wind, microhydro and biomass growth factor. This parameter allows higher or lower production growth of each renewable energy. It can be used to simulate, for example, rapid introduction of renewable energy policy. The value of this parameter is set to 1 at year 2008.
- Geothermal and hydro capacity growth factor. This parameter allows higher or lower capacity factor growth along with its capacity factor. It can be used to simulate changes in capacity factors of new and existing large plants. The value of this parameter is set to 1 at year 2008.
- Fossil energy consumption growth factor. This parameter is provided for each type of fossil energy. It allows higher or lower fossil consumption growth along with the Energy Efficiency level influence. It can be used to simulate structural changes in fossil energy utilization, for example, kerosene-to-gas switching policy. The value of this parameter is set to 1 at year 2008.
- Nuclear energy capacity growth factor. This parameter allows higher or lower nuclear energy capacity along with its capacity factor. It can be used to simulate nuclear expansion policy. The value of this parameter is set to 1 for the year 2008.
- Coal CO2 efficacy level. This parameter allows changes to the level of CO2 emission from coal. It can be used to simulate clean technology implementation such as the Integrated Gasification Combine Cycle (IGCC) and Carbon Capture and Storage (CSS) technologies. The value of this parameter is between 0% and 100%.
- Energy trade limits. This parameter allows limitation on energy trade to be considered in the model. It can be used to simulate policy on energy trade, such as energy import/export ban. The parameter value can be expressed by using physical amount of energy (i.e. MTOE) or share of energy from other variable (i.e. percentage of energy production).
- CO2 tax implementation. This parameter functions as a lever to simulate the implementation of a CO2 tax. It allows a predetermined effect of a CO2 tax on economic growth to be considered in the simulation. It is assumed that a CO2 tax rate will increase incrementally in proportion to the CO2 emission rate. Should CO2 emissions hold or be reduced to below the level of the previous year, the CO2 tax rate is considered to be unchanged from the previous year. The parameter value is either on or off.
3.1.4. Data
3.2. Scenario
| Sector | China | Japan | Indonesia | |
|---|---|---|---|---|
| Oil | Follows BAU | Follows BAU | Follows BAU | |
| Coal | No cap for coal utilization. | Coal consumption increases 30% by 2020 and 50% by 2030. CO2 emission from newly built IGCC/CSS plants are 90% lower. | 25% of coal production for domestic supply. Coal consumption growth is increasing gradually 5% per year. | |
| Gas | Follows BAU | Gas consumption increases 40% by 2020 and 60% by 2030. | New contract of long-term gas export is banned. Surplus of gas production is directed to domestic market. | |
| Nuclear | Nuclear power capacity is increased to 43 GW by 2025. | By 2030, Nuclear power capacity will be at 30% of 2010 capacity. | Follows BAU | |
| Geothermal | Geothermal energy use increase to 69 mtce by 2015. The growth will continue to 2025. | Geothermal power capacity is increased to 3.4 GW by 2020 | Geothermal capacity increases 20% by 2020 and 40% by 2030. Geothermal energy growth is increasing accordingly in 2025 | |
| Solar | Solar power capacity is expanded to 10GW by 2015 and 50GW by 2020. The growth will continue to 2025. | Solar power capacity is increased to 81 GW in 2020. | Follows BAU | |
| Wind | Wind power capacity is increased to 100 GW in 2015. The growth will continue to 2025. | Wind power capacity is increased to 40 GW by 2020. | Follows BAU | |
| Hydro | Hydro power capacity is expanded to 325 GW by 2015 from 197 GW in 2009, the capacity is increasing accordingly, with capacity factor increase to 60% by 2025. | Follows BAU | Hydro (Micro) power capacity is increasing at 5% per year. | |
| Biomass | Biomass power capacity is increased to 13 GW by 2015. The growth will continue to 2025. | Follows BAU | Biomass utilization is increasing 5% per year | |
| Efficiency | 35% efficiency increase in transport sector by 2025. | 30% increase of efficiency by 2020 and 40% by 2030 in household and commercial sectors. 20% efficiency increase by 2020 and 50% by 2030 in the transportation sector. | 30% increase of energy efficiency in household and commercial by 2030. | |
| Carbon Tax | Carbon tax rate is implemented from 2009 at 20 yuan/ton-CO2. | Carbon tax rate at 2.400 Yen/ton-CO2 is implemented from 2009. | Gradually increasing CO2 tax of Rp.80,000/ton-CO2 to Rp.280,000/ton-CO2 is implemented from 2009 to 2025 | |
3.2.1. Scenario for China
- Renewable energy:
- ౦ The plan calls for hydropower development in southwest China. In total, hydropower capacity will be expanded from 197 GW in 2009 to 325 GW by 2015. Based on this, this study assumes that hydropower capacity will increase accordingly and therefore shows a capacity factor increase from 37% in 2009 to 60% by 2025.
- ౦ The installed solar power capacity will be expanded from 300 MW in 2010 to 10 GW by 2015 and 50 GW by 2020. Following this target, this study assumes that solar energy growth is increasing accordingly and that such growth will stabilize by 2025.
- ౦ Wind power capacity is targeted to increase from 41.8 GW in 2010 to 100 GW in 2015. Wind power generation is planned to reach 190 billion KWh annually. This study assumes that growth will continue until 2025.
- ౦ Geothermal energy surveys and exploration campaigns to map available and economically viable geothermal resources are underway. The declared aim is to use geothermal power equal to approximately 69 million tons of coal by 2015, which equals 3.678 GW at a 39% capacity factor. This study assumes that such growth will continue until 2025.
- ౦ China plans to expand its installed generation capacity for biomass power from 5.5 GW in 2010 to 13 GW in 2015 by producing 5 billion tons of biomass power every year. Following this, this study assumes that biomass production will increase accordingly to meet this target and that such growth will continue until 2025.
- Nuclear power: China plans to construct 10 new nuclear power plants and increase its nuclear capacity to 43 GW by 2015. The Fukushima incident may have some influence over the plan. However, it is uncertain to what extent. It is assumed in this study that the capacity expansion plan will be delayed until 2025.
- Fossil energy: Plan to cap coal utilization at 3.8 billion tons of coal by 2015 is mentioned in the plan. Capping coal utilization is a very daunting target, considering China’s dependence on this energy source. Therefore, we dismiss this policy and assume that there will be no effective capping target.
- Energy efficiency and conservation: Clean energy vehicles are targeted to reach the market at 500,000 units annually. China is expecting 15 million hybrid and electric vehicles in the market by 2020, which is 88% of the current vehicle market. Following this, the study assumed that the effect of the plan is to increase efficiency in the transport sector by 35% in 2025.
- Carbon tax: Following a study of dynamic CO2 effects on China’s economy [26], it is assumed that the carbon tax rate will be implemented at 200 yuan/ton-CO2 from 2009. The loss of GDP due to this level of CO2 tax rate is at 1%.
3.2.2. Scenario for Japan
- Renewable energy: In the wake of the nuclear crisis, renewable energy introduction will be rigorously expanded.
- ౦ With the target of 12 million houses of PV installation and total target of 81 GW in 2020, it is assumed that solar PV implementation growth will increase accordingly from 2011 level.
- ౦ Wind power development is targeted to increase. Wind power capacity is targeted up to 40 GW by 2020. However, the growth is still hampered by challenges such as site restriction and interconnection issues. The study assumed that the development is slowed and the target will be achieved in 2040, thus the growth is increasing accordingly.
- ౦ Geothermal power capacity is targeted to increase to its maximum potential at 3.4 GW by 2030. However, there are conflicts of interest with national parks and hot springs which are withholding the development. It is assumed that the target will be achieved by 2040, thus the geothermal energy growth is increasing accordingly.
- Nuclear: Nuclear power capacity is planned to be expanded to 68 GW by building 9 new nuclear reactors by 2020 with 85% utilization rate and totally 14 reactors by 2030, with facility utilization rate at 90%. However, the Fukushima accident affects the expansion plan significantly. During 2011–2012, almost all of Japan’s nuclear power plants are shut down without certainty of when to be started again as Japan is considering a phased-out nuclear program. However, stable supply of electricity may not be possible without nuclear energy [28]. Therefore, this scenario assumes that the nuclear phase-out program will be implemented and that the phase-out will happen at a much slower rate. Moreover, the nuclear power will continue to be generated in Japan at a reduced rate, but with more emphasis on efforts to ensure safety. Therefore, it is assumed in this study that by 2030, nuclear power capacity will be at 30% of pre-Fukushima operating capacity.
- Advance utilization of fossil fuel: Coal consumption will increase as new coal power plants with IGCC (Integrated Gasification Combine Cycle) standard will be available by 2020. In addition, commercialization of CCS (Carbon Capture and Storage) within 2020 will further encourage coal consumption. The Fukushima crisis has also pushed a rise in coal consumption, in an attempt to balance the lost nuclear generation capacity. It is assumed that coal consumption growth will increase to 30% by 2020 and 50% by 2030. However, the CO2 emission from new plants with IGCC/CCS implementation will be 80%–90% less [29]. It is assumed in this scenario that from 2020 on, CO2 emissions from coal power plants will be 90% lower.
- Natural gas: The Fukushima crisis is also affecting gas consumption, that is, causing an increase in gas utilization. Therefore, the scenario assumed that gas consumption will increase 40% by 2020 and 60% by 2030.
- Energy efficiency: Household sector efficiency will improve by introduction of highly efficient hot water supply devices. By 2030, 80% to 90% of households will be using the devices. In addition, efficient lighting, i.e. LED will be diffused 100% by 2030. The commercial sector will conserve more energy by diffusion of more efficient IT equipment, which will be fully adopted by 2020. The effect of this on primary energy consumption is assumed at 30% by 2020 and 40% at 2030. The transportation sector will gain more efficiency by mobilizing all possible policy measures (i.e. fuel efficiency and battery standard) to increase the share of the next generations vehicles in new vehicle sales. It is assumed that fossil energy consumption from this sector will decrease accordingly up to 20% by 2020 and up to 50% by 2030.
- Carbon tax: Implementation of a carbon tax in Japan will have only a very small effect on Japan’s GDP with a carbon tax rate at JPY2400/ton-CO2, which is as low as –0.01% [30] and is the rate assumed in this study.
3.2.3. Scenario for Indonesia
- Renewable energy: Rencana induk pengembangan energi baru dan terbarukan (New and renewable energy development master plan), also known as RIPEBAT [32], covering nonfossil energy production technology and market development, has recently been revised. In particular, the government has focused more on development of the biomass, geothermal and microhydro energy market. In this scenario, biomass utilization is assumed to increase gradually at an annual rate of 5%; microhydro capacity is assumed to increase at the same rate of 5% per year; and, geothermal capacity will increase 20% by 2020 and 40% by 2030.
- Nuclear power: There have been many forums and discussions about nuclear power development plans for Indonesia. The government has been planning nuclear power development since 1956 [35]. However, the plan has yet to be realized because of strong public opposition. The recent Fukushima crisis made this resistance stronger. Therefore, this scenario assumes that nuclear power will not be available during the simulation period for Indonesia.
- Fossil energy: A strong policy in the coal and gas sector has been undertaken that prioritizes fulfillment of domestic demand. Ministerial regulations controlling coal and gas exports were recently announced in 2011. These regulations stated that the government will determine a minimum percentage of coal to be allocated for the domestic market annually. The regulations also introduced restrictions to new gas export contracts. This scenario assumes that a minimum of 25% of Indonesian coal production is reserved for domestic demand. Following this development, this study assumes that coal consumption will grow at rate of 5% per year. Gas exports, beginning in 2011, will be assumed to be constant at 40.15 MTOE/year because no new long-term contracts will be signed. A modest increase in gas consumption is assumed at 2% per year. There are no new developments with respect to oil; thus, the scenario assumes that oil development will follow trends in the historical data. However, this study assumes that there will be some substitution between oil and other energy sources, so that the development of other energy sources will contribute negatively to oil consumption.
- Energy efficiency and conservation: Rencana Induk Konservasi Energy Nasional (National Energy Conservation Master Plan), or RIKEN, was introduced in 2005 [32]. Currently, RIKEN is implemented mainly by establishing energy performance standards and labeling schemes. This scenario assumes that RIKEN will encourage more efficient technology to be adopted more rapidly and that higher efficiency goals will be realized. Thus, higher efficiencies of up to 30% will be gained by 2030 in commercial and household energy consumption as standards and labeling on buildings and appliances become more fully effective.
- Carbon tax: The Ministry of Finance proposed a plan for full carbon tax implementation in 2020 [36]. According to Yusuf and Resosudarmo [37], carbon tax implementation may inflict little damage to Indonesia’s GDP because of its distributional effect. A carbon tax rate of Rp.280,000/ton-CO2 may decrease Indonesia’s GDP as much as 0.04%. This study assumes that the rate is implemented gradually from Rp.80,000/ton-CO2 to Rp.280,000/ton-CO2, beginning in 2010.
3.3. Indicator
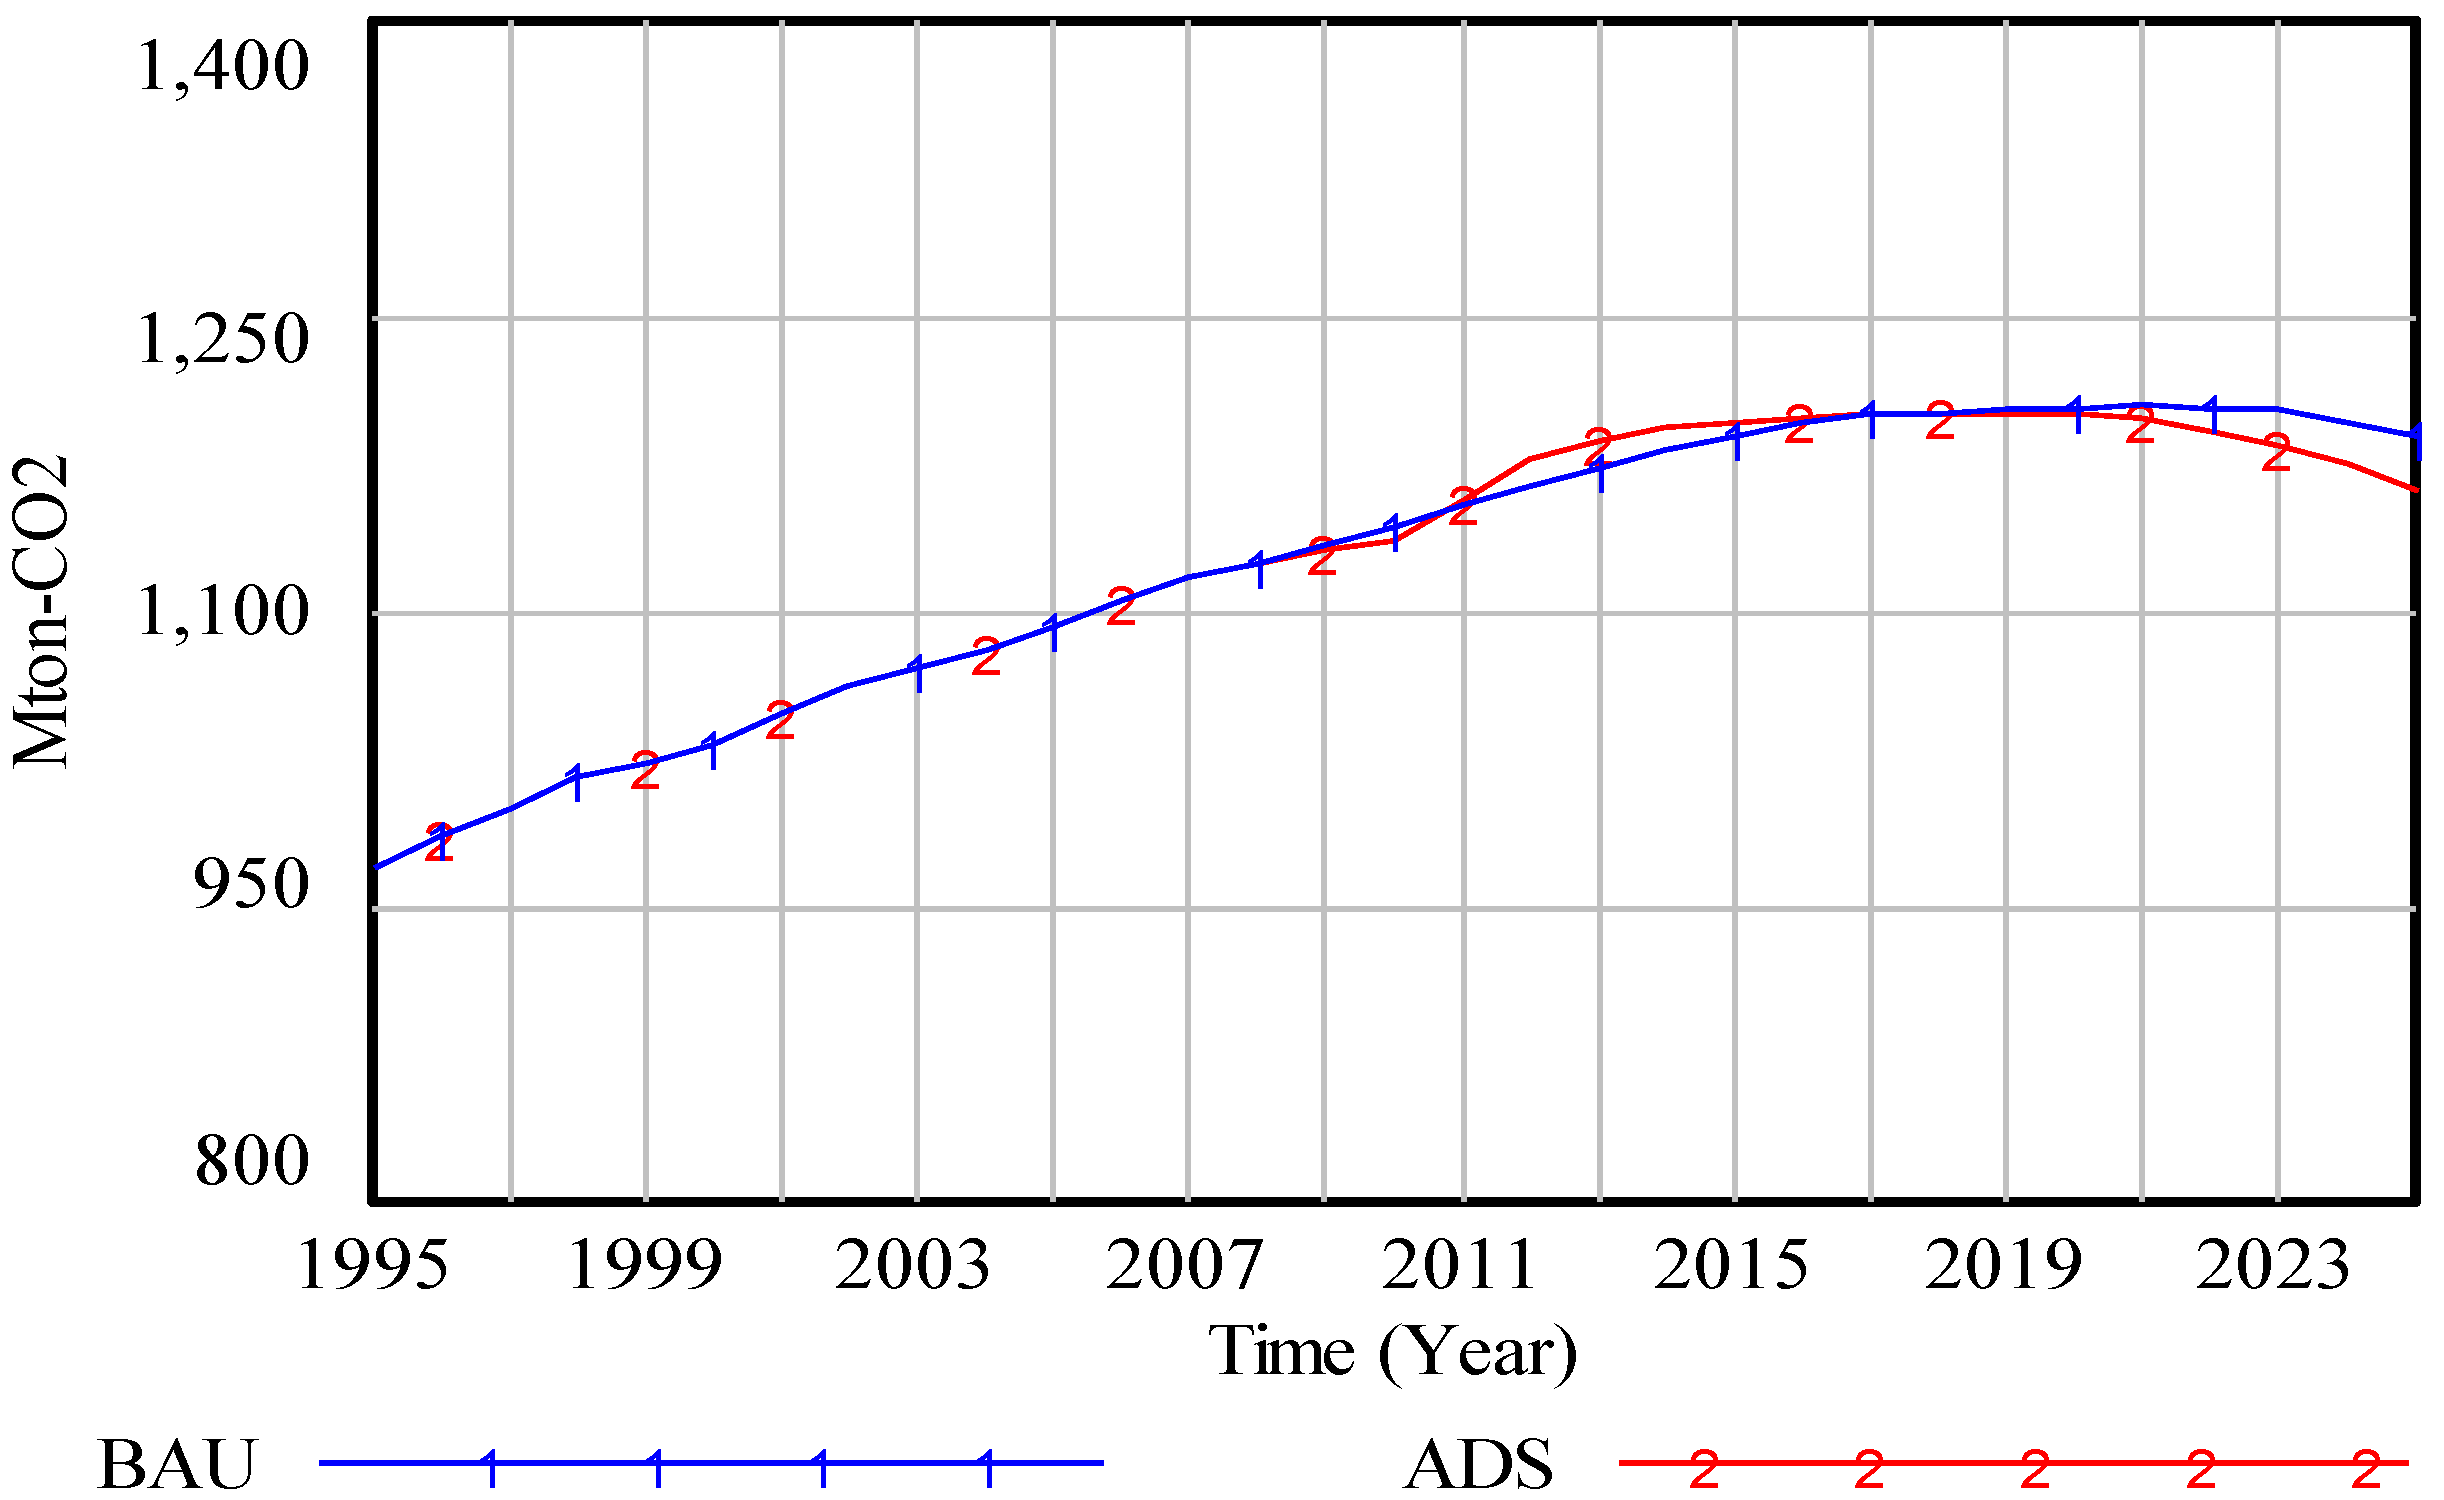
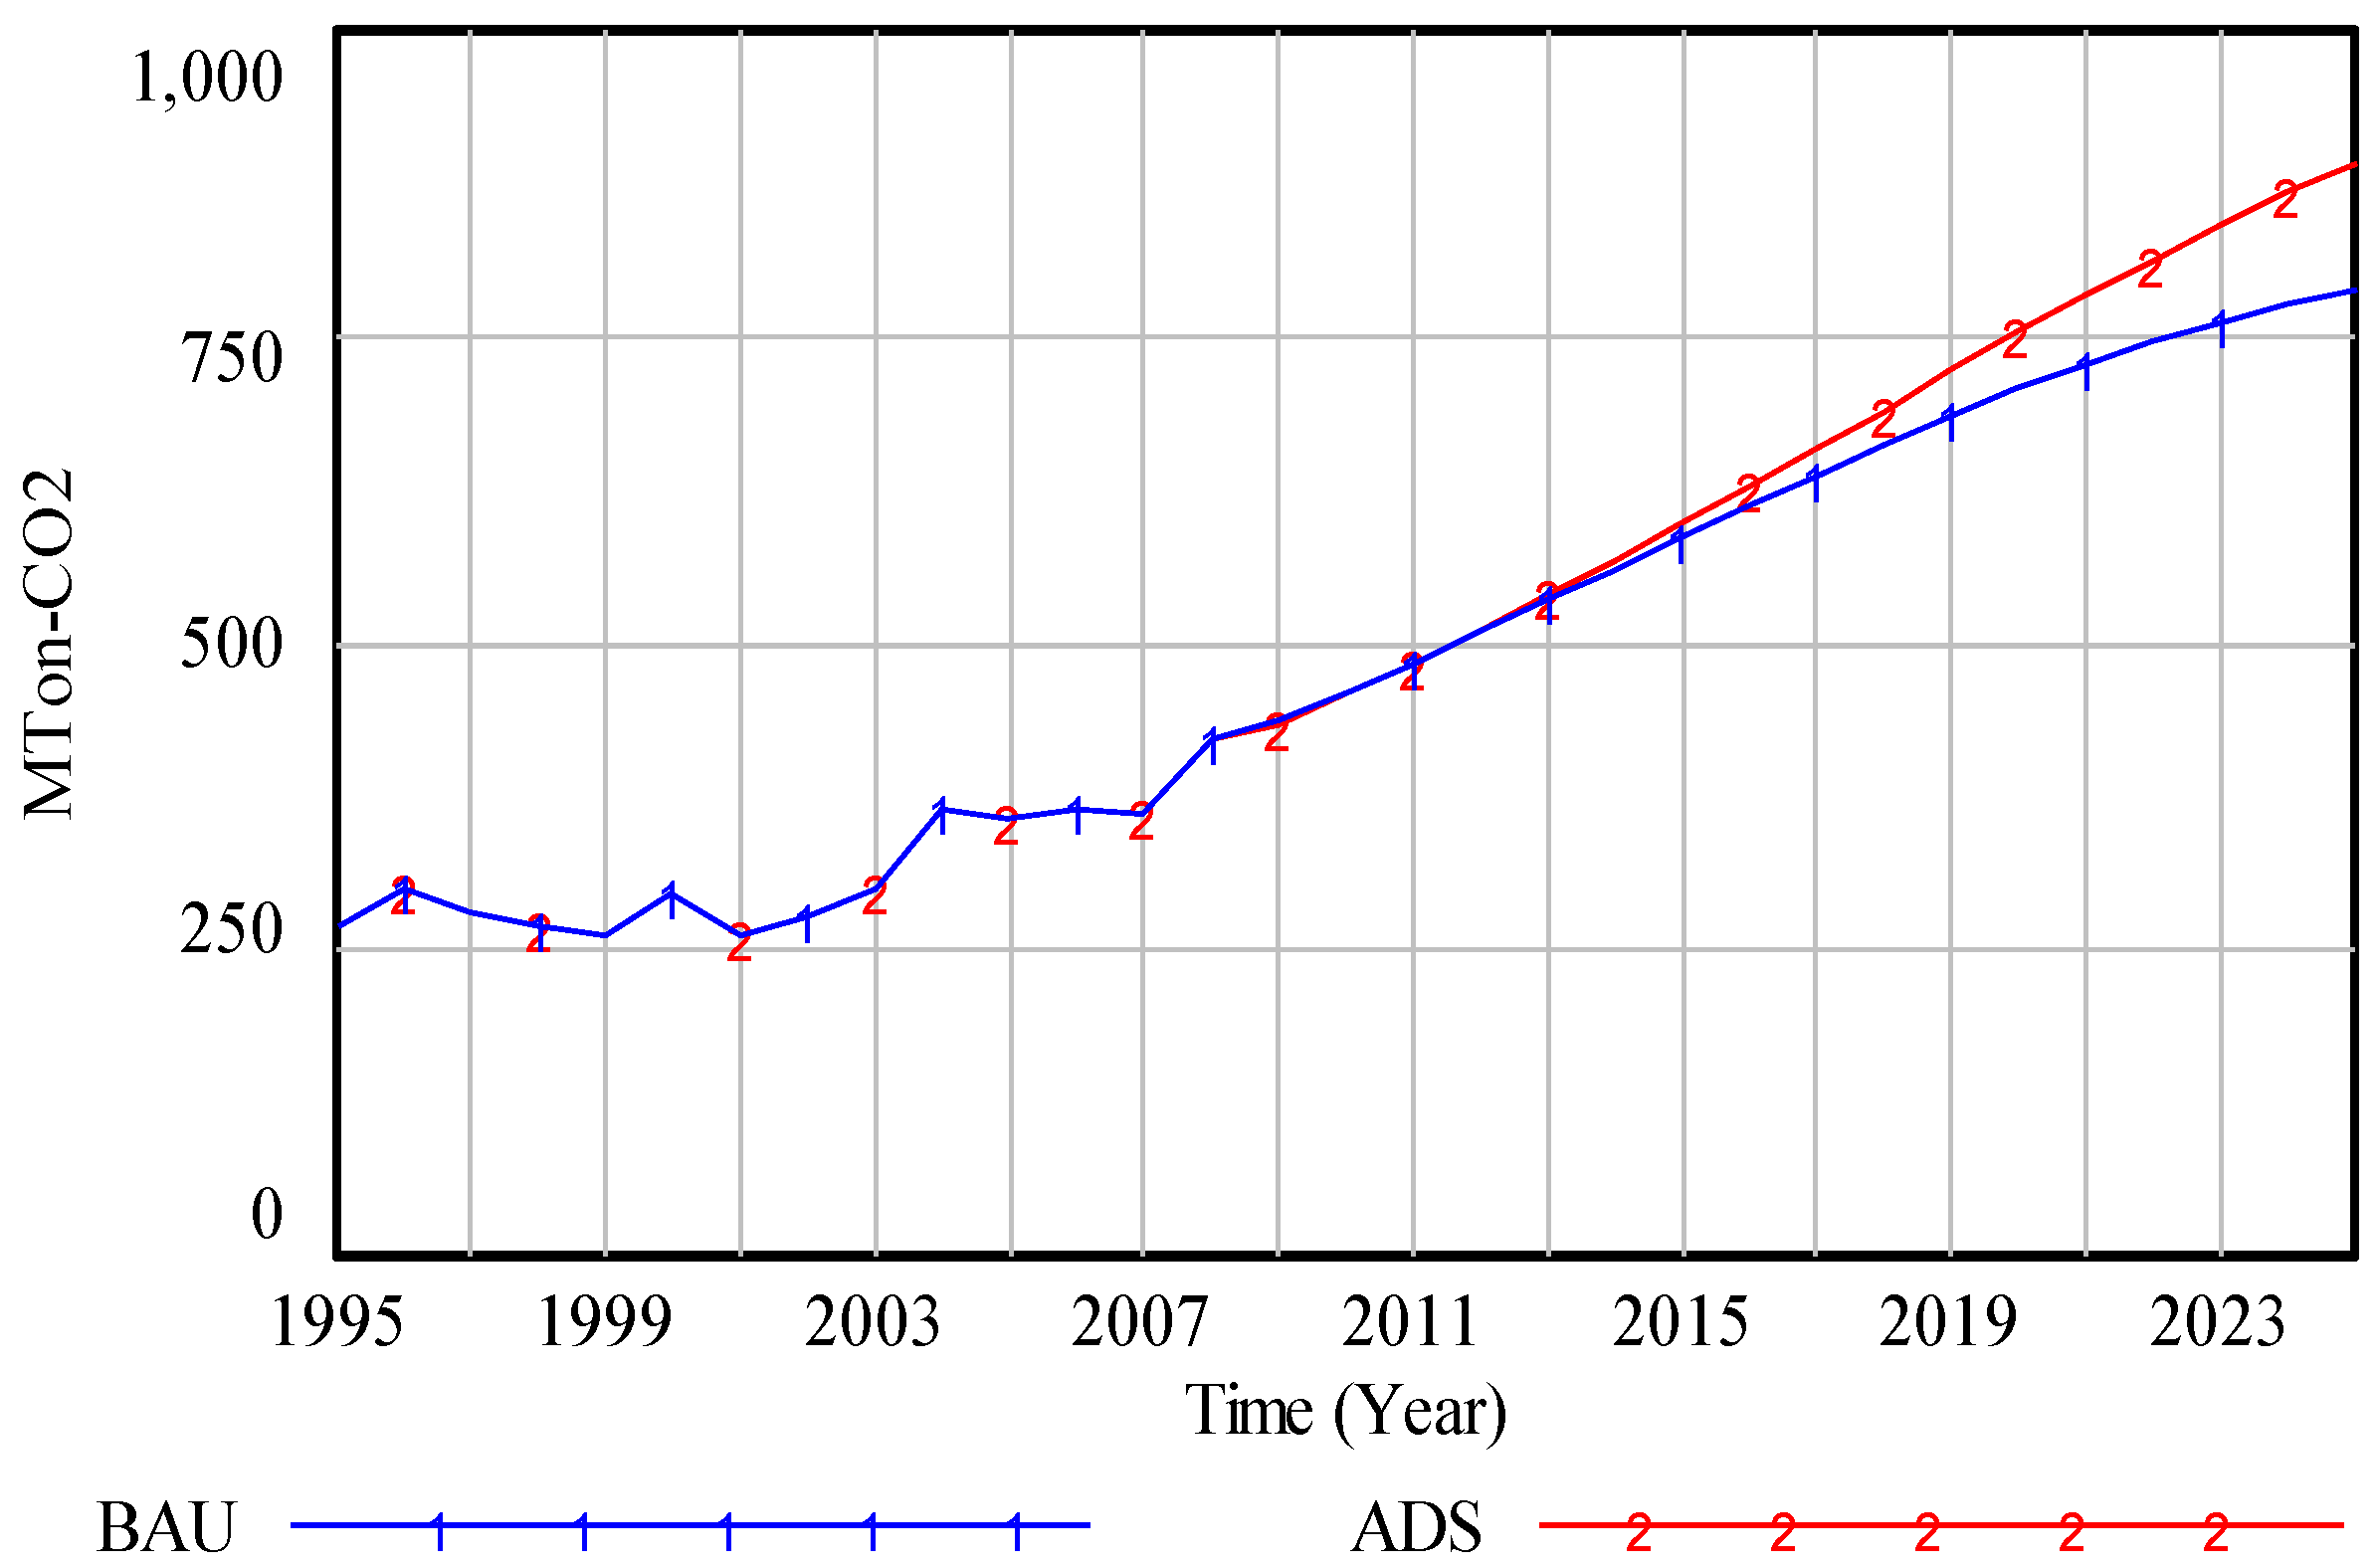
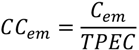
3.3.1. CO2 Emission

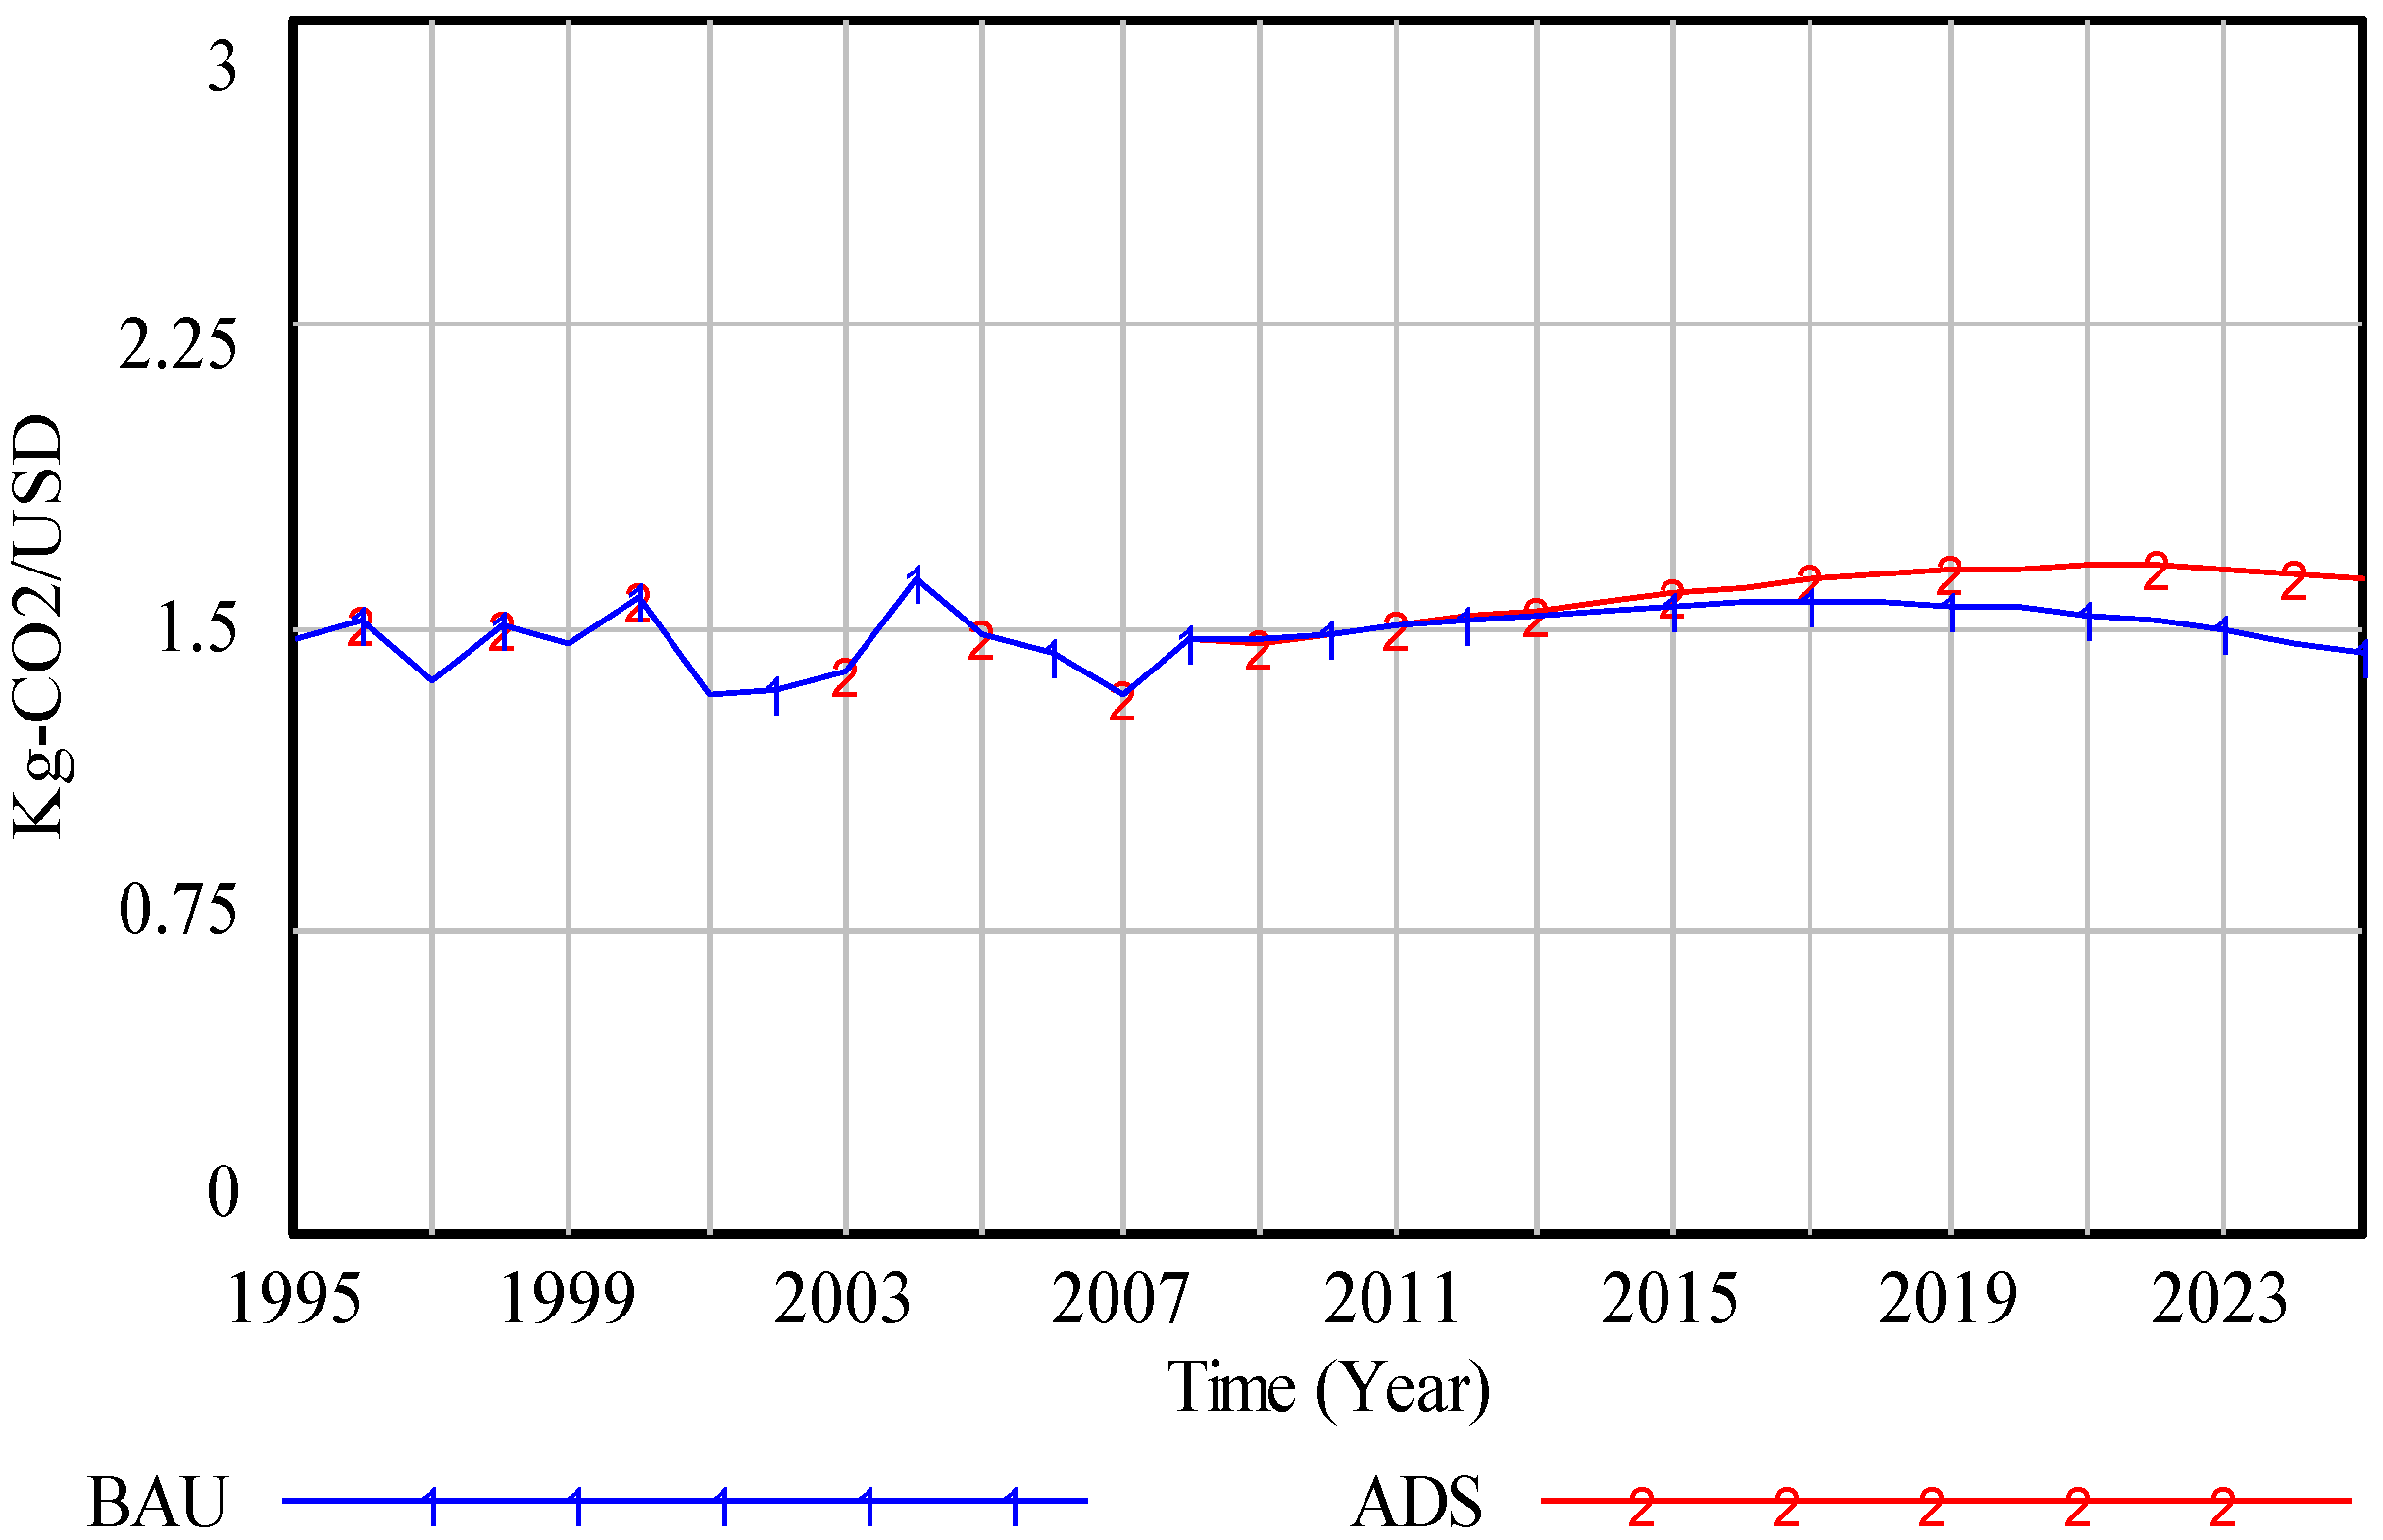
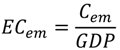
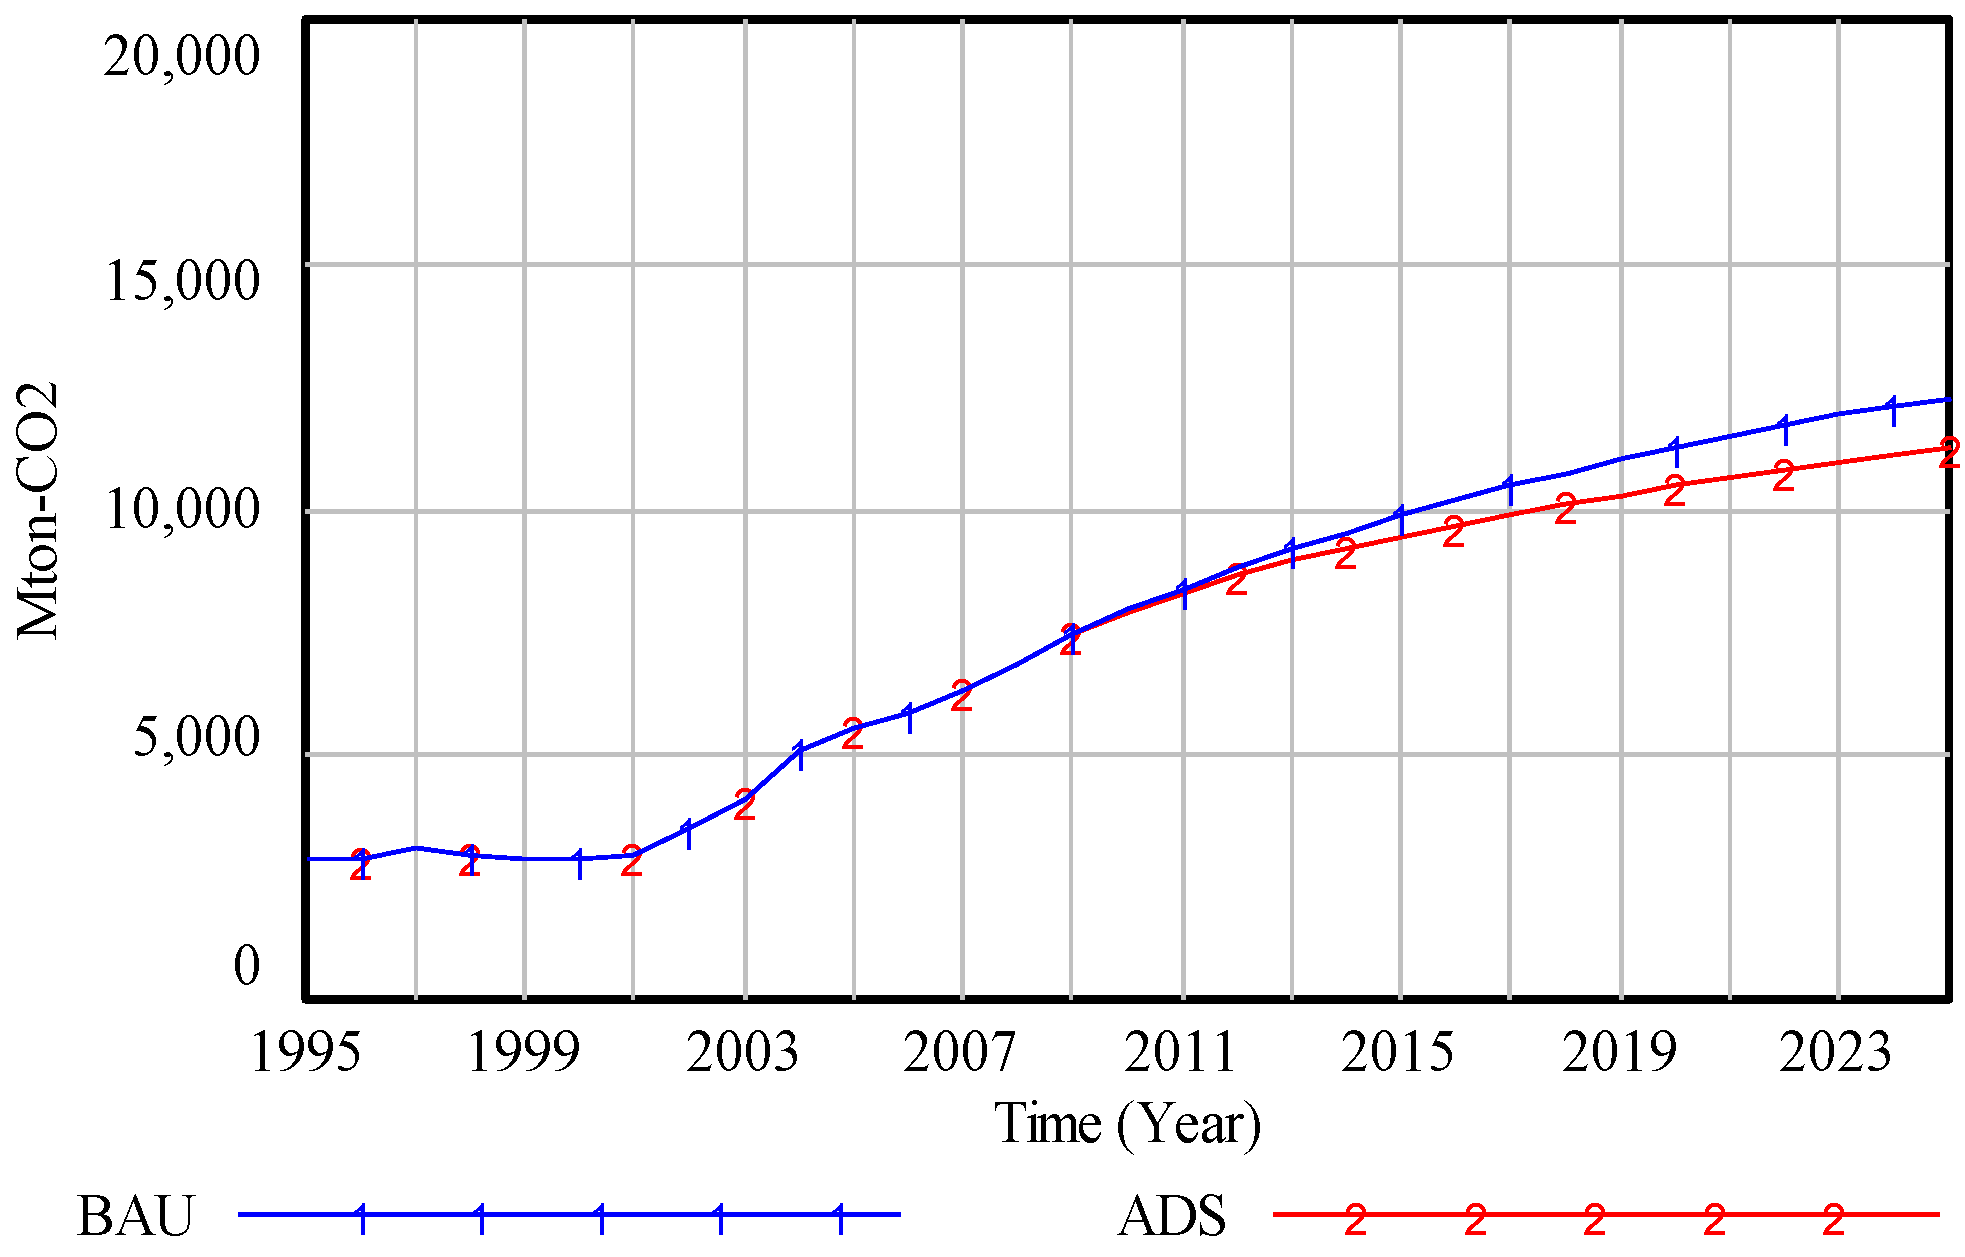
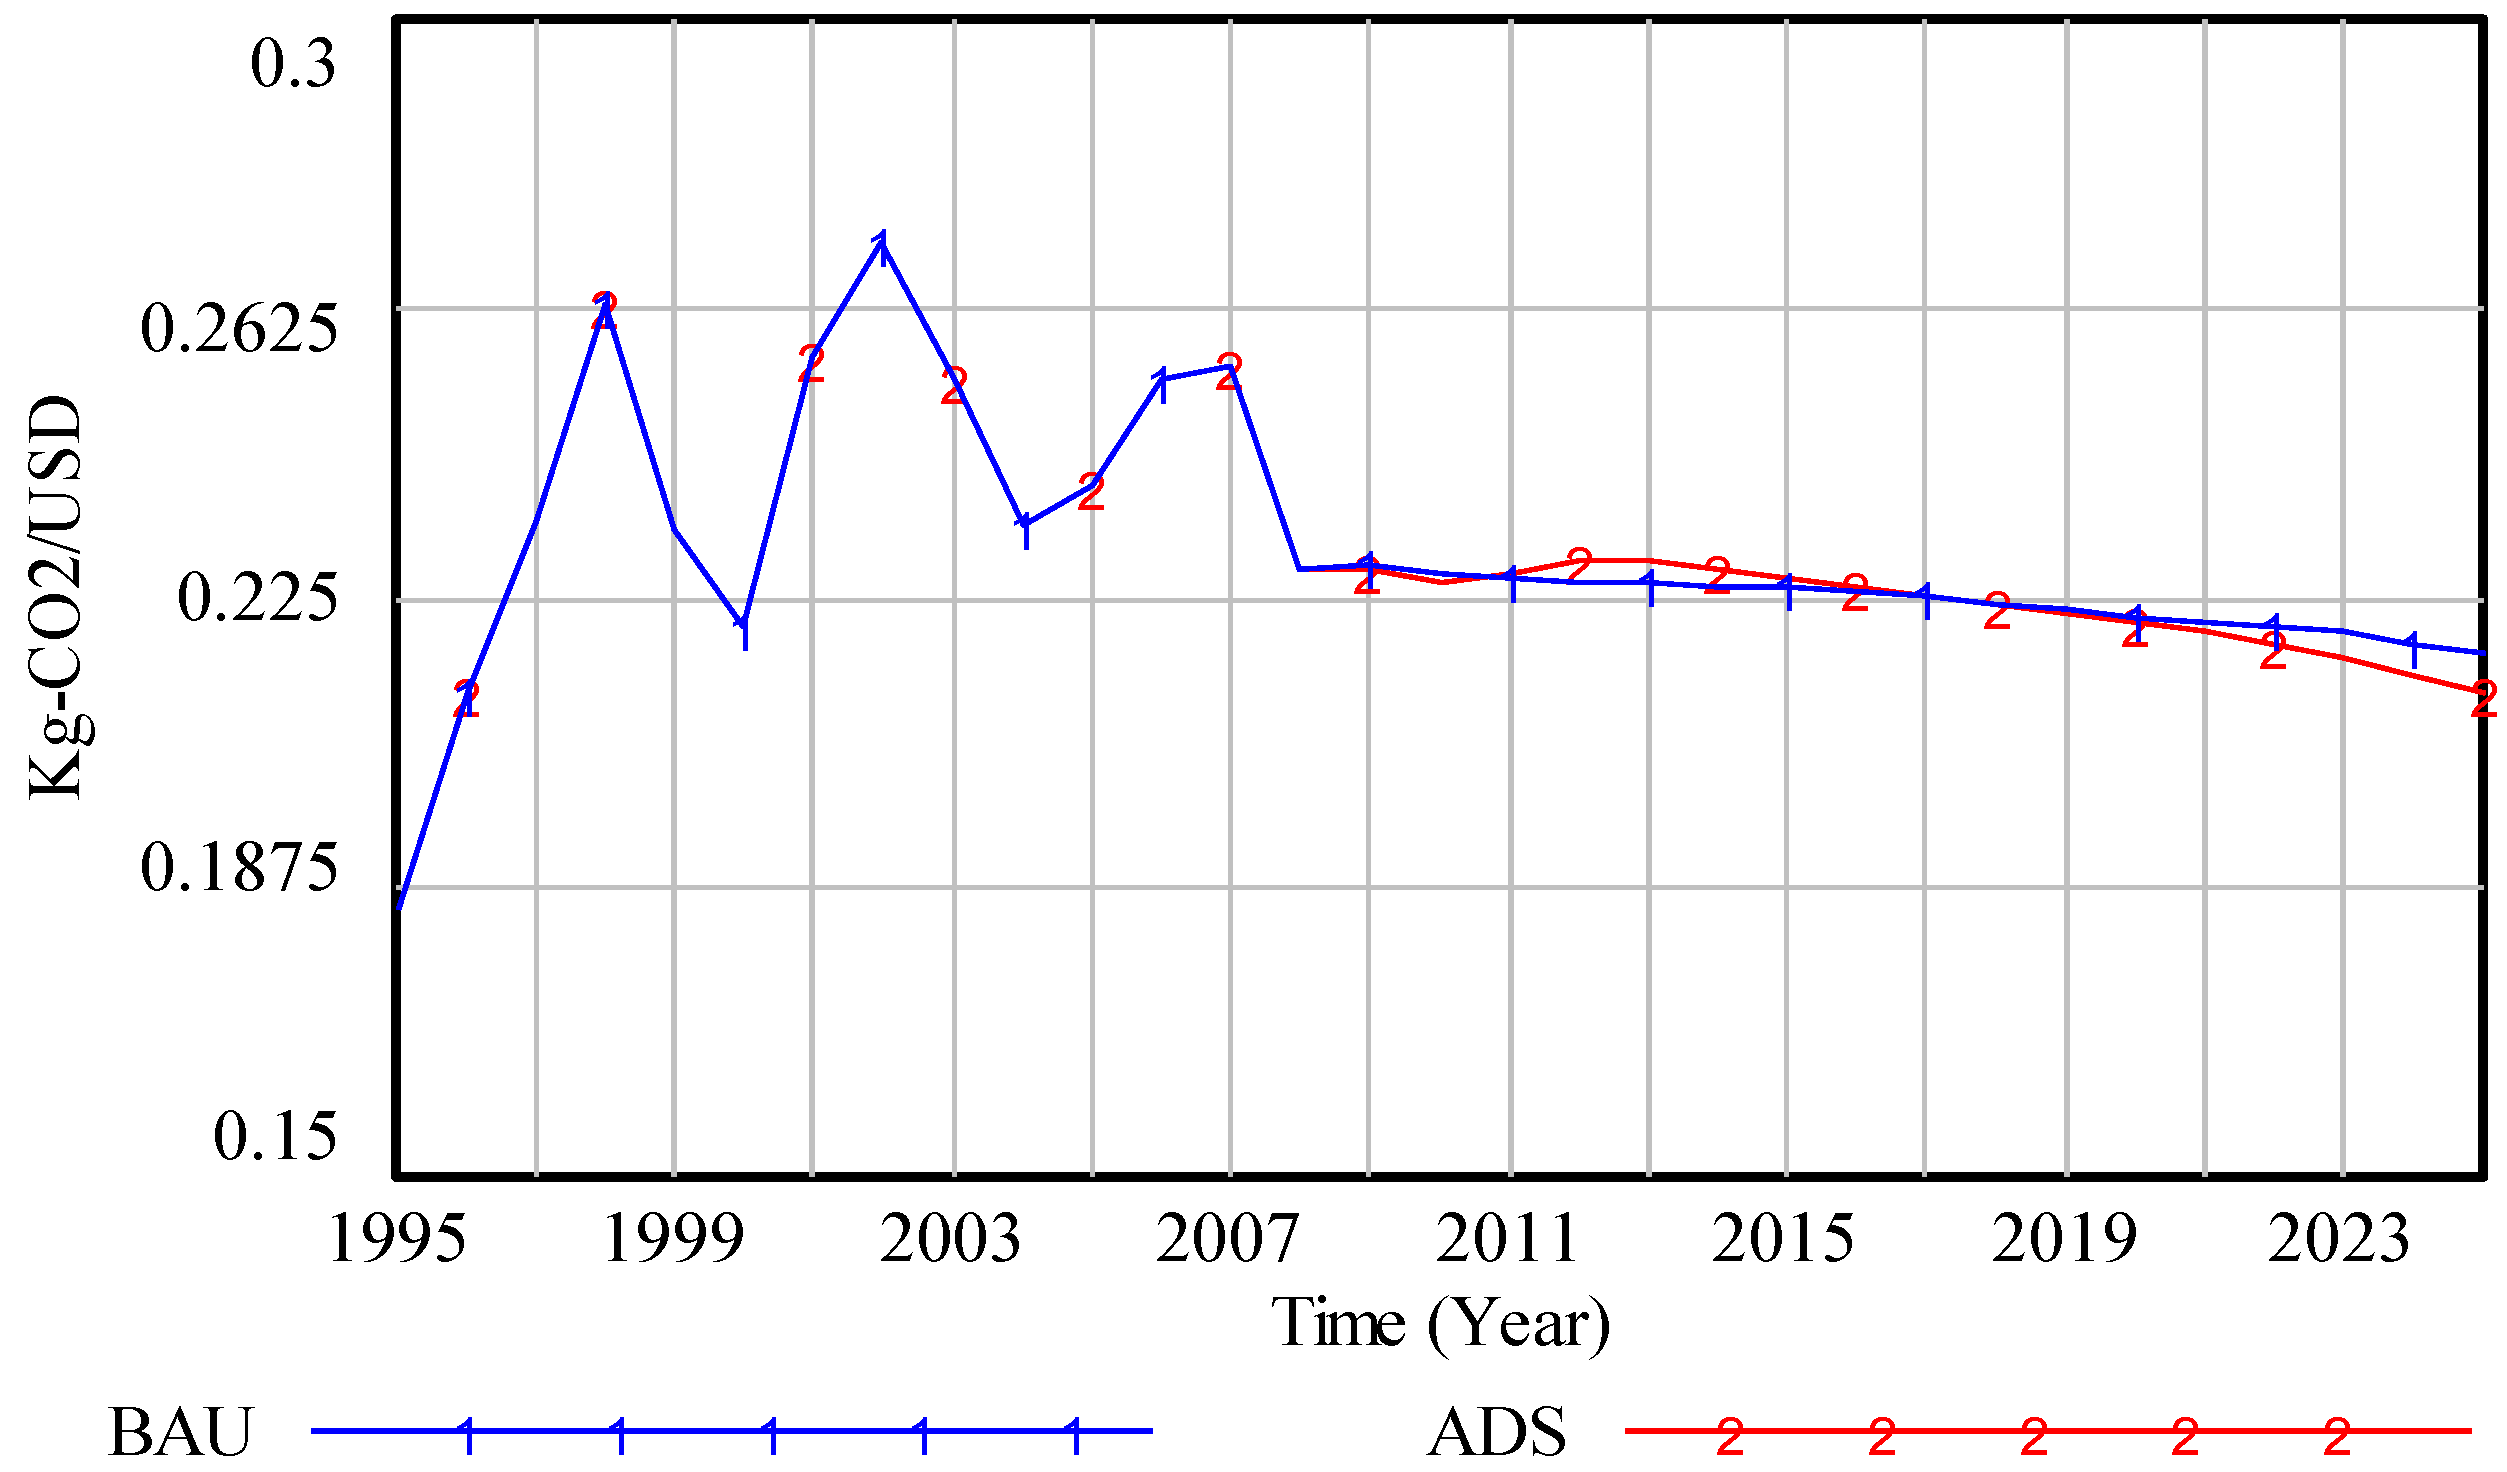
3.3.2. Carbon Intensity of Economy
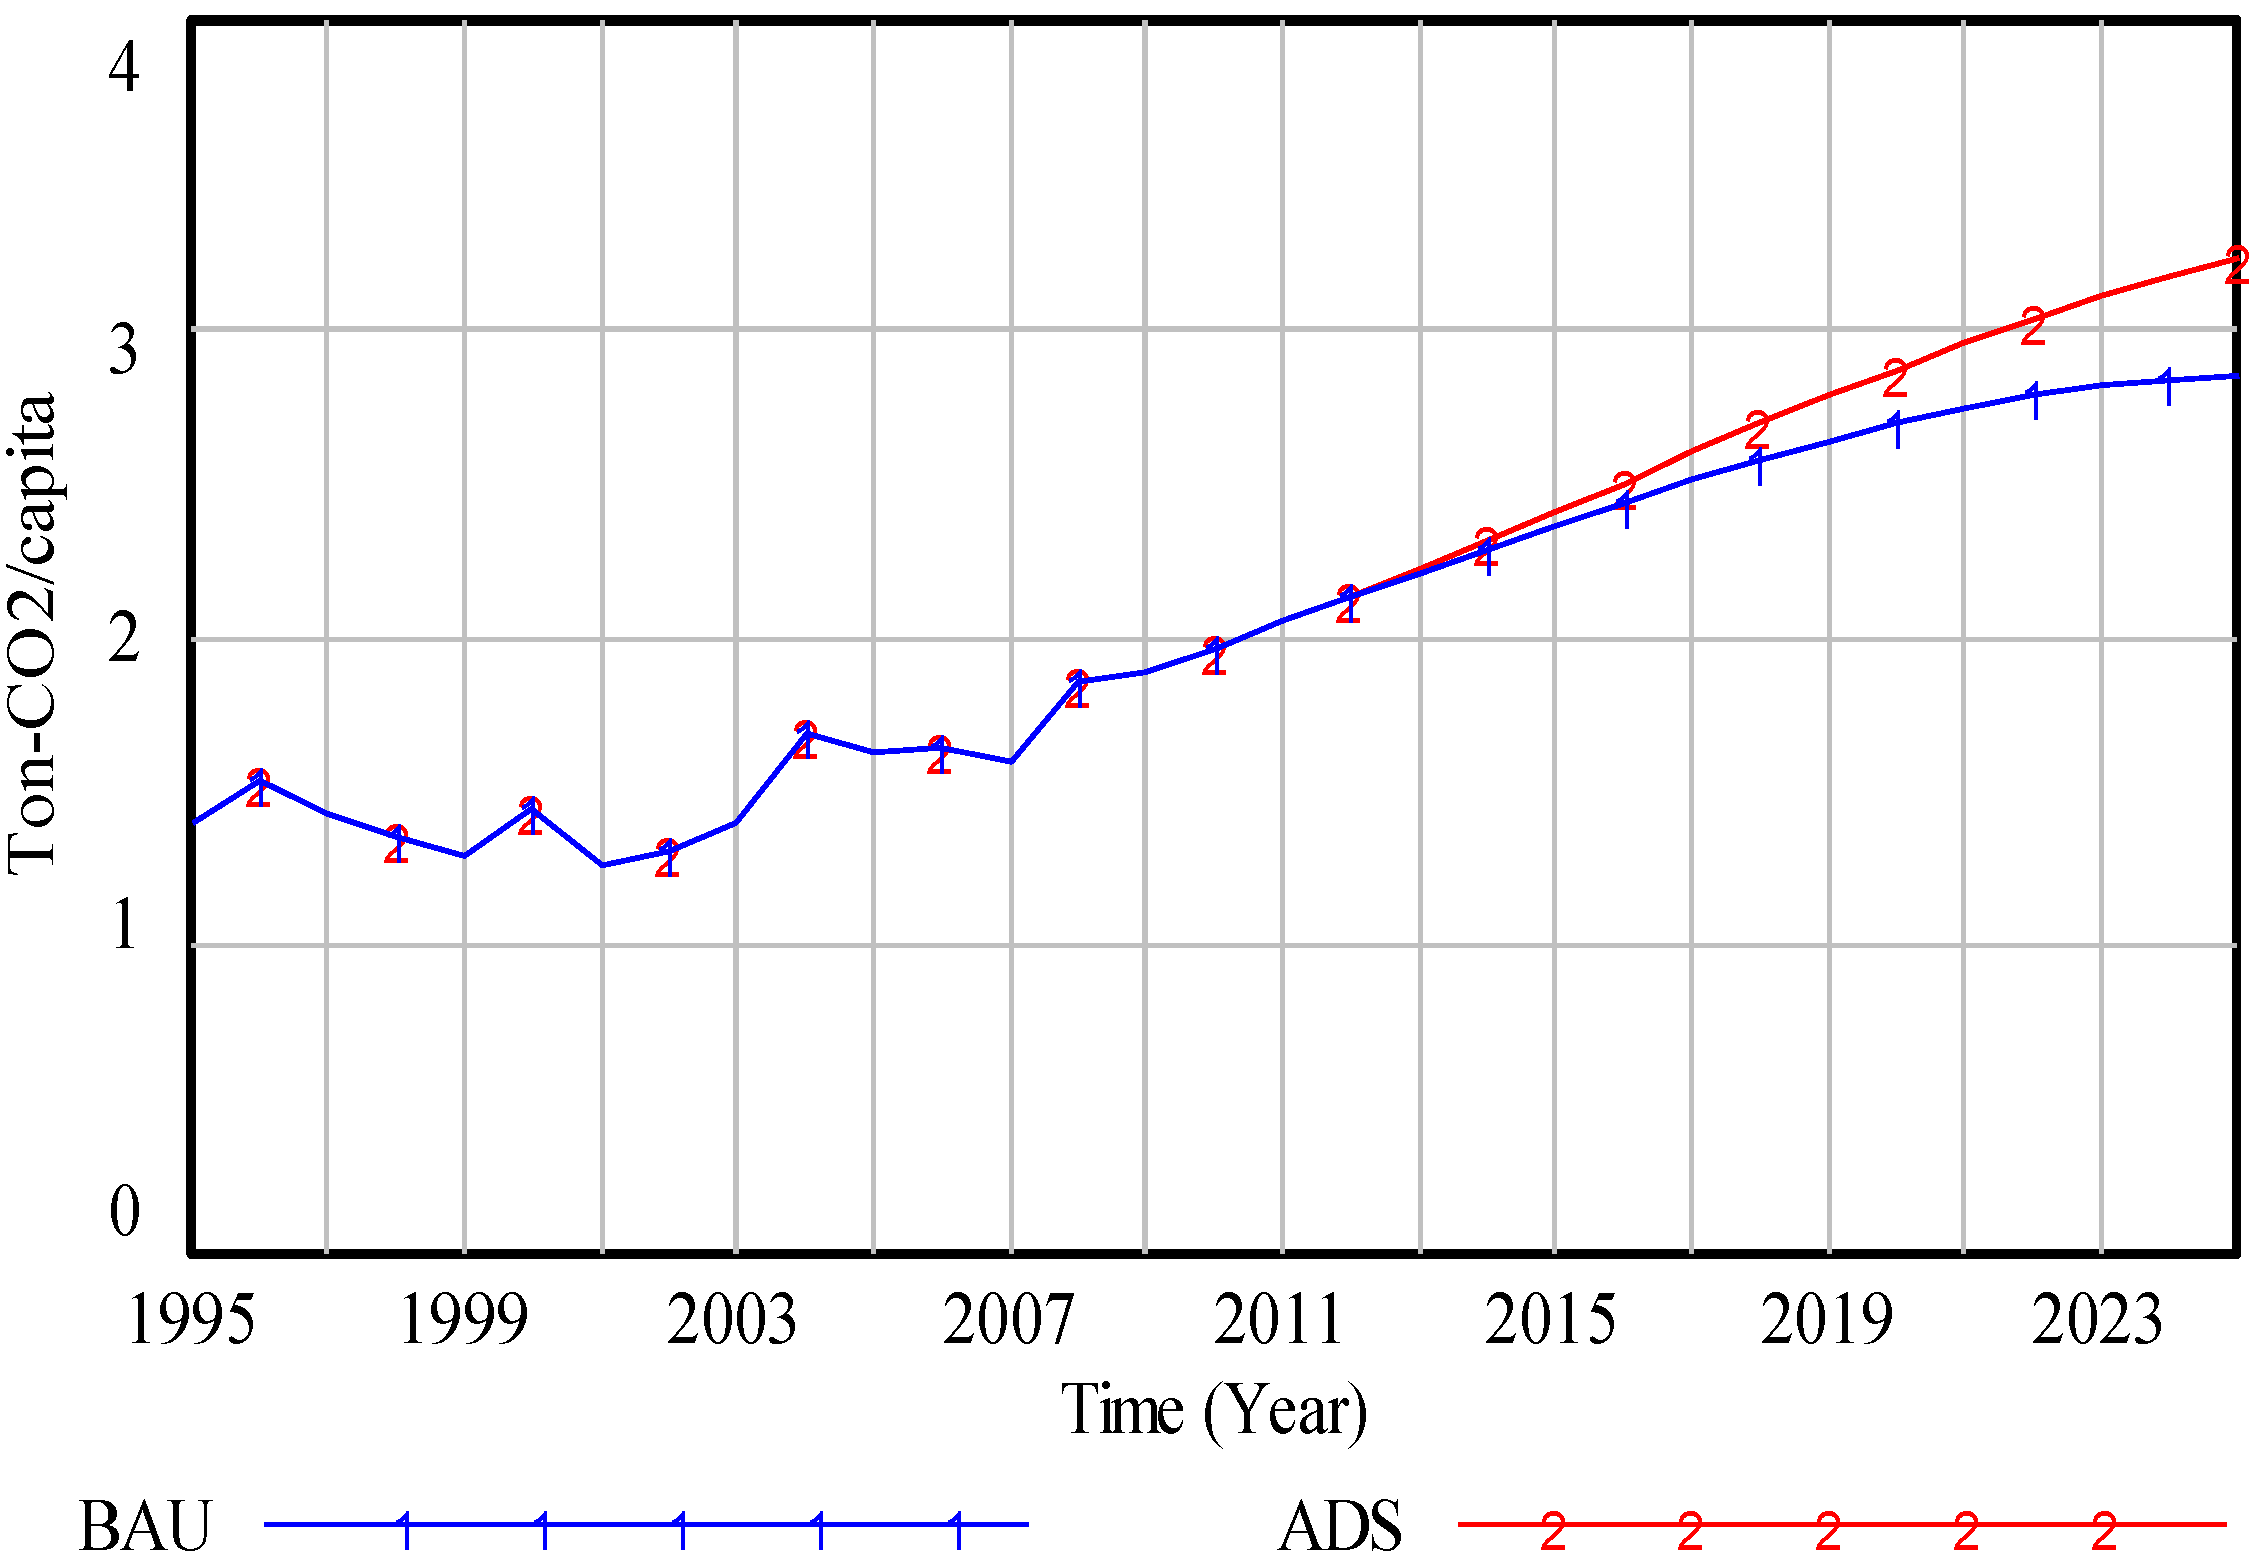
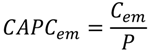
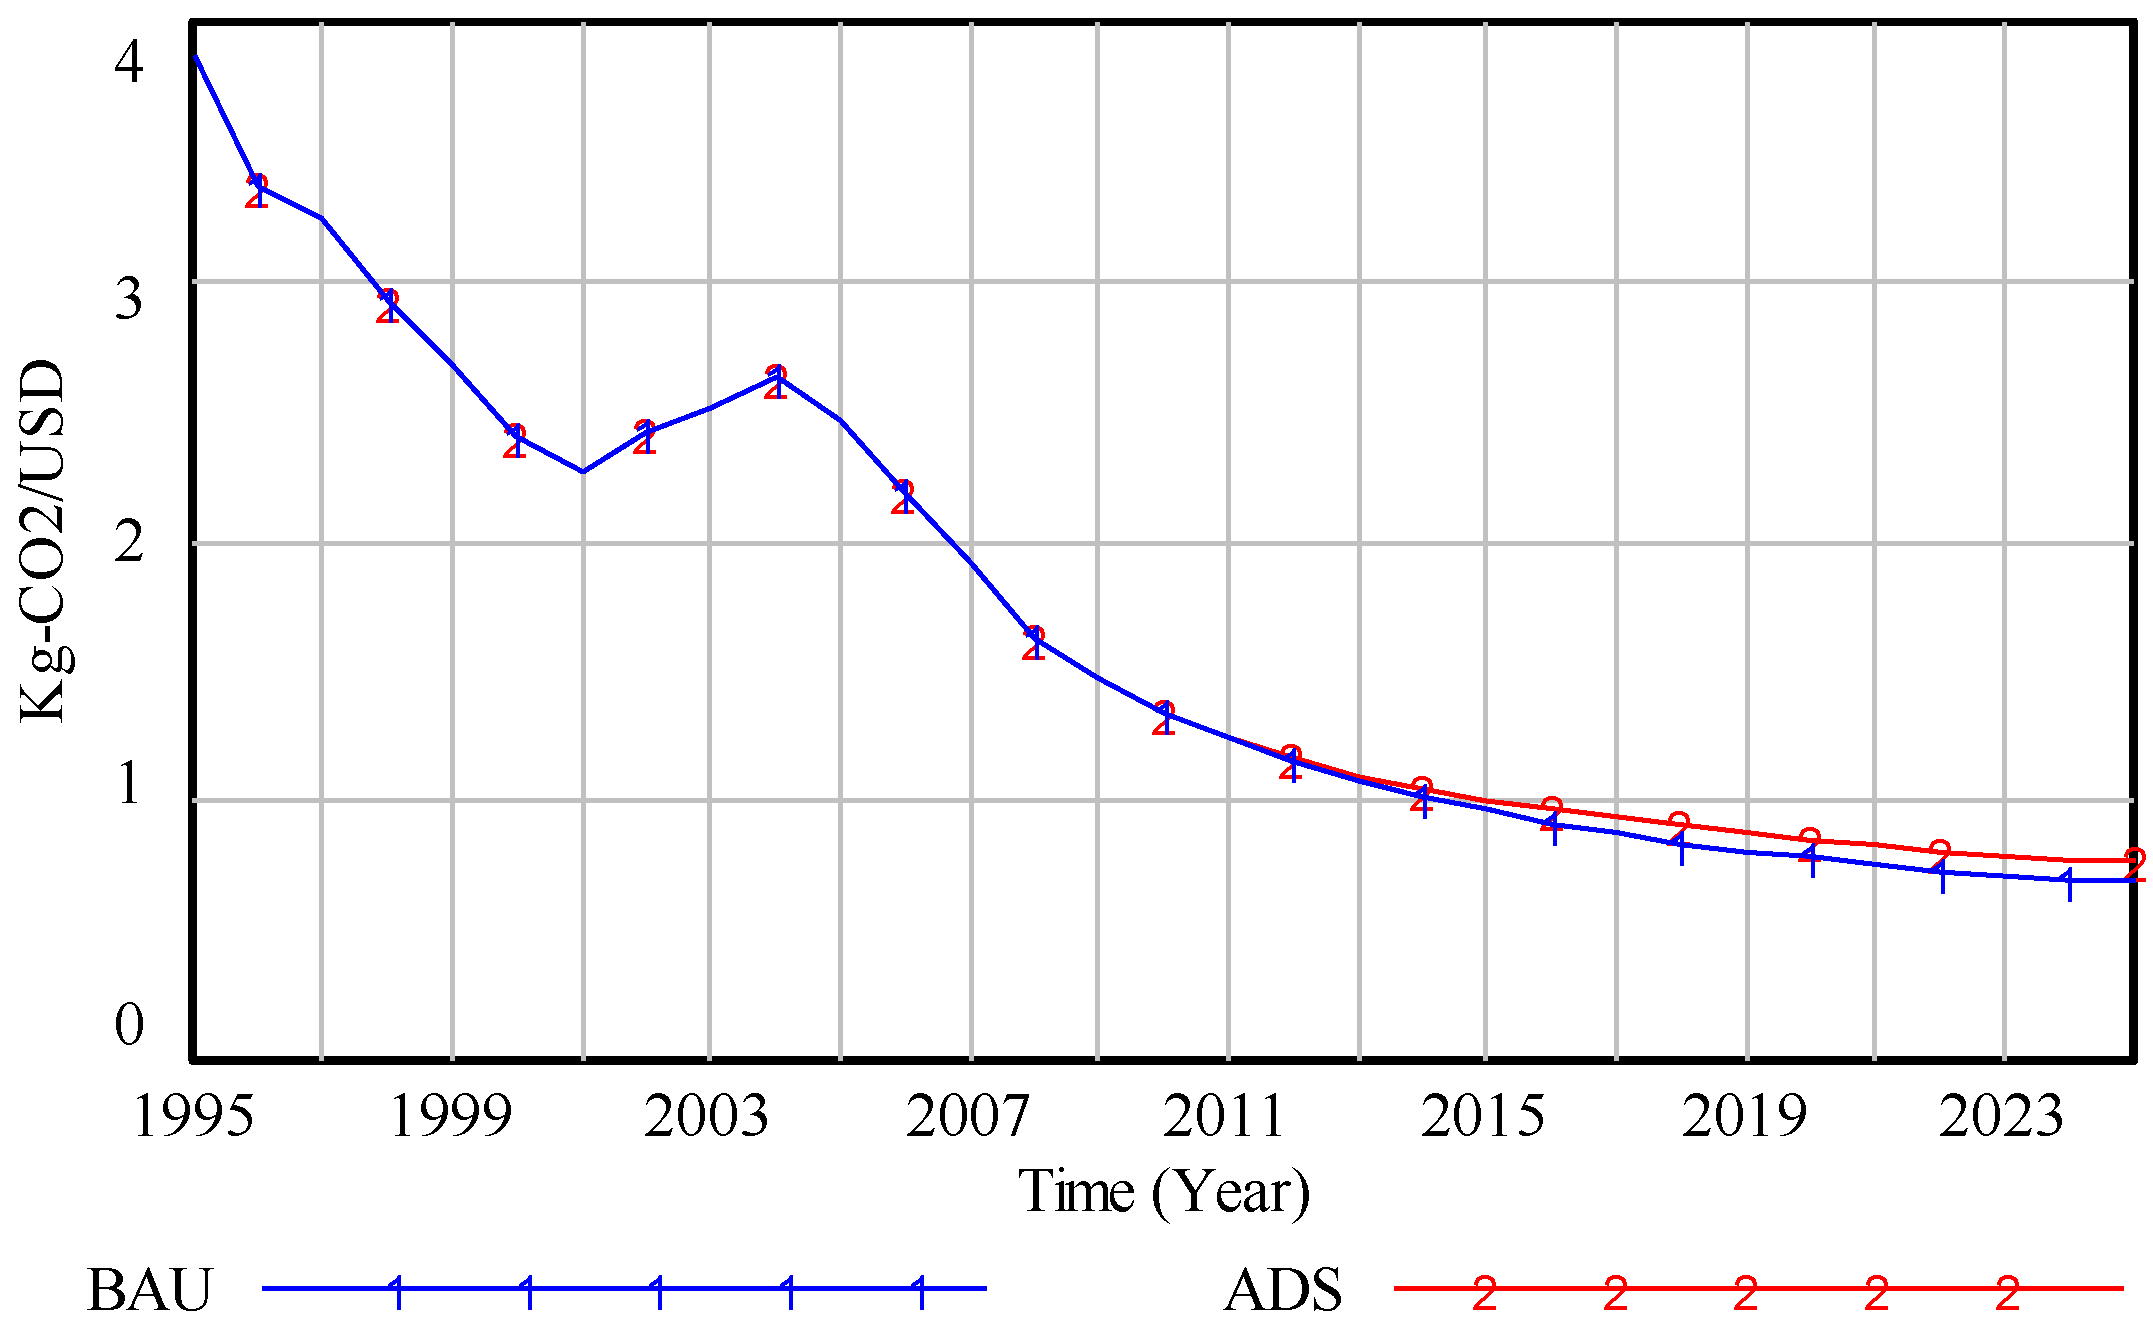
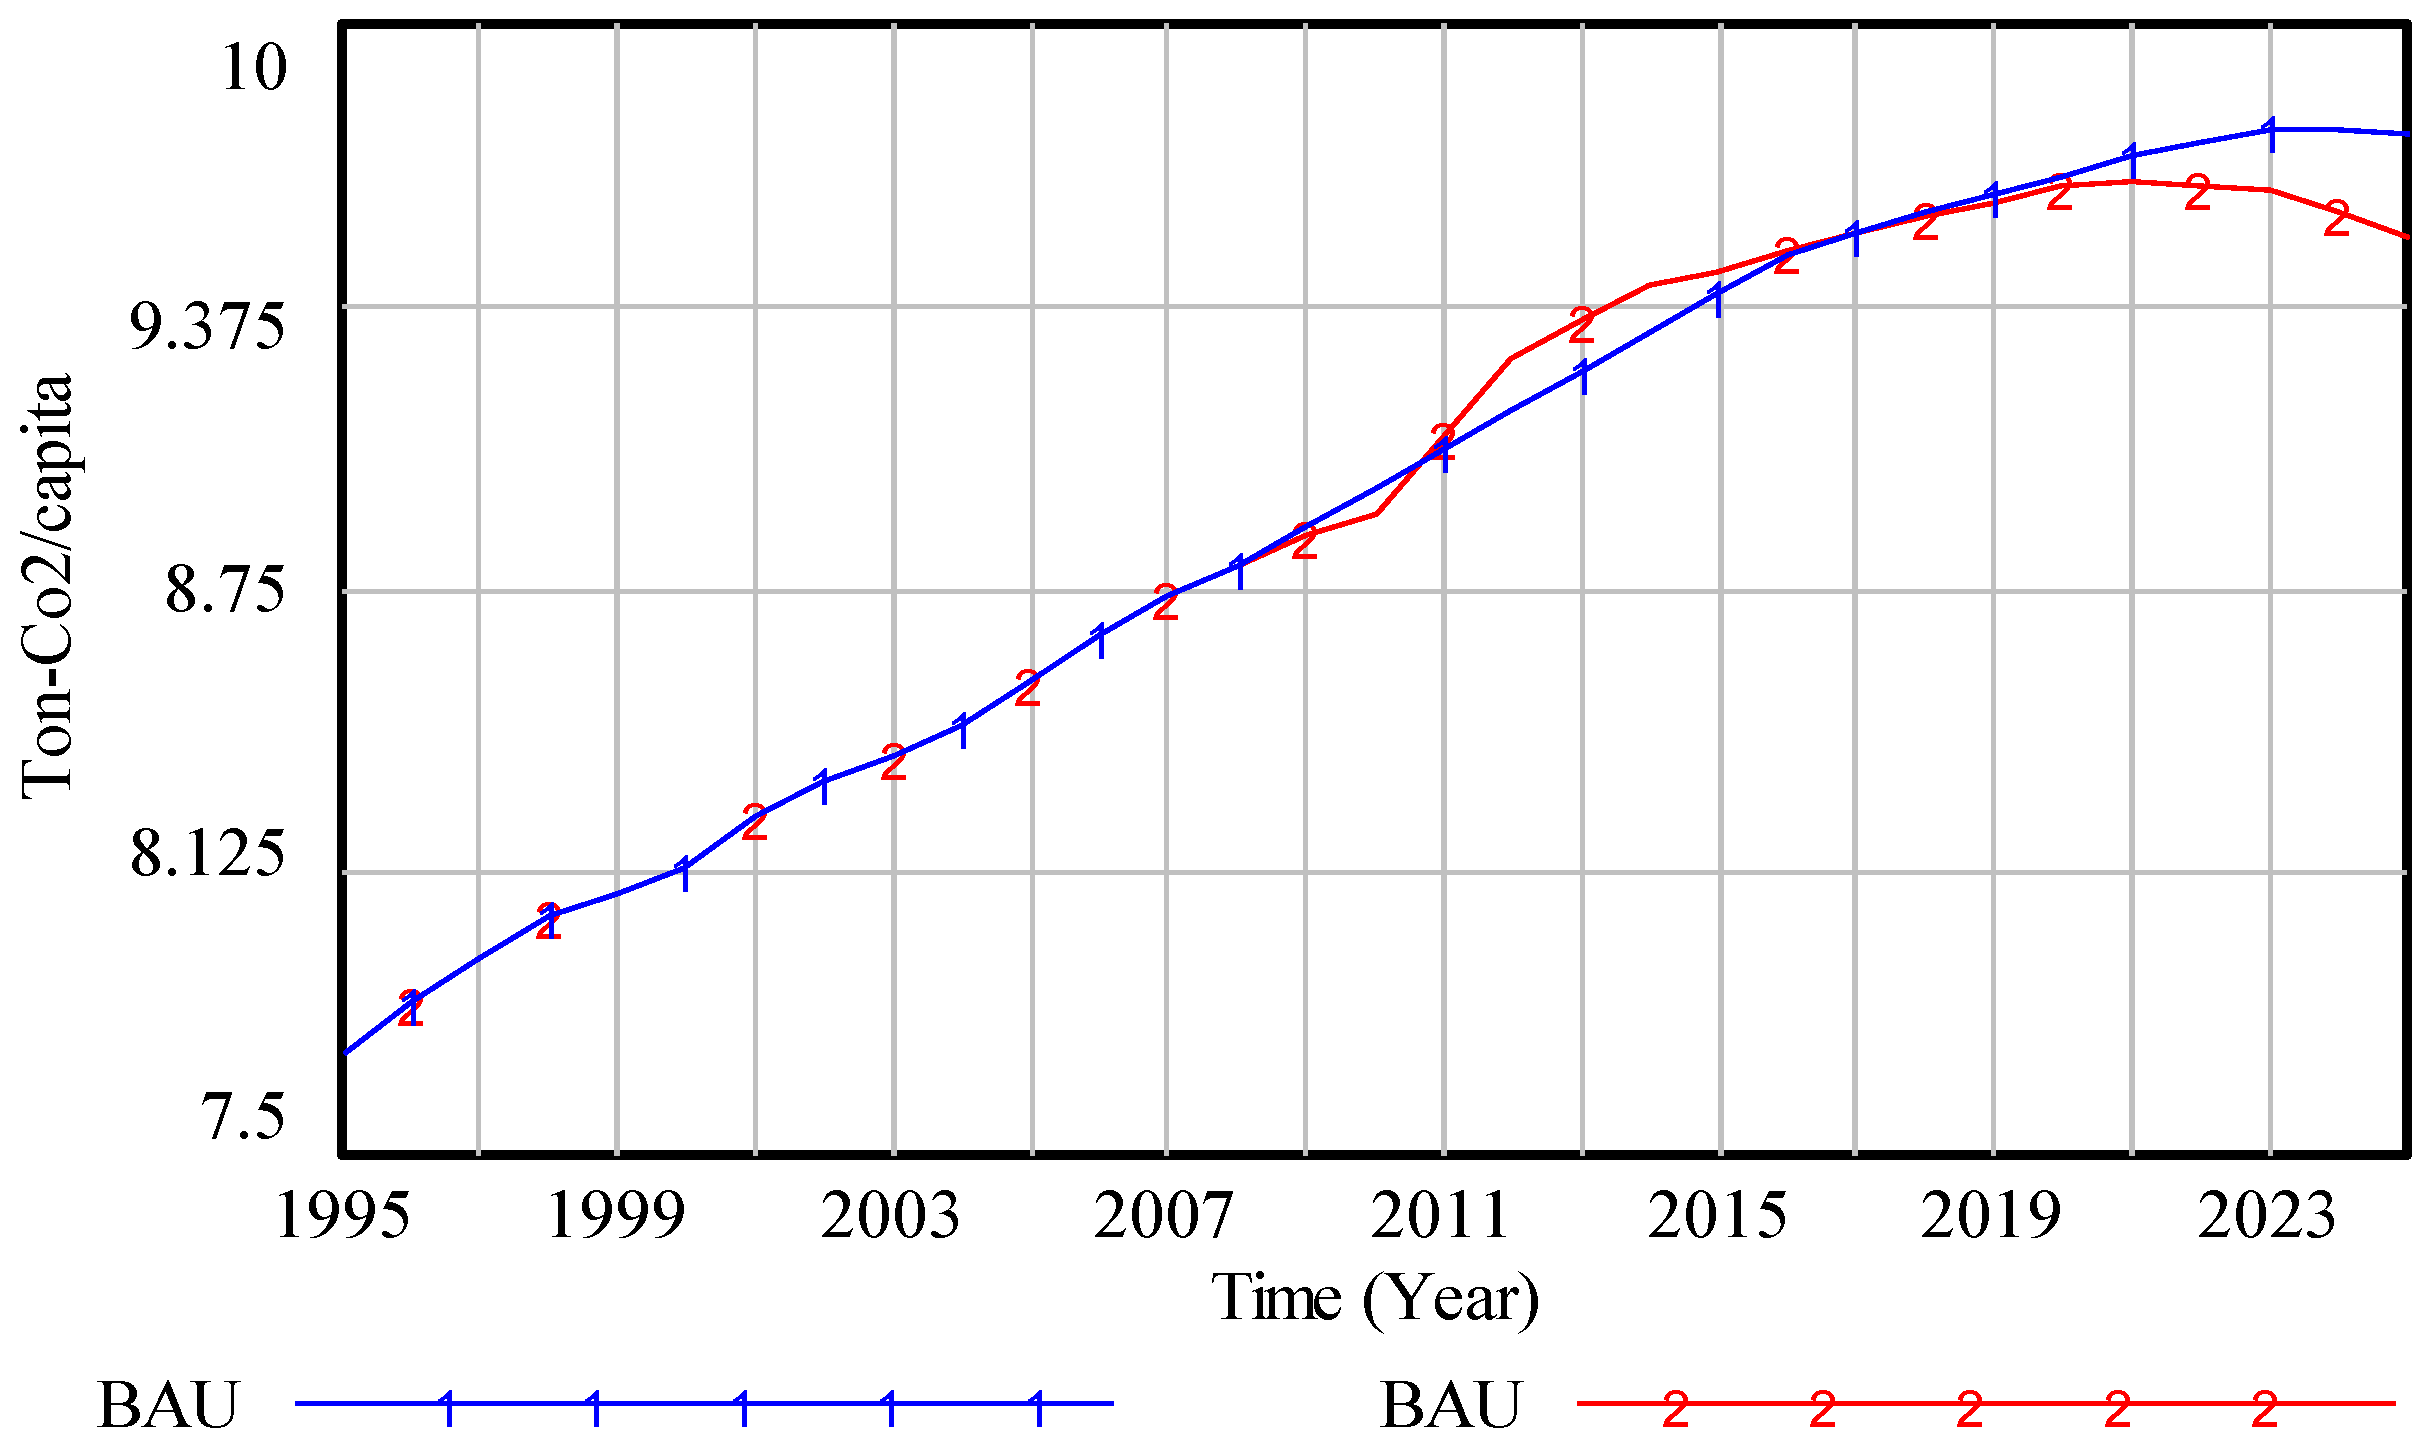
3.3.3. Per Capita CO2 Emission
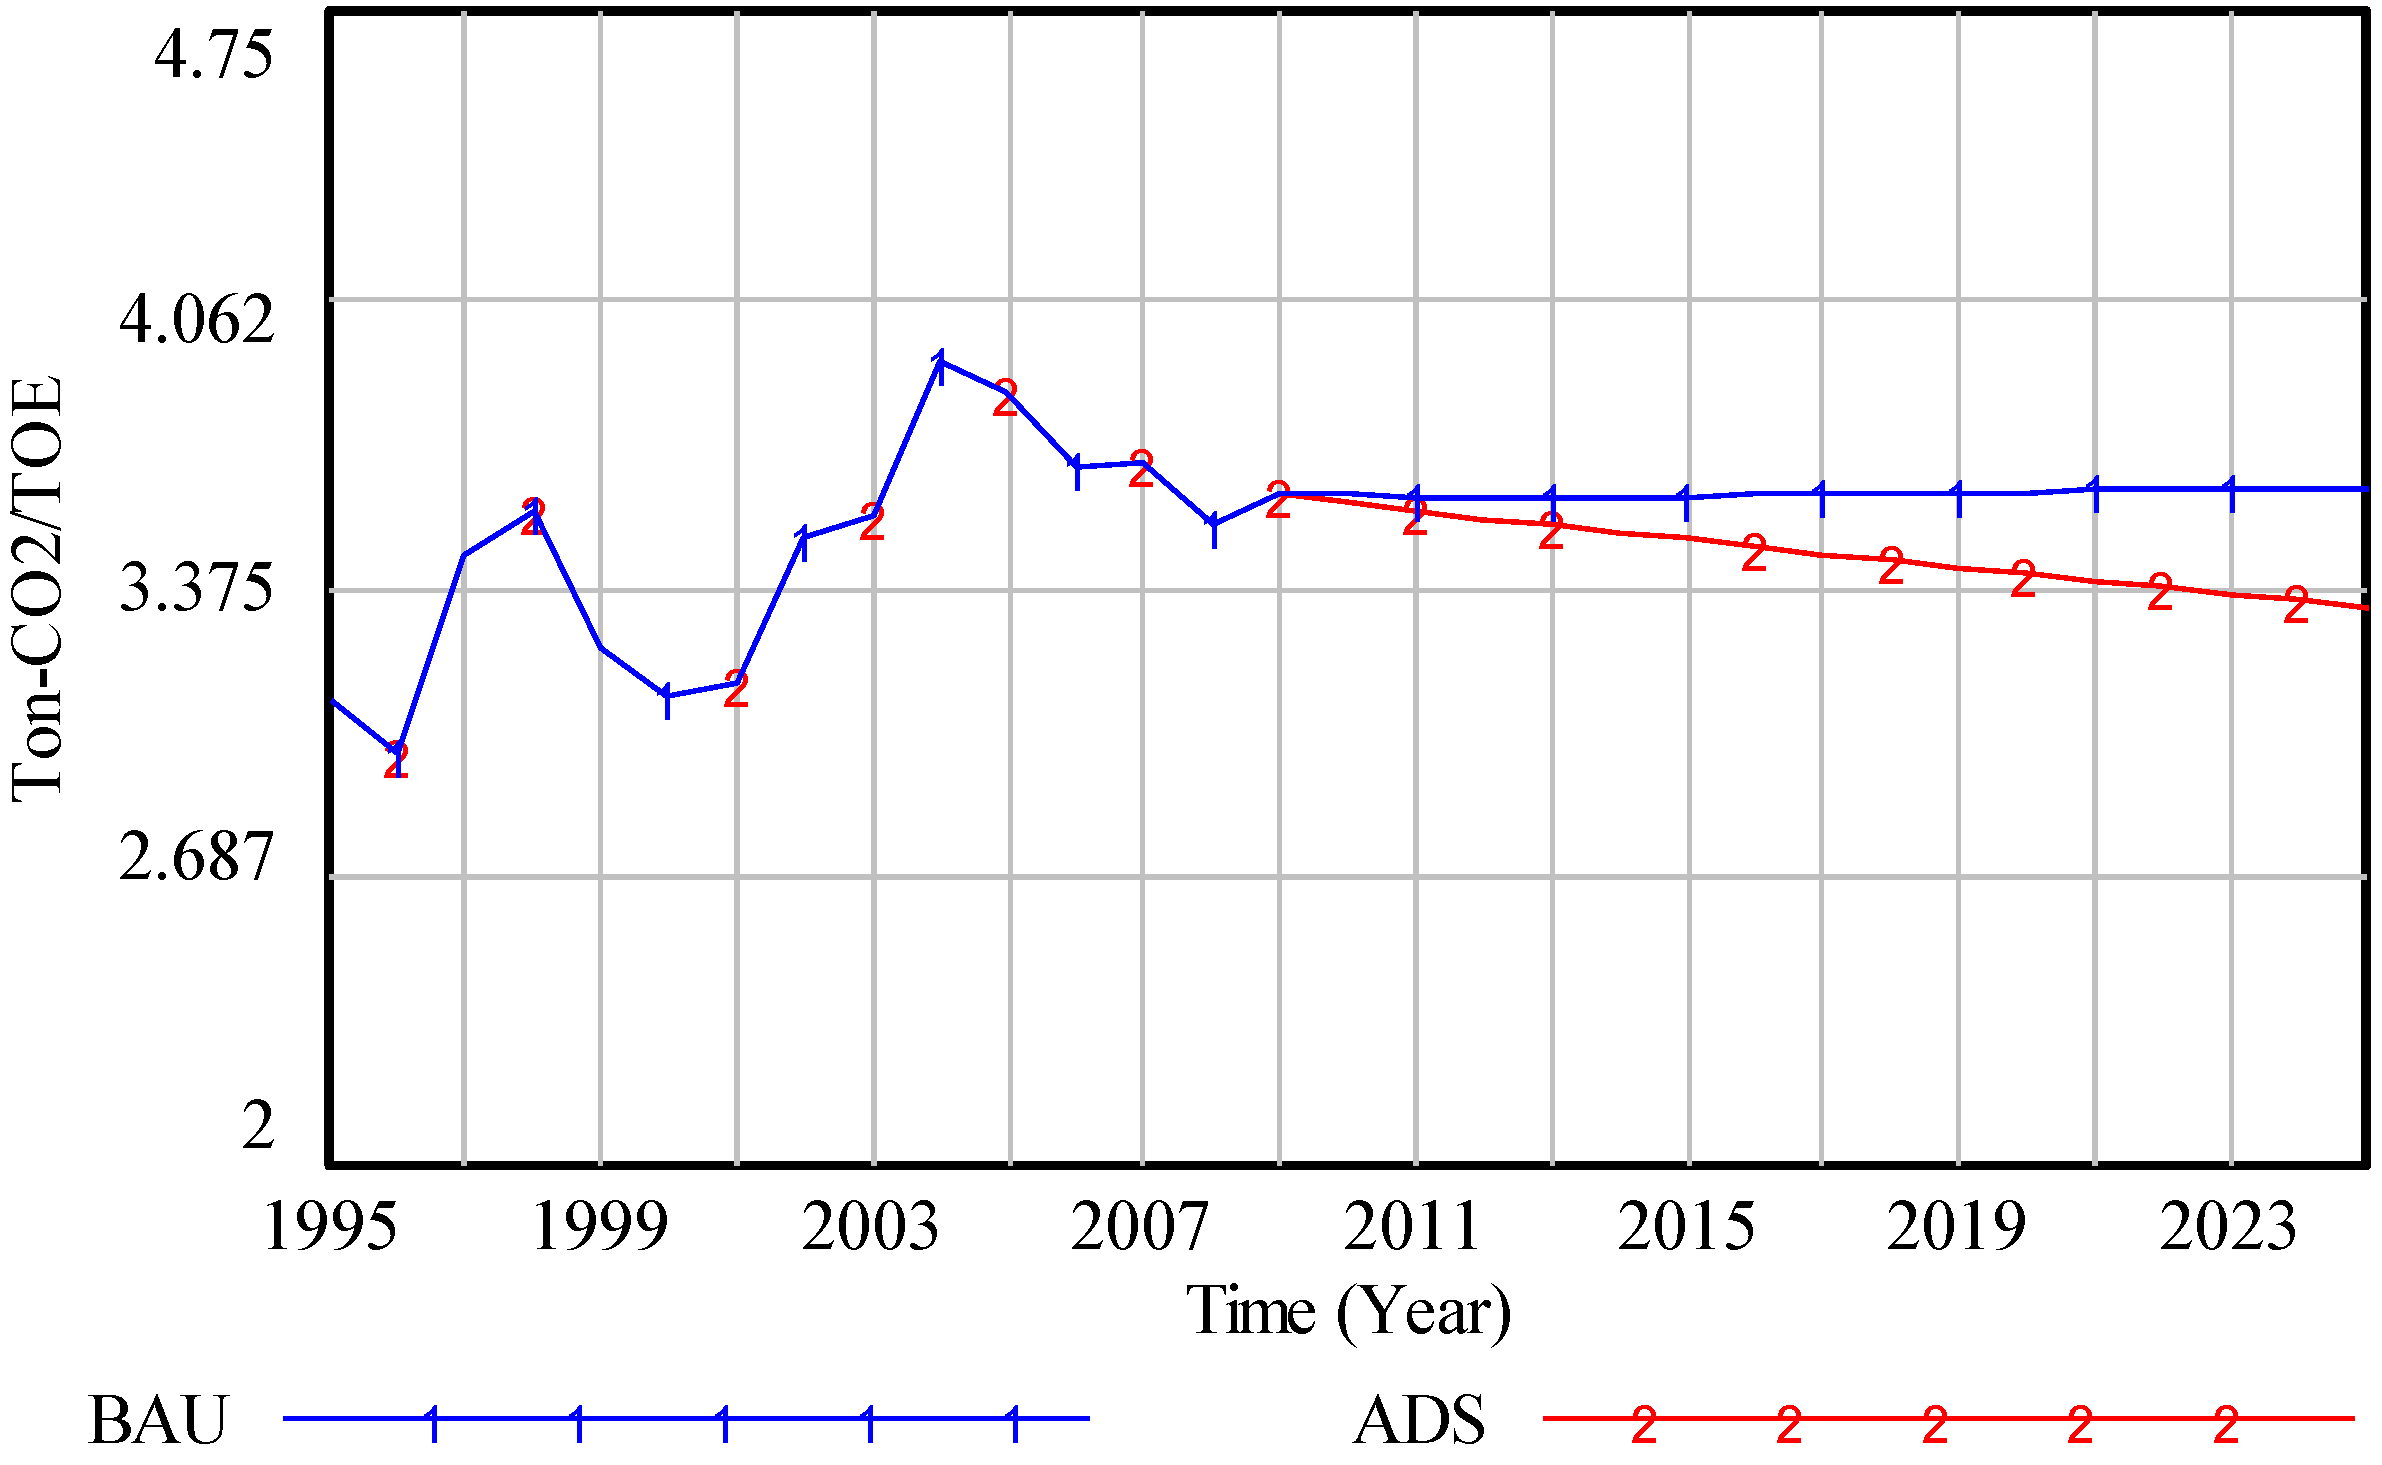
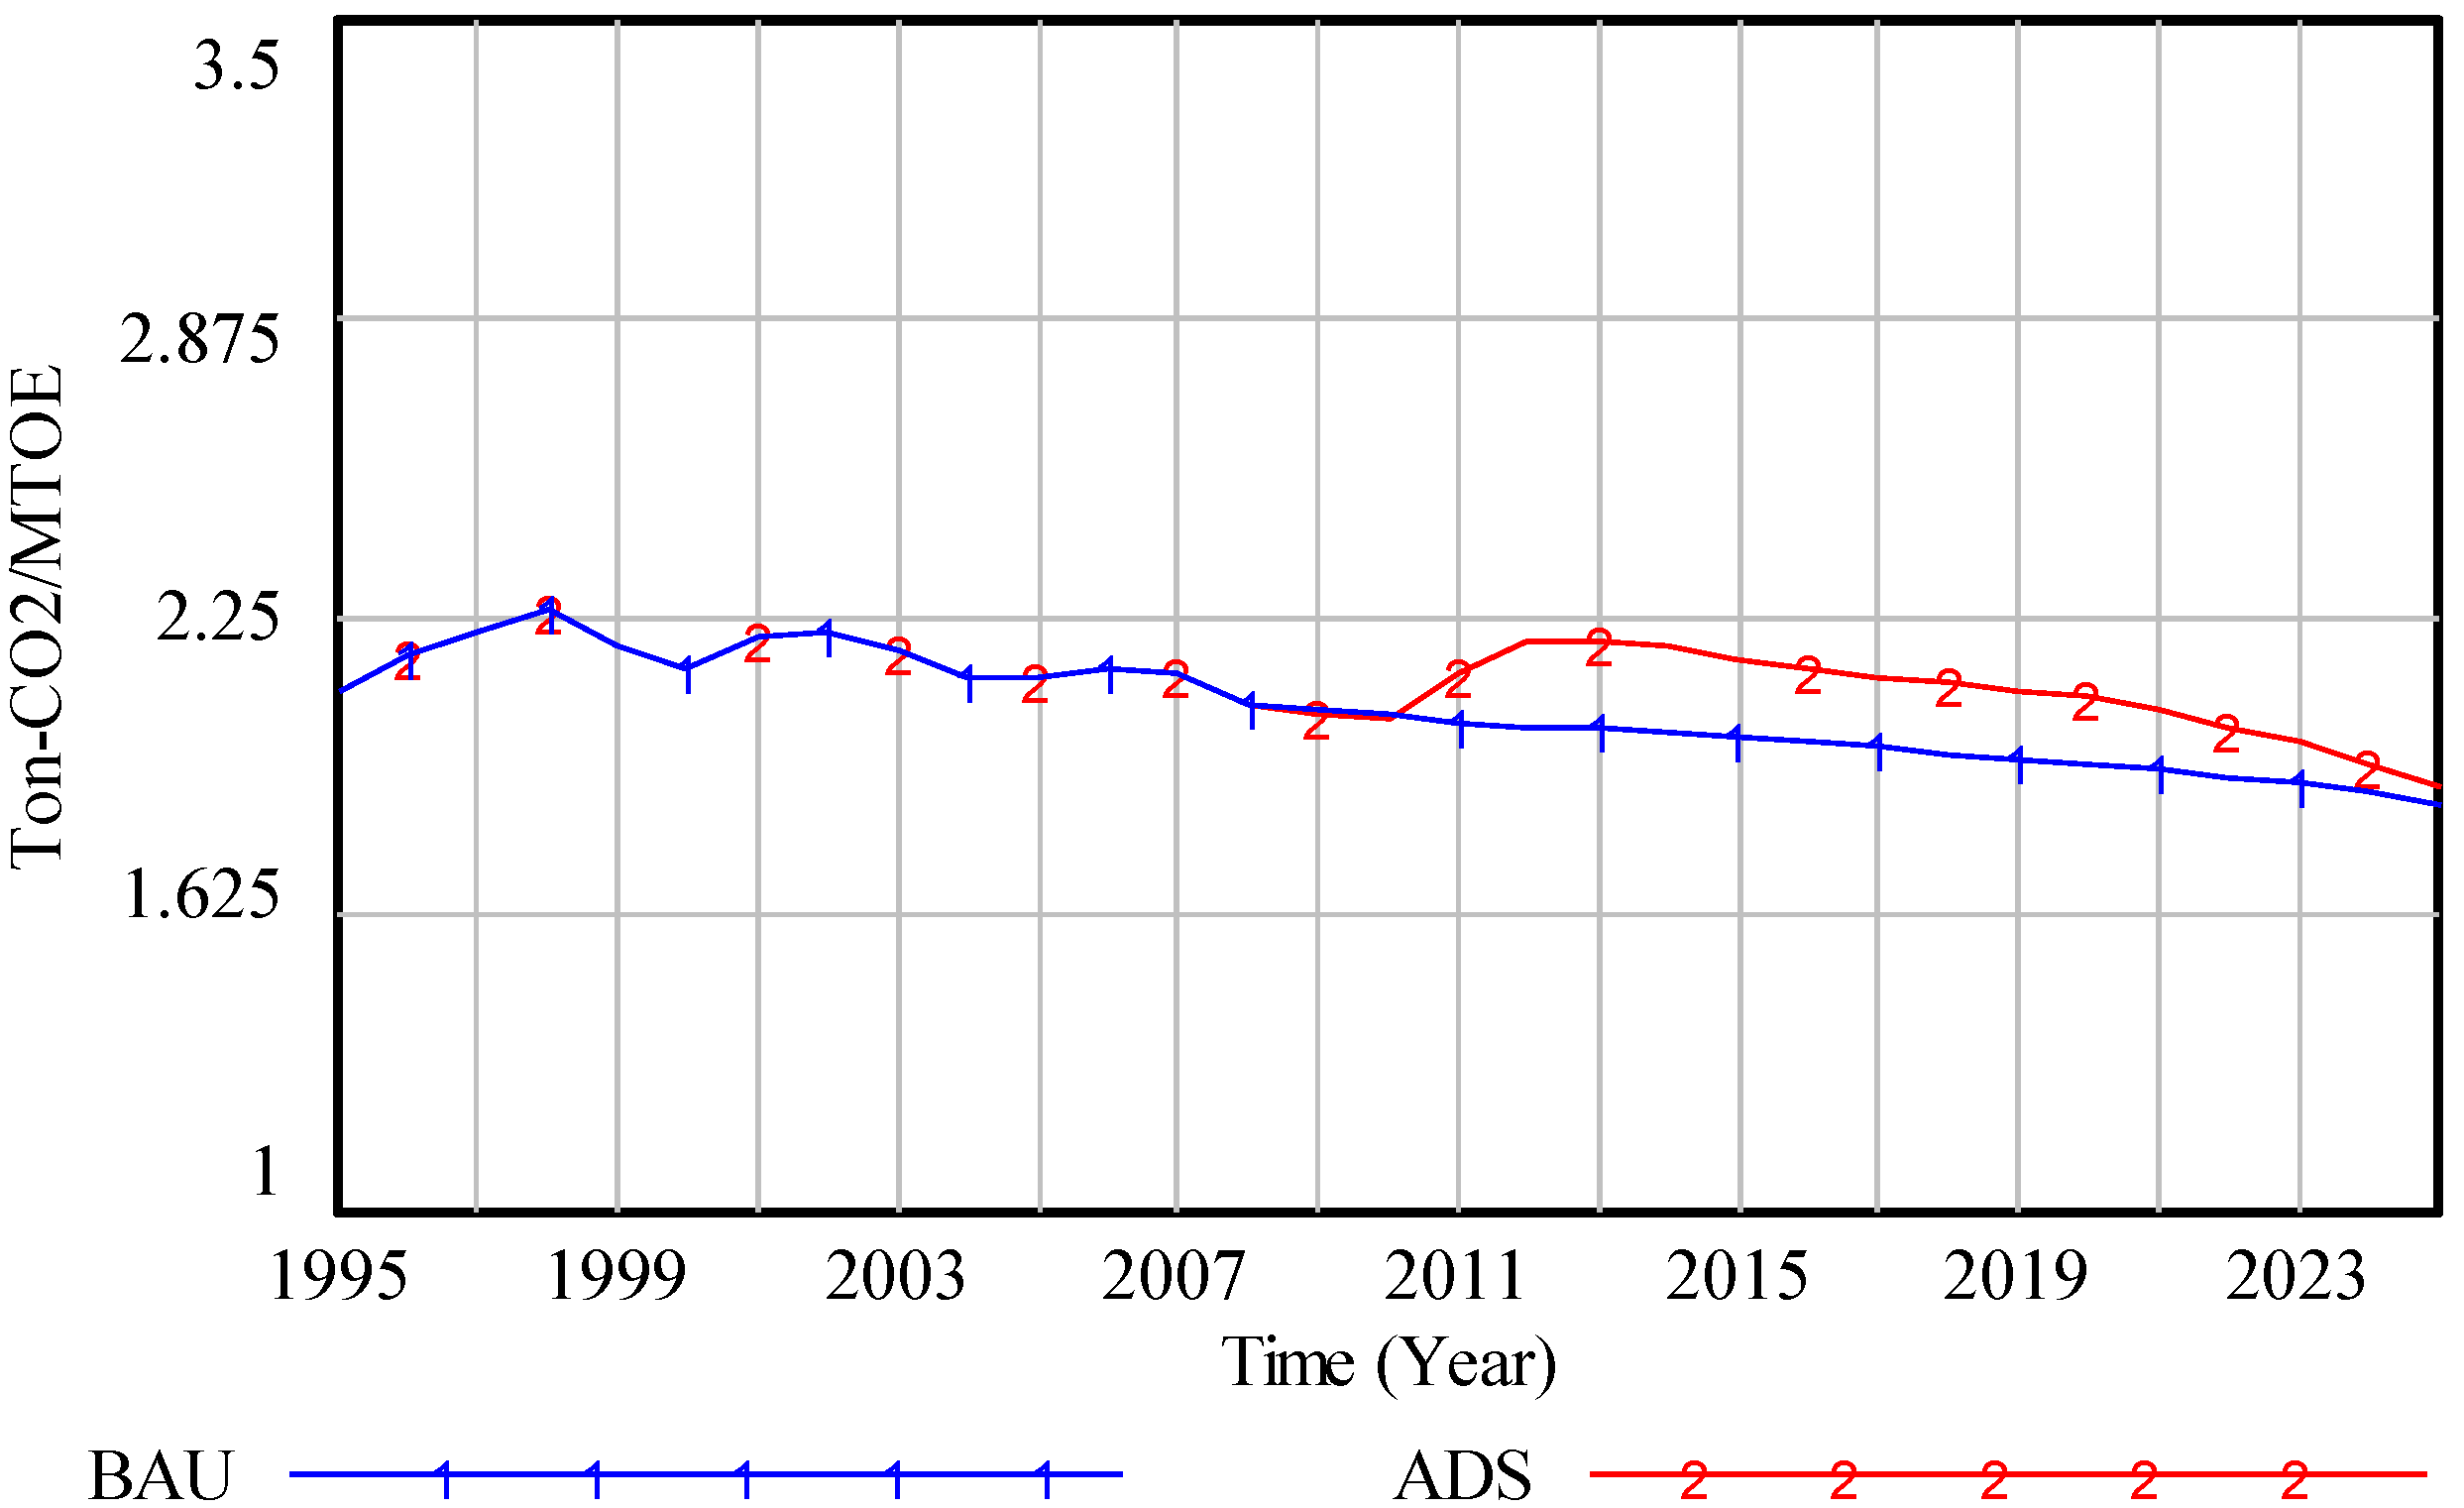
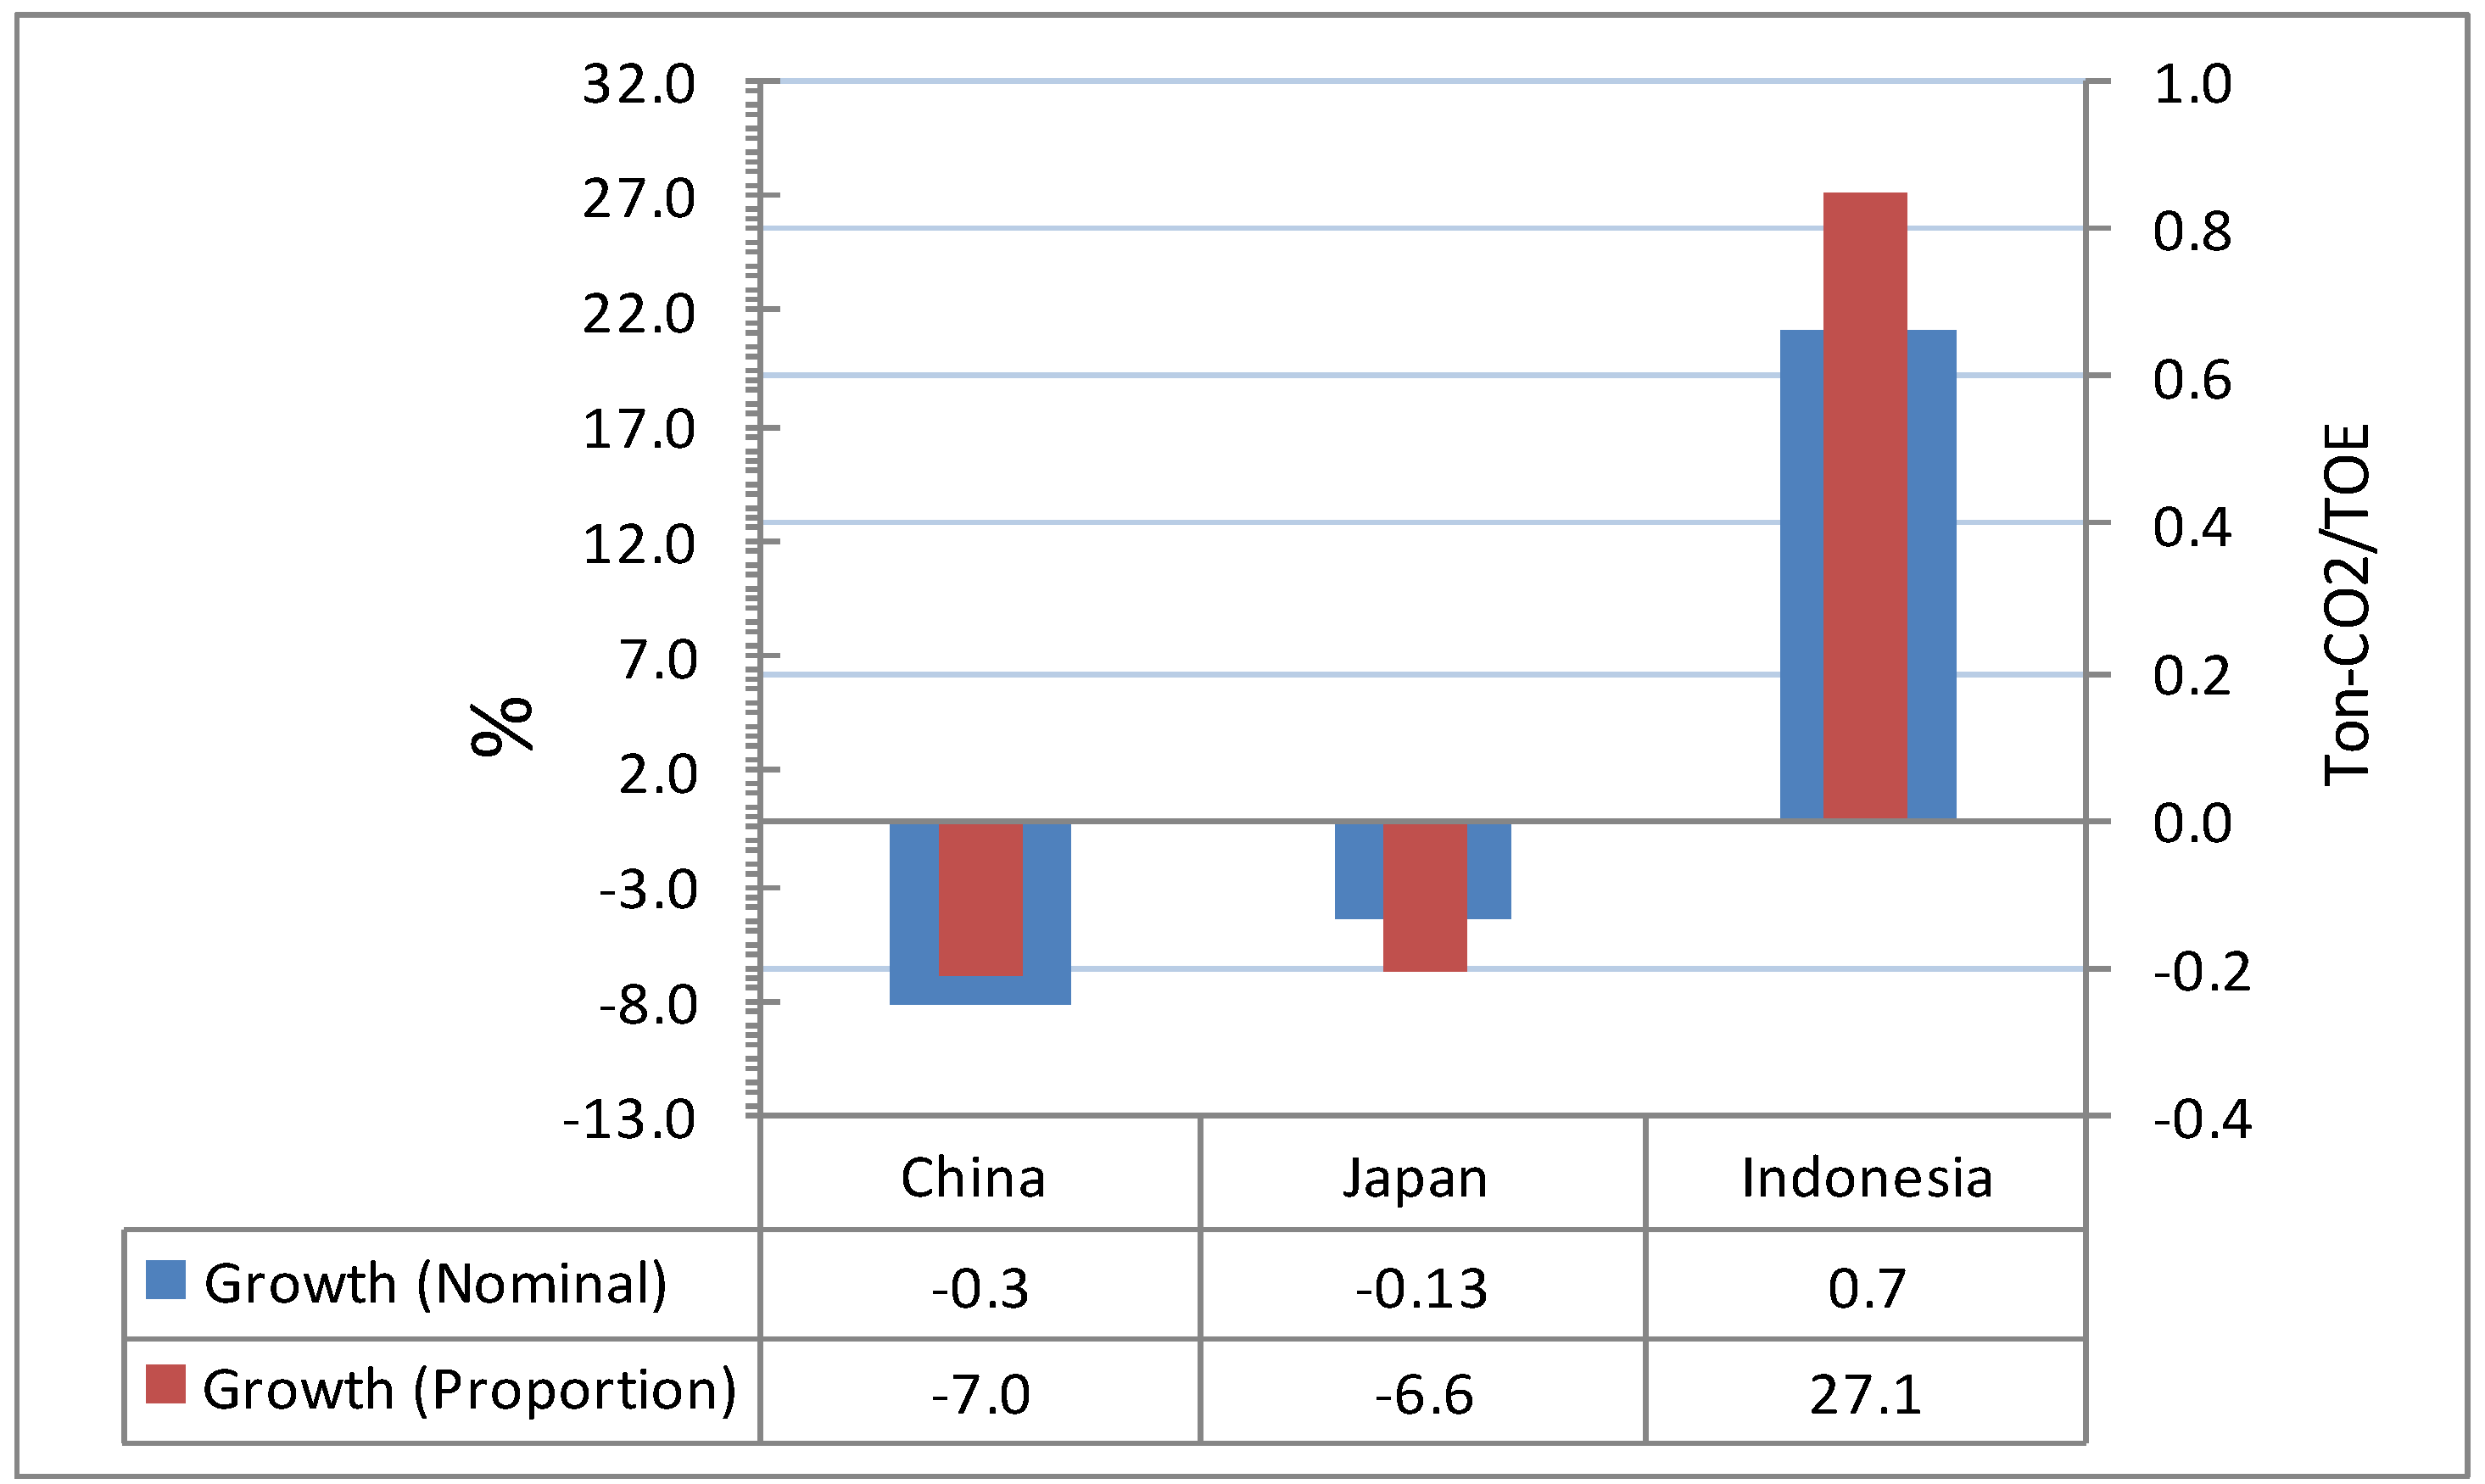
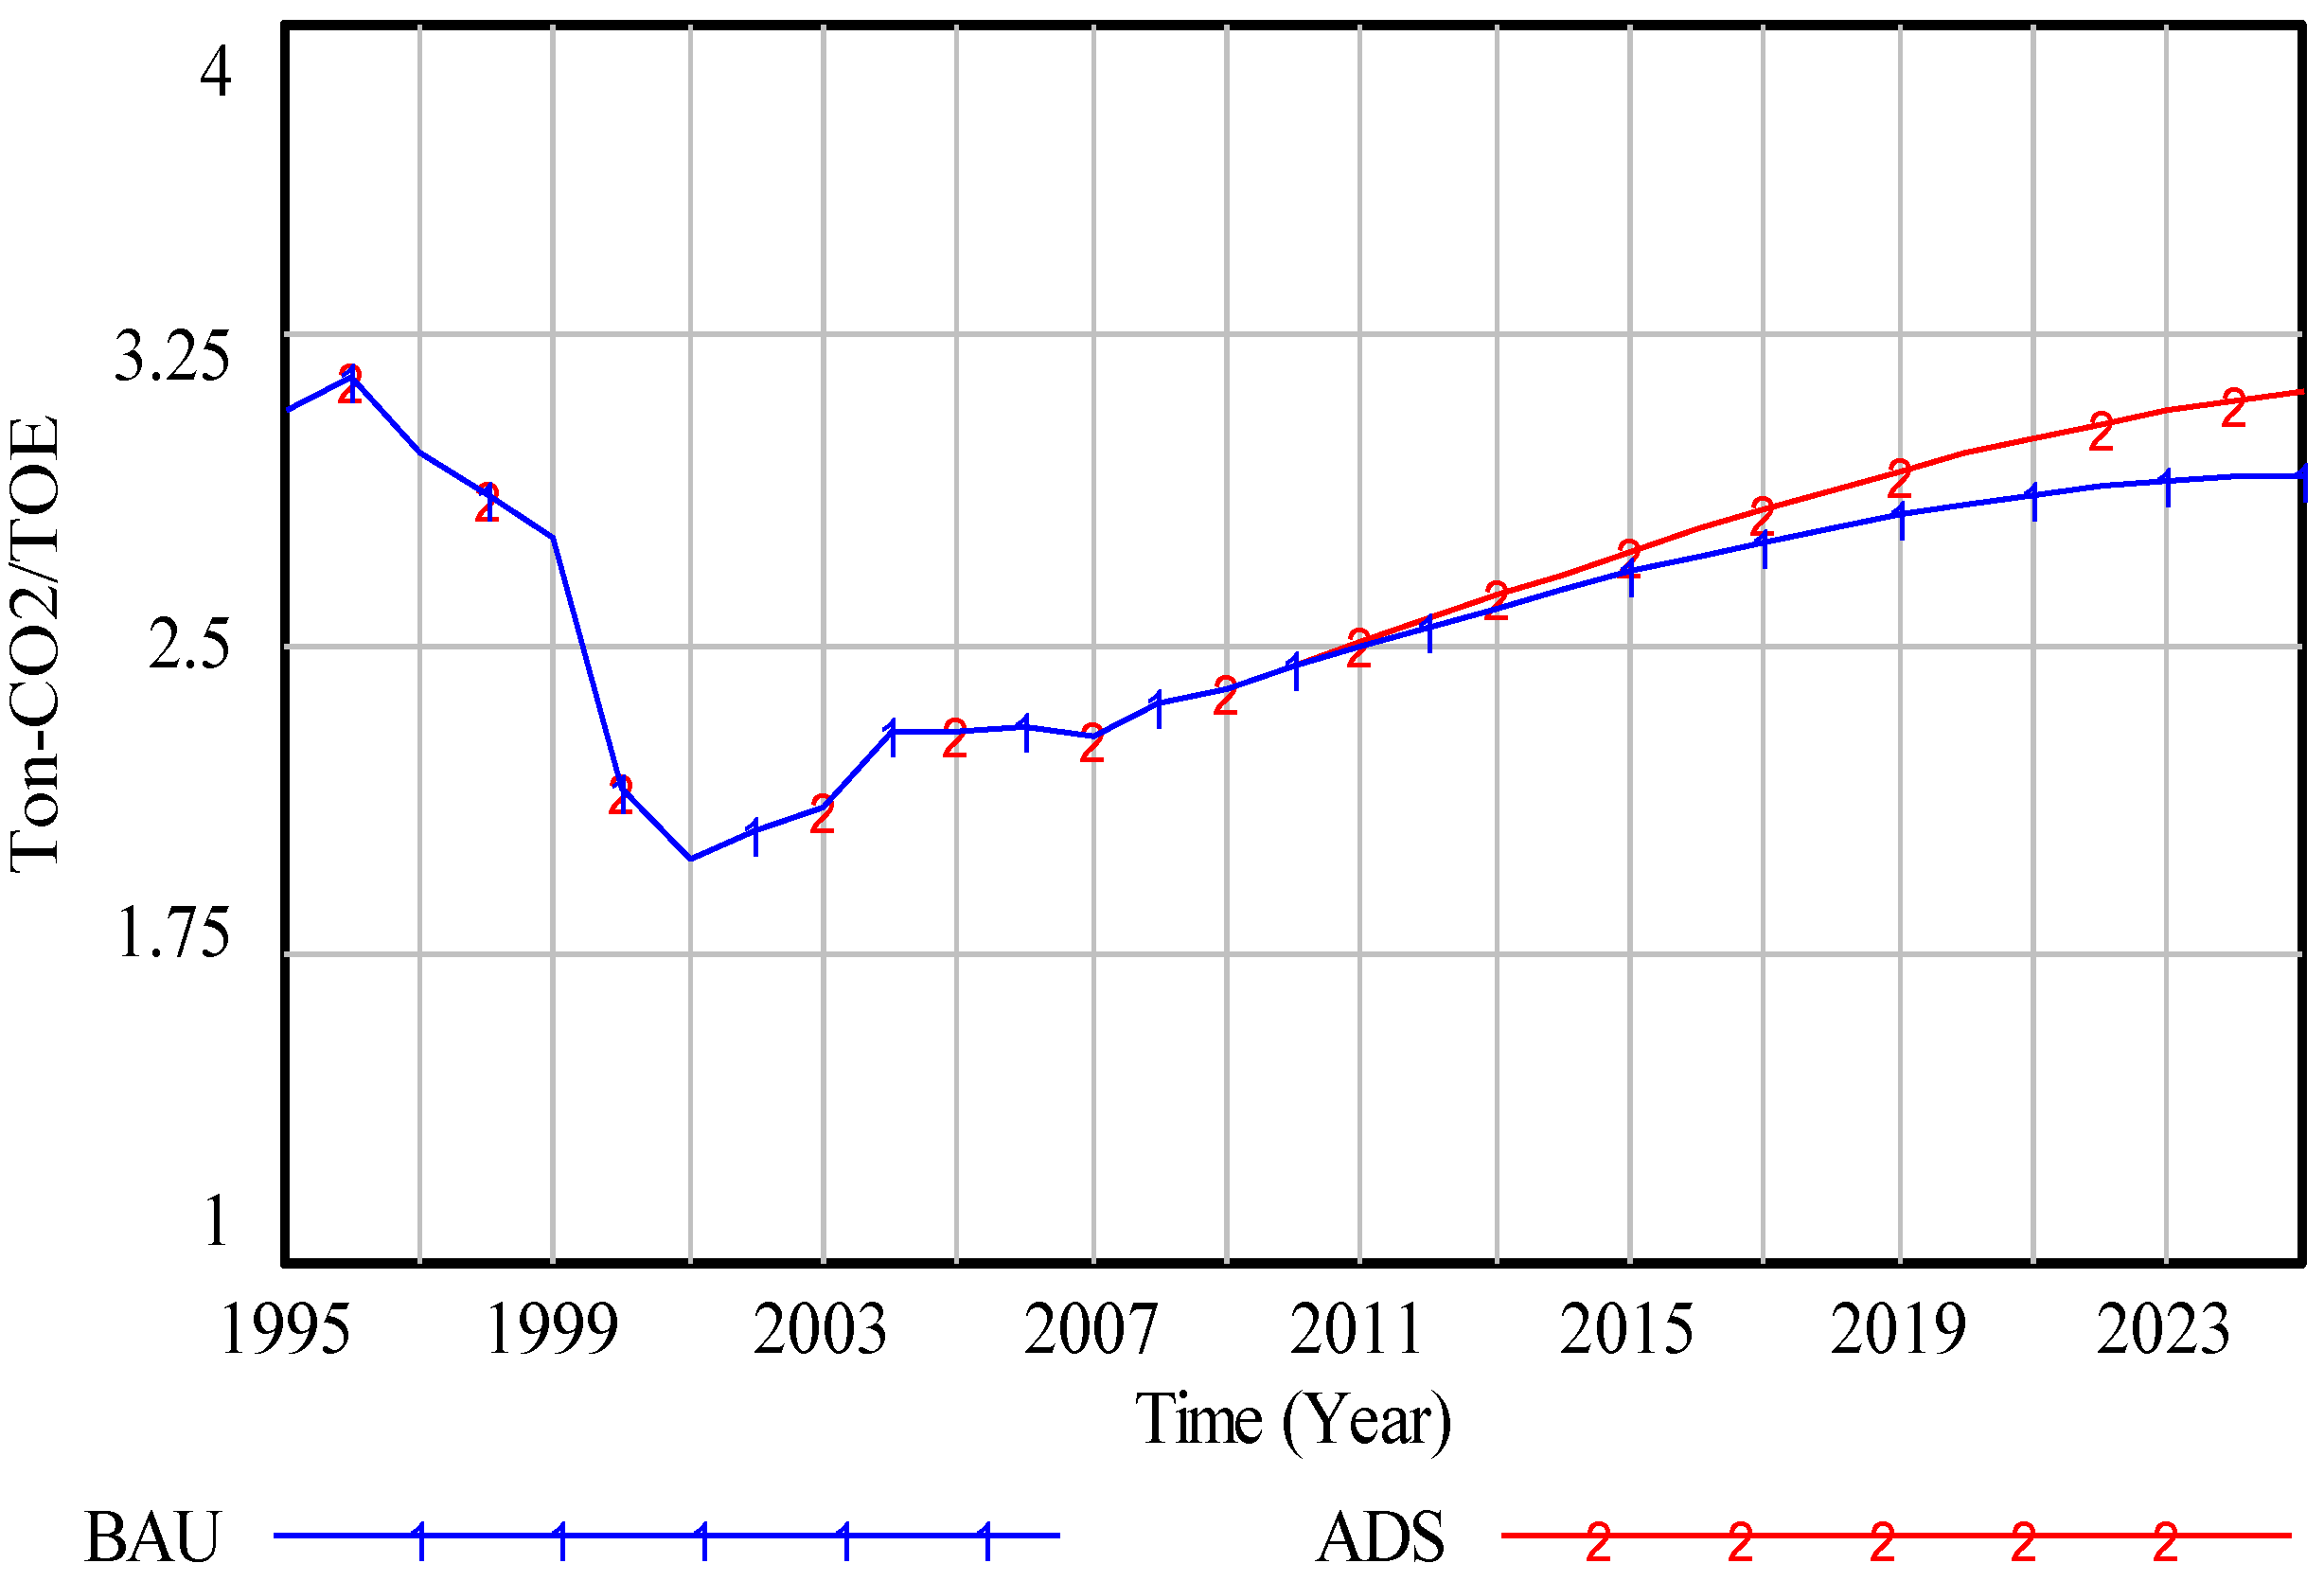
3.3.4. Carbon Intensity of Energy
4. Result and Analysis
4.1. Country Performance
4.1.1. China

4.1.2. Japan


4.1.3. Indonesia


4.2. Country Comparison
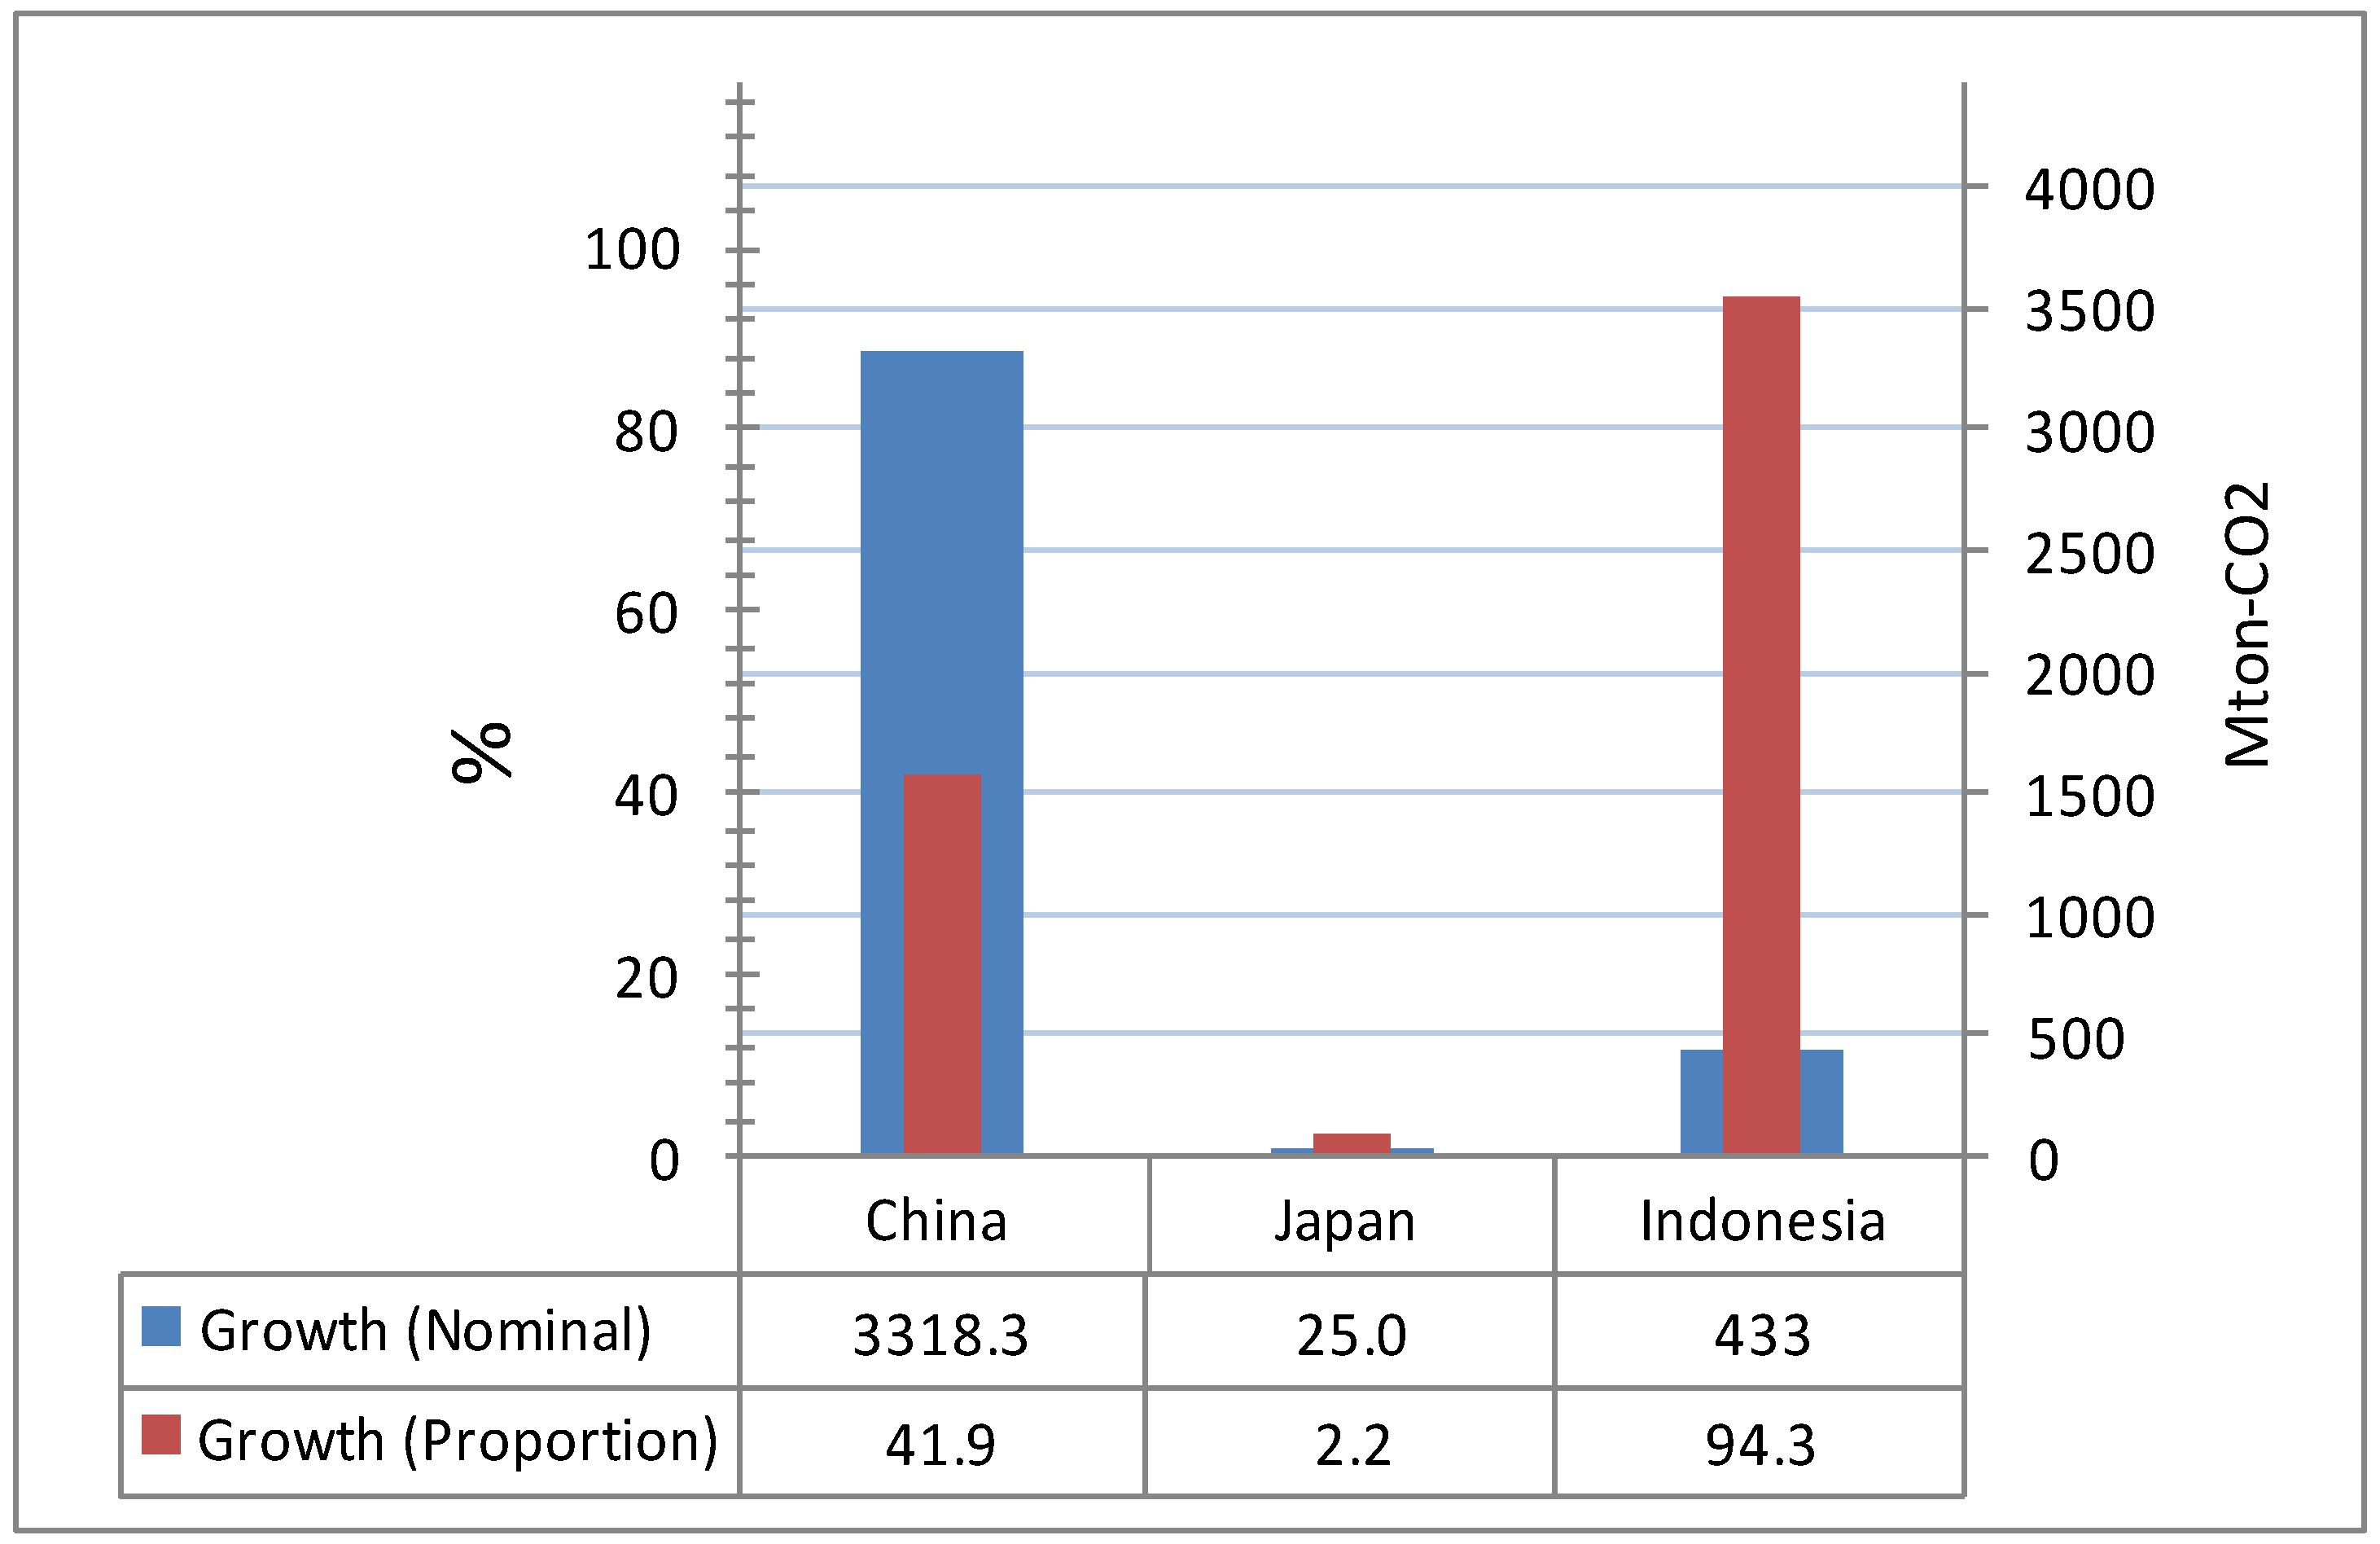
4.2.1. CO2 emission

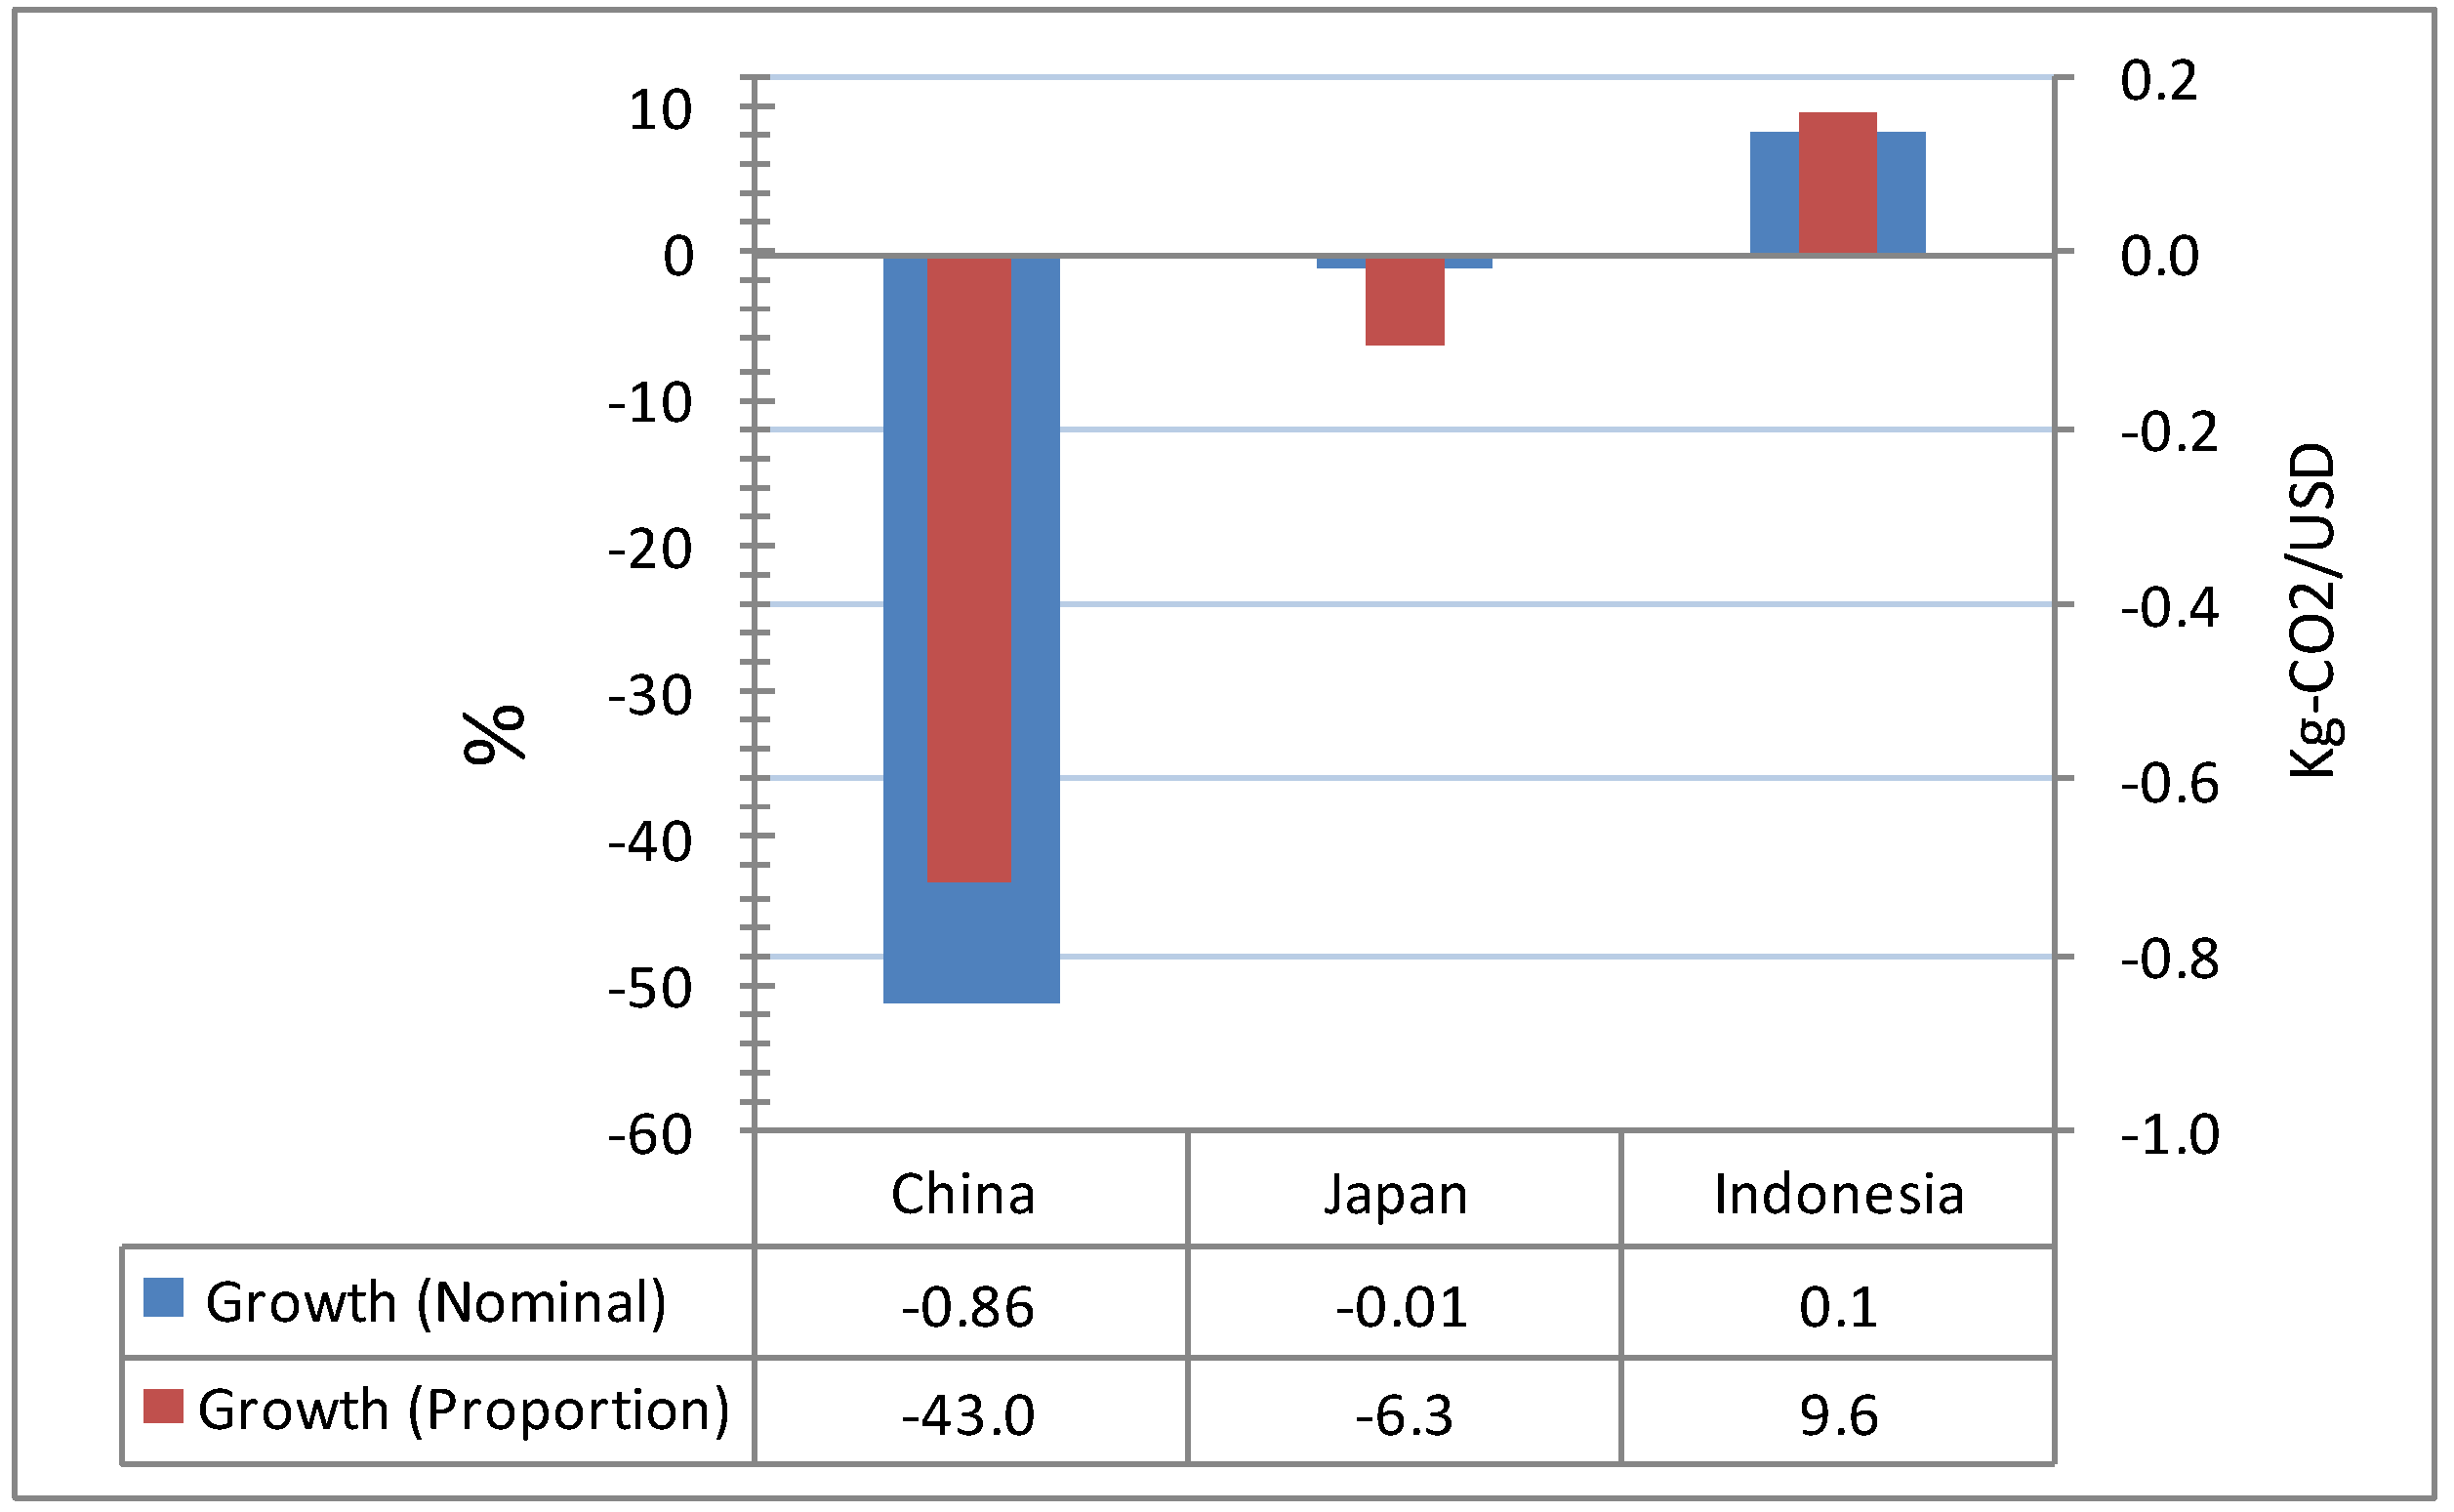
4.2.2. Carbon Intensity of Economy
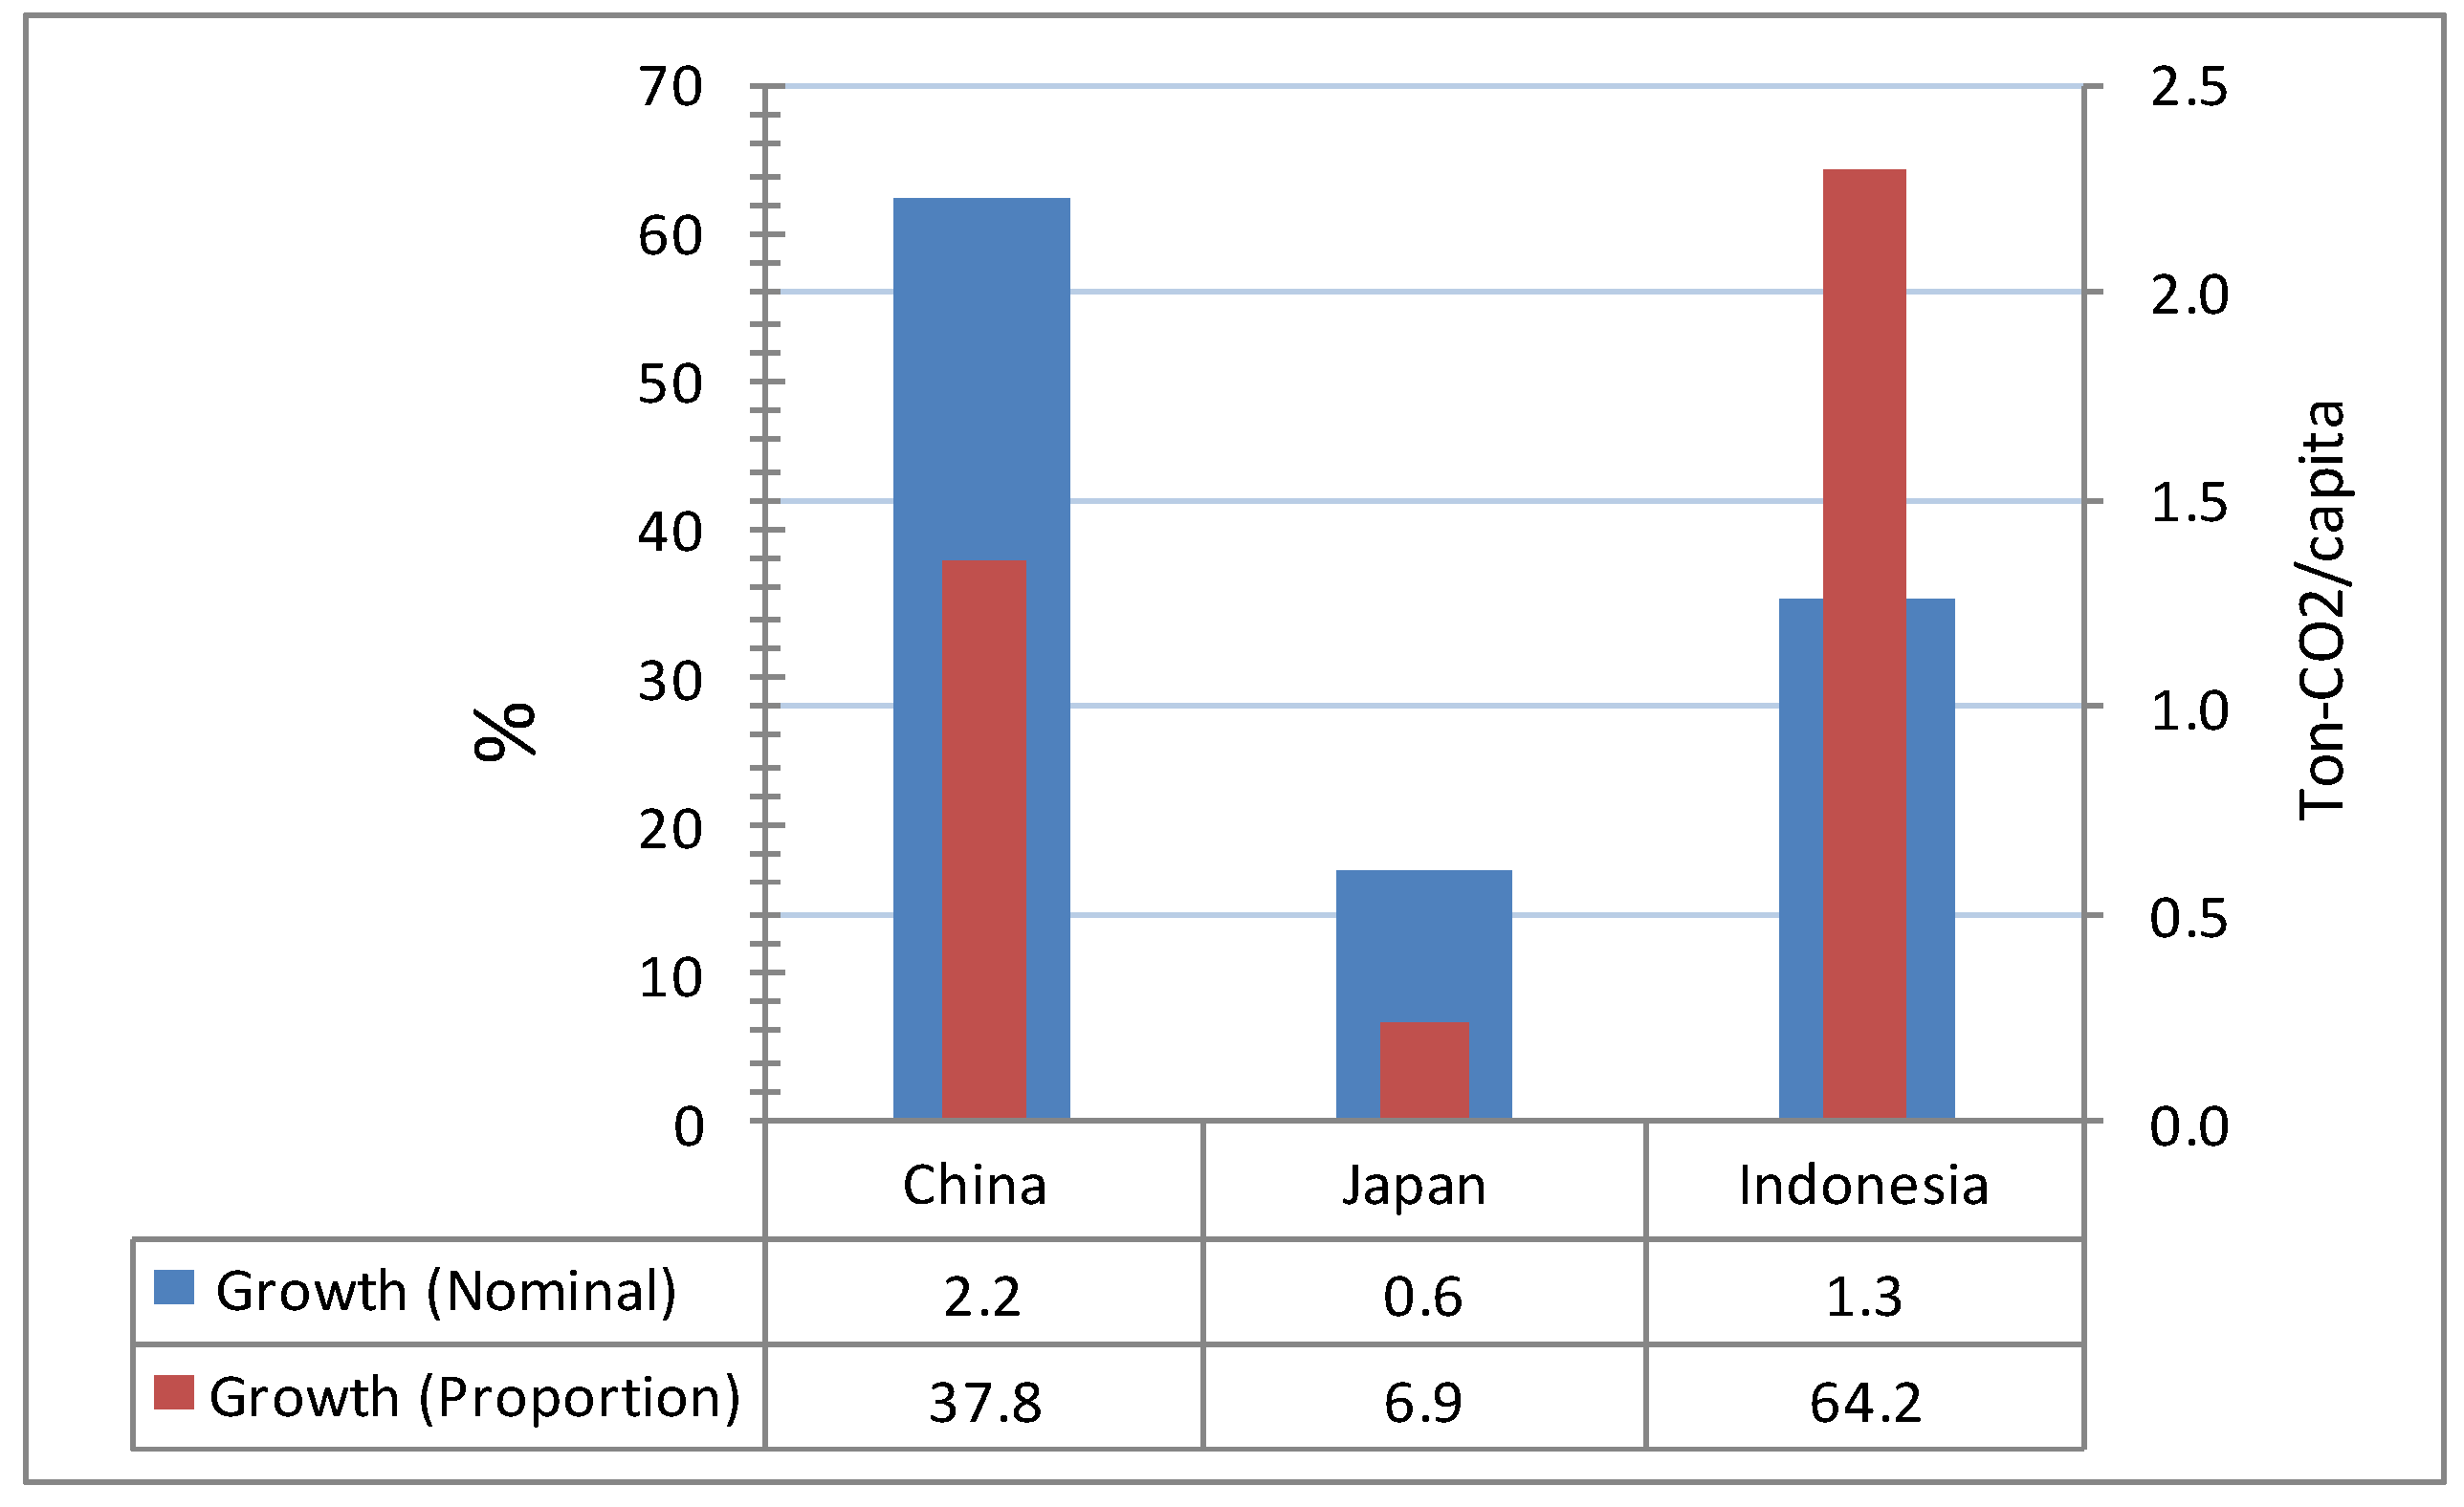
4.2.3. Per Capita Emission

4.2.4. Carbon Intensity of Energy

5. Discussion
6. Conclusion
Acknowledgments
Conflict of Interest
References and Notes
- IEA, Energy Security and Climate Change: Assessing Interactions; International Energy Agency: Paris, France, 2007.
- APERC, A Quest for Energy Security in the 21st century; Asia Pacific Energy Research Centre—Institute of Energy Economics: Tokyo, Japan, 2007.
- IEA, Contribution of Renewables to Energy Security; International Energy Agency: Paris, France, 2007.
- ASEAN, Cebu Declaration on East Asia Energy Security; ASEAN secretariat: Jakarta, Indonesia, 2007.
- East Asian Summit (EAS) is a regional forum which attended by ASEAN + 6 countries. It includes all ASEAN countries plus China, Japan, Korea, India, Australia and New Zealand. Recently United States and Russia are also joining the forum.
- Ozeki, H. Development of De Facto Economic Integration in East Asia. In Deepening Economic Integration in East Asia: The ASEAN Economic Community and Beyond; Soesastro, H., Ed.; Economic Research Institute for ASEAN and East Asia: Jakarta, Indonesia, 2008. [Google Scholar]
- ADB, Key Indicators for Asia and Pacific 2010; Asian Development Bank: Mandaluyong City, Philippines, 2010.
- ADB, Asian Development Outlook 2011; Asian Development Bank: Mandaluyong City, Philippines, 2011.
- World Bank. World Development Indicator and Global Development Finance. Available online: http://databank.worldbank.org (accessed on 23 August 2012).
- Nasir, A.; Ali, T.M.; Shahdin, S.; Rahman, T.U. Technology achievement index 2009: Ranking and comparative study of nations. Scientometrics 2011, 87, 41–62. [Google Scholar] [CrossRef]
- IEEJ. APEC Energy Database. 2011. Retrieved from the Institute of Energy Economics Japan. Available online: www.ieej.or.jp (accessed on 2 February 2011).
- Leung, G.C.K. China’s energy security: Perception and reality. Energ. Pol. 2011, 39, 1330–1337. [Google Scholar] [CrossRef]
- EIA. International energy statistics. Energy Information Administration U.S. Department of Energy. 2011. Available online: http://www.eia.gov/ (accessed on 20 February 2011).
- MOIAC, Statistical Handbook of Japan; Ministry of Internal Affairs and Communications-Statistics Bureau: Tokyo, Japan, 2010.
- BPS, Pertumbuhan Ekonomi Indonesia; Biro Pusat Statistik: Jakarta, Indonesia, 2011.
- BAPENNAS-BPS, Proyeksi Penduduk 2000–2025; Badan Perencanaan Nasional—Biro Pusat Statistik: Jakarta, Indonesia, 2005.
- UNDP, Human Development Report 2001: Making New Technologies Work for Human Development; United Nation Development Program, Oxford University Press: New York, USA, 2001.
- BPPT. Outlook Energy Indonesia 2010; Badan Pengkajian and Penerapan Teknologi—Press: Jakarta, Indonesia, 2010.
- Vivoda, V. Evaluating energy security in the Asia-Pacific region: A novel methodological approach. Energ. Pol. 2010, 38, 5258–5263. [Google Scholar] [CrossRef]
- Sovacool, B. Evaluating energy security in the Asia Pacific: Towards a more comprehensive approach. Energ. Pol. 2011, 39, 7472–7479. [Google Scholar] [CrossRef]
- Sovacool, B.K.; Mukherjee, I.; Drupady, I.M.; D’Agostino, A.L. Evaluating energy security performance from 1990 to 2010 for eighteen countries. Energy 2011, 36, 5846–5853. [Google Scholar] [CrossRef]
- Prambudia, Y.; Todo, Y.; Nakano, M. Energy Security of Indonesia: System Dynamic Modelling and Policy Simulation. In Proceedings of the 10th Global Conference on Flexible Systems Management: Designing for Flexibility and Security for The Future, Yokohama, Japan, 2010.
- United Nations. UN Data. Statistics. Available online: http://data.un.org (accessed on 2 March 2011).
- UNIDO, Capability Building for Catching-Up: Historical, Empirical and Policy Dimensions; United Nations Industrial Development Organization—United Nations, Vienna, Austria, 2005.
- KPMG, China’s 12th Five-Year Plan: Energy; KPMG Advisory China Limited: Beijing, China, 2011.
- Lu, C.; Tong, Q.; Liu, X. The impact of carbon tax and complementary policies on Chinese economy. Energ. Pol. 2010, 38, 7278–7285. [Google Scholar] [CrossRef]
- METI, The Strategic Energy Plan of Japan: Meeting Global Challenges and Securing Energy Futures; Ministry of Economy Trade and Industry: Tokyo, Japan, 2010.
- Toyoda, M. The Future of Energy Policy Agenda after the Great East Japan Earthquake; Institute of Energy Economic Japan (IEEJ): Tokyo, Japan, 2011. [Google Scholar]
- IPCC, Carbon Dioxide Capture and Storage; Intergovernmental Panel on Climate Change: Cambridge, UK and New York, USA, 2005.
- Sakata, Y. The Economic Impact of Carbon Tax in Japan; Workshop on Environment and Energy (WEE2006): Osaka, Japan, 2006. [Google Scholar]
- MoEMR, Blueprint Pengelolaan Energy Nasional 2006–2025; Ministry of Energy and Mineral Resources, Jakarta, Indonesia, 2006.
- MoEMR, Rancangan Blueprint Pengembangan Energi Baru Terbarukan dan Konservasi Energi; Ministry of Energy and Mineral Resources: Jakarta, Indonesia, 2010.
- MoEMR, Persentase Minimal Penjualan Batubara Dalam Negeri Tahun 2011; Ministry of Energy and Mineral Resources: Jakarta, Indonesia, 2010.
- MoEMR, Kontrak Gas Domestik 2011 Mencapai 57 Persen; Ministry of Energy and Mineral Resources: Jakarta, Indonesia, 2011.
- BATAN. Sejarah Singkat Program Pembangunan PLTN di Indonesia. Badan Tenaga Nuklir Nasional. Available online: http://www.batan.go.id/ppen/tu/SejarahPLTN.htm (accessed on 3 January 2011).
- MoF, Ministry of Finance Green Paper: Economic and Fiscal Policy Strategies for Climate Change Mitigation in Indonesia; Ministry of Finance and Australia Indonesia Partnership: Jakarta, Indonesia, 2009.
- Yusuf, A.; Resosudarmo, B. On the Distributional Effect of Carbon Tax in Developing Countries: The Case of Indonesia. In Working Paper in Economics and Development Studies no. 20075; Padjadjaran University: Bandung, Indonesia, 2007. [Google Scholar]
- IEA, CO2 Emissions from Fuel Combustion: Highlights; International Energy Agency: Paris, France, 2010.
- APERC, Understanding Energy in China; Asia Pacific Energy Research Centre: Tokyo, Japan, 2008.
- Greening, L.A.; Greene, D.L.; Difiglio, C. Energy efficiency and consumption—The rebound effect—A survey. Energ. Pol. 2000, 28, 389–401. [Google Scholar] [CrossRef]
- TERI, Capacity Building for Technology Transfer in the Context of Climate Change; Tata Energy Research Institute: New Delhi, India, 1997.
- DNPI, Dewan Nasional Perubahan Iklim (National Council for Climate Change)United Nations Framework Convention on Climate Change (UNFCC)National Economic, Environment and Development Study (NEEDS) for Climate Change: Indonesia Country Study; Dewan Nasional Perubahan Iklim: Jakarta, Indonesia, 2009.
© 2012 by the authors; licensee MDPI, Basel, Switzerland. This article is an open-access article distributed under the terms and conditions of the Creative Commons Attribution license (http://creativecommons.org/licenses/by/3.0/).
Share and Cite
Prambudia, Y.; Nakano, M. Environmental Performance of East Asia Summit Countries from the Perspective of Energy Security. Sustainability 2012, 4, 3206-3233. https://doi.org/10.3390/su4123206
Prambudia Y, Nakano M. Environmental Performance of East Asia Summit Countries from the Perspective of Energy Security. Sustainability. 2012; 4(12):3206-3233. https://doi.org/10.3390/su4123206
Chicago/Turabian StylePrambudia, Yudha, and Masaru Nakano. 2012. "Environmental Performance of East Asia Summit Countries from the Perspective of Energy Security" Sustainability 4, no. 12: 3206-3233. https://doi.org/10.3390/su4123206