Does Energy Efficiency Reduce Emissions and Peak Demand? A Case Study of 50 Years of Space Heating in Melbourne

Abstract
:1. Introduction
2. The Relationship between Energy Efficiency and Notions of Comfort, Sufficiency, and Lifestyle


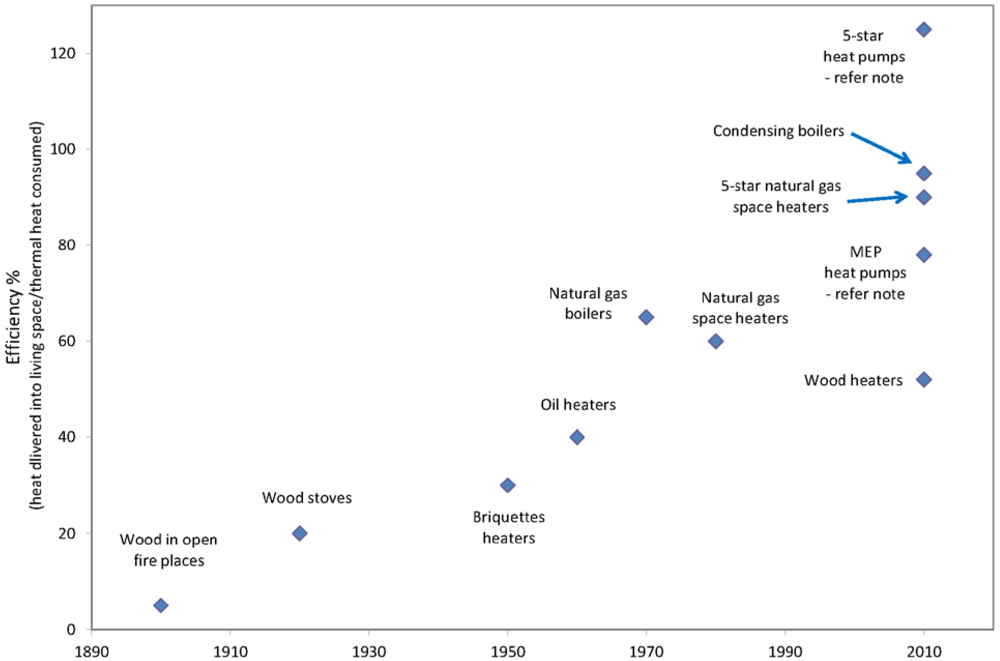
3. Defining the Energy Efficiency of Space Heating


4. Residential Space Heating in Melbourne
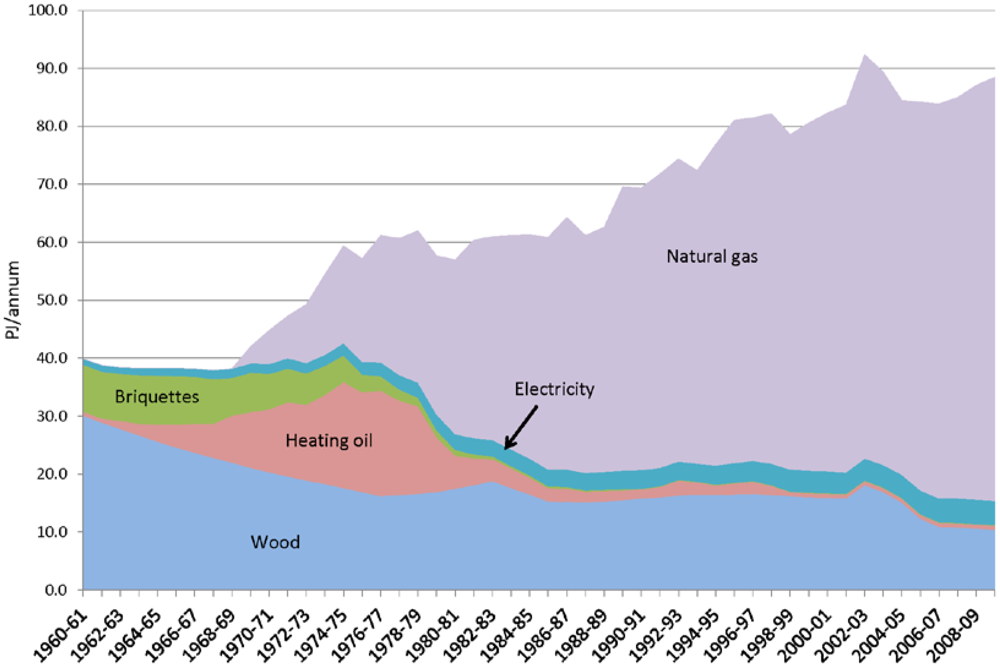
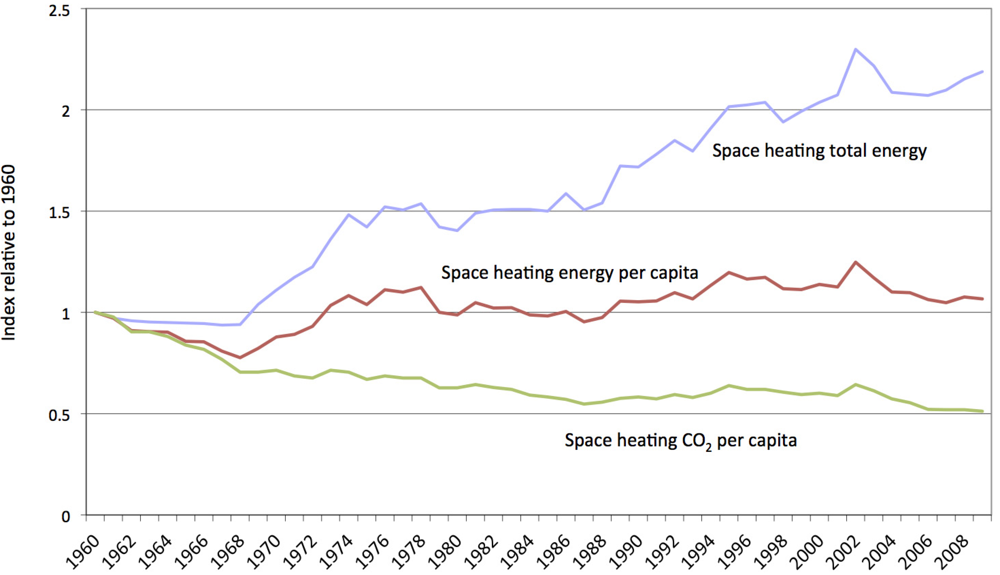
4.1. Historic Overview

| 1960 | 1970 | 1980 | 1990 | 2000 | 2010 | |
|---|---|---|---|---|---|---|
| Gas | 1.00 | 0.70 | 0.39 | 0.32 | 0.32 | 0.45 |
| Electricity | 1.00 | 0.75 | 0.60 | 0.58 | 0.55 | 0.83 |
| Heating oil | 1.00 | 0.76 | 3.08 | 1.78 | 3.27 | 3.28 |
| Earnings | 1.00 | 1.42 | 1.79 | 1.78 | 2.07 | 2.45 |
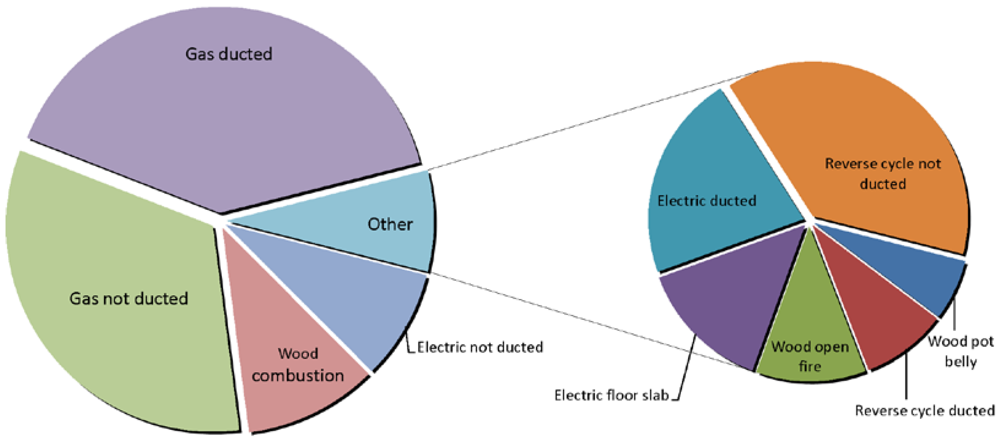
4.2. Current Trends in Melbourne Space Heating

| Non-ducted gas | Ducted gas | Total gas | |
|---|---|---|---|
| Estimated appliances | 662,000 | 890,000 | 1,552,000 |
| Average unit power | 10 kWgas | 20 kWgas | |
| Assume annual run-time | 800 hours | 800 hours | |
| Annual energy consumption per appliance | 29 GJ | 58 GJ | |
| Total annual energy consumption | 19 PJ | 52 PJ | 71 PJ |
| Total annual greenhouse emissions @63.6 kg CO2-e/GJ | 1.2 Mt CO2-e | 3.3 Mt CO2-e | 4.5 Mt CO2-e |
4.3. Moreland Household Energy Efficiency Retrofit Modelling
4.4. Gas Heating Ductwork Retrofit Field Study
5. Rebound of Space Heating Efficiency Measures
5.1. The Emergence of Jevon’s Paradox
5.2. The Definition of Rebound
5.3. Space Heating Rebound Studies
5.4. Short-Run Studies versus Long-Run Observations
5.5. Estimating the Long-Run Rebound
| Estimated annual thermal load (MJ/m2) | Typical gas space heater efficiency (%) | Comparative efficiency to 1960 | Average annual gas use (all uses) (GJ) | |
|---|---|---|---|---|
| 1960—average all homes [18] | 750 | 35 | 1.0 | 15 (see note 1) |
| 1975—average all homes [18] | 700 | 60 | 1.8 | 40 |
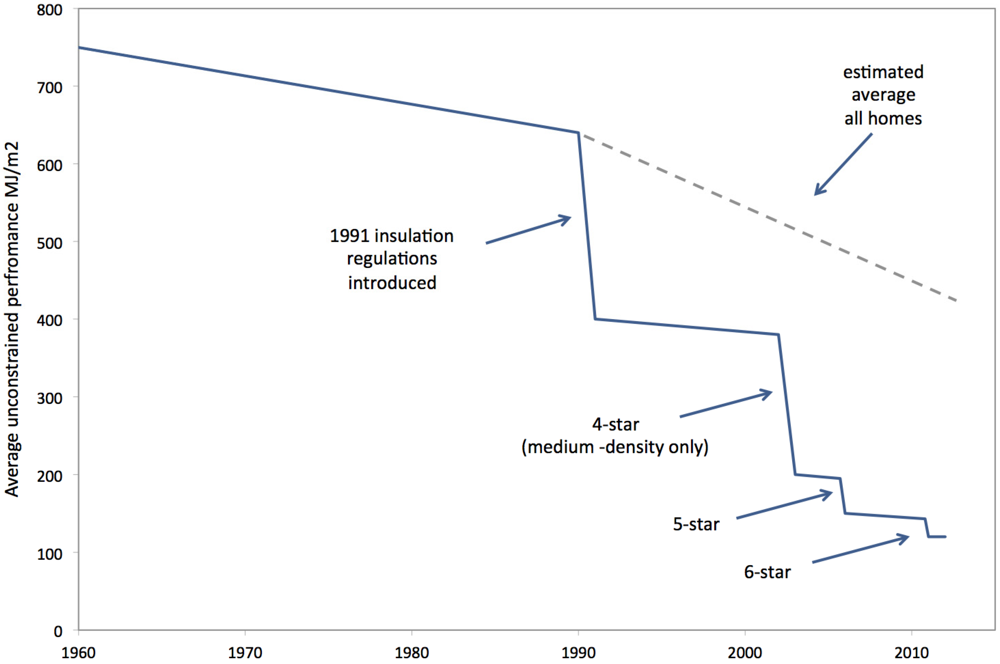
| 1990—average all homes [18] | 640 | 70 | 2.3 | 52 |
| 2003 constructed homes only [59] 4-star | 200 | 75 | 8.0 | 54 |
| 2006 constructed homes only [59] 5-star | 150 | 80 | 11.4 | 41 |
| 2012 constructed homes only, 6-star | 120 | 90 | 16.1 | (see note 2) |
5.6. Targeting the “Impact” Directly


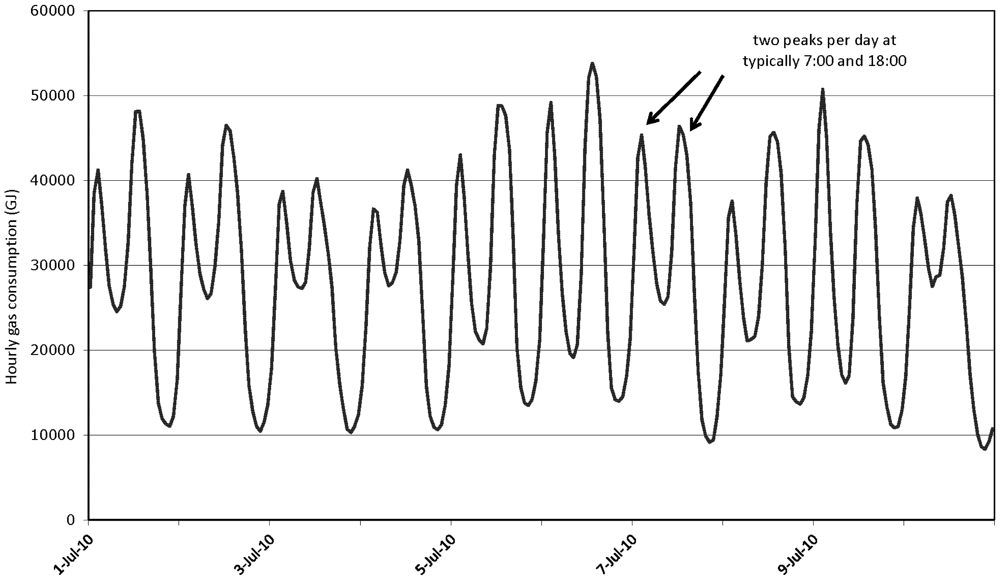
6. Winter Peak Loads Due to Space Heating
6.1. Conservation Load Factor
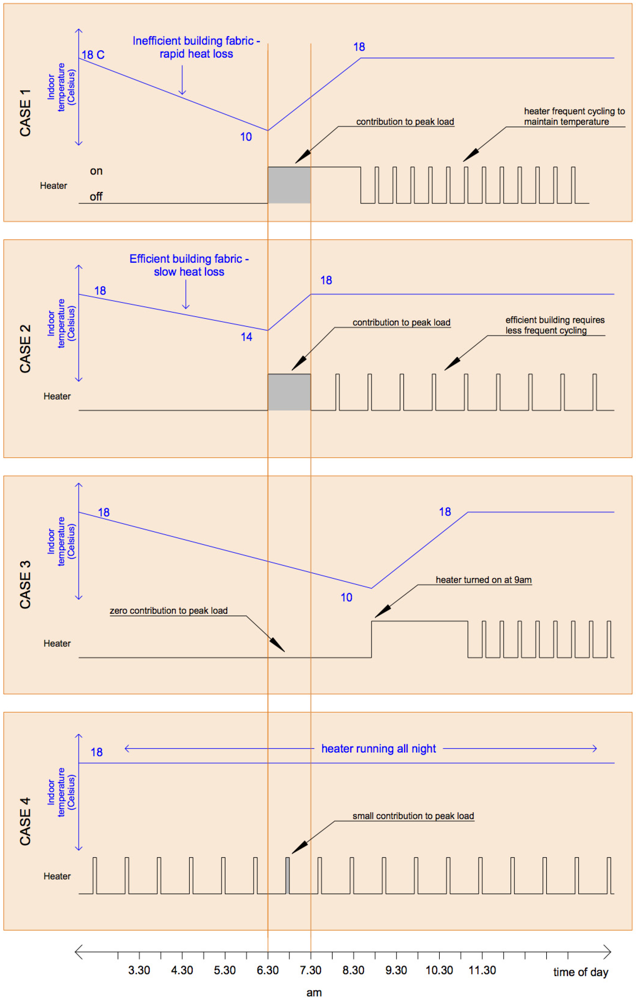
6.2. Peak Demand of Gas Furnaces

| Case 1 | The building fabric is inefficient leading to a substantial nighttime heat loss, requiring a long furnace run-time in the morning to bring the temperature up to the thermostat setting. Given that the furnace initial run time is two hours, no reasonable energy efficiency measures will have any effect on the peak hour, unless they can reduce the run-time to below one hour. |
| Case 2 | The building fabric is relatively effective in containing heat within the living space. When the heater is switched on at 6.30, the heater runs at 100% duty, but unlike case 1, only runs for one hour instead of two. Despite the highest building fabric efficiency of the four cases, it is the only example in which a further improvement in efficiency would lead to a reduction in peak demand, since the run time coincides with the “peak hour”, therefore any reduction in heater run-time would lead to a reduced peak load impact. |
| Case 3 | The heater is not turned on until 9:00, so the building fabric efficiency is irrelevant from a peak demand perspective. Therefore any measures to influence building or equipment efficiency will have no effect on peak demand. |
| Case 4 | In this case, the heater is left running all night, maintaining a constant temperature throughout the night. Given that the heater only needs to cycle to maintain the temperature during the peak hour, this home would only make a small contribution to peak demand. Any efficiency measures would have only a minor effect on peak demand. Given that the temperature is maintained all night, the total energy consumption will be greater than what it would otherwise be if it started in the morning. In this case, an increase in energy consumption causes a decrease in peak demand. |

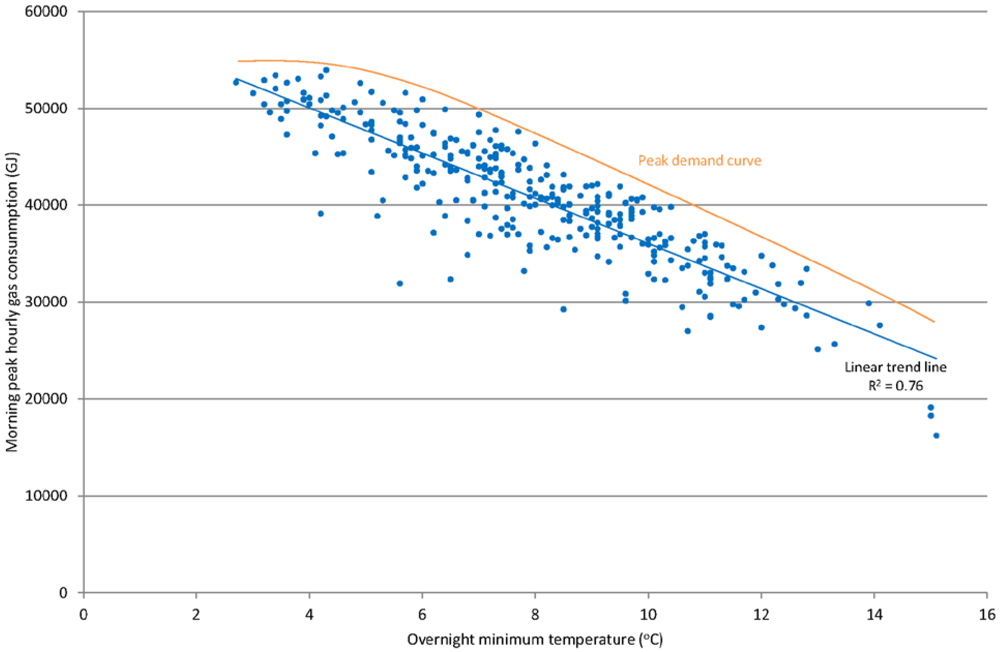
6.3. Heater Load Saturation and the Threshold Temperature


- Given that most of the demand growth is from new buildings, the increased thermal efficiency of the new building fabrics may result in a flatter trend than the existing housing stock, such that at lower ambient temperatures, new buildings tend to maintain a higher indoor temperature. This may be lowering the “threshold temperature” and limiting peak demand growth.
- Householder behaviour of new buildings may differ from the average resulting in a flatter trend. For example, if new homeowners have a greater tendency to leave heaters on overnight, the morning peak may be flatter.
| Trend equation (GJ/hour) | t = 4 °C | t = 14 °C | R2 | |
|---|---|---|---|---|
| 2011 | 58,857–2212 t | 50,009 | 27,889 | 0.85 |
| 2010 | 58,555–2158 t | 49,923 | 28,343 | 0.67 |
| 2009 | 60,017–2377 t | 50,509 | 26,739 | 0.76 |
| 2008 | 59,154–2334 t | 49,818 | 26,418 | 0.77 |
| 2007 | 59,045–2447 t | 49,257 | 24,787 | 0.77 |
6.4. Testing the Saturation Hypothesis—The Home Insulation Program


| Assume annual natural gas reduction 150 days @ average 15 TJ/day (Compare NIEIR estimate of 1.0 to 1.5 PJ [71]) | 2.3 PJ |
| Abatement per year @ 63.6 kg CO2-e/GJ | 0.14 Mt CO2-e |
| Assumed life of abatement–refer [76] | 10 years |
| Total abatement | 1.4 Mt CO2-e |
| Victorian households participating in program | 279,344 |
| Assumed proportion of households using gas for heating | 75% |
| Cost per household | AUD 1,600 |
| Calculated abatement cost | AUD 238/tonne CO2-e |
7. Implications of a Widespread Conversion to Electric Heat Pumps
7.1. A Market Shift to Electric Heat Pumps
7.2. Heat Pump Operation in Cold Conditions
7.3. Transfer of Gas Load to Electrical Load
7.4. Gas Networks and Peak Demand Smoothing with “Linepack”
7.5. Peak Demand Reduction through Demand Management, Storage, and Smart Grids
7.6. The Challenge of Maintaining Social Justice with Differential Energy Pricing
7.7. Smart Grids and Electricity Storage
8. Sensible Regulation or the Institutionalisation of Unsustainable Habits?
8.1. House Energy Rating Schemes
8.2. Criticisms of Rating Schemes
8.3. Legitimising Unsustainable Habits?
9. Low Emission Power: A Way Forward or “Back to the Future”?
9.1. Energy Storage Using Hot Water
9.2. Baseload Electricity Generation
- The first Australian commercial deployment of coal with CCS is projected to be at least 8 to 10 years away and demonstration will likely require government to take on some of the risks of the project, particularly given the need to integrate development across multiple scientific and engineering disciplines. CCS will necessarily be significantly more expensive than unsequestered coal and will face substantial logistic and scaling challenges [102,105,106].
- The State Electricity Commission of Victoria was weighing up the option of nuclear from the late 1960s, but the relatively cheaper cost of coal-fired generation and the ready availability of abundant lignite removed the incentive to develop alternative baseload sources [99,107,108]. According to the recent Australian draft energy white paper [105], there is no near-term prospect of Australia adopting nuclear since it currently “lacks the necessary social consensus”, however in the absence of the successful deployment of low-emission baseload, the nuclear option may be revisited and could meet a large proportion of Australia’s energy demand at a competitive cost assuming a moderate carbon price and a supportive regulatory environment [109].
- There was strong interest in CSP in the 1980s and 90s, mostly in parabolic trough designs, but renewed interest in recent years has explored tower, dish and Fresnel designs. The primary strength of CSP is supplying peak and intermediate loads during summer in regions with strong sunshine and clear skies [110]. The fundamental challenge for CSP in winter is that solar supply and heating demand are inversely correlated, which is exacerbated by the thermal threshold characteristic of CSP, causing a sharp drop-off in electricity below a threshold daily insolation [111]. Trainer [112] notes that even high insolation regions in central Australia regularly experience sequences of several cloudy days in a row in winter during which little or no electricity would be generated without backup. In the context of meeting Melbourne’s large winter heating load, it would make little sense to decommission gas furnaces in Melbourne and retrofit heat pumps powered by remote CSP plants, which themselves rely on large-scale natural gas during winter. CSP is significantly more costly than competing low-emission technologies, although future cost reductions are expected [101,113].
- Research on engineered geothermal showed early promise in the USA from the 1970s [114], and has been regarded with optimism more recently in Australia [115]. However the technology has failed to proceed to early commercialisation in Australia and there remains uncertainty as to its long-term future. Reliability and costs are highly uncertain given the early stage of development [102,116].
9.3. Gas-Fired Generation
9.4. Wind
9.5. Household Solar Air Heating
9.6. Wood Heating
10. Conclusions
Conflict of Interest
References
- Department of Climate Change and Energy Efficiency, Report of the Prime Minister’s Task Group on Energy Efficiency; Department of Climate Change and Energy Efficiency: Canberra, ACT, Australia, 2010.
- Garnaut, R. The Garnaut Climate Change Review – Final Report; WHH Publishing: Canberra, ACT, Australia, 2008; pp. 443–465.
- Enkvist, P.-A.; Naucler, T.; Rosander, J. A cost curve for greenhouse reduction. McKinsey Q. 2007, 1, 35–45. [Google Scholar]
- Diesendorf, M. Greenhouse Solutions with Sustainable Energy; UNSW Press: Sydney, NSW, Australia, 2007; pp. 346–347. [Google Scholar]
- D’Arcy, D. Woolly claims on insulation. Building Products News. 2009. Available online: http://www.bpn.com.au/article/Insulation-rebates-major-response-to-major-challenge/437163.aspx (accessed on 1 May 2012).
- Elliston, B.; Diesendorf, M.; MacGill, I. Simulations of Scenarios with 100% Renewable Electricity in the Australian National Electricity Market; University of NewSouth Wales: Canberra, ACT, Australia, 2011; p. 9. [Google Scholar]
- Wright, M.; Hearps, P. Australian Sustainable Energy: Zero Carbon Australia Stationary Energy Plan; Melbourne Energy Institute: Melbourne, Victoria, Australia, 2010. [Google Scholar]
- Lovins, A. Energy strategy: The road not taken? Foreign Aff. 1976, October, 5–15. [Google Scholar]
- Alcott, B. Impact caps: Why population, affluence and technology strategies should be abandoned. J. Clean. Prod. 2009, 18, 552–560. [Google Scholar] [CrossRef]
- Smil, V. Energy at the Crossroads: Global Perspectives and Uncertainties; MIT Press: Cambridge, MA, USA, 2005; pp. 332–339. [Google Scholar]
- Sorrell, S. Energy, economic growth and environmental sustainability: Five propositions. Sustainability 2010, 2, 1784–1809. [Google Scholar] [CrossRef]
- Maxwell, D.; Owen, P.; McAndrew, L.; Muehmel, K.; Neubauer, A. Addressing the Rebound Effect; European Commission DG Environment: Brussels, Belgium, 2011. [Google Scholar]
- Gavankar, S.; Geyer, R. The Rebound Effect: State of the Debate and Implications for Energy Efficiency Research; Bren School of Environmental Science and Management, University of California: Santa Barbara, CA, USA, 2010. [Google Scholar]
- Schipper, L.; Grubb, M. On the rebound? Feedback between energy intensities and energy uses in IEA countries. Energ. Pol. 2000, 28, 367–388. [Google Scholar] [CrossRef]
- Williamson, T.; Grant, E.; Hansen, A.; Pisaniello, D.; Andamon, M. An Investigation of Potential Health Benefits from Increasing Energy Efficiency Stringency Requirements; The University of Adelaide: Adelaide, South Australia, Australia, 2009. [Google Scholar]
- Australian Bureau of Agricultural and Resource Economics (ABARE), Australian Energy Consumption, by Industry and Fuel Type—Energy Units—Tables F–F8; ABARE: Melbourne, Victoria, Australia, 2007.
- Australian Greenhouse Office (AGO), Australian Residential Building Sector Greenhouse Gas Emissions 1990–2010; AGO: Canberra, ACT, Australia, 1999.
- Gas and Fuel Corporation of Victoria, Annual Report; Gas and Fuel Corporation of Victoria: Melbourne, Victoria, Australia, various years from 1964 to 1986.
- Australian Bureau of Statistics (ABS). Australian Historical Population Statistics—3105.0.65.001. 2008. Available online: http://www.abs.gov.au/AUSSTATS/[email protected]/DetailsPage/3105.0.65.0012008?OpenDocument (accessed on 1 May 2012).
- Australian Greenhouse Office (AGO), Greenhouse Emission Calculator Spreadsheet Version 2, AGO Factors and Methods Workbook; AGO: Canberra, ACT, Australia, 2007.
- Australian Bureau of Statistics (ABS), Year Book Australia, 2009–10, Households and Families—1301.0; ABS: Belconnen, ACT, Australia, 2010.
- Australian Bureau of Statistics (ABS). Year Book of Australia—Australian Home Size is Growing —1301.0. 2005. Available online: http://www.abs.gov.au/ausstats/[email protected]/Previousproducts/1301.0Feature%20Article262005?opendocument&tabname=Summary&prodno=1301.0&issue=2005&num=&view=> (accessed on 1 May 2012).
- Shove, E. Changing human behaviour and lifestyle: A challenge for sustainable consumption? Ecol. Econ. Consum. 2005, 111–131. [Google Scholar]
- Mather, A. Move to ban street heaters. The Mercury. 2009. Available online: http://www.themercury.com.au/article/2009/08/13/90611_tasmania-news.html (accessed on 1 May 2012).
- Thomas, M. ABC Radio National, Background Briefing, Energy efficiency: Not in Australia Mate! 2012. Available online: http://www.abc.net.au/radionational/programs/backgroundbriefing/2012-04-08/3930648 (accessed on 1 May 2012).
- Salt, B. Welcome to the metropolis. The Australian. 2012. Available online: http://www.theaustralian.com.au/business/opinion/welcome-to-the-metropolis/story-e6frg9jx-1226302008593 (accessed on 1 May 2012).
- Australian Bureau of Statistics (ABS). Population Projections, Australia, 2006 to 2101—3222.0. 2008. Available online: http://www.abs.gov.au/Ausstats/[email protected]/mf/3222.0 (accessed on 1 May 2012).
- Swarbrick, P. ABC Radio National Background Briefing: How does your house rate? 2012. Available online: http://www.abc.net.au/radionational/programs/backgroundbriefing/2012-04-01/3917616 (accessed on 1 May 2012).
- ACIL Tasman, Fuel Resource, New Entry and Generation Costs in the NEM; ACIL Tasman: Melbourne, Victoria, Australia, 2009.
- Department of the Environment Water Heritage and the Arts, Energy Use in the Australian Residential Sector 1986–2020—Part 2—Appliance Modelling Methodology; Department of the Environment Water Heritage and the Arts: Canberra, ACT, Australia, 2008.
- Smil, V. Science, Energy, Ethics, and Civilization. In Visions of Discovery: New Light on Physics, Cosmology, and Consciousness; Chiao, R.Y., Cohen, M.L., Leggett, A.J., Phillips, W.D., Harper, C.L., Eds.; Cambridge University Press: Cambridge, UK, 2010; pp. 709–729. [Google Scholar]
- Palmer, G. Field Study on Gas Ducted Heating Systems in Victoria; RMIT University: Melbourne, Victoria, Australia, 2008. [Google Scholar]
- Energy Efficient Strategies, Comparative Cost Benefit Study of Energy Efficiency Measures for Class 1 Buildings and High Rise Apartments in Victoria; Energy Efficient Strategies: Warragul, Victoria, Australia, 2002.
- Morse, R. Australian Science and Technology Heritage Centre. Technology in Australia 1788–1988—Energy. 1988. Available online: http://www.austehc.unimelb.edu.au/tia/778.html (accessed on 1 May 2012).
- Gas and Fuel Corporation of Victoria, Proudley, R. Circle of Influence: A History of the Gas Industry in Victoria; Hargreen Pub. in association with Gas and Fuel Corp. of Victoria: Melbourne, Victoria, Australia, 1987. [Google Scholar]
- Victorian Government, Victoria Gazette—Contracts Accepted; Victorian Government: Melbourne, Australia, various years 1966 to 1994.
- Todd, J. Wood-Smoke Handbook: Woodheaters, Firewood and Operator Practice; Eco-Energy Options: Lindisfarne, Tasmania, Australia, 2003. [Google Scholar]
- Gas and Fuel Corporation of Victoria, Service Department Specification for Installation of Domestic Ducted Central Heating Systems IS2011; Gas and Fuel Corporation of Victoria: Melbourne, Victoria, Australia, 1986.
- Gas and Fuel Corporation of Victoria, 1st Annual Report, the Energy Management Centre 1977/78; Gas and Fuel Corporation of Victoria: Melbourne, Victoria, Australia, 1978.
- Building Commission of Victoria, Energy Efficiency Standards for New Residential Buildings - Regulatory Information Bulletin; Building Commission of Victoria: Docklands, Victoria, Australia, 2002.
- Australian Bureau of Statistics (ABS), Environmental Issues: People’s Views and Practices—4602.0; ABS: Belconnen, ACT, Australia, 2005.
- Building Commission of Victoria Frequently Asked Questions—6 Star Standard. 2011. Available online: http://www.buildingcommission.com.au/www/html/2565-faq---6-star.asp (accessed on 1 May 2012).
- EnergyConsult, Product Profile—Gas Ducted Heaters—Prepared for the Equipment Energy Efficiency Program; EnergyConsult: Jindivick, Victoria, Australia, 2011.
- State Electricity Commission of Victoria, Annual Report; State Electricity Commission of Victoria: Melbourne, Victoria, Australia, various years from 1962 to 1990.
- Saunders, P. Household Income and its Distribution. 2001. Available online: http://www.abs.gov.au/ausstats/[email protected]/94713ad445ff1425ca25682000192af2/eb5a10e37f06c0a0ca2569de00221c9e!OpenDocument (accessed on 1 May 2012).
- Australian Government Air conditioners—MEPS requirements. 2012. Available online: http://www.energyrating.gov.au/products-themes/cooling/air-conditioners/meps/ (accessed on 1 May 2012).
- Gas and Fuel Corporation of Victoria, High Efficiency Gas Appliance Penetration and Gas Savings in Victoria, Gas Demand Management Discussion Paper No 5; Gas and Fuel Corporation of Victoria: Melbourne, Victoria, Australia, 1990.
- Moreland Energy Foundation, On-Ground Assessment of the Energy Efficiency Potential of Victorian Homes—Report on Pilot Study; Moreland Energy Foundation: Melbourne, Victoria, Australia, 2010.
- Francisco, P.W.; Palmiter, L.; Davis, B. Modeling the thermal distribution efficiency of ducts: comparisons to measured results. Energy Build. 1998, 28, 287–297. [Google Scholar] [CrossRef]
- Treidler, B.; Modera, M. Thermal Performance of Residential Duct Systems in Basements; Lawrence Berkeley National Laboratory: Berkeley, CA, USA, 1994. [Google Scholar]
- Jump, D.; Walker, I.; Modera, M. Field Measurements of Efficiency and Duct Retrofit Effectiveness in Residential Forced Air Distribution Systems; Lawrence Berkeley National Laboratory: Berkeley, CA, USA, 1996. [Google Scholar]
- Jevons, W.S. The Coal Question: An Inquiry Concerning the Progress of the Nation, and the Probable Exhaustion of Our Coal-Mines; Macmillan and Co: London, UK, 1865. [Google Scholar]
- Brookes, L. A low energy strategy for the UK. Atom 1979, 269, 73–78. [Google Scholar]
- Khazzoom, J.D. Economic implications of mandated efficiency in standards or household appliances. Energy J. 1980, 1, 21–40. [Google Scholar]
- Alcott, B. Jevons’ paradox. Ecol. Econ. 2005, 54, 9–21. [Google Scholar] [CrossRef]
- Greening, L.A.; Greene, D.L.; Difiglio, C. Energy Efficiency and consumption—The rebound effect— A survey. Energ. Pol. 2000, 28, 389–401. [Google Scholar] [CrossRef]
- Sorrell, S. The Rebound Effect: An Assessment of the Evidence for Economy-Wide Energy Savings from Improved Energy Efficiency; UK Energy Research Centre: London, UK, 2007. [Google Scholar]
- Sommerville, M. Space Heating Energy Efficiency Program Evaluation Report; UK Energy Research Centre: London, UK, 2007. [Google Scholar]
- National Institute of Economic and Industry Research, Modified Demand Forecasts—Residential Usage; National Institute of Economic and Industry Research: Clifton Hill, Victoria, Australia, 2007.
- International Panel on Climate Change (IPCC). IPCC Special Report on Emissions Scenarios for COP 6, part 3.1. Introduction. GRID-Arendal. 2000. Available online: http://www.grida.no/publications/other/ipcc%5Fsr/?src=/climate/ipcc/emission/050.htm (accessed on 1 May 2012).
- Chertow, M.R. The IPAT equation and its variants: Changing views of technology and environmental impact. J. Ind. Ecol. 2001, 4, 13–29. [Google Scholar] [CrossRef]
- MacKenzie, A. Keeping Ahead of the Jonses: The Incompatibility of Urban Environmental Efficiency and Development Practices in Suburbs Undergoing Renewal; University of Canberra: Bruce, ACT, Australia, 2011. [Google Scholar]
- Langham, E.; Dunstan, C.; Walgenwitz, G.; Denvir, P. Reduced Infrastructure Costs from Improving Building Energy Efficiency; Institute for Sustainable Futures, University of Technology, Sydney: Sydney, Australia, 2010. [Google Scholar]
- York, D.; Kushler, M.; Witte, P. Examining the Peak Demand Impacts of Energy Efficiency: A Review of Program Experience and Industry Practices; Report Number U072; American Council for an Energy-Efficient Economy: Washington, DC, USA, 2007. [Google Scholar]
- Koomey, J.; Rosenfeld, A.H.; Gadgil, A. Conservation Screening Curves to Compare Efficiency Investments to Power Plants; Lawrence Berkeley National Laboratory: Berkeley, CA, USA, 1989. [Google Scholar]
- Energy Efficient Strategies. The Value of Ceiling Insulation: Impacts of Retrofitting Ceiling Insulation to Residential Dwellings in Australia. 2011. Available online: http://www.icanz.org.au/pdf/2011_ICANZ_Report_-_V04__final_260911.pdf (accessed on 1 May 2012).
- Australian Energy Market Operator (AEMO), Hourly Gas Consumption Data—INT271—Spreadsheet Via Email; AEMO: Melbourne, Victoria, Australia, 2011.
- Australian Energy Market Operator (AEMO). Technical Guide to the Wholesale Market. AEMO: Melbourne, Victoria, Australia, 2010. Available online: http://www.aemo.com.au/corporate/0000-0264.pdf (accessed on 1 May 2012).
- Australian Energy Market Operator (AEMO). Victorian Annual Planning Report Update: Victoria’s Electricity and Gas Transmission Network Planning Document; AEMO: Melbourne, Victoria, Australia, 2009. Available online: http://www.aemo.com.au/planning/0400-0003.pdf (accessed on 1 May 2012).
- Hawke, A. Review of the Administration of the Home Insulation Program; Department of Climate Change and Energy Efficiency: Canberra, ACT, Australia, 2010. [Google Scholar]
- Fyfe, M. Insulation program delivers on energy savings. The Age. 2010. Available online: http://www.theage.com.au/national/insulation-program-delivers-on-energy-savings-20101016-16odu.html (accessed on 1 May 2012).
- Commonwealth of Australia, Energy Efficient Homes Package (Ceiling Insulation); Commonwealth of Australia: Canberra, ACT, Australia, 2010.
- Australian National Audit Office, Green Loans Program: Audit Report No. 9 2010–11; Australian National Audit Office: Barton, ACT, Australia, 2010.
- Suppiah, R.; Whetton, P.H. Projected Changes in Temperature and Heating Degree-Days for Melbourne and Victoria,2008–2012; CSIRO Marine and Atmospheric Research: Aspendale, Victoria, Australia, 2007. [Google Scholar]
- National Institute of Economic and Industry Research, Natural Gas Forecasts and Customer Number Forecasts for the Multinet Distribution Region to 2015; National Institute of Economic and Industry Research: Clifton Hill, Victoria, Australia, 2007.
- Department of Climate Change and Energy Efficiency, Home Insulation Program: Emissions Reductions; Department of Climate Change and Energy Efficiency: Canberra, ACT, Australia, 2011.
- Australian Greenhouse Office (AGO), Minimum Energy Performance Standards—Heat Pumps; AGO: Canberra, ACT, Australia, 2004.
- Pears, A. Air conditioning: Too hot to turn on? Sydney Morning Herald. 2007. Available online: http://blogs.smh.com.au/lifestyle/renovationnation/archives/2007/12/air_conditionin.html (accessed on 1 May 2012).
- Wright, M. Why I have six air conditioners. Climate Spectator. 2011. Available online: http://www.climatespectator.com.au/commentary/why-i-have-six-air-conditioners (accessed on 1 May 2012).
- Australian Energy Market Operator (AEMO). Victorian Annual Planning Report 0400-0012—Victoria’s Electricity and Gas Transmission Network Planning Document. 2010. Available online: http://www.aemo.com.au/planning/0400-0012.pdf (accessed on 1 May 2012).
- Vencorp, Vision 2030—25 Year Vision for Victoria’s Energy Transmission Networks; Vencorp: Melbourne, Victoria, Australia, 2005.
- International Energy Agency (IEA), Technology Roadmap—Smart Grids; IEA: Paris, France, 2011; p. 12.
- McGowan, S. Hot in the city. Ecolibrium 2009, February, 14–17. [Google Scholar]
- Smith, R. An environment initiative that gives back to low-income Victorians. 2011. Available online: http://www.premier.vic.gov.au/media-centre/media-releases/1135-an-environment-initiative-that-gives-back-to-low-income-victorians.html (accessed on 1 May 2012).
- Salvation Army. The Salvation Army and the Garnaut Report. 2008. Available online: http://www.salvationarmy.org.au/action/NOTEMPLATE?s=0,pURL=the-salvation-army-and-the-garnaut-report (accessed on 1 May 2012).
- Pears, A. Smart Meters Issue Paper: Submission. 2011. Available online: http://www.dtf.vic.gov.au/CA25713E0002EF43/WebObj/AlanPearssubmission/$File/Alan%20Pears%20submission.pdf (accessed on 1 May 2012).
- Lombard, D. Review of the Advanced Metering Infrastructure Program; Victorian Council of Social Service: Melbourne, Victoria, Australia, 2011. [Google Scholar]
- Electric Power Research Institute, Electricity Energy Storage Technology Options: A White Paper Primer on Applications, Costs, and Benefits; Electric Power Research Institute: Palo Alto, CA, USA, 2010.
- Lang, P. Pumped-hydro energy storage—Cost estimates for a feasible system. Brave New Climate. 2010. Available online: http://bravenewclimate.com/2010/04/05/pumped-hydro-system-cost/ (accessed on 1 May 2012).
- Soebarto, V.I. A Low-Energy House and a Low Rating: What is the Problem? In Proceedings of the 34th Conference of the Australia and New Zealand Architectural Science Association, Adelaide, South Australia, Australia, 1–3 December 2000; pp. 111–118.
- Australian Greenhouse Office (AGO). AGO Comments on Submission #28 (Dr T. Williamson). 2004. Available online: http://www.pc.gov.au/__data/assets/pdf_file/0011/45596/sub069.pdf (accessed on 1 May 2012).
- Williamson, T.; Soebarto, V.; Radford, A. Comfort and energy use in five Australian award-winning houses: Regulated, measured and perceived. Build. Res. Inf. 2010, 38, 509–529. [Google Scholar] [CrossRef]
- Kordjamshidi, M.; King, S.; Prasad, D. Towards the Development of a Home Rating Scheme for Free Running Buildings. In Proceedings of the 43rd Australian and New Zealand Solar Energy Society: Renewable Energy for a Sustainable Future—A Challenge for a Post Carbon World, Dunedin, New Zealand, 28–30 November 2005.
- Bannister, P. Why good buildings go bad while some are just born that way. Ecolibrium 2009, February 2009, 24–32. [Google Scholar]
- Centre for International Economics (CIE), Energy-Efficiency: Building Code Star-Ratings. What’s Optimal, What’s Not. Prepared for Master Builders Australia; CIE, Canberra, ACT, Australia, 2010.
- Rudin, A. Why We Should Change Our Message and Goal from ‘Use Energy Efficiently’ to ‘Use Less Energy’; Energy Management Consultant: Fennimore, WI, USA, 2000. [Google Scholar]
- Clifton, D. Sustainable business: Are we heading in the right direction. Sustainability 2012, 4, 586–603. [Google Scholar] [CrossRef]
- Troy, P.; Dingle, T.; Spearritt, P.; Davison, G.; Head, L.; Dovers, S.; Syme, G.J.; Gray, J.; Gardner, A.; Godden, L. Down the Gurgler: Historical Influences on Australian Domestic Water Consumption; Australian National University: Canberra, ACT, Australia, 2011. Available online: http://epress.anu.edu.au/troubled_waters/mobile_devices/ch03s03.html (accessed on 1 May 2012).
- Edwards, C. Brown Power—A Jubilee History of the State Electricity Commission of Victoria; The Griffin Press: Adelaide, SA, Australia, 1969; p. 235. [Google Scholar]
- Department of Climate Change and Energy Efficiency, Phase-Out of Greenhouse Intensive Hot Water Heaters; Department of Climate Change and Energy Efficiency: Canberra, ACT, Australia, 2012.
- Nicholson, M.; Biegler, T.; Brook, B.W. How carbon pricing changes the relative competitiveness of low-carbon baseload generating technologies. Energy 2011, 36, 305–313. [Google Scholar] [CrossRef]
- Wood, T.; Edis, T. No Easy Choices: Which Way for Australia’s Energy Future? Grattan Institute: Carlton, Victoria, Australia, 2011. [Google Scholar]
- Palmer, G. Coal dependence and the renewables paradox. Dissent 2011, Spring, 19–25. [Google Scholar]
- Grubb, M. Technology innovation and climate change policy: An overview of issues and options. KEIO Econ. Stud. 2004, 41, 103–132. [Google Scholar]
- Australian Government, Draft Energy White Paper 2011: Strengthening the Foundations for Australia’s Energy Future; Australian Government: Canberra, ACT, Australia, 2011.
- Palmer, G. Out of sight or out of time: The future of carbon capture. Dissent 2009, Spring, 43–48. [Google Scholar]
- Cawte, A. Atomic Australia; New South Wales University Press: Sydney, NSW, Australia, 1992. [Google Scholar]
- Baxter, J.; Griffiths, D. Nuclear Power. In Fuel and Power in Australia; Raggatt, H., Ed.; F.W. Chesire Publishing: Melbourne, Victoria, Australia, 1969; p. 108. [Google Scholar]
- Australian Government, Uranium Mining, Processing and Nuclear Energy—Opportunities for Australia? Report to the Prime Minister by the Uranium Mining, Processing and Nuclear Energy Review Taskforce; Australian Government: Barton, ACT, Australia, 2006.
- International Energy Agency (IEA), Technology Roadmap—Concentrating Solar Power; IEA: Paris, France, 2010.
- Odeh, S.; Behnia, M.; Morrison, G.L. Performance evaluation of solar thermal electric generation systems. Energy Convers. Manag. 2003, 44, 2425–2443. [Google Scholar]
- Trainer, T. Can renewables etc. solve the greenhouse problem? The negative case. Energ. Pol. 2010, 38, 4107–4114. [Google Scholar] [CrossRef]
- Lenzen, M. Current state of development of electricity-generating technologies: A literature review. Energies 2010, 3, 462–591. [Google Scholar] [CrossRef]
- Workshop on Alternative Energy Strategies, Energy: Global Prospects 1985–2000; McGraw-Hill: New York, NY, USA, 1977; p. 222.
- McLennan Magasanik Associates, Installed Capacity and Generation from Geothermal Sources by 2020; McLennan Magasanik Associates: South Melbourne, Victoria, Australia, 2008.
- The Allen Consulting Group, Australia’s Geothermal Industry: Pathways for Development; The Allen Consulting Group: Melbourne, Victoria, Australia, 2011.
- Australian Energy Market Operator (AEMO), South Australian Supply and Demand Outlook, SASDO2011; AEMO: Melbourne, Victoria, Australia, 2011.
- Miskelly, A. Wind power data June 2010. 2012. Available online: http://www.windfarmperformance.info/data/aemo/aemo_wind_201006.csv (accessed on 1 May 2012).
- Honnery, D.; Moriarty, P. Energy availability problems with rapid deployment of wind-hydrogen systems. Int. J. Hydrog. Energy 2011, 36, 3283–3289. [Google Scholar] [CrossRef]
- Kessides, I.N.; Wade, D.C. Deriving an improved dynamic EROI to provide better information for energy planners. Sustainability 2011, 3, 2339–2357. [Google Scholar] [CrossRef]
- Keryn, P.; Trevor, B.; Anthony, E.; Tom, J.; Philip, P.; Miko, K. Life Cycle Assessment of Greenhouse Emissions from Domestic Woodheating; Australian Greenhouse Office: Canberra, ACT, Australia, 2003. [Google Scholar]
- Driscoll, D.; Milkovits, G.; Freudenberger, D. Impact and Use of Firewood; Department of Sustainability, Environment, Water, Population and Communities: Canberra, ACT, Australia, 2000. [Google Scholar]
- Palmer, G. Researching the viability of pellet heating in Australia, project for MIET2127. 2007. Available online: http://www.paltech.com.au/datasheets/MIET2127_presentation.ppt (accessed on 1 May 2012).
© 2012 by the authors; licensee MDPI, Basel, Switzerland. This article is an open-access article distributed under the terms and conditions of the Creative Commons Attribution license (http://creativecommons.org/licenses/by/3.0/).
Share and Cite
Palmer, G. Does Energy Efficiency Reduce Emissions and Peak Demand? A Case Study of 50 Years of Space Heating in Melbourne. Sustainability 2012, 4, 1525-1560. https://doi.org/10.3390/su4071525
Palmer G. Does Energy Efficiency Reduce Emissions and Peak Demand? A Case Study of 50 Years of Space Heating in Melbourne. Sustainability. 2012; 4(7):1525-1560. https://doi.org/10.3390/su4071525
Chicago/Turabian StylePalmer, Graham. 2012. "Does Energy Efficiency Reduce Emissions and Peak Demand? A Case Study of 50 Years of Space Heating in Melbourne" Sustainability 4, no. 7: 1525-1560. https://doi.org/10.3390/su4071525