Article

Community Engagement and Environmental Life Cycle Assessment of Kaikōura’s Biosolid Reuse Options

by
James E. McDevitt
1,*,
Elisabeth R. Langer
2 and
Alan C. Leckie
2
1
Scion (New Zealand Forestry Research), PO Box 10 345, The Terrace, Wellington, 6143, New Zealand
2
Scion (New Zealand Forestry Research), PO Box 29 237, Christchurch, 8540, New Zealand
*
Author to whom correspondence should be addressed.
Sustainability 2013, 5(1), 242-255; https://doi.org/10.3390/su5010242
Submission received: 31 October 2012 / Revised: 7 January 2013 / Accepted: 11 January 2013 / Published: 18 January 2013
(This article belongs to the Special Issue Sustainable Waste Management)

Abstract

:
This paper reports a life cycle assessment undertaken to assess the environmental impact of a range of biosolid reuse options selected by the Kaikōura community. The reuse options were identified as: vermiculture and open-air composting; mixture with biochar; direct land application to disturbed sites for forestry using native tree species; and application to exotic forestry plantations or pastoral farmland. The aim of the study was to calculate the possible environmental impacts of the reuse options so the information can be used in a community dialogue process where the fate of the biosolids is decided upon. All reuse options showed improved environmental performance relative to landfilling. The direct application to land options showed the least environmental impact and the composting options had the most environmental impact. This is the first time this approach has been applied to biosolids management in New Zealand, and whilst there are limitations, the approach should be encouraged in other communities because it increases the engagement of the community with waste management decision-making and the environment.

1. Introduction

Kaikōura is a small relatively remote community on the South Island of New Zealand with a strong commitment to protecting the environment and working towards sustainability for their community and visitors. The Kaikōura District Council’s wastewater treatment plant serves a permanent population of approximately 3,500 and a tourist population of up to one million visitors per year. Sewage sludge was dredged from Kaikōura’s oxidation ponds six years ago (the first dredging for 25 years) and about 1,500 tons have been stockpiled. The community and council are tasked with deciding the most appropriate way of managing the stabilized sewage sludge (biosolids) before the current stockpiling consent runs out in 2016. Biosolids are carbon-rich and contain valuable nutrients and can reduce dependence on artificial fertilizers [1,2]. However, biosolids can contain a range of micro-contaminants such as heavy metals, pathogens and pharmaceuticals and personal care products [3]. Therefore, this biosolid waste stream is both a potential source of soil improvement and pollution.
The study reported here is an additional study allied to the publicly funded research program called the Biowastes Programme. The Biowastes Programme has been developed to better understand the environmental risks and benefits that can arise from applying biowastes to land with a multi-disciplinary team from research institutes, universities, Iwi (largest social unit in Māori culture) and local businesses. The main biowaste that the program has been focusing on is biosolids, and the principal focus is case-study research combining biophysical science with social research involving community, rūnanga (representative Māori assembly) and government regulators. Environmental and biophysical research has been undertaken to characterize the Kaikōura biosolids to provide stakeholders with information for their decision-making. Following an initial hui (a social assembly in a Māori community) and interviews with key stakeholders, a second community engagement hui was held with key stakeholders to select reuse options for the stockpiled biosolids and provide insights into community views on contaminants; this was held at the Takahanga marae (a marae is a sacred place that serves religious and social purposes in Polynesian societies) in Kaikōura, February 2011. After presentation of science results, a facilitated workshop session was held to enable key stakeholders and regulators to discuss a number of feasible options for their biosolids. A total of 19 options were presented to the community; further stabilization (six options); land application (five options); rehabilitation of land (four options); and resource recovery (four options). Participants were asked to discuss the environmental positives and negatives, social and cultural positives and negatives, economics and feasibility of each of the options. Community stakeholders at this hui identified a number of reuse options that were realistically available to the community, these were:
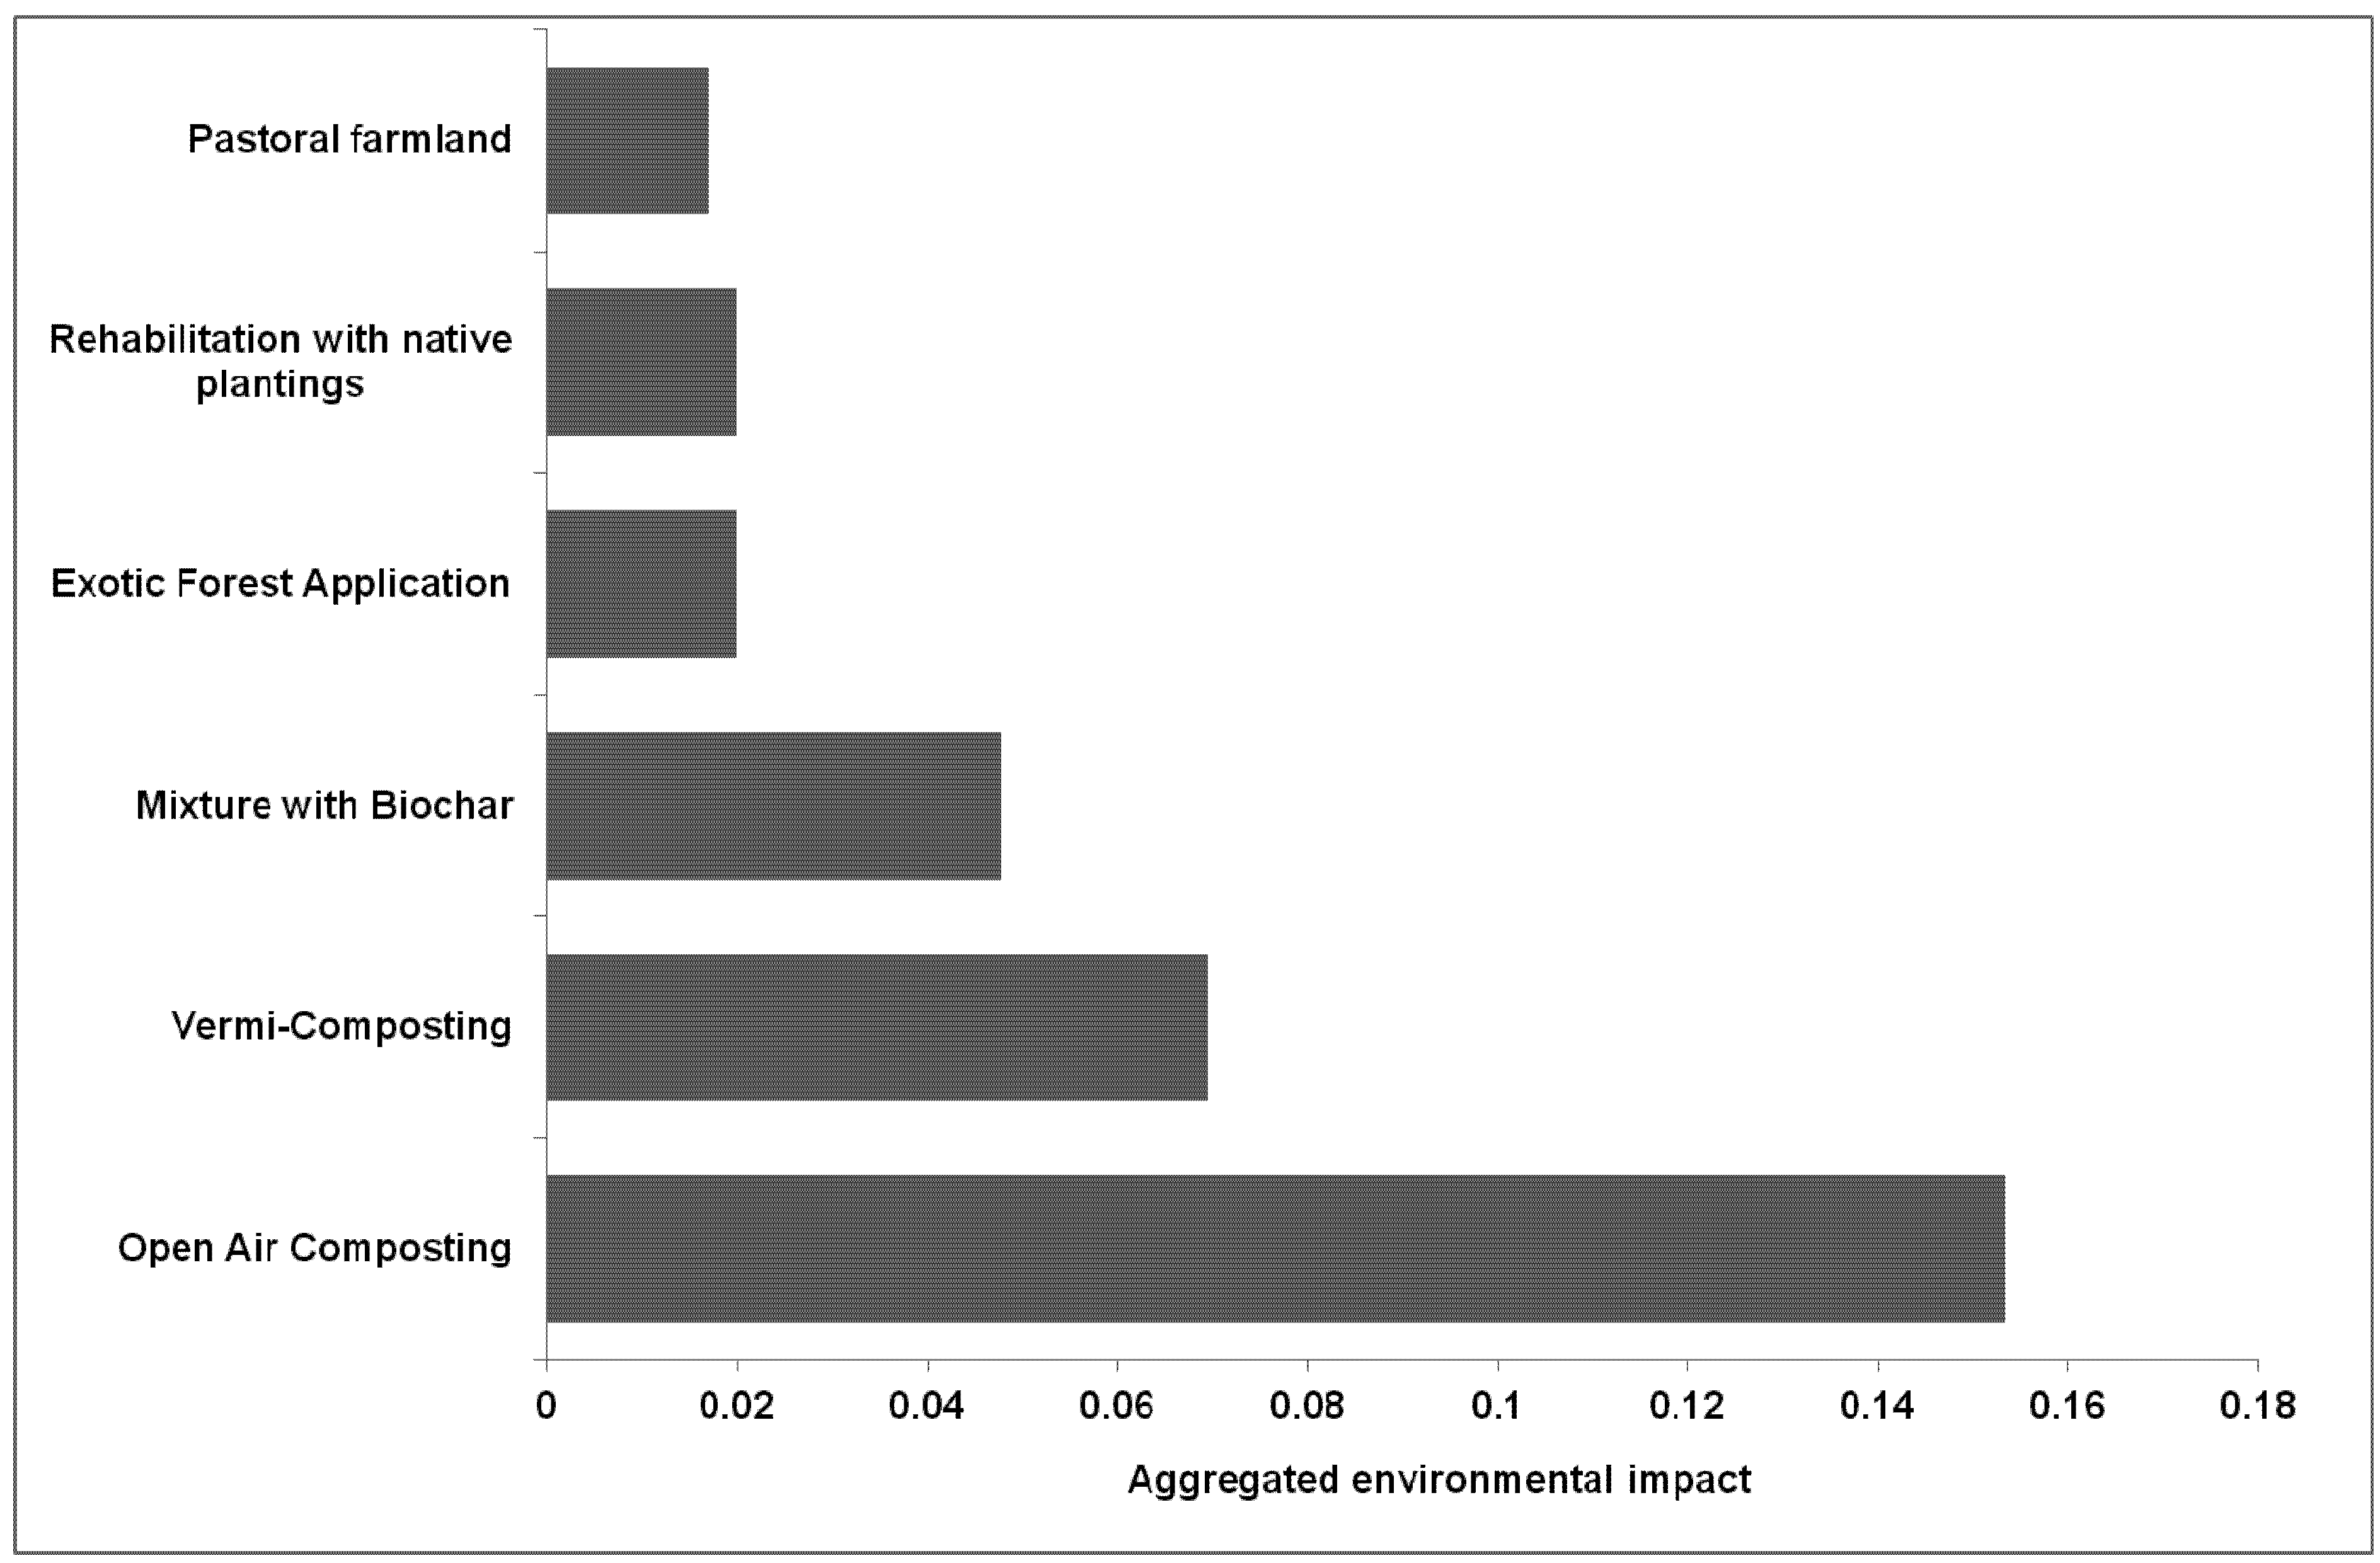
  • Open air composting: a facility at the Innovative Waste Kaikōura site will be constructed. This will compost a biosolids garden green waste mixture; the resulting compost will be made available for sale to the community.
  • Vermi-composting: where a vermi-composting facility is made and the biosolids and garden green waste are passed through the digestive tract of worms in containers. This produces relatively high quality compost and byproducts (i.e. worm juice and worms) that will be sold.
  • Mixture with Biochar: the biosolids are mixed with a biochar material made from forest waste residues using slow-pyrolysis technology and made available for land application.
  • Farm Application: the biosolids are applied directly to pastoral farmland, albeit ensuring that the biosolids remain outside of the human food chain.
  • Forest Application: using existing forestry machinery, biosolids are applied to Radiata pine (Pinus radiata L.) plantation forests. The biosolids can be included as a soil amendment in the establishment of the stand.
  • Land Rehabilitation: as part of the reclamation of marginal land biosolids are applied as soil amendment in order to promote vigorous plant growth of native tree species.
Making decisions on complex systems is particularly challenging, but there are numerous ways to simplify the process. One way to reconcile a large quantity of complex environmental data for processes and systems is via life cycle assessment. The life cycle assessment framework can help establish a quantitative description of the impact of a product or service [4] and it has been used to aid decision-making for a range of scenarios. Accordingly, life cycle assessment has been applied extensively to decisions pertaining to waste management e.g., [5,6,7,8]. In particular, there have been a number of studies that have addressed biosolids waste management e.g., [9,10,11].
However, no study to date has investigated biosolids reuse management in New Zealand where community dialogue has been included in the decision-making. Therefore, this study aims to calculate the environmental impact of the six identified biosolids reuse options using a life cycle assessment approach and a community dialogue mechanism. This information will be used in the final community hui to contribute to the decision making about the reuse options available.

2. Materials and Methods

This study has been conducted in accordance with the principles and framework detailed in the ISO standards on life cycle assessment [12,13]. The goal of the study was to assess the potential environmental impacts for the biosolid reuse options preferred by the Kaikōura community. The functional unit is the treatment of one ton of the stockpiled Kaikōura biosolids. This assessment extends from the biosolids, as they are stockpiled now, to the end of life associated with the various reuse options. Accordingly, the system boundaries extend from the extraction of raw materials to their eventual disposal.
A community hui involving the district council, tangata whenua (“people of the land”) and community group representatives was held in the Takahanga marae in Kaikōura in December 2011. Here we explained the environmental impacts quantified by this life cycle assessment study (see Table 1 for the impact categories used). Then each stakeholder was given ten votes numbered one to ten that they could allocate to each of the impact categories to represent how important the different environmental impacts were to the Kaikōura community regarding the biosolids reuse options. It was explained that the numerical value of the vote was proportional to the importance. The votes were subsequently used to generate weightings for each of the impact categories so they could be aggregated. Details of the environmental impacts and the reason for their inclusion are detailed in Table 1. In addition to the voting, stakeholders were encouraged to record the reasons for their vote and discuss their opinions about the different environmental impact and how or why they were or were not relevant to their community on this issue.
For the life cycle inventory, the landfill process that was used to draw relative impact assessments was from the Ecoinvent database [14]. The bulk density of the biosolids was measured and found to be approximately 500 kg/m3, and green waste was assumed to be 200 kg/m3 and for both composting options they were combined in equal amounts. All truck transportation steps were assumed to have been using a 25–30 t payload Euro 3 Truck [15] that is 50% utilized. A number of machines are necessary for the reuse processes and their efficiency is dependent on the workload. It was calculated that the loader used 1.3 kg diesel/t biosolids processed, the shredder 0.0018 kg diesel/kg biosolids, the mixer 0.0014 kg diesel/kg biosolids. The storage of worm juice was calculated as requiring 54 kWh/t/day [16,17]. The production of polyethylene (PE) film, polyvinyl chloride (PVC) and repacking process were from the Ecoinvent database [14]. The direct gaseous emissions from vermiculture and open-air composting were from experimental studies [18,19]. The chemical composition of leachate from open-air composting was from [20] and it assumed that 80% of the leachate was reused and all of the leachate from vermiculture compositing was reused. The process operations of the biochar mixture were adapted from Ibarrola et al., [21] and Hammond et al., [22] to suit New Zealand conditions. It was assumed that open-air composting took 60 days and the vermi-composting 21 days. In all land application options it was assumed that 0.5% of the mineral nitrogen was lost as dinitrogen monoxide [23] and the percentage chemicals were assumed to be lost via leaching when directly applied to land was calculated using a range of studies [1,24,25,26,27,28]. The emissions and resources used for the land filling process were from the Ecoinvent database [14]. The electricity mix for New Zealand was from the GaBi database [29] and the diesel mix for New Zealand was from prior work by Scion [30]. The infrastructure for all the reuse options was assumed to last for 21 years, in accordance with the assumptions made in the Ecoinvent database for similar facilities [14]. The chemical composition of the Kaikōura biosolids was from a range of chemical analysis studies of the biosolids [31,32]. The displaced fertilizer from the biosolids reuse options was calculated using a range of studies depending on the reuse options investigated [18,20,33,34,35,36].
The data was compiled and modeled using the software GaBi4.4 [29]. The weightings were applied to the environmental impact categories using Equation 1 to develop the final environmental impact score of the different reuse options.
Sustainability 05 00242 i001
Equation 1: The equation used to calculate the overall score for the reuse options. Where: RU = the normalized impact of the reuse option, L = the normalized impact of landfilling option, W = weighting factor, and n = environmental impact category.
Table 1. The impact categories investigated in this study, their description and the reason for their inclusion in this study.
Impact categoryDescriptionReason for inclusion
Global Warming Potential The potential radiative forcing of greenhouse gas chemicals in a steady state atmosphere [37].Global warming potential was included because climate change is a significant issue for all communities and Kaikōura has an EarthCheck status—which includes a carbon footprint assessment.
Acidification PotentialThe propensity of a chemical to contribute H+ ions to a medium.Acidification potential is included because the biosolids management is potentially a source of this sort of pollution.
Eutrophication PotentialThe potential nutrification of watercourses [38].Eutrophication potential is included because the biosolids are potentially a significant source of this sort of pollution—depending on how they are treated.
Ozone Layer Depletion PotentialThe change in stratospheric ozone column in a steady state [38].Ozone layer depletion was used because New Zealand already has a high Ultra-Violet index, it would be prudent to choose a technology that does not exacerbate this.
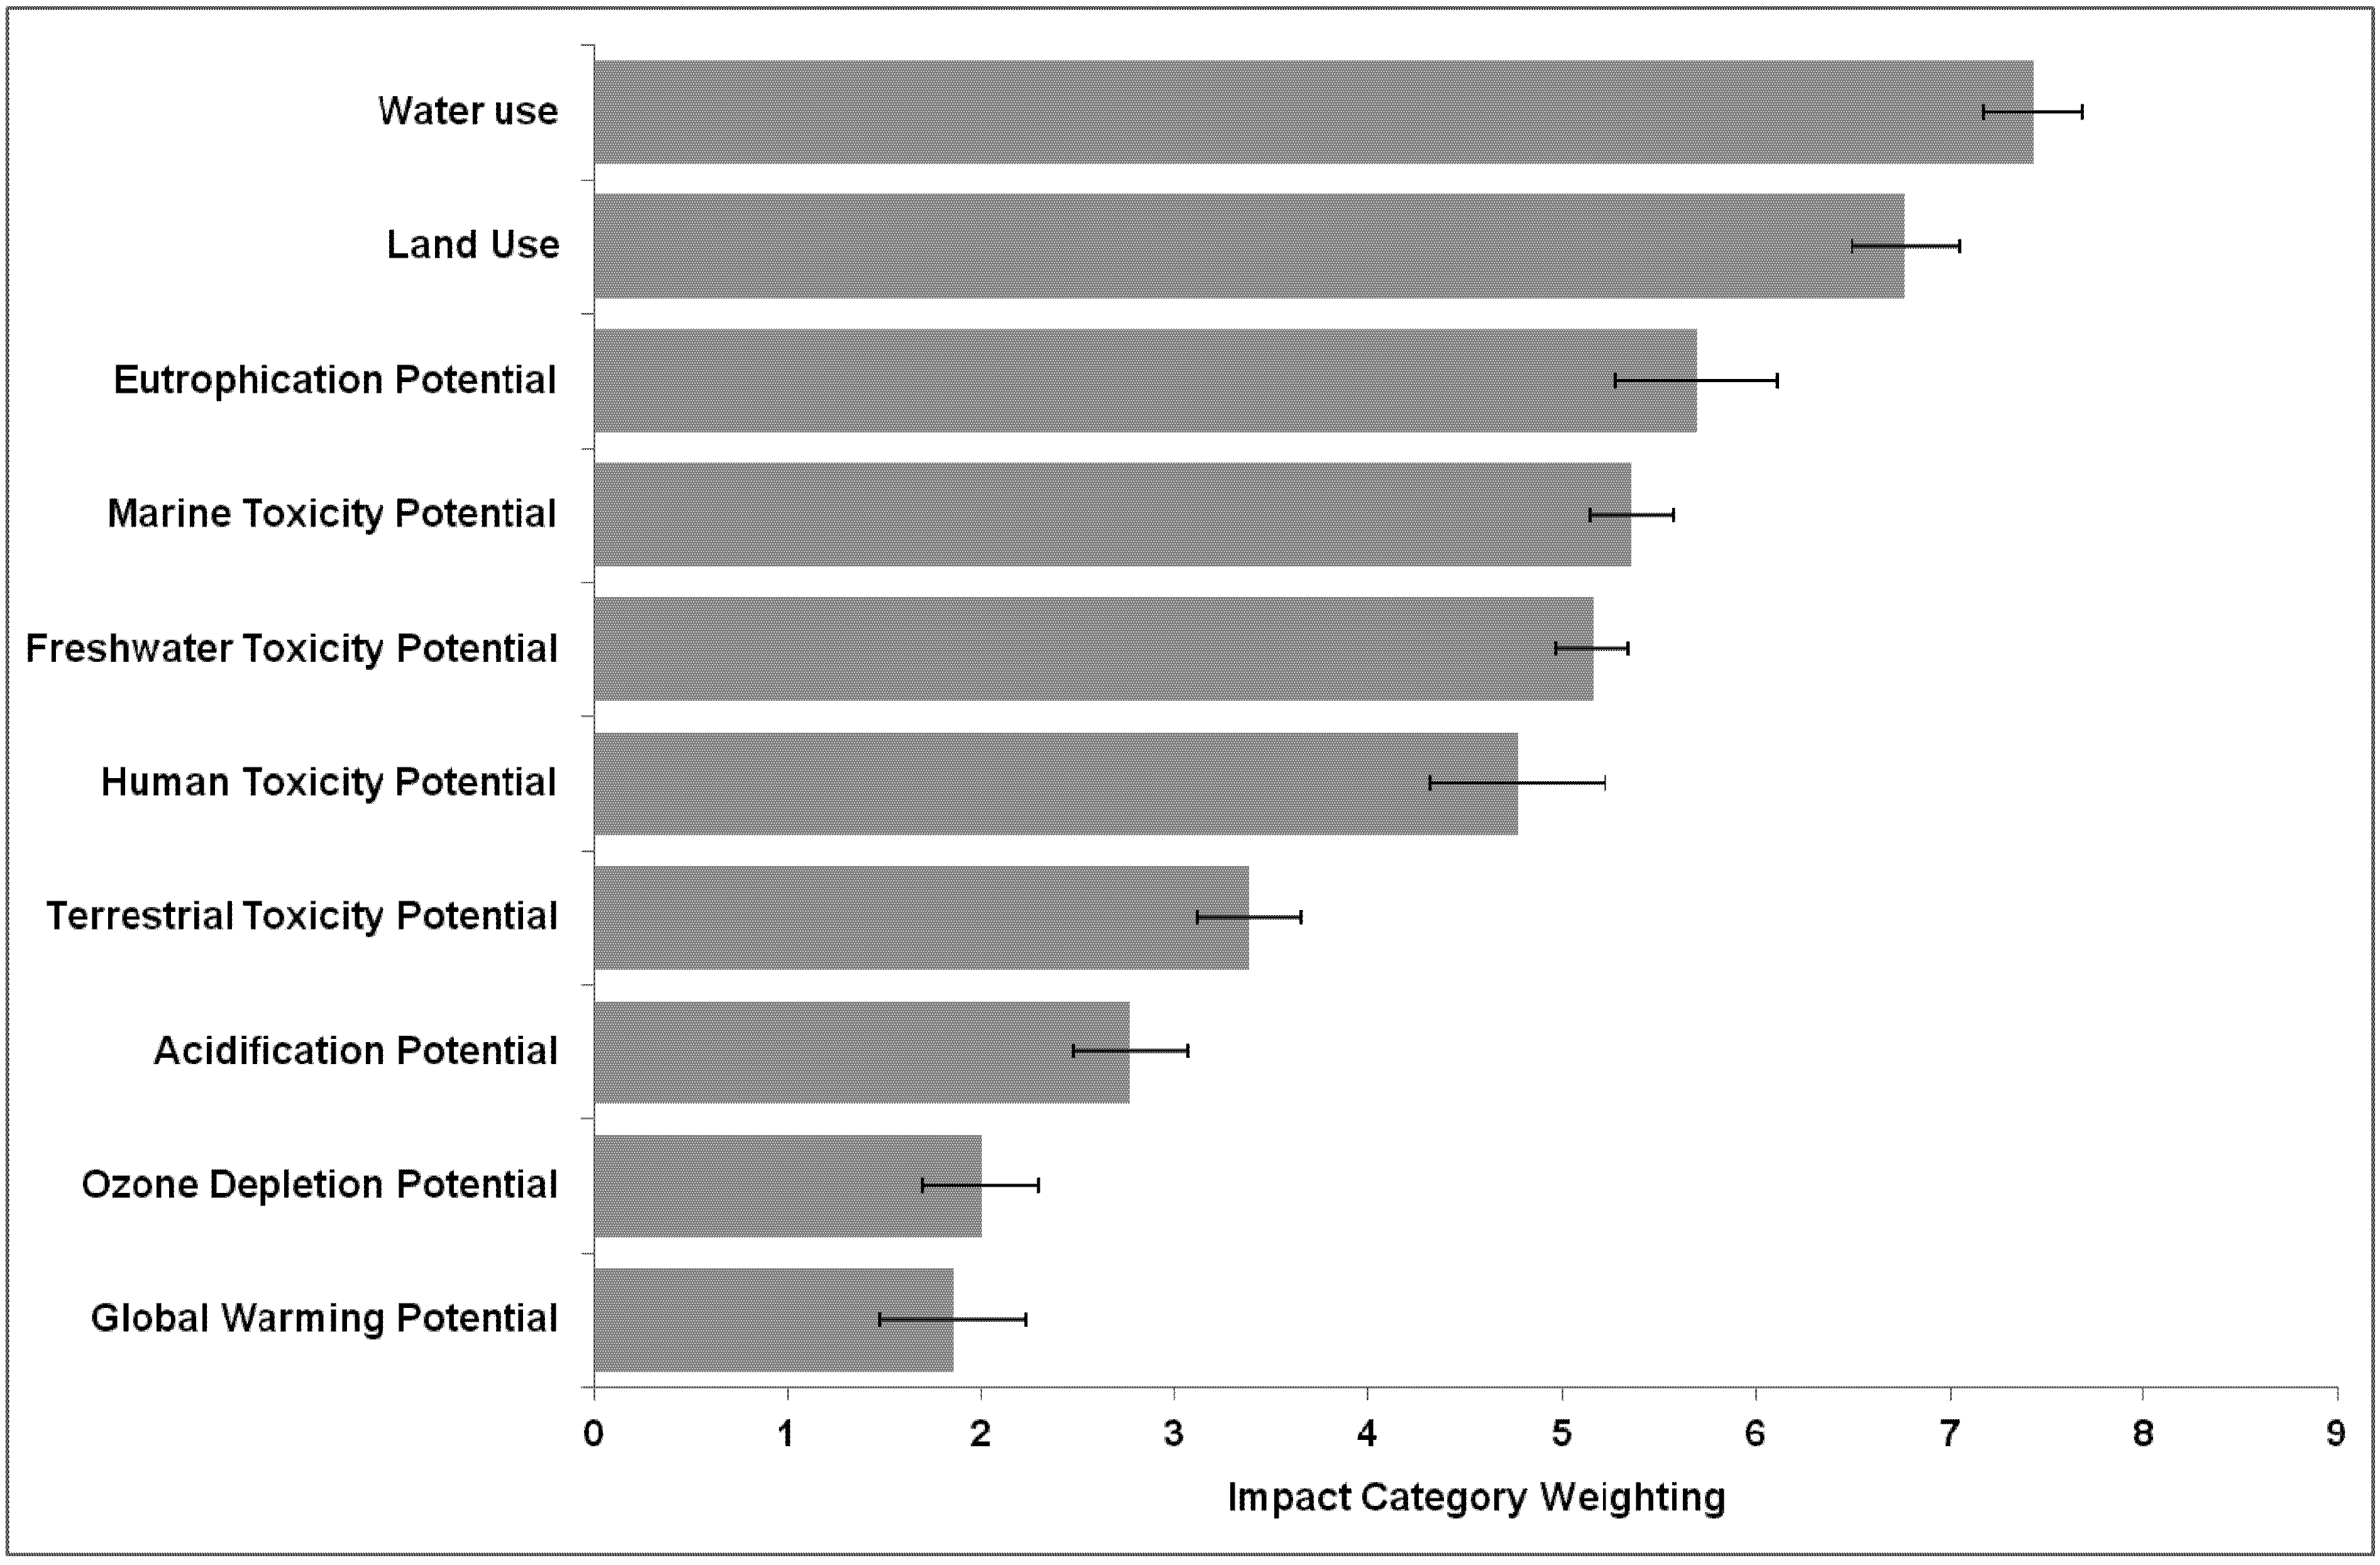
Volumetric water useA simple accounting approach to the appropriation of water [39].Water is essential to New Zealand economy and there are several cultural connotations of water use.
Land occupationThe occupation of land where the land is classified and characterized according to a Hemeroby coefficient [38].Land use is important on the east coast of the South Island because of the cultural significance to Iwi and economic opportunities associated with land-based activities.
Freshwater Ecotoxicity Potential The potential toxic effects of a chemical on freshwater ecosystems using the UNEP-SETEC USEtox model [40]. Freshwater toxicity is included because the biosolids may be a particular source of toxic compounds and the reuse option evaluations need to take this into consideration.
Marine Aquatic Ecotoxicity PotentialThe toxic effect on saltwater ecosystems and species [38].Marine ecotoxocity is included because whale watching and marine tourism are significant sources of revenue for the Kaikōura community.
Human Toxicity PotentialThe potential toxic effects of a chemical on human wellbeing using the UNEP-SETEC USEtox model [40].Human toxicity is essential to quantify because there is a permanent population in the Kaikōura region.
Terrestrial Ecotoxicity PotentialThe toxic effect on land based ecosystems and species [38].Terrestrial toxicity needs to be included because the biosolids and reuse options may be a source of toxic compounds.
The most up-to-date and complete impact assessment methods were chosen for each of the impact categories and these are specified in Table 1. Each impact category is characterized by a particular chemical or concept. Global Warming Potential is converted to carbon dioxide equivalents (kg CO2-eq), Ozone Depletion Potential to the refrigerant R11 (kg R11-eq), Eutrophication Potential is measured in phosphate equivalents (kg PO43−eq), Acidification Potential to sulfur dioxide equivalents (kg SO2-eq), Marine and Terrestrial Ecotoxicity Potential to dichlorobenzene (kg DCB-eq), Human Toxicity Potential is measured by the number of cases of illness, Freshwater Toxicity Potential by the Potential Affected Fraction per unit volume and time (PAF.m3.day), volume of Water Use is calculated to weight (kg), and the Land Use is the area used per unit time (m2.yr-eq).
Normalization was undertaken to remove the effect of aggregating values with different units. The normalization data was obtained from the Gabi4.4 database and corresponds to Organization for Economic Co-operation and Development data. Except for the water use which was calculated by dividing the daily water use of New Zealand [41] by the population [42]; the data used is detailed in Table 2.
Table 2. The normalization data used for the impact categories included in this study.
Impact CategoryNormalization dataUnits
Global Warming Potential5.26 × 10−14kg CO2-eq
Ozone Depletion Potential9.60 × 10−9kg R11-eq
Eutrophication Potential1.42 × 10−11kg PO43-eq
Acidification Potential9.59 × 10−12kg SO2-eq
Marine Toxicity Potential8.12 × 10−15kg DCB-eq
Terrestrial Toxicity Potential1.62 × 10−12kg DCB-eq
Human Toxicity Potential0.28 × 101cases
Freshwater Toxicity Potential8.33 × 10−13PAF.m3
Water Use1.88 × 101kg
Land Use2.86 × 10−4m2.yr-eq

3. Results and Discussion

The ranking votes produced in the December 2011 hui produced some interesting results (Figure 1). A key output is that global warming was ranked the least important environmental impact and that water use, land use and water quality received the majority of the votes (Figure 1).
The stakeholders recorded despondency about environmental issues such as global warming and ozone depletion because these issues require a concerted and consistent international effort that has hitherto been absent. Consequently, they felt the most pertinent issues for the Kaikōura community were the ones they could do something constructive about. Therefore land use, water use and water quality metrics scored the most important (Figure 1). Given that the main industries in Kaikōura involve farming or marine tourism, this is understandable. However, climate and water are inextricably linked and perhaps this approach does not make that explicitly clear. Given the diversity of stakeholders that attended the hui in December, it would be expected that the opinions on the importance of the environmental impact categories would be diverse. However, we found an unexpected degree of consistency in the recorded opinions of the different impact categories—as indicated by the standard error of the mean bars (Figure 1).
Figure 1. The environmental impact category weightings developed from the panel voting hui (error bars are the standard error of the mean). 10 = most important, 1 = least important.
Sustainability 05 00242 g001
The use of weighting is contentious in life cycle assessment and it has stimulated a substantial number of journal papers e.g., [43,44,45,46,47]. Finnveden et al., [48] conclude that there is no definitive way to weight in life cycle assessment and all methods suffer at least two shortfalls. Firstly, you cannot determine if the weighting approach accurately reflects the decision makers’ values at that particular point in time, and secondly, any weighting method may conceal crucial assumptions. During this study we found that there can be significant discrepancy in the general public’s understanding of environmental problems and the complexity therein. A key future objective would be to evaluate a range of weighting procedures via a sensitivity analysis—but this is out of the scope of this particular study. Weighting is particularly suitable for biosolids management decision making because the impact of each management options extends beyond a single environmental consequence and the overall impacts are disparate (Table 3). Resulting in a wealth of complicated and technical information, which viewed without aggregation may result in weighting by stealth. The integration of the Kaikōura community preferences regarding environmental impact into the analysis was a key feature of this work, and the feedback received during the hui was that this was an empowering process that gave the community more ownership and understanding of the analysis.
Table 3. Environmental impact scores for each of the biosolid reuse options and landfilling.
Impact CategoryUnitLandfillOpen Air CompostingVermi-CompostingMixture with BiocharPastoral FarmlandExotic Forest ApplicationLand Rehabilitation
Global Warmingkg CO2-eq7.00 × 1023.06 × 1032.03 × 1033.15 × 1022.85 × 1028.64 × 1018.65 × 101
Ozone Depletionkg R11-eq3.38 × 10−67.26 × 10−67.80 × 10−75.40 × 10−71.72 × 10−72.03 × 10−72.25 × 10−7
Eutrophicationkg PO43−eq0.76 × 1012.26 × 10−14.42 × 1022.21 × 1020.10 × 1014.60 × 10−14.60 × 10⁻¹
Acidificationkg SO2-eq2.98 × 10−17.20 × 10−13.09 × 10−11.60 × 10−10.32 × 1016.60 × 10−26.68 × 10⁻²
Marine Ecotoxicitykg DCB-eq9.38 × 1052.56 × 1042.05 × 1041.33 × 1046.87 × 1023.30 × 1022.45 × 102
Terrestrial Ecotoxicitykg DCB-eq0.15 × 1011.19 × 10−11.24 × 10−26.11 × 10−33.56 × 10−11.73 × 10−11.74 × 10⁻¹
Human Toxicitycases7.32 × 10−101.99 × 10−97.59 × 10−103.92 × 10−117.16 × 10−108.95 × 10−121.64 × 10⁻¹¹
Freshwater ToxicityPAF.m3.day6.08 × 10−22.13 × 10−15.48 × 10−23.57 × 10−29.59 × 10−11.45 × 10−21.49 × 10−2
Water Usekg31.3 × 1010.48 × 1010.22 × 1010.15 × 1015.31 × 10−16.23 × 10−16.23 × 10−1
Land Usem2.yr-eq2.60 × 10−45.92 × 10−14.23 × 10−11.53 × 10−26.38 × 10−68.16 × 10−81.70 × 10−7
The data detailed in Table 3 corresponds to the environmental footprints calculated for the life cycle assessment metrics in this study. The footprints exhibit a disparate and complex trend between metrics and reuse options. Because the findings of other studies are heavily influenced by system boundaries, assumptions and underlying data, it is difficult to draw comparisons. However the trend exhibited between the options is intuitively understandable. For example, global warming potential shows a higher footprint for the composting options than the direct land application options. This is because of the gaseous emissions, materials and transportation necessary for the production of compost [18]. Similarly, land use is significantly more for the composting options than the direct land applications because of the infrastructure associated with the composting facilities. Water use and eutrophication is higher for the composting facilities because of the associated wastewater treatment necessary to treat the leachate. Conversely the freshwater and human toxicity metrics are higher for the direct to land application options because the biosolids are ostensibly unprocessed.
The data was combined to a single figure using Equation 1, and the overall scores reveal an interesting trend. As depicted in Figure 2, all the reuse options were found to have a lower environmental score than landfilling the biosolids. This is largely because the reuse options avoid the production of fertilizers and pollution and resource use associated with landfills. The options that involve the direct application to land are the most environmentally benign. However there is a relatively small difference in aggregated environmental impact between these options. What difference there is can be attributable to the use of heavy machinery and resources involved in incorporating the biosolids in forest soils; compared to a simple tractor-drawn spreader used for pastoral land application.
Figure 2. The aggregated environmental index for each of the reuse options presented relative to landfilling the waste, which would have an aggregated environmental impact score of 1.
Sustainability 05 00242 g002
The composting and the mixture with biochar options exhibit an increased aggregated environmental impact compared with the direct land application options. This is because of the associated infrastructure and facilitated environmental emissions associated with these options. Open air composting was calculated as having a substantially larger environmental impact than all the other investigated options. This is because of the time taken to produce compost using an open air system and the fact that the production of a leachate may be harmful to sensitive ecosystems.
There are many areas where this research could be improved. Notably, better information is needed for weighting, impact characterization, normalization and process data. In particular, the characterization of toxicity of pharmaceutical products residuals and the displaced fertilizer products requires more experimental data to support the assumptions made in this assessment. The decision making capability of this approach could be improved substantially if site specific impact assessments were included in the life cycle assessment. The characterization factors were taken from literature sources. Consequently, the characterization of pollution may not be appropriate for the Kaikōura domain. Important characteristics such as the buffering capacity of soils or the sensitivity of local flora and fauna to the pollutants are not accounted for. These factors could vary by several orders of magnitude—thus potentially rendering this analysis redundant. Therefore, linking the applied toxicological, soil science, and atmospheric chemistry research with an engineering-based quantitative assessment of future biosolids reuse options is recommended; although it should be noted that this demands extensive research. Moreover, a quantitative approach to the social, cultural and economic aspects of the reuse options will serve to provide useful information. It is well documented that Māori have an alternative way of looking at the management and appropriation of resources e.g., [49,50] and this is not currently accommodated in the life cycle assessment framework.
The dissemination of the information revealed during the course of this study, and allied studies, was a key step in the research program. The pros and cons for each option detailing the economic, environmental and social impact for each option has been presented to the Kaikōura community during a hui. However this process presupposes that only one option can be adopted and the Kaikōura community is obliged to manage their biosolid waste in isolation of other communities. Rural communities across the South Island of New Zealand are faced with similar challenges and a collaborative approach to biosolids management may reveal new opportunities and options. The options that involve significant infrastructure may become more environmentally benign due to a potential increase in throughput i.e. due to an economy of scale.

4. Conclusion and Future Recommendations

Making decisions that concern complex systems such as the natural environment is difficult and a quantitative approach can clarify the issues, especially for non-technical stakeholders. The results of this study suggest that the direct land application options have a relatively benign environmental impact compared to the options that involve significant infrastructure or reprocessing. This is likely to be symptomatic of the chemical composition of Kaikōura’s biosolids and the total amount of biosolids to be processed considering the infrastructure necessary for the reuse options that involve reprocessing. Consequently, the findings of this study may not transpose to other regions, communities or times.
The community engagement aspect was a particular success and we advocate this approach with other communities on similar issues. Notably there was an acceptance of the life cycle assessment methodology by the Kaikōura community despite knowledge of its limitations. Moreover, the decision making capacity associated with life cycle assessment will be improved if the aforementioned limitations are addressed.
There has been reluctance from district councils in New Zealand to engage with communities on waste management decision making, but we have found that community engagement is a positive process that may reduce the risk associated with local council waste management decisions. However a key risk associated with this approach is that the overall assessment of options presupposes that a single reuse option will be favored, and that Kaikōura has to deal with their biosolids on their own. Perhaps a combination of options or a collaborative approach to biosolids management may serve the Kaikōura community best, and thus this warrants significant further investigation.

Acknowledgments

This work was funded by the Kaikōura District Council and the sustainable initiatives fund. The authors would like to thank Julia Schuler (Hochschule für Forstwirschaft Rottenburg) and Jeff Seadon (Scion) for their help in completing this manuscript, and all the stakeholders for participating in the hui in December 2011.

Conflict of Interest

The authors declare no conflict of interest.

References and Notes

  1. Fitzmorris, K.B.; Sarmiento, F.; O'Callaghan, P. Biosolids and sludge management. Water Environ. Res. 2009, 81, 1376–1393. [Google Scholar] [CrossRef]
  2. Magesan, G.N.; Wang, H.; Clinton, P.W. Best Management Practices for Applying Biosolids to Forest Plantations in New Zealand; Scion Internal Report 17514; Scion: Christchurch, New Zealand, 2010. [Google Scholar]
  3. Yusuf, S.A.; Georgakis, P.; Nwagboso, C. Procedural lot generation for evolutionary urban layout optimization in urban regeneration decision support. ITCON 2011, 16, 357–380. [Google Scholar]
  4. Baumann, H.; Tillman, A.-M. The Hitchhikers guide to LCA. An Orientation in Life Cycle Assessment Methodology and Application, 1st ed; Studentlitteratur AB: Lund, Sweden, 2004; p. 543. [Google Scholar]
  5. Gunamantha, M. Sarto Life cycle assessment of municipal solid waste treatment to energy options: Case study of KARTAMANTUL region. Yogyakarta. Renew. Energ. 2012, 41, 277–284. [Google Scholar] [CrossRef]
  6. Koroneos, C.J.; Nanaki, E.A. Integrated solid waste management and energy production-A life cycle assessment approach: The case study of the city of Thessaloniki. J. Clean. Prod. 2012, 27, 141–150. [Google Scholar] [CrossRef]
  7. Curry, R.; Powell, J.; Gribble, N.; Waite, S. A streamlined life-cycle assessment and decision tool for used tyres recycling. Proc. Inst. Civ. Eng. 2011, 164, 227–237. [Google Scholar]
  8. Tunesi, S. LCA of local strategies for energy recovery from waste in England, applied to a large municipal flow. Waste Manage. 2011, 31, 561–571. [Google Scholar] [CrossRef]
  9. Peters, G.M.; Rowley, H.V. Environmental comparison of biosolids management systems using life cycle assessment. Envir. Sci. Tech. Lib. 2009, 43, 2674–2679. [Google Scholar] [CrossRef]
  10. Sablayrolles, C.; Gabrielle, B.; Montrejaud-Vignoles, M. Life Cycle Assessment of Biosolids Land Application and Evaluation of the Factors Impacting Human Toxicity through Plant Uptake. J. Ind. Ecol. 2010, 14, 231–241. [Google Scholar] [CrossRef] [Green Version]
  11. Peters, G.M.; Lundie, S. Life-cycle assessment of biosolids processing options. J. Ind. Ecol. 2001, 5, 103–121. [Google Scholar] [CrossRef]
  12. ISO14040: 2006. Environmental Management-Life Cycle Assessment-Goal and scope definition and inventory analysis, International Organization for Standardization: Geneva, Switzerland, 2006.
  13. ISO14044:2006. Environmental Management-Life Cycle Assessment-Requirements and Guidelines, International Organization for Standardization: Geneva, Switzerland, 2006.
  14. Frischknecht, R.; Jungbluth, N.; Althaus, H.J.; Doka, G.; Dones, R.; Heck, T.; Hellweg, S.; Hischier, R.; Nemecek, T.; Rebitzer, G.; Spielmann, M. The ecoinvent database: Overview and methodological framework. Int. J. Life Cycle Ass. 2005, 10, 3–9. [Google Scholar] [CrossRef]
  15. MoT. The New Zealand vehicle fleet: Annual fleet statistics, 2009. In Ministry of Transport, Te Manatu Waka; A statistical report; Wellington, New Zealand, 2010; ISBN 978-0-478-07228-0.
  16. Thompson, J.; Singh, P. Status of Energy Use and Conservation Technologies Used in Fruit and Vegetable Cooling Operations in California; California Energy Commission, PIER Program, CEC-400-1999-005; University of California: Davis, United States of America, 2008. [Google Scholar]
  17. McLaren, S., Jr.; Love, R.; McDevitt, J.E. Life Cycle Assessment Data Sets Greenhouse Gas Footprinting Project inventory report: Coolstores. A report for MAF and Zespri International (No. 12247); Ministry for Agriculture and Forestry: Wellington, New Zealand, 2011. [Google Scholar]
  18. Chan, Y.C.; Sinha, R.K.; Wang, W. Emission of greenhouse gases from home aerobic composting, anaerobic digestion and vermicomposting of household wastes in Brisbane (Australia). Waste Manage. Res. 2011, 29, 540–548. [Google Scholar] [CrossRef]
  19. Rodriguez, V.; Valdez-Perez, M.D.L.A.; Luna-Guido, M.; Ceballos-Ramirez, J.M.; Franco-Hernandez, O.; van Cleemput, O.; Marsch, R.; Thalasso, F.; Dendooven, L. Emission of nitrous oxide and carbon dioxide and dynamics of mineral N in wastewater sludge, vermicompost or inorganic fertilizer amended soil at different water contents: A laboratory study. Appl. Soil Ecol. 2011, 49, 263–267. [Google Scholar] [CrossRef]
  20. Forgie, D.J.L.; Sasser, L.W.; Neger, M.K. Compost Facility Requirements Guideline: How to Comply with Part 5 of the Organic Matter Recycling Regulation; Ministry of Water Land and Air Protection: British Columbia, Canada, 2004. [Google Scholar]
  21. Ibarrola, R.; Shackley, S.; Hammond, J. Pyrolysis biochar systems for recovering biodegradable materials: A life cycle carbon assessment. Waste Manage. 2012, 32, 859–868. [Google Scholar] [CrossRef]
  22. Hammond, J.; Shackley, S.; Sohi, S.; Brownsort, P. Prospective life cycle carbon abatement for pyrolysis biochar systems in the UK. Energ. Policy 2011, 39, 2646–2655. [Google Scholar] [CrossRef]
  23. IPCC. IPCC Guidelines for National Greenhouse Gas Inventories: Volume 4: Agriculture, Forestry and other Land Use; Intergovernmental Panel on Climate Change: Paris, France, 2006. Available online: http://www.ipcc-nggip.iges.or.jp/public/2006gl/vol4.htm (accessed on 21 August 2012).
  24. Adam, K. The Environmental and Health Implications of the Decomposition of Biosolids; University of Canterbury: Christchurch, New Zealand, 2003. [Google Scholar]
  25. Palma, R.M. Evaluation of Ammonia volatilisation, Carbon Dioxide evolution and N balance from biosolids following application to forest soils. M.S. Thesis, University of Canterbury, Christchurch, New Zealand, 2000. [Google Scholar]
  26. Knowles, O.A.; Robinson, B.H.; Contangelo, A.; Clucas, L. Biochar for the mitigation of nitrate leaching from soil amended with biosolids. Sci. Total Environ. 2011, 409, 3206–3210. [Google Scholar] [CrossRef]
  27. Brown, S.; Beecher, N.; Carpenter, A. Calculator tool for determining greenhouse gas emissions for biosolids processing and end use. Envir. Sci. Tech. Lib. 2010, 44, 9509–9515. [Google Scholar]
  28. Pierzynski, G.M.; Gehl, K.A. Plant nutrient issues for sustainable land application. J. Environ. Qual. 2005, 34, 18–28. [Google Scholar]
  29. PE International. GaBi 4.4 Professional Life Cycle Software; University of Stuttgart: Germany, 2009. Available online: http://www.gabi-software.com (accessed on 3 May 2010).
  30. McDevitt, J.E.; Seadon, J. Life Cycle Assessment Data Sets Greenhouse Gas Footprinting Project: Diesel. A report prepared for MAF and Zespri International (No. 12247); Ministry for Agriculture and Forestry: Wellington, New Zealand, 2011. [Google Scholar]
  31. Robinson, B. Chemical Composition of the Kaikoura Biosolids. Hui presentation at Takahanga marae. April 2011; Unpublished work. [Google Scholar]
  32. Northcott, G. Contaminants in the Kaikoura Biosolids. Hui presentation at Takahanga marae. April 2011; Unpublished work. [Google Scholar]
  33. Cadena, E.; Coln, J.; Artola, A.; Sanchez, A.; Font, X. Environmental impact of two aerobic composting technologies using life cycle assessment. Int. J. Life Cycle Ass. 2009, 14, 401–410. [Google Scholar] [CrossRef]
  34. van Haaren, R.; Themelis, N.J.; Barlaz, M. LCA comparison of windrow composting of yard wastes with use as alternative daily cover (ADC). Waste Manage. 2010, 30, 2649–2656. [Google Scholar] [CrossRef]
  35. Fernandez-Luqueao, F.; Reyes-Varela, V.; Martanez-Suarez, C.; Reynoso-Keller, R.E.; Mandez-Bautista, J.; Ruiz-Romero, E.; Lapez-Valdez, F.; Luna-Guido, M.L.; Dendooven, L. Emission of CO2 and N2O from soil cultivated with common bean (Phaseolus vulgaris L.) fertilized with different N sources. Sci. Total Environ. 2009, 407, 4289–4296. [Google Scholar] [CrossRef]
  36. IPCC, Solid Waste disposal. In 2006 IPCC Guidelines for National Greenhouse Gas Inventories. Prepared by the National Greenhouse Gas Inventories Programme; Hayama, Japan, 2006.
  37. IPCC, Climate Change 2007. IPCC Fourth Assessment Report. The Physical Science Basis; 2007.
  38. Guinée, J.B. Handbook on life cycle assessment. Operational guide to ISO standards; Kluwer Academic Publishers: Dordrecht, The Netherlands, 2002; p. 692. [Google Scholar]
  39. Hoekstra, A.Y.; Chapagain, A.K.; Aldaya, M.; Mekonnen, M.M. Water Footprint Manual-State of the Art; Water Footprint Network: Enschede, The Netherlands, 2009. [Google Scholar]
  40. Rosenbaum, R.K.; Bachmann, T.M.; Gold, L.S.; Huijbregts, M.A.J.; Jolliet, O.; Juraske, R.; Koehler, A.; Larsen, H.F.; MacLeod, M.; Margni, M.; et al. USEtox-The UNEP-SETAC toxicity model: Recommended characterisation factors for human toxicity and freshwater ecotoxicity in life cycle impact assessment. Int. J. Life Cycle Ass. 2008, 13, 532–546. [Google Scholar] [CrossRef]
  41. StatsNZ, Water Physical Stock Account: 1995-2005; Statistics New Zealand: Wellington, New Zealand, 2007.
  42. StatsNZ, Census of Population and Dwellings - Final Counts; Statistics New Zealand: Wellington, New Zealand, 2006.
  43. Reap, J.; Roman, F.; Duncan, S.; Bras, B. A survey of unresolved problems in life cycle assessment. Part 2: Impact assessment and interpretation. Int. J. Life Cycle Ass. 2008, 13, 374–388. [Google Scholar] [CrossRef]
  44. Johnsen, F.M.; Løkke, S. Review of criteria for evaluating LCA weighting methods. Int. J. Life Cycle Ass. 2012, 1–10. [Google Scholar]
  45. Yellishetty, M.; Ranjith, P.G.; Tharumarajah, A.; Bhosale, S. Life cycle assessment in the minerals and metals sector: A critical review of selected issues and challenges. Int. J. Life Cycle Ass. 2009, 14, 257–267. [Google Scholar] [CrossRef]
  46. Finnveden, G.; Eldh, P.; Johansson, J. Weighting in LCA based on ecotaxes: Development of a mid-point method and experiences from case studies. Int. J. Life Cycle Ass. 2006, 11, 81–88. [Google Scholar] [CrossRef]
  47. Koffler, C.; Schebek, L.; Krinke, S. Applying voting rules to panel-based decision making in LCA. Int. J. Life Cycle Ass. 2008, 13, 456–467. [Google Scholar] [CrossRef]
  48. Finnveden, G.; Hofstetter, P.; Bare, J.; Basson, L.; Ciroth, A.; Mettier, T.; Seppälä, J.; Johansson, J.; Norris, G. Normalisation, grouping, and weighting in life cycle impact assessment. In Life Cycle Impact Assessment: Striving Towards Best Practice. Society of Environmental Toxicology and Chemistry (SETAC); de Haes, H.A.U., Ed.; Pensacola, FL, USA, 2002. [Google Scholar]
  49. Tipa, G.; Teirney, L. Cultural Health Index for Streams and Waterways: A tool for nationwide use. A report prepared for the Ministry for the Environment (No. 710); Ministry for the Environment: Wellington, New Zealand, 2006. [Google Scholar]
  50. Rotarangi, S.; Thorp, G. Can profitable forest management incorporate community values? New Zeal. J. For. 2009, 54, 13–16. [Google Scholar]

