Article

Economic Analysis of Climate Variability Impact on Malaria Prevalence: The Case of Ghana

by
Wisdom Akpalu
1,2,* and
Samuel Nii Ardey Codjoe
3
1
Farmingdale State College, State University of New York, 2350 Broadhollow Road, Farmingdale, NY 11735, USA
2
Center for Environmental Economics Research & Consultancy (CEERAC), P. O. Box CS 9379, Tema, Ghana
3
Regional Institute for Population Studies (RIPS), University of Ghana, P. O. Box LG 96, Legon, Ghana
*
Author to whom correspondence should be addressed.
Sustainability 2013, 5(10), 4362-4378; https://doi.org/10.3390/su5104362
Submission received: 26 July 2013 / Revised: 10 September 2013 / Accepted: 8 October 2013 / Published: 17 October 2013

Abstract

:
A number of studies exist on the relationship between climatic factors and malaria prevalence. However, due to scarcity of data, most of the studies are based on biophysical experiments and do not control for socioeconomic covariates. This research, which uses data on Ghana, contributes to the thin literature that addresses this limitation. We found that humidity and rainfall predict malaria prevalence. Furthermore, our results suggest that malaria prevalence increases with rainfall, the proportion of middle income households, and the proportion of households with no formal education. The corresponding elasticity coefficients are 0.67, 0.12 and 0.66, respectively. Significant differences in the prevalence rate have also been observed across regions.

1. Introduction

Although estimated global incidence of malaria fell by 17% between 2000 and 2010, the number of cases remains very high [1]. The global malaria cases in 2010 were estimated at 219 million, with 660,000 deaths. Africans accounted for about 91% of the deaths [2]. Of this number, 75% of the dead were children, making malaria a very serious public health problem on the continent. By 2100, the risk of exposure to the disease, measured in person-months, is projected to increase by 16%–28% [3,4,5]. In Ghana, the current prevalence rate is estimated at 27.5% [6]. As 36.7% of those who contract malaria do not seek orthodox medical treatment, but consult with chemical stores or religious facilities, the actual prevalence rate could be higher [7].
In addition to the morbidity estimates, the economic cost of malaria is staggering. In 2008, the costs of foregone production alone in Africa totaled about US$ 12 billion [8]. The malaria burden in Africa is estimated at 10% of Disability Adjusted Life Years (DALYs) [9]. Due to the huge economic burden of the disease, understanding the factors that impact its prevalence is crucial for its prediction and prevention.
Global climate change or variability, and extreme climate events have been noted to partially explain malaria prevalence [4,10,11,12]. In September 2007, for example, East Africa was struck by floods which had not been experienced in decades. This led to the outbreak of diseases like malaria and diarrheal diseases. Also, the flooding in Mozambique in 2000 appeared to have increased the number of malaria cases by a factor of 1.5–2 [13]. The climatic factors frequently considered are temperature, rainfall, precipitation and humidity [14,15,16,17,18]. In recent years, a number of studies have tried to quantify the impact of global climate change and extreme climate events on malaria prevalence [19,20]. For example, a biophysical model attributed to Martens [21] establishes a link between mosquito mortality and daily average temperature. Specifically, the study found that high temperature (or low precipitation) decreases daily survival probability of mosquitoes, mosquito abundance, and the fraction of infected mosquitoes that survives an extrinsic incubation period. Also, rainfall is found to increase the abundance of breeding grounds of mosquitoes [22].
However, outside of the laboratory, the relationship between malaria transmissibility and temperature and precipitation is generally complex due to nonlinear impacts on mosquito population by climatic factors, as well as the interactions among such variables. For example, Thompson et al. [16] found that inter-annual malaria incidence is impacted by rainfall and sea surface temperature, while Ndiaye et al. [17] found a very high correlation between malaria mortality and rainfall, but no impact from temperature or humidity. A study has also found that extreme rainfall or precipitation can reduce malaria prevalence by washing away anopheles mosquitoes from breeding grounds [18]. Bomblies and Eltahir [23] performed several simulations using an extension of Marten’s model and concluded that serious caution must be exercised in generalizing predictions of malaria response to climate change. A careful study of specific scenarios with the aid of detailed models is necessary for achieving credible predictions. Bomblies’ and Eltahir’s model also assumes that the social and economic factors that could impact transmission of the disease are given or are constant, which could limit the “external validity” of the results. In addition to those findings, Parham and Michael found that heterogeneities in humans, mosquitoes, and parasite populations introduce considerable uncertainties into the system of transmission [24].
To address these limitations, a few attempts have been made at investigating the impact of climate and economic variables on malaria incidence in Africa and elsewhere. In a recent study, Egbendewe-Mondzozo et al. [22] found that, by the end of the century, a marginal change in temperature and precipitation levels would lead to a significant change in the number of malaria cases for most countries in Africa. In addition, policies that stimulate economic growth, reduce income inequality, or increase public health expenditures could mitigate the impact of malaria. A potential shortcoming of the study, which was noted by the authors, relates to data aggregation and overgeneralization. Specifically, due to the limited data available, only one temperature and precipitation level data point was assigned to each country in the sample, implying that all regions within each country have homogeneous climatic conditions.
This study contributes to the malaria-climate variability nexus by investigating whether or not climatic factors predict malaria incidence in Ghana. It also establishes a link between a number of socio-economic variables and malaria prevalence using the limited available data on the relevant variables. We have found that at the district level, humidity and total rainy days in a year appear to be predictors of malaria prevalence within the country. A univariate time series analysis on the series reveals the malaria prevalence is rising over time. Furthermore, a cross-sectional analysis at the district level indicates that increased number of rainfalls increases malaria prevalence, but providing formal education equivalent to the percentage increase in the number of rainfalls could mitigate the impact of the rainfall. It is also important to note that, in contrast to expectation, districts with a higher proportion of middle income households, on average, had higher malaria prevalence.
The remainder of the paper is organized as follows. Section 2 contains a brief overview of malaria in Ghana. This is followed by a description of the empirical modeling strategy for both the time series and cross-sectional analyses, as well as the data description. Section 4 presents and discusses the results of both the time series and cross-sectional analyses. The final section, Section 5, concludes the paper.

2. Malaria in Ghana: An Overview

Ghana has three malaria epidemiologic zones: the northern savannah, the tropical rainforest, and the coastal savannah/mangrove swamps. The country’s entire population of 25.2 million people is spread across the three zones, and, subsequently, is at risk of getting malaria. Two dominant malaria vector species are found in Ghana: Anopheles gambiae and An. Funestus [25]. The mosquitoes usually bite late at night, are indoor resting, and are commonly found in areas where favorable breeding sites exist. Due to increasing indoor-insecticide based interventions, the behavior of the malaria vector species has switched between indoor and outdoor biting [26]. A recent study in Ghana has found over 50% of biting occurring outdoors in the northern savannah [27]. Malaria transmission in the country occurs year round with variations between wet and dry seasons. Due to the pronounced seasonal variations in northern Ghana and a prolonged dry season from September to April, the normal duration of the intense malaria transmission season is about seven months, beginning in April/May and lasting until September [27].
The disease is a major cause of morbidity and mortality in the country and the pattern has been stationary over the years. It is estimated that each year about 3.5 million Ghanaians get malaria [28]. In 2006, for example, malaria prevalence per thousand people was estimated at 171. In the same year, there were 2835 deaths attributed to the disease, representing 19% of all recorded deaths [29]. In addition, malaria accounted for 38.6% of all outpatient illnesses and 36.9% of all admissions [30].
Infection rates are high in children and pregnant women. In Ghana, about 20,000 children die from the disease each year [28]. Some estimates put the number at 33% of all deaths in children under 5 years [31]. Malaria infection during pregnancy results in maternal anemia and placental parasitemia. Both of these illnesses are responsible for miscarriages and babies born with low birth weight. In 2006, 13.7% of all hospital admissions of pregnant women were due to malaria, with 9.0% dying from the disease. It is noteworthy that poverty has been found to highly correlate with malaria worldwide, as malaria-endemic countries are among the world’s most impoverished [28].
Malaria in Ghana is estimated to cause a loss of 10.6% DALYs, which translates into an economic impact equivalent to 6% of the annual GDP. At the level of the individual household, a malaria-stricken family, in addition to paying prevention costs and suffering loss of income, spends an average of over 25% of its income on malaria treatment. Such families harvest 40% of the crops harvested by healthy families. In areas where the disease is endemic, up to 60% of children’s schooling may be impaired as a result of repeated bouts of malaria [28].
Since 2003, the government of Ghana, in collaboration with a number of donor agencies, has embarked on numerous initiatives to combat malaria. The first initiative, which began in 2003, was called Roll Back Malaria (RBM) and was designed to strengthen health services and make effective prevention and treatment strategies more widely available [28]. As part of the initiative, the Ghana Health Service (GHS), in cooperation with local government authorities and UNICEF, procured and distributed Insecticide Treated Nets (ITNs) to communities across the country. Between 2007 and 2011, a total of 3,316,469 ITNs were distributed [27]. It has been found that their use lowers the incidence rate by 20% among children. Notwithstanding the effectiveness of bed nets, their level of adoption is very low in Ghana. Only about 45% and 33% own any bed nets and ITNs, respectively [7,32].
Another Ghanaian initiative is the Intermittent Preventive Treatment (IPT) for pregnant women. In this treatment program, pregnant women in their second and third trimesters are administered at least two doses of the drug sulfadoxine-pyrimethamine (SP) at least one month apart. This significantly reduces the proportion of low-birth weight infants and reduces maternal morbidity, and has been piloted and promoted in the upper East, upper West and Northern regions of Ghana [33]. With regards to infants, the IPT strategy involves providing them with curative doses of an anti-malarial (sulphadoxine-pyrimethamine) as they participate in routine childhood immunization [28]. This is believed to be highly effective at reducing malaria infection and anemia but is not currently practiced in Ghana [28].
Currently, an Artesunate-Amodiaquine combination, which belongs to Artemisinin-based Combination Therapies (ACTs), has been selected as the first line drug for the treatment of uncomplicated malaria in Ghana. The criteria for selecting these combinations include its efficacy, compliance, side effects, cost effectiveness, and appropriateness for treating malaria in children and in pregnancy. A recent test has found that Artesunate-Amodiaquine combination has a clinical response of 97% [30].
In spite of all the policies and programs, there is little evidence that Ghana has managed to greatly reduce malaria prevalence over the years [1]. The disease remains the leading cause of morbidity and mortality within the country.

3. Empirical Modeling and Data

A number of empirical models have been used in our analysis. First, to investigate whether the climate variables predict malaria incidence in each of the districts as well as the aggregate of the districts, the Augmented Dickey-Fuller (unit root) and Granger causality tests were employed. Furthermore, due to the limited cross-sectional data points, Ordinary Least Square (OLS) regression analysis and Generalized Maximum Entropy (GME) method, which is a semi-parametric method, were employed to investigate the determinants of malaria incidence in Ghana in 2008.

Time Series Analysis

Granger causality analysis, which is based on multiple regression analysis, is a method employed to investigate whether a time series can correctly forecast or predict another [34]. It involves estimating two regressions: a restricted version, which is an autoregressive one (Equation 1); and an extended version, which includes the lags of the variable hypothesis to predict the dependent variables (Equation 2). A standard F-test is used to test the hypothesis about the restrictions.
Sustainability 05 04362 i001
Sustainability 05 04362 i002
where MIt and Zt signify malaria prevalence series and a climate variable (e.g., rainfall, humidity, temperature, etc.) at time t; MI(t – p) and Z(t – p) represent the time series at time t – p, p representing the number of lagged time points (order); αn and βn are signed path coefficients; and μt is a white noise error term.

Cross-Sectional Analysis

The empirical equation to be estimated is:
Sustainability 05 04362 i003
where MIi is malaria prevalence; Ri is the total number of rainy days; Yi is the proportion of households in each income group; Edi is the proportion of households without formal education within each district; and DRi is the regional dummy variable(s). The last term ei is a normally distributed error term. The parameters are expected to take the following signs: a1 > 0 , a2 > 0 , and a3 < 0 . Equation (3) is estimated using the Ordinary Least Square (OLS) estimation method, and the Generalized Maximum Entropy (GME) method is explained below.

Generalized Maximum Entropy (GME)

It is very likely that some of the variables at the right hand side of Equation 3 are highly correlated. In addition, the limited number of observations may result in biased and inconsistent estimates. As a result, the coefficients are estimated using the GME method, which could generate reliable estimates of the parameters of our model. The GME is a semi-parametric estimator and belongs to a class of estimators used in engineering and physics. To present the GME estimator, let
Sustainability 05 04362 i004
where pks ≥ 0 are unknown probabilities and Sustainability 05 04362 i007 ; Zks constitutes a predetermined discrete support space ( s ) for the parameters; and ak is as defined in Equation 4. Furthermore, define the error term in Equation 3 as
Sustainability 05 04362 i005
where wig ≥ 0 are unknown probabilities and Sustainability 05 04362 i008 ; Vig constitutes an a priori discrete support space ( g ) for the errors; and ui is as defined in Equation 3. The GME estimator is specified as
Sustainability 05 04362 i006
subject to Equation 3, but with the coefficients and the error term substituted by Equations 3 and 5. The limitation of this method is that the values of the parameters are sensitive to arbitrarily chosen support values making policy recommendations sensitive to such values. The estimations are implemented in General Algebraic Modeling System (GAMS).

Data Types and Sources

The Ministry of Health’s district-level data on malaria was used for the analysis. The time series consists of 48 observations (January 2008 to December 2011). The climate variables of interest include rainfall, temperature, humidity and wind speed. For the rainfall series, the number of rainy days was used instead of volume of rain, since the former generated better results. The 2008 climate data collected from the Ghana Meteorological Agency is limited to the 22 meteorological/weather stations [35]. As a result, the analysis is done at the district level and only the 22 districts that have weather stations are included. It is noteworthy that all of the 10 regions in the country have weather stations, and thus, are covered in the study. To control for variations in the basic cross-district socio-economic conditions that are likely to impact malaria incidence at the district level, variables such as household income and education were extracted from the Ghana Demographic and Health Survey [8]. These variables were combined with the climate and malaria data for a cross-sectional analysis. Due to the limited number of observations (i.e., 22 districts), we sought parsimony by concentrating on variables that are likely to impact malaria incidence as well as improve the fit of our regression analysis.

4. Results and Discussions
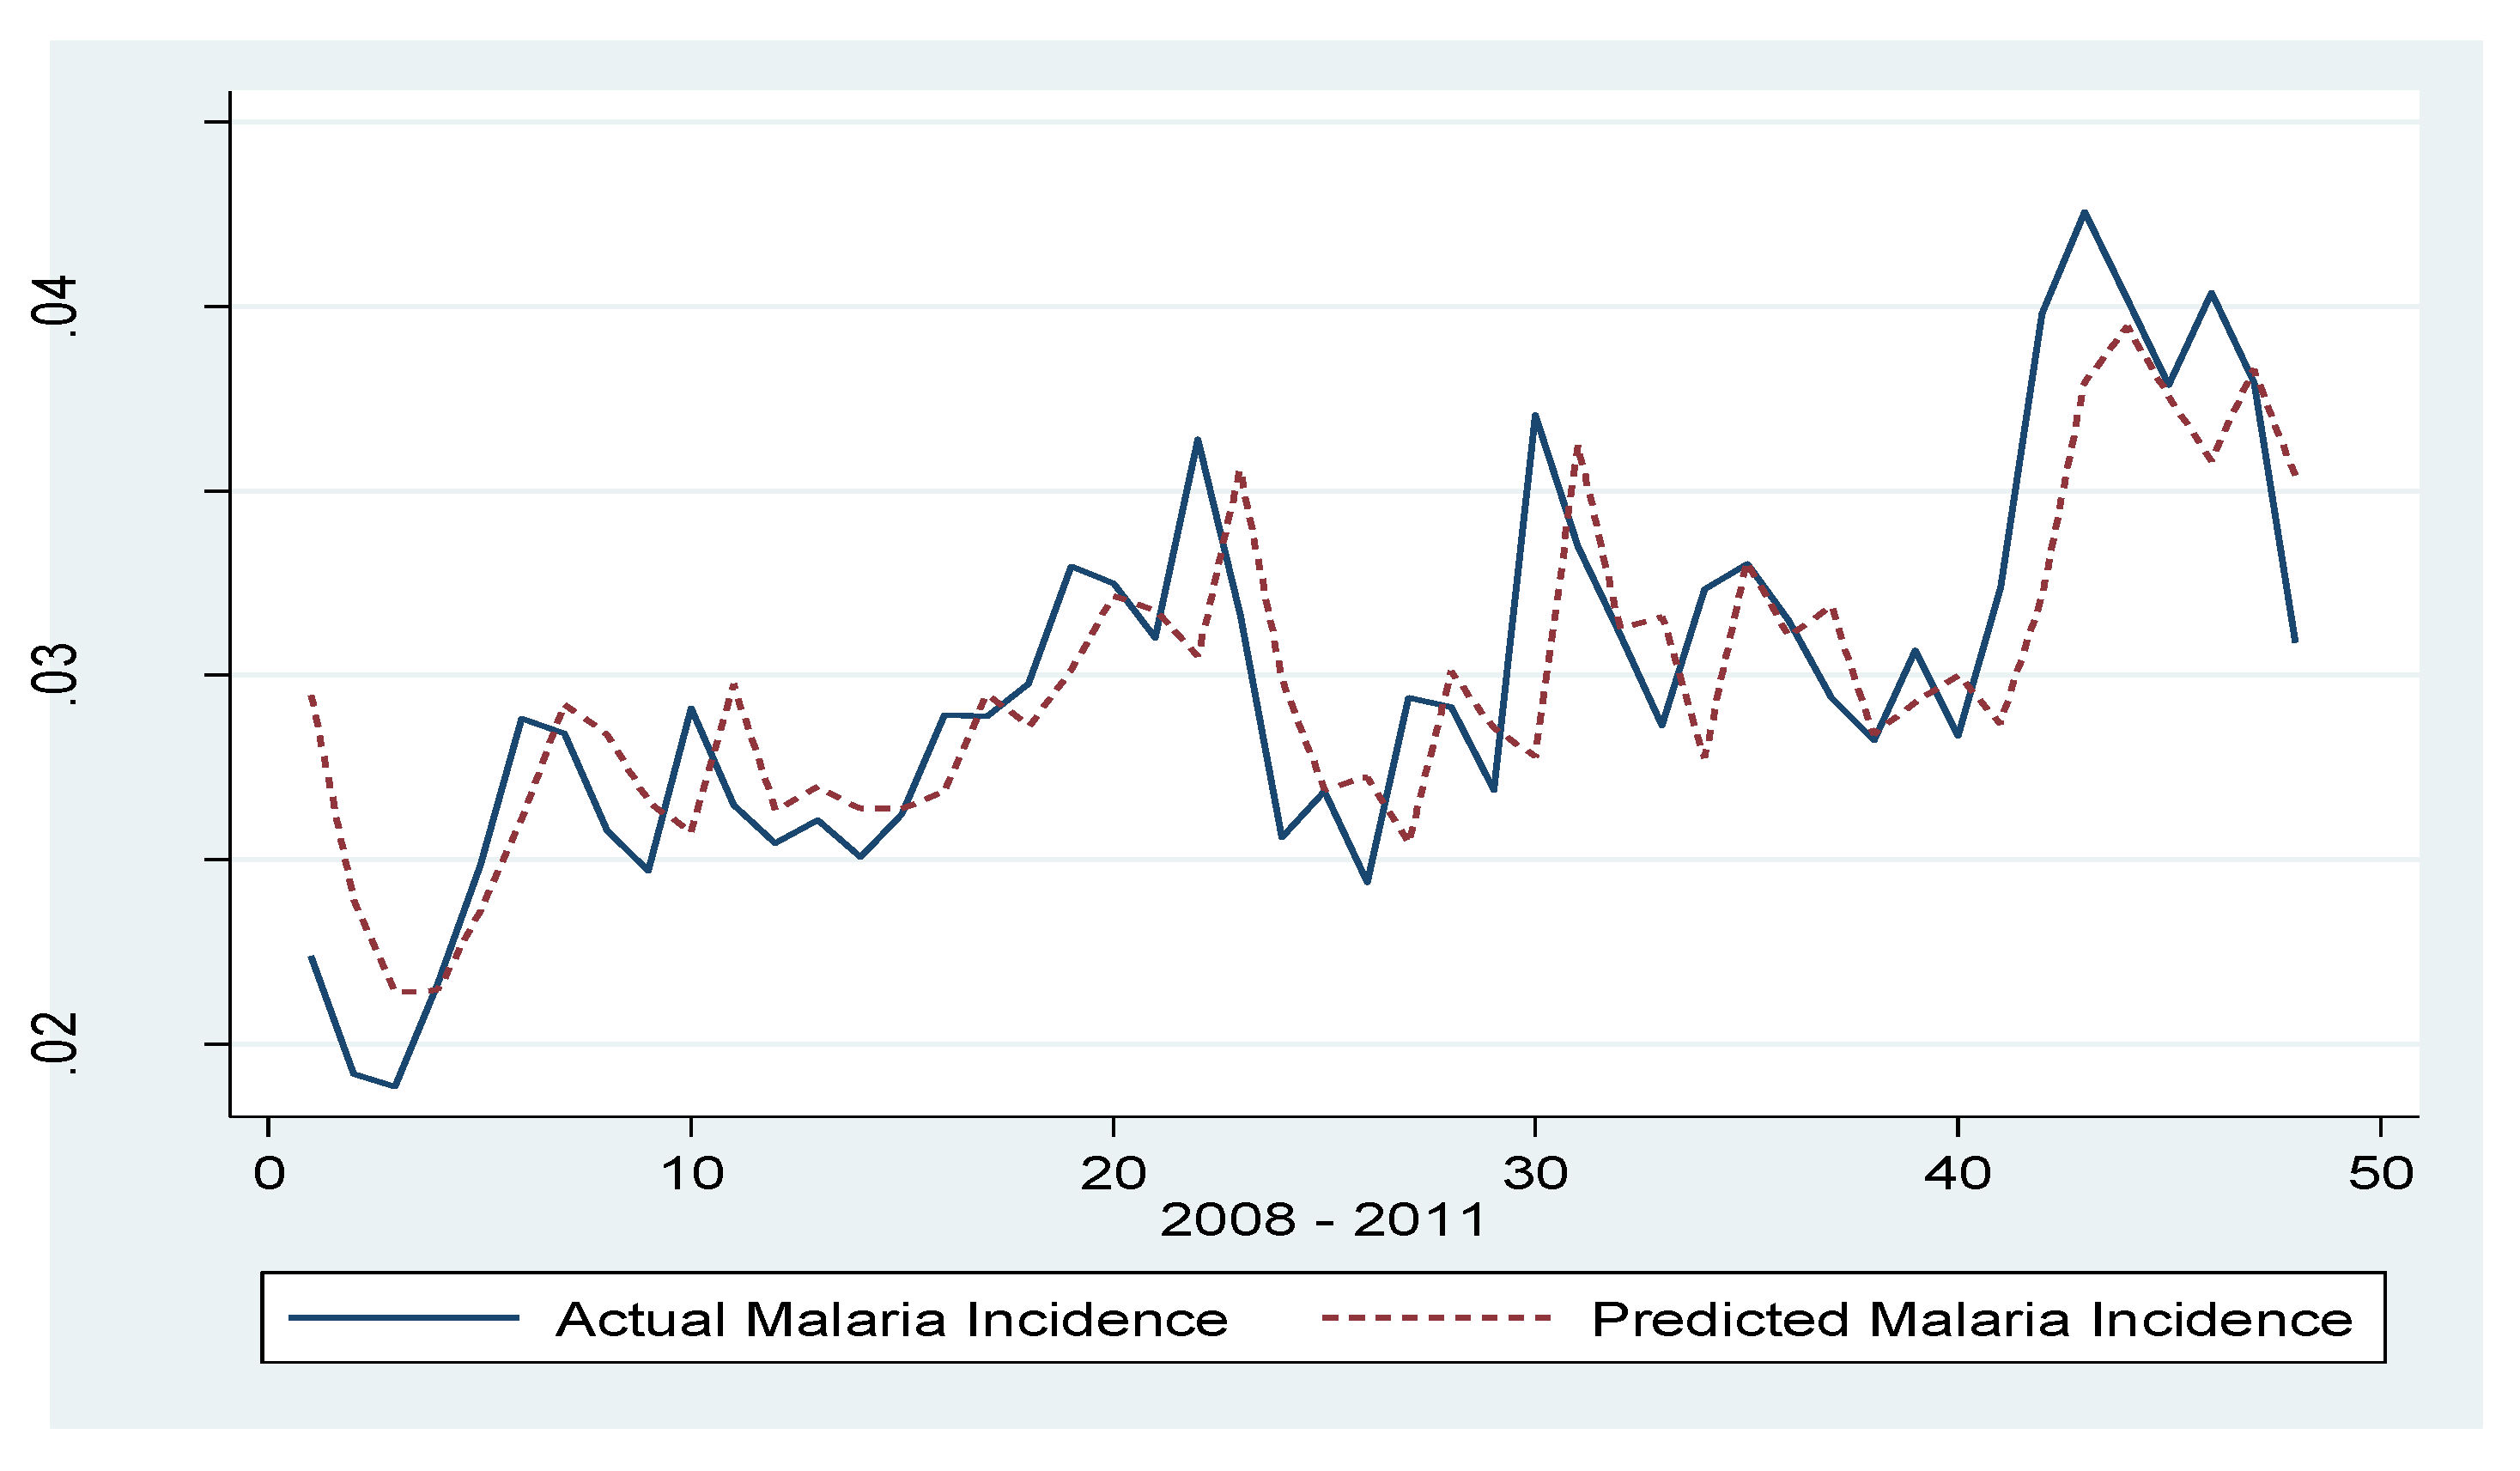
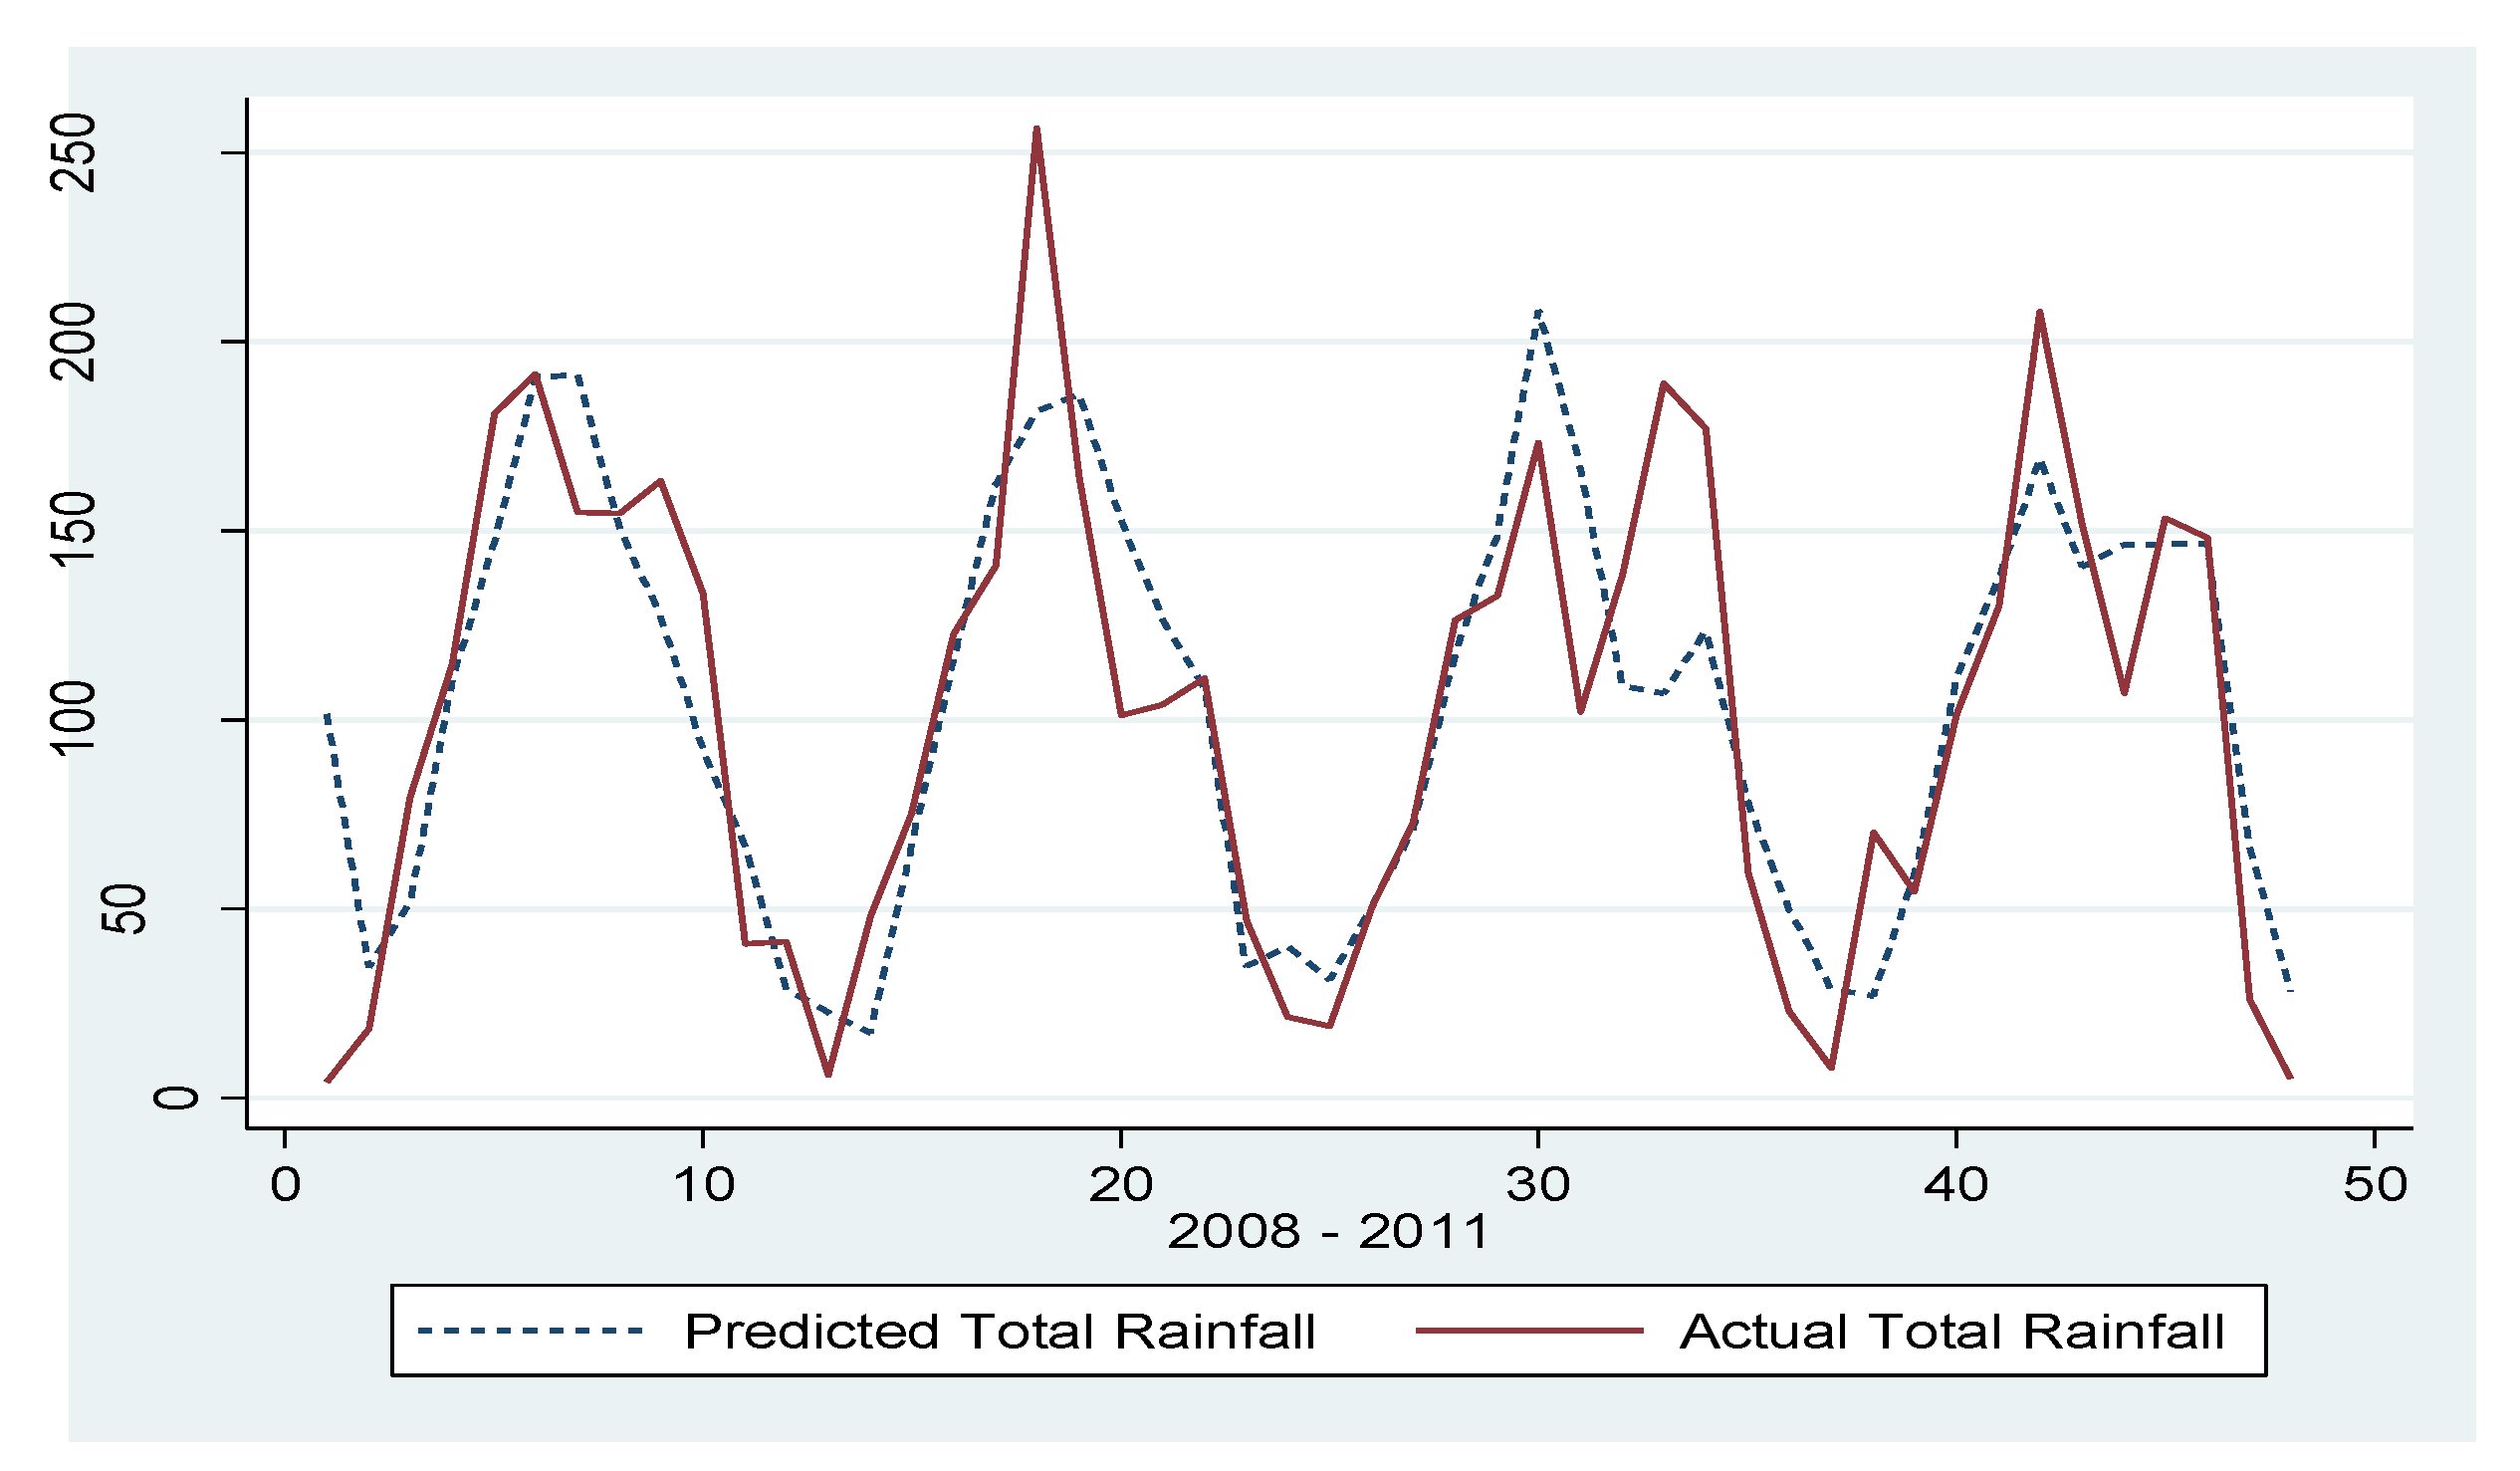
The results of the Augmented Dickey-Fuller tests for unit root are presented in Table 1. This unit root tests and all the subsequent ones are executed using the STATA 12 software. All of the series, including malaria incidence, are stationary in levels. Thus, the statistical properties (i.e., the first and second moments) of the series in the table do not change over time and the covariance between any two observations depends on the time distance between the two observations but not the time at which the observations occurred.
Table 1. Unit Root Test on Malaria Incidence and Climate Variables (Ghana: January 2008–December 2011).
Variablet-valuep-valueLags
Malaria Incidence−3.8600.0137**3
Humidity−4.7190.0006***3
Temperature−3.9650.0098***3
Rainy Days−3.8150.0158**3
Wind speed−3.4340.0470**3
Note: ** significant at 5%; *** significant at 1%.
The descriptive statistics of the malaria incidence and its potential determinants in Ghana in 2008 is given in Table 2. The average monthly incidence is 2.1% (i.e., an annual average rate of 25.2%), which is not significantly different from the 27.5% reported in the media [6]. The low standard deviation indicates the rates do not differ significantly across all the districts. Within the year, it rained 28.4% of the total number of days, with Tema recording the lowest number of rainy days within the year (69 days) and Oda, the highest (148 days). About 72.2% of the households surveyed and included in the analysis did not have any formal education. Furthermore, about a quarter of the sample was within the middle income group, and 15% came from the Eastern region, the forest zone of the country.
Table 2. Descriptive Statistics of Malaria Prevalence and its Determinants (2008).
Variables# of DistrictsMean Standard Deviation
Malaria Prevalence (Monthly)1190.0210.0082
Rains (# of Yearly Rainy Days)20104.050 19.7230
No Formal Education (Proportion) 200.7220.2139
Middle Income (Proportion)200.2350.1967
Eastern Region (1/0)2200.1500.3663
Note: 1. The malaria prevalence is measured as the proportion of the population who had malaria with a month. 2. Eastern region is a dummy variable. Thus, the variable takes the value “1” if the data pertains to Eastern region and “0” otherwise.
First, after performing unit root tests (see Table A1 at Appendix), the Granger-Causality test was implemented to determine whether or not climate variables could predict malaria incidence in each district. The results, which are presented in Table A2 at the Appendix, are clearly mixed. In one-half of the districts (i.e., 11 districts), humidity predicts or Granger-causes malaria prevalence. This is followed by the number of rainy days in a year, which predicts the prevalence in nine districts. Wind speed and temperature predict the malaria incidence in only three and seven districts, respectively. For the combined data of the entire nation (Table 3), only humidity and rainy days Granger-cause malaria prevalence.
Next, attempts have been made to forecast malaria prevalence and total rainy days. The Box-Jenkings approach to univariate time series econometric modeling was employed. The plots of the autocorrelation and partial autocorrelation functions of the series revealed the malaria prevalence series follow an Autoregressive Moving Average (ARMA) process. A further analysis reveals that the variable could be modeled as ARMA (2, 1) process (Table 4). From the results, the Wald Chi square test indicates that the line is a good fit at a 1% significance level. The coefficients of the second lag of the series and the first lag of the error term are both positive and significant at the 1% level. In addition, the drift term is also significant at the 1% level. The plots of the actual and predicted values are given in Figure 1. The analysis shows that, although the series is a stationary process, it has an upward trend. Thus, malaria prevalence is likely to rise in the future.
Table 3. Granger Causality Test on Malaria Incidence and Climate Variables (Ghana: January 2008–December 2011).
VARIABLERRSSURSSF-stats
Humidity0.0004457410.0003842483.281**
Temperature0.0004457410.0004190991.303
Rainy Days0.0004457410.0003128158.711***
Wind speed0.0004457410.0003980862.454
Note: 1. ** significant at 5%; *** significant at 1%. 2. RRSS is Restricted Residual Sum of Squares, and URSS stands for Unrestricted Residual Sum of Squares.
Table 4. ARIMA Regression: Incidence of Malaria in Ghana (January 2008–December 2011).
Varibale Coefficient Standard Error
Auto Rregresive (AR)
Lag 2 (L2).0.567 (0.1707)***
Moving Average (MA)
Lag 1 (L1)0.892(0.0994)***
Constant 0.029 (0.0020)***
Wald chi2(2) = 82.90: Prob > chi2 = 0.0000
# of obs = 48
Note. 1. *** significant at 1%. Standard errors in parentheses. 2. ARIMA is Autoregressive Integrated Moving Average.
Figure 1. The Actual and Fitted Values of Malaria Prevalence in Ghana (January 2008–December 2011).
Sustainability 05 04362 g001
The univariate analysis of total rainy days is reported in Table 5 and Figure 2. The results indicate that the series is an AR(1) process with a drift term. The autoregressive and drift terms are significant at 5% and 1% levels, respectively. The Wald Chi square test shows that the model fits the data at the 1% significance level. The estimation results and the plot clearly show that the series is stationary without trend. As a result, based on the limited data used for our analysis, the patterns of total rain received have not changed.
Table 5. ARIMA Regression: Total Rainy Days in Ghana (January 2008–December 2011).
Varibale Coefficient Standard Error
Auto Rregresive (AR)
Lag 1 ( L1)0.520 (0.12219)**
Moving Average (MA)
Lag 1 (L1)0.301(0.2583)
Constant97.149 (18.7753)***
Wald chi2(2) = 22.62: Prob > chi2 = 0.0000
# of Obs = 48
Note: 1. ** significant at 5%; *** significant at 1%. Standard errors in parentheses. 2. 2. ARIMA is Autoregressive Integrated Moving Average.
Figure 2. The Actual and Fitted Values of Total Rainy Days for 22 Districts in Ghana (January 2008–December 2011).
Sustainability 05 04362 g002

Cross-Sectional Analysis

As noted earlier, Ghana’s 2008 climate data, malaria prevalence data, and data on some socio-economic variables were combined to explore determinants of district-level malaria prevalence. Since climate data exists for 22 weather stations—each situated in an administrative district—only those were considered for the analysis. The small number of observations limits the number of potential explanatory variables that could be explored. To improve the robustness of the parameter estimates, a simple OLS was complemented with bootstrap estimates. In addition, as indicated earlier, the GME estimation method was employed to further verify the robustness of the coefficients. The (pseudo) R-squared was used to verify the goodness of fit for the three results. Table 6 contains the estimation results.
The results of the simple OLS and the bootstrap estimates, with 20 replications, were strikingly similar. For both estimations, the R-squared indicates that about 65% of the variability of malaria incidence is explained by explanatory variables (rains, income, education, and regional differences). The corresponding pseudo R-squared for the GME is slightly lower (61%). The results from the OLS reveals the “number of rainy days” and “proportion of middle income households within a district” are significant at 5% levels, and each of the other two variables (proportion of households without formal education and households in the Eastern region) was significant at the 1% level.
Regarding the coefficients of the specific variables, the elasticities are striking. The variable with the highest coefficient is the number of rainy days. On average, a 1% increase in the mean number of rainy days, all else equal, increases the incidence by 0.67%. Put differently, a district that has, say, 1% more average rainy days than the other districts experiences a 0.7% higher malaria prevalence, all else being equal. The 1% change in the mean prevalence is equivalent to 4,620 individual cases a month. With the average estimated economic cost of GH¢30.04 to GH¢32.65 per person, this will total GH¢138,784.80 to GH¢150,843.00 for the entire country per month (GH¢1.00 = US$0.52). Since outpatient visits amount to only 46% of the prevalence, the overall cost could be at least twice as high as these estimates. On the other hand, it has been found that the use of insecticide-treated mosquito nets can reduce transmission by a quarter (25%), and households on the average spend GH¢2.48 (US$1.30) on mitigation products (aerosol sprays, mosquito coils and bed nets) [36,37]. Thus, to mitigate the impact of a 1% increase in the number of rainy days (i.e., 4620 sick individuals), a minimum public health expenditure of GH¢45,830.40 may be required. (In order to prevent 4620 individuals from getting malaria mitigation product must be supplied to four times 4620 (i.e., 18,480 individuals). The figure is therefore based on (4 × 4620) × GH¢2.48.)
Secondly, a district with a 1% higher proportion of households with no formal education, on average, has a 0.66% higher malaria incidence. Providing formal education may create awareness and improve the socio-economic conditions of households. This could invariably impact malaria prevalence in Ghana. The elasticity coefficients of rainy days and households without formal education are approximately the same, implying that provision of education could potentially mitigate the climate factor (number of rainy days) impact on malaria.
Perhaps, the most striking result is the relationship between income and malaria prevalence. Districts with a higher proportion of middle income households, on average, also had a higher incidence of malaria. The corresponding elasticity coefficient is 0.12. The possible explanation is that since the data is collected at health posts, the poor may not be adequately captured since they may rely more on herbal medication or self-medicate. It is also perhaps not farfetched to speculate that the poor may have better immune systems and for that matter do not visit health facilities frequently. On the other extreme, the rich are able to afford protection against the disease.
Finally, compared to the other nine regions in the country, the Eastern region recorded the highest malaria incidence, though the difference between it and the other regions’ incidence levels was marginal. From the coefficient, households in the region on average have a 0.16% higher prevalence than their counterparts in the other regions. Consequently, regional differences must be considered when designing public policy on malaria mitigation.
Table 6. Ordinary Least Square (OLS) and Generalized Maximum Entropy (GME) Estimation of the Impact of Rainfall on Malaria Incidence in Ghana.
VariableRegression 1
(Ordinary Least Square (OLS))
Regression 2
(OLS: Bootstrap, 20 Replication)
Generalized Maximum Entropy (GME) Estimates
CoefficientElasticityCoefficientElasticityCoefficientElasticity
Rains (# of rainy days)0.000136 (0.000065)** 0.6700.000136
(0.000058)**
0.6700.00022
(0.00006)***
1.113
No Formal Education (Proportion) 0.019026
(0.005969)***
0.6610.019026
(0.006363)***
0.6610.01999
(0.00922)***
0.702
Middle Income (Proportion)0.010984
(0.004754)**
0.1240.010984
(0.00655)*
0.1240.01015
(0.0043) ***
0.116
Eastern Region (1/0)0.012654
(0.002463)***
0.0650.012654
(0.002605)***
0.065−0.9909
(2.0045)
Constant −0.010702
(0.00680)
−0.010702
(0.006611)
−0.01934
(0.00914)***
R-Squared0.650.650.61
Note: *** significant at 1%;** significant at 5%; * significant at 10%. Standard errors in parentheses.

5. Conclusions

Malaria remains a major communicable disease in most sub-Sahara African countries, imposing heavy fiscal burdens on households and governments. Ghana typifies the situation on the sub-continent. The effectiveness of public health policy in addressing the problem depends on how well the drivers or covariates are identified. Existing studies, which are largely experimental, have found a correlation between malaria incidence and climate variables (e.g., temperature). Using time series data, our study found that, at the national level, the total number of rainy days and humidity predict malaria incidence.
Further, our cross-sectional analysis, with districts as the units of analysis, reveals that in addition to total rainy days, formal education, income levels, and regional differences account for variations in malaria incidence. The striking findings show that an equal percentage increase in formal education could mitigate the higher malaria incidence caused by an increase in rainy days. As a result, public policy must be directed at increasing literacy rates within the country. Perhaps, more surprising is the finding that middle income earners are more likely to suffer from the disease. It follows that, to reduce the prevalence of the disease, subsidized mosquito nets and insecticides should not only be made available to the poor, but to middle income households as well.
Notwithstanding the contribution of this study to public policy on malaria control in Ghana, the research has some shortcomings, especially with regards to the limited data used. Thus, the limited number of districts with weather stations and the single year’s worth of socio-economic data restricted the number of variables to be included in the regression analysis. Future research on the topic should consider using panel data or repeat the cross-sectional analysis with much more localized climate data when available. Disaggregated analysis may also generate better results, since ecological transmissions are observed at micro-levels within districts.

Acknowledgements

The authors would like to express their profound gratitude to two anonymous referees of the journal for their invaluable comments. In addition, we are very grateful to Anatu Mohammed for her invaluable comments, and CEERAC research assistant Isaac K. Ampiaw for assisting with the data compilation. Financial support from the International Development Research Centre (IDRC), Canada, for the African Adaptation Research Centre (AARC) initiative, which is a part of IDRC’s Climate Change Adaptation Research and Training Capacity for Development (CCARTCD) Program, is highly appreciated.

Conflicts of Interest

The authors declare no conflict of interest.

References and Notes

  1. World Health Organization (WHO), World Malaria Report: 2010; World Health Organization: Geneva, Switzerland, 2010.
  2. World Health Organization (WHO), World Malaria Report: 2012; World Health Organization: Geneva, Switzerland, 2012.
  3. Murray, C.; Lopez, A.; Mathers, C.; Stein, C. The Global Burden of Disease 2000 Project, Aims, Methods, and Data Sources; World Health Organization: Geneva, Switzerland, 2001. [Google Scholar]
  4. Tanser, F.C.; Sharp, B.; le Sueur, D. Potential effect of climate change on malaria transmission in Africa. The Lancet 2003, 362, 1792–1798. [Google Scholar] [CrossRef]
  5. Patz, J.A.; Olson, S.H. Climate change and health: Global to local influences on disease risk. Ann. Trop. Med. Parasitol. 2006, 100, 535–549. [Google Scholar] [CrossRef]
  6. PEACE FM Online. Available online: http://news.peacefmonline.com/health/201304/162434.php (accessed on 1 September 2013).
  7. Ghana Demographic and Health Survey 2008. Available online: http://www.measuredhs.com/pubs/pdf/FR221/FR221%5B13Aug2012%5D.pdf (accessed on 1 September 2013).
  8. World Health Organization (WHO), World Malaria Report: 2009; World Health Organization: Geneva, Switzerland, 2009; pp. 1–33.
  9. Goodman, A.C.; Coleman, P.; Mills, A. Changing the first line drug for malaria treatment: Cost-effectiveness analysis with high uncertainty inter-temporal trade-offs. Health Econ. 2001, 10, 731–749. [Google Scholar] [CrossRef]
  10. Patz, J.A.; Epstein, P.R.; Burke, T.A.; Balbus, J.M. Global climate change and emerging infectious diseases. J. Am. Med. Assoc. 1996, 275, 217–223. [Google Scholar] [CrossRef]
  11. Gething, P.W.; Smith, D.L.; Patil, A.P.; Tatem, A.J.; Snow, R.W.; Hay, S.I. Climate change and the global malaria recession. Nature 2010, 465, 342–345. [Google Scholar] [CrossRef]
  12. Epstein, P.R.; Ferber, D. Changing Planet, Changing Health—How the Climate Crisis Threatens Our Health and What We Can Do about It; University of California Press: Berkeley, CA, USA, 2011. [Google Scholar]
  13. Ahern, M.J.; Kovats, R.S.; Wilkinson, P.; Few, R.; Matthies, F. Global health impacts of floods: Epidemiological evidence. Epidemiol. Rev. 2005, 27, 36–45. [Google Scholar] [CrossRef]
  14. Zhou, G.; Noboru, M.; Githeko, A.; Yan, G. Association between climate variability and malaria epidemic in the east African highlands. Proc. Natl. Acad. Sci. USA 2003, 101, 2375–2380. [Google Scholar]
  15. Ebi, K.; Hartman, J.; Chan, N.; McConnell, J.; Schlesinger, M.; Weyany, J. Climate suitability for stable malaria transmission in Zimbabwe under different climate change scenarios. Clim. Chang. 2005, 73, 375–393. [Google Scholar] [CrossRef]
  16. Thomson, M.C.; Mason, S.J.; Phindela, T.; Connor, S.J. Use of Rainfall and sea surface temperature monitoring for malaria early warning in Botswana. Am. J. Trop. Med. Hyg. 2005, 73, 214–221. [Google Scholar]
  17. Ndiaye, O.; le Hesran, J.-Y.; Etard, J.-F.; Diallo, A.; Simondon, F.; Ward, M.; Robert, V. Variations Climatiques Et Mortalité Attribuée Au Paludisme Dans La Zone De Niakhar, Sénégal De 1984 À 1996. Santé 2001, 11, 25–33. (in French). [Google Scholar]
  18. Jaenisch, T.; Patz, J. Assessment of association between climate and infectious diseases. Global Change Hum. Health 2002, 3, 67–72. [Google Scholar] [CrossRef]
  19. IPCC (Intergovernmental Panel on Climate Change), Climate Change 2007: Impacts, Adaptation and Vulnerability. In Contribution of Working Group II to the Fourth Assessment Report of the Intergovernmental Panel on Climate Change; Parry, M.L.; Canziani, O.F.; Palutikof, J.P.; van der Linden, P.J.; Hanson, C.E. (Eds.) Cambridge University Press: Cambridge, UK, 2007; p. 976.
  20. IPCC (Intergovernmental Panel on Climate Change), Climate Change 2007: The Physical Science Basis. In Contribution of Working Group I to the Fourth Assessment Report of the Intergovernmental Panel on Climate Change; Solomon, S.; Qin, D.; Manning, M.; Chen, Z.; Marquis, M.; Averyt, K.B.; Tignor, M.; Miller, H.L. (Eds.) Cambridge University Press: Cambridge, UK, 2007.
  21. Martens, W. Health Impacts of Climate Change and Ozone Depletion: An Eco-Epidemiological Modelling Approach. Ph.D. Thesis, Ph.D. Thesis, Maastricht, The Netherlands, 1997. [Google Scholar]
  22. Egbendewe-Mondzozo, A.K.; Musumba, M.; McCarl, B.A.; Wu, X. Climate Change and Vector- borne Diseases: An Economic Impact Analysis of Malaria in Africa. Int. J. Environ. Res. Public Health. 2011, 8, 913–930. [Google Scholar] [CrossRef]
  23. Bomblies, A.; Eltahir, E.A.B. Assessment of impact of climate shifts on malaria. EcoHealth 2009, 6, 426–437. [Google Scholar] [CrossRef]
  24. Parham, P.; Michael, E. Modeling Climate Change and Malaria Transmission. Adv. Exp. Med. Biol. 2010, 673, 184–199. [Google Scholar] [CrossRef]
  25. Dadzie, S.K.; Brenyah, R.; Appawu, M.A. Role of species composition in malaria transmission by the Anopheles funestus group (Diptera: Culicidae) in Ghana. J. Vector. Ecol. 2013, 38, 105–110. [Google Scholar] [CrossRef]
  26. Reddy, M.R.; Overgaard, H.J.; Abaga, S.; Reddy, V.P.; Caccone, A.; Kiszewski, A.E.; Slotman, M.A. Outdoor host seeking behaviour of Anopheles gambiae mosquitoes following initiation of malaria vector control on Bioko Island, Equatorial Guinea. Available online: http://www.biomedcentral.com/content/pdf/1475-2875-10-184.pdf (accessed on 1 September 2013).
  27. President’s Malaria Initiative. Malaria Operational Plan FY 2013. Available online: http://pmi.gov/countries/mops/fy13/ghana_mop_fy13.pdf (accessed on 1 September 2013).
  28. United Nations Children’s Fund (UNICEF), UNICEF Ghana Fact Sheet Malaria; UNICEF: Accra, Ghana, 2007.
  29. Keba Africa. Available online: http://www.kebaafrica.org/malaria-prevention-2/ (accessed on 1 September 2013).
  30. Ministry of Health (MoH), Anti-Malaria: Drug Policy for Ghana; MoH: Accra, Ghana, 2009.
  31. President’s Malaria Initiative. Malaria operational plan—FY 2012 (5 years). Available online: http://pmi.gov/countries/mops/fy12/ghana_mop_fy12.pdf (accessed on 1 September 2013).
  32. Yilma, Z.; van Kempen, L.; de Hoop, T. Perverse ‘net’ effect? Health insurance and ex-ante moral hazard in Ghana. Soc. Sci. Med. 2012, 75, 138–147. [Google Scholar] [CrossRef]
  33. Baffoe, A.; Gbeve, K.; Ollenu, A.O. Home Management of Malaria, Acute Respiratory Infection & Diarrhoea in Ghana: Implementation Guidelines; Ministry of Health, Ghana Health Services: Accra, Ghana, 2009. [Google Scholar]
  34. Granger, C.W.J. Investigating Causal Relations by Econometric Models and Cross-spectral Methods. Econometrica 1969, 37, 424–438. [Google Scholar] [CrossRef]
  35. The twenty weather stations are located at Abetifi, Accra, Ada, Akatsi, Akim-Oda, Axim, Akuse, Bole, Ho, Kete-Krachi, Koforidua, Kumasi, Navrongo, Sefwi-Bekwai, Saltpond, Sunyani, Takoradi, Tamale, Tema, Wa, Wenchi, and Yendi. As of 2008, Ghana had 170 districts
  36. Asante, F.A.; Asenso-Okyere, K. Economic Burden of Malaria in Ghana, A Technical Report for World Health Organization (WHO). 2003; unpublished work.
  37. Mba, C.J.; Aboh, I.K. Prevalence and Management of Malaria in Ghana: A Case Study of Volta Region. Afr. Popul. Stud. 2007, 22, 137–171. [Google Scholar]

Appendix

Table A1. Unit Root Test of Malaria Incidence and Climate Variables (Humidity, Temperature, Rainy Days, Wind Speed).
VariableDistrictt-valuep-valuelags
Malaria IncidenceAbetifi−3.5210.0372**0
Accra−16.4140.0000***3
Ada−7.2770.0000***3
Akatsi−3.8200.0156**2
Akuse−3.7660.0184**1
Axim−3.2310.0784*0
Bole−3.4440.0458**0
Ho−7.7540.0000***3
Koforidua−3.3830.0537*3
Krachi−6.4120.0000***3
Kumasi−3.9030.0120**3
Navarongodid not pass
Oda−15.5900.0000***3
Saltpond−3.6090.0291**3
Sbekwai−3.223 0.0799***2
Sunyani−3.2670.0719***3
Takoradi−15.943 0.0000***3
Tamale−3.964 0.0099***3
Tema−6.9850.0000***3
Wa−3.2440.0759*3
Wenchi−4.9910.0002***3
Yendi−4.1760.0049***3
HumidityAbetifi−3.8340.0149**3
Accra−4.3470.0027***3
Ada−3.3900.0528*1
Akatsi−4.3660.0025***3
Akuse−4.1230.0058***3
Axim−3.738 0.0200**3
Bole−5.4000.0000***3
Ho−4.9970.0002***3
Koforidua−4.607 0.0010***3
Krachi−4.6700.0008***3
Kumasi−4.0820.0067***3
Navarongo−6.2750.0000***3
Oda−9.3090.0000***3
Saltpond−4.742 0.0006***3
Sbekwai−6.2240.0000***3
Sunyani−4.241 0.0039***3
Takoradi−7.0030.0000***3
Tamale−4.4570.0018***3
Tema−7.4750.0000***3
Wa−5.731 0.0000***3
Wenchi−3.961 0.0100***3
Yendi−4.2990.0032***3
TemperatureAbetifi−5.4370.0000***3
Accra−5.1470.0001***3
Ada−4.025 0.0081***3
Akatsi−5.3530.0000***3
Akuse−4.3730.0024***3
Axim−4.5080.0015***3
Bole−3.6030.0296**3
Ho−6.7420.0000***3
Koforidua−3.5800.0316**3
Krachi−3.9840.0093***3
Kumasi−4.8710.0004***3
Navarongo−3.952 0.0103**3
Oda−3.7250.0208**3
Saltpond−4.414 0.0021***3
Sbekwai−9.6700.0000***3
Sunyani−5.9980.0000***3
Takoradi−6.0320.0000***3
Tamale−4.3660.0025***3
Tema−3.9210.0113**3
Wa−4.1950.0046***3
Wenchi−4.928 0.0003***3
Yendi−5.052 0.0002***3
Rainy DaysAbetifi−3.580 0.0316**3
Accra−4.3490.0026***3
Ada−3.5600.0334**3
Akatsi−4.4030.0022***3
Akuse−4.4470.0018***3
Axim−3.503 0.0391**3
Bole−3.6530.0256**3
Ho−3.5830.0313**3
Koforidua−4.399 0.0022***3
Krachi−5.168 0.0001***3
Kumasi−3.4440.0458**3
Navarongo−4.793 0.0005***3
Oda−3.5810.0315**3
Saltpond−4.9000.0003***3
Sbekwai−3.643 0.0264**3
Sunyani−3.4370.0466**3
Takoradi−3.9100.0117**3
Tamale−4.5170.0014***3
Tema−3.717 0.0213**3
Wa−3.9620.0099***3
Wenchi−4.376 0.0024***3
Yendi−5.1710.0001***3
Wind SpeedAbetifi−3.352 0.0581*3
Accra−4.396 0.0022***3
Ada−4.0090.0085***3
Akatsi−4.019 0.0083***3
Akuse−4.059 0.0072***3
Axim−3.771 0.0181**3
Bole−4.813 0.0004***3
Hono observations
Koforidua−3.504 0.0390***3
Krachidid not pass
Kumasi−5.139 0.0001***3
Navarongodid not pass
Oda−9.0220.0000***3
Saltpond−3.906 0.0119**3
Sbekwai−4.504 0.0015***3
Sunyani−5.3910.0000***3
Takoradino observations
Tamale−4.670 0.0008***3
Tema−3.7700.0181**3
Wano observations
Wenchi−3.801 0.0165**3
Yendi−3.6170.0285**3
Note: *** significant at 1%;** significant at 5%; * significant at 10%.
Table A2. Unidirectional Causality between Malaria Prevalence and Climate Variables in Ghana (January 2008–December 2011).
DistrictHumidityTemperatureRainy DaysWind speed
AbetifiNoNoNoNo
AccraNoYes (***)Yes (***)No
AdaYes(**)Yes (***)NoYes (***)
AkatsiNoNoYes(**)No
AkuseYes (***)Yes(**)Yes (***)No
AximYes (***)NoYes (***)No
BoleNoNoNoNo
HoYes (***)NoYes(**)No
KoforiduaYes (***)NoNoNo
KrachiYes (***)NoNoNo
KumasiNoNoNoNo
NavarongoNoNoYes (***)No
OdaNoNoNoNo
SaltpondNoYes (***)NoNo
SbekwaiNoNoNoNo
SunyaniNoNoNoNo
TakoradiYes (***)NoNoNo
TamaleYes (***)Yes (***)Yes (***)Yes (***)
TemaNoYes (***)NoNo
WaYes (***)NoYes (***)No
WenchiYes (***)NoNoYes (***)
YendiYes (***)Yes (***)Yes (***)Yes (**)
Note: *** significant at 1%;** significant at 5%; * significant at 10%.

