1. Introduction
Under business as usual scenarios, the global energy consumption is estimated to rise from 77 million BTU (81.2 GJ) per capita in 2012 to 91 million BTU (96 GJ) per capita in 2035, resulting in 40% increase in global energy use in the next two decades [
1]. In addition to the potential technological, socioeconomic, political, and geographic challenges for generation, transmission, and supply of energy, substantial quantities of environmental resources required for producing energy is becoming a major concern for policy makers. Currently, human activities ask for natural resources, such as freshwater, forests, fisheries and other ecosystems, more than any other time in history [
2]. As a result of such activities, ecological footprint exceeded biocapacity by 44% in 2006 and is estimated to exceed the biocapacity by 100% in 2030 [
3], meaning that the available environmental resources are approaching the breaking point [
4], which can lead to scarcity of such resources with reasonable quality.
With the experience of global warming as an unintended consequence of poorly developed energy production policies, reducing greenhouse gas (GHG) emissions has become an important priority in energy policy development, shifting the focus towards low-carbon energy production through alternative sources. The political and economic importance of energy security and independence has been another incentive for investment in alternative sources of energy worldwide. While most renewable energy sources can help with reducing GHGs, they also have some disadvantages [
5,
6,
7,
8,
9]. For example, some renewable energy sources require a considerable amount of valuable natural resources such as water and land. Hence, the potential impacts of energy generation on the environment and natural resources should be taken into account in developing global, national, and sub-country level energy policies and regulations to protect the already stressed ecosystem components more wisely while producing sufficient energy.
Water is an essential element in many human-driven processes, including energy generation. The agriculture sector currently has the highest water demand at the global scale, followed by the industry-energy sector that is responsible for 20% of the total water withdrawals [
10]. In the U.S., the energy sector is expected to be the fastest growing water consuming sector, being responsible for 85% of the increase in domestic water consumption in the 2005–2030 period [
11]. Governmental ethanol subsidies and mandates in the U.S. lead to considerable use of biofuels that have 70–400 times higher water footprint compared to traditional energy sources [
12]. In some regions, such as California, expanding the energy production from bioenergy requires 1000 times larger water than gasoline [
13]. Hydrofracking, as another popular energy supply alternative, has been recognized as a high water-intensive series of actions that impact the surface water and ground water in both site creation and drilling processes [
14]. Regular oil and gas production processes also require water for drilling and extraction of resources [
15]. Large-scale hydroelectric power as one of the oldest renewable energy sources has a relatively high water footprint [
12], mostly pertaining to the evaporation from large reservoir areas [
16]. The amount of water that is evaporated on a daily basis from hydroelectric reservoirs across the U.S. is enough for meeting demands of 50 million people [
17]. In coal and nuclear power plants, a large amount of water is circulated for cooling purposes, part of which goes back to the energy production system for reuse [
18] and the rest is evaporated or discharged into the original source, causing a range of environmental issues such as fish mortality and algae growth. Nuclear, coal, and natural gas power plants are the fastest growing freshwater users in the U.S., being responsible for more than half of the total freshwater withdrawals from different sources [
17]. Concentrating Solar Power (CSP) also requires a considerable amount of water to spin steam turbines [
19]. Other energy sources or energy production processes also require different levels of water supply. For instance, wind power and solar photovoltaic are generally known to be very environmentally friendly with no water footprint. However, the amount of water required in the manufacturing process may become considerable with large-scale implementation of these energy technologies, especially in places where technology is still immature or inefficient. In addition, these technologies require coal, nuclear, or natural gas backup to guarantee the sufficient supply of energy when wind or sun is not available [
20,
21], leading to more water use for cooling purposes.
Water is a global resource, distributed unevenly throughout the planet. This makes effective management of this valuable resource very complex at the national scale, especially with consideration of the virtually imported and exported water through global economic trades [
22]. International trade of energy in different forms, such as oil, natural gas, coal, and biofuels, as well as the exchange of energy production technologies, such as wind turbines and solar panels, exert pressure on global water resources. Quantifying the amount of water that goes into the energy sector at a global scale can help us better understand the risks associated with developing myopic energy management plans that ignore the effects of energy production on valuable natural resources. Water footprint is a reliable measure for this purpose and represents the amount of freshwater used to produce one unit of energy from a given energy source [
22]. The components of water a footprint are: blue water footprint, which is the volume of surface and ground water consumed in the energy production process; green water footprint, which represents the volume of rainwater consumed during the production process (related to evapotranspiration and the rainwater incorporated in crop or wood); and gray water footprint, which represents the amount of freshwater required to dilute the pollutants such that the quality of water remains above given water quality standards. In fact, the water footprint index can take into account the direct and indirect water consumption in the energy production lifecycle. Past studies have acknowledged the necessity for calculating the water impact of different energy technologies. Gleick [
23] calculated the water consumption of different forms of energy, and his findings were the basis for many recent studies on the water footprint of energy. Jacobson estimated the impacts of different renewable and nonrenewable energy technologies, including their water footprint, based on which a multi-criteria decision making model was created to evaluate the efficiency of different energy sources [
24]. Gerbens-Leenes
et al. [
12] calculated the water footprint of different types of biomass and concluded that large-scale production of biomass requires extensive amounts of water, leading to unintended competition between “water for energy” and “water for food”.
Considering the water footprint of various energy sources, Cooper and Sehlke [
25] suggested that developing a sustainable energy policy is not feasible unless the water footprint and cost of energy production are considered, in addition to carbon footprint. Some studies have been focusing on the water use of the energy sector in different regions across the globe. For instance, Wilson
et al. [
17] estimated the water footprint of electricity sector in the U.S. and concluded that an average kWh of electricity from different sources in the U.S. in 2009, required almost 42 gallons of water, more than 95 percent of which was gray water footprint, associated with water quality effects of electricity production. Macknick
et al. [
26] reviewed the existing literature on water consumption and withdrawal for the U.S. electricity generating technologies and concluded that solar thermal and coal have the highest water consumption while non-thermal renewables, such as wind and solar photovoltaic, have the lowest water consumption. Meldrum
et al. [
27] reviewed and classified the existing literature of electricity’s water withdrawal and water consumption for different energy technologies and concluded that the water used for cooling purposes dominated the life cycle water use of electricity generation. They also reported solar photovoltaic and wind as the lowest water consuming energy technologies, and thermoelectricity as the highest water consuming type of energy. Averyt
et al. [
28] evaluated the water withdrawal and consumptive use of power plants in the U.S. (including ocean and fresh water) and observed a substantial difference between the obtained results and EIA estimations, mostly due to imperfect assumptions and misreported information regarding power plants.
Estimation of future water demands of the global energy sector is associated with numerous uncertainties and limitations and is contingent upon many parameters, including, but not limited to future international and national regulations, global warming, energy security issues, and technological and economic development of nations. Even energy scenarios from different information sources yield different energy mix projections due to different assumptions, projection scopes, and purposes. Hence, calculation of the water that goes to and is affected by the energy sector depends on what energy supply scenario and water calculation assumptions are considered. Previous research does not provide a clear, unique, and systematic method for calculation of the water resources affected by energy production processes, leading to major differences in water use estimations. For instance, according to the World Energy Council (WEC), the water consumption of energy sector rises from 1775 BCM in 2005 to 2012 BCM in 2035 (less than 15% increase) [
29]. However, according to the International Energy Agency (IEA), 66 BCM of water was consumed by energy sector in 2012, with the expectation that this number changes to 135 BCM in 2035 (more than 100% increase) [
30]. While each source makes different projections of future energy mixes, the main reason for such a dramatic estimation difference is the various definitions of water consumption as well as application of inconsistent water impact measurement methods. As an example of estimation inconsistencies, IEA claims that the amount of water that goes to the biofuels sector is minor, while WEC estimates that 90% of energy related water consumption is related to biofuel production. Therefore, there is a need for a comprehensive method for systematic estimation of the water that is used and affected during the energy production life-cycle. This paper uses water footprint [
22], as a reliable indicator of the total direct and indirect water use of energy to develop a robust understanding of the water-energy nexus. Five energy scenarios developed by the International Energy Outlook of the U.S. Energy Information Administration (EIA) as well as the previously estimated water footprint of different energy technologies are used for for estimating the total global water footprint of energy production processes over the 2012–2035 period.
2. Methods and Data
The water footprint of global energy is estimated for 10 categories of energy sources including conventional and unconventional liquids, biofuels, natural gas, coal, nuclear, hydroelectric power, solar, wind, geothermal, and other renewable energy sources under five EIA energy mix scenarios for the 2005–2035 period. These scenarios generally project energy consumption based on the conditions of current laws and regulations, as well as the effects of oil prices on the global energy market [
1]. The reference scenario (REF) represents a “business-as-usual” assumption for oil prices, demographic trends, and technology. It assumes a baseline world economic growth of 3.5% per year from 2008 to 2015 and 3.3% from 2015 to 2035 [
1]. The high oil price (HOP) and low oil price (LOP) scenarios consider the impacts of high and low non-OECD demand conditions. The traditional high oil price (THOP) and low oil price (TLOP) scenarios assume the same economic growth as the reference scenario but account for the impact of alternative supply conditions [
1]. The key assumptions for these scenarios are summarized in
Table 1.
Table 1.
Summary of EIA energy scenarios.
Table 1.
Summary of EIA energy scenarios.
| Scenario | Oil price per barrel in 2035 (2009, $) | Assumptions |
|---|
| REF | $125 | OPEC’s oil production remains about 42% of world’s total liquid fuel production. |
| HOP | $200 | Higher oil prices result from high demand for liquid fuels in non-OECD countries due to high economic growth. |
| LOP | $50 | Lower oil prices result from low demand for liquid fuels in non-OECD countries due to low economic growth. |
| THOP | $200 | OPEC countries reduce their production from the current rate, resulting in higher oil prices. |
| TLOP | $50 | OPEC countries increase their production from the current rate, resulting in lower oil prices. |
The water footprints of different energy sources are presented in
Table 2. Some of the values in
Table 2 are given as intervals due to the technological and other regional conditions, resulting in different estimations of water footprints. For instance, the solar energy might be produced using different technologies (solar thermal and solar photovoltaic) with different water footprints. Moreover, the efficiency of different production can be affected by local conditions (e.g., solar radiation), resulting in some estimation uncertainties.
The EIA scenarios do not provide a detailed estimation of the shares of different energy sources from total energy production. Hence, a set of assumptions is required to calculate the shares of the energy alternatives from total energy production, as follows:
“Conventional liquids” include crude oil and lease condensate, natural gas plant liquids, and refinery gain; “Unconventional liquids” include oil sands, extra-heavy oil, coal-to-liquids, gas-to-liquids, and shale oil (not including biofuels);
“Biofuels” include different types of bioenergy (excluding ethanol) from biomass (e.g., woodchip and miscanthus);
“Solar energy” includes solar thermal and solar photovoltaic technologies;
“Wind energy” includes wind onshore and offshore technologies;
“Hydroelectric” energy is produced by large hydropower systems associated with large reservoirs only. While small and run-of-the-river hydropower systems have smaller water footprint, they have been excluded from the study due to lack of reliable information on their water footprints;
“Other renewables” include wave and tidal, municipal waste, and ethanol. We assumed the water footprint of “other renewables” is equal to ethanol’s water footprint as it is more prevalent than others;
The energy production values are assumed to be equal to the energy consumption values;
If neither production, nor consumption of energy is projected for a given renewable energy, the generating capacity share for that type of energy is considered to be equal to energy production/consumption share of that energy.
Table 2.
Water footprint of different energy sources.
Table 2.
Water footprint of different energy sources.
| Energy Source | Water Footprint (m3/GJ) |
|---|
| Conventional/Unconventional Liquids | 4.29–8.6 [31] |
| Biofuels | 37–42 [12] |
| Natural Gas | 0.1 [23] |
| Coal | 0.15–0.58 [31] |
| Nuclear | 0.42–0.76 [24] |
| Hydroelectric | 22 a [12] |
| Solar | 0.037–0.78 [24] |
| Wind | 0.001 [24] |
| Geothermal | 0.005 [24] |
| Other Renewables | 78 [12] |
To determine the water footprint of conventional liquids, unconventional liquids, and biofuels, the world’s total liquids production values given by the EIA are used to calculate the shares of these energy sources from the future energy supply portfolios [
1]. In 2005, the world’s total liquid production was 84.6 million barrels per day (mbpd), while the world’s conventional liquids production was 82.1 mbpd (97% of conventional liquids production) at the same time. To find the amount of conventional liquids consumed (166 quadrillion BTU or 175 exajoule), the percentage of conventional liquids production was multiplied by the total liquids energy consumption (171 quadrillion BTU or 180 exajoule). The values for unconventional liquids (including biofuels) and biofuels were also found to be 2.6 and 0.7 mbpd, respectively.
The energy production from hydroelectric power, solar energy, wind energy, geothermal, and other renewable energy sources are not explicitly listed in EIA tables and were calculated similar to the liquid energy sources. Due to absence of the production or consumption values of renewable energies, generation capacities were assumed to represent the shares of these resources. Generation capacities of hydropower, solar energy, wind energy, geothermal, and other renewables are 773, 4, 60, 8, and 145 GW, respectively. The percent installed generation capacity for each renewable source was found by dividing the installed generation capacity of that renewable by the total installed generation capacity of all renewables. The total renewable energy consumption value (45 quadrillion BTU or 48 exajoule) was multiplied by the percent installed generation capacity of the aforementioned energy sources to calculate the energy production from each source. The values of energy consumption from natural gas, coal, and nuclear energy were explicitly listed in the EIA tables, so no additional calculation was needed. Once the shares of different energy sources from the world’s total energy production were calculated for different scenarios, the water footprint of energy mixes for EIA scenarios were estimated using
Table 2 to examine how energy policies are evolving over time in terms of water consumption.
3. Results and Discussion
The main oil supply forecast classes,
i.e., peak forecasts and quasi-linear forecasts identified by [
32], have been the basis for development of low and high oil production forecasts [
33]. Both forecast types indicate an increasing share for renewable energy sources in the future, but comparing to high oil production forecasts, low oil production scenarios assume a larger share of energy coming from renewables. According to Sorrell
et al. [
33], EIA forecasts fall into the high oil production category in which the global oil production will continue to rise or will plateau around year 2030.
Table 3 shows the percent increase in total energy production from 2012 to 2035 based on EIA estimates [
1].
Table 3.
Percent increase in energy production for different energy sources from 2012 to 2035.
Table 3.
Percent increase in energy production for different energy sources from 2012 to 2035.
| Energy Source | % increase from 2012 to 2035 |
|---|
| REF | HOP | LOP | THOP | TLOP |
|---|
| Conventional Liquids | 17 | 23 | 21 | 5 | 42 |
| Biofuels | 114 | 210 | 75 | 209 | 75 |
| Unconventional Liquids | 180 | 217 | 128 | 216 | 129 |
| Natural Gas | 45 | 57 | 31 | 46 | 42 |
| Coal | 38 | 68 | 15 | 38 | 33 |
| Nuclear | 71 | 72 | 70 | 72 | 70 |
| Hydroelectric | 64 | 77 | 51 | 67 | 64 |
| Solar | 212 | 231 | 198 | 220 | 212 |
| Wind | 154 | 167 | 142 | 157 | 154 |
| Geothermal | 124 | 143 | 109 | 127 | 115 |
| Other Renewables | 44 | 55 | 38 | 50 | 44 |
According to
Table 3, energy production from all energy sources experiences a significant increase, in response to the considerable energy demand increase in the 2012–2035 period. Energy production from all sources except oil has the highest and lowest increase rates under high and low oil price scenarios, respectively. Although the energy production from most of the energy sources increases dramatically, the shares of different energy sources from the world’s total energy production do not change exceedingly in the 2012–2035 period, due to increase in total energy production.
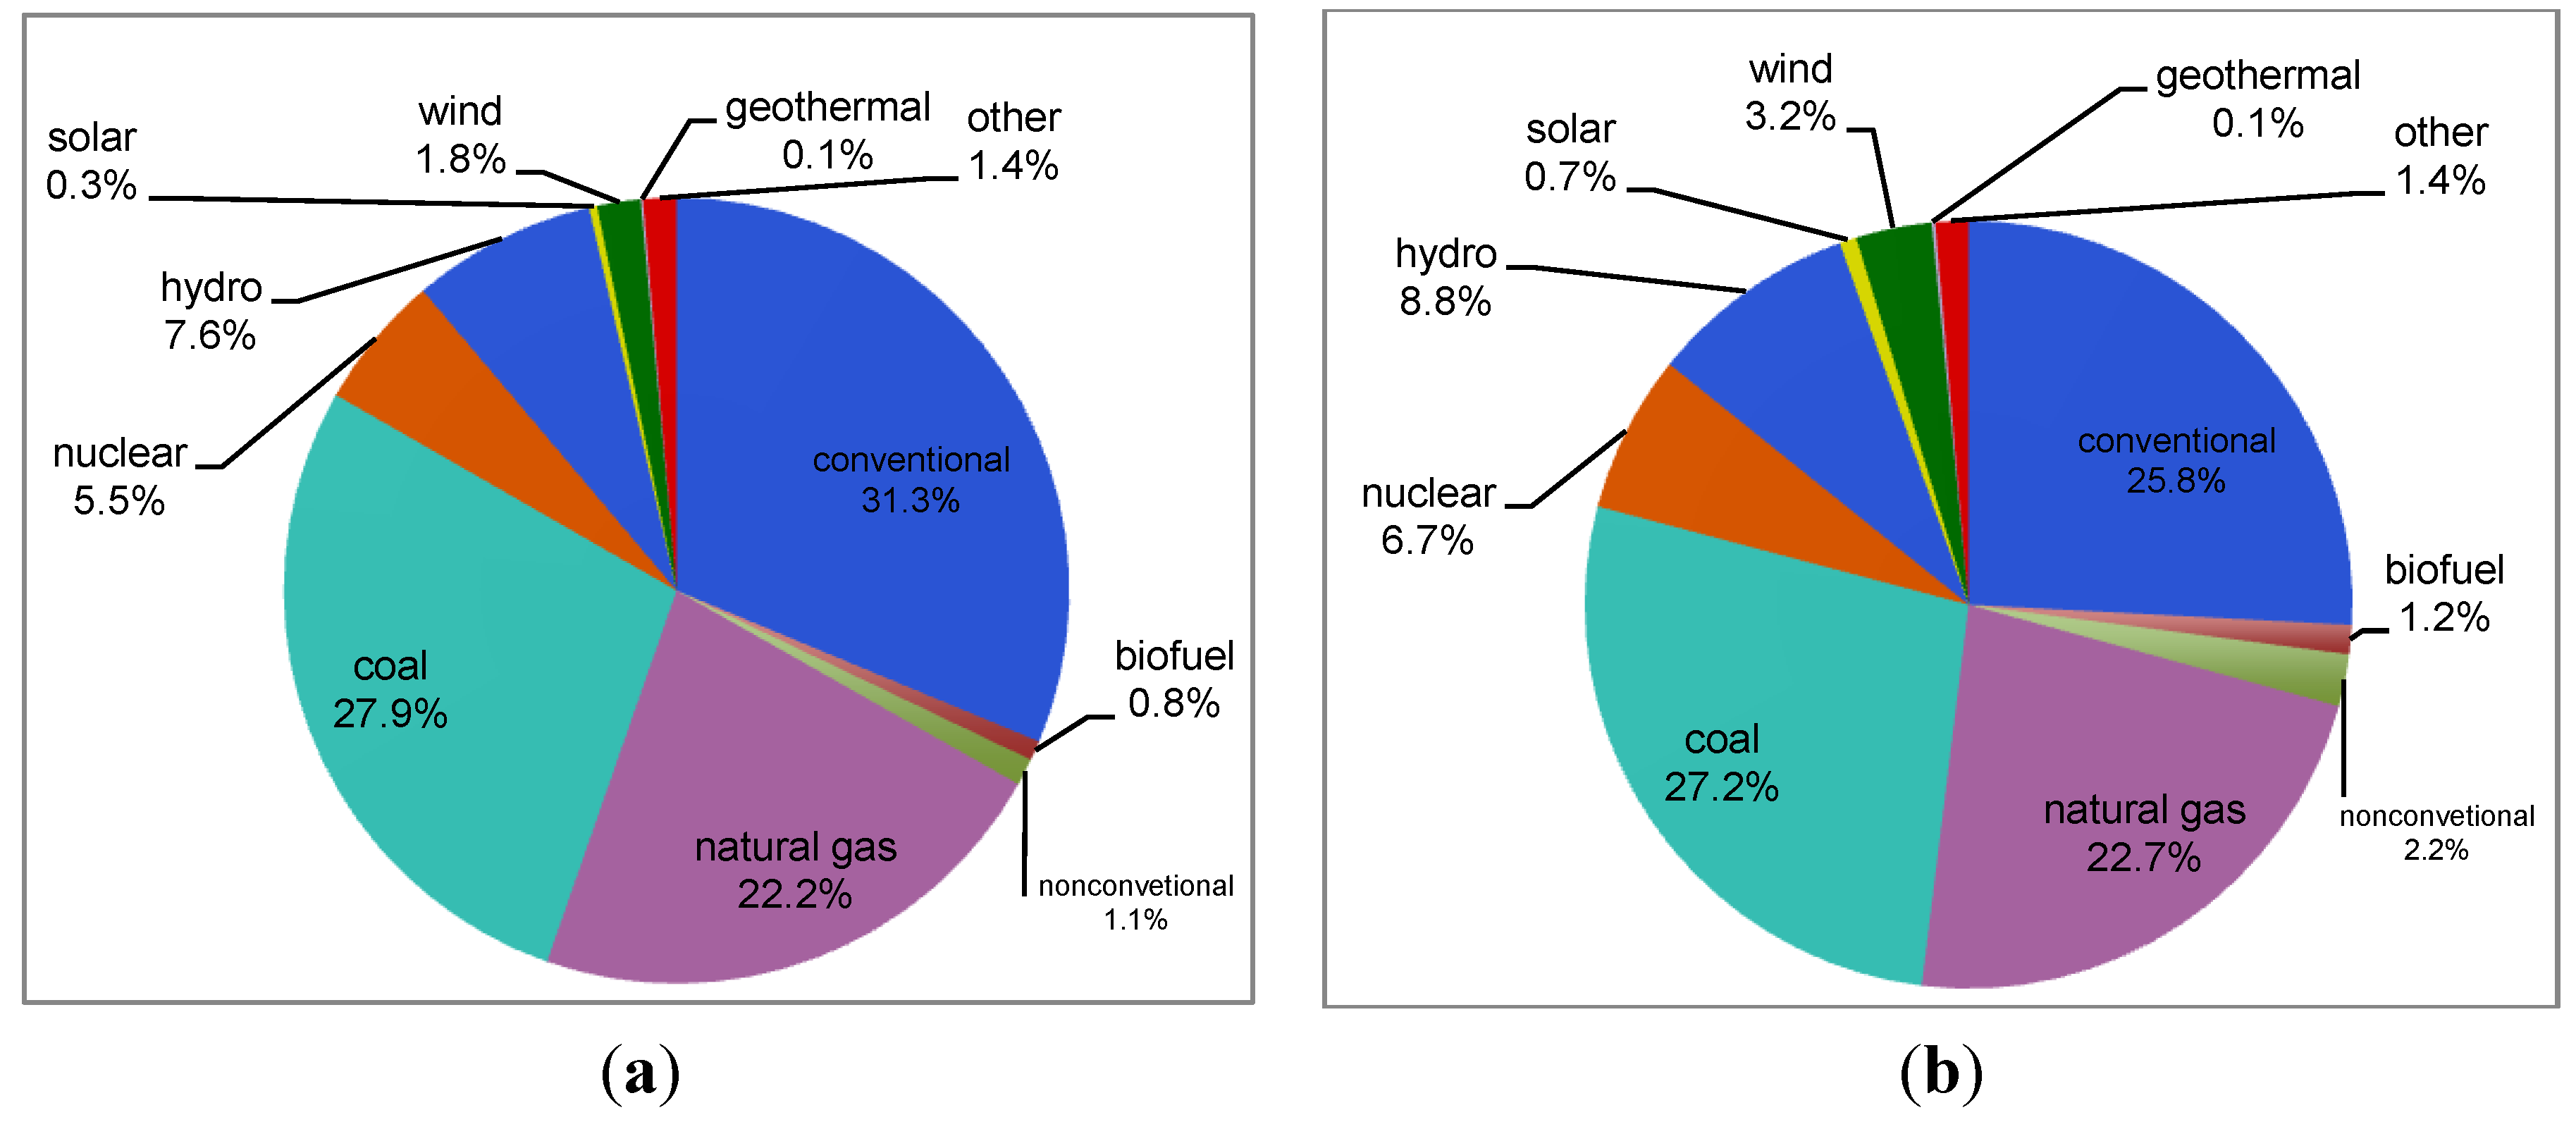
Figure 1 illustrates the estimated shares of energy sources from total energy production in 2012 and 2035 based on the reference scenario. In addition,
Table 4 shows the estimated shares of different energy sources from the world’s total energy production in 2012 and 2035 based on other energy scenarios (HOP, LOP, THOP, TLOP). Although the shares of energy sources under different scenarios do not vary significantly, as illustrated in
Table 3, they have considerably different production magnitudes.
Figure 1.
Shares of energy sources in world’s total energy supply based on the EIA’s reference scenario (a) 2012; (b) 2035.
Figure 1.
Shares of energy sources in world’s total energy supply based on the EIA’s reference scenario (a) 2012; (b) 2035.
Table 4.
World’s energy supply portfolio based on different EIA scenarios.
Table 4.
World’s energy supply portfolio based on different EIA scenarios.
| Energy Source | HOP (%) | LOP (%) | THOP (%) | TLOP (%) |
|---|
| 2012 | 2035 | 2012 | 2035 | 2012 | 2035 | 2012 | 2035 |
|---|
| Conventional | 31.0 | 24.2 | 31.3 | 28.8 | 31.1 | 23.3 | 31.3 | 30.4 |
| Biofuels | 0.7 | 1.5 | 0.7 | 1.0 | 0.7 | 1.6 | 0.7 | 0.9 |
| Unconventional | 1.5 | 3.1 | 1.2 | 2.1 | 1.5 | 3.4 | 1.2 | 1.8 |
| Natural Gas | 22.1 | 21.9 | 22.2 | 22.2 | 22.1 | 22.9 | 22.2 | 21.4 |
| Coal | 27.9 | 29.6 | 28.0 | 24.5 | 27.9 | 27.4 | 27.9 | 25.4 |
| Nuclear | 5.5 | 6.0 | 5.5 | 7.2 | 5.5 | 6.7 | 5.5 | 6.4 |
| Hydroelectric | 7.6 | 8.5 | 7.6 | 8.7 | 7.6 | 9.0 | 7.6 | 8.5 |
| Solar | 0.3 | 0.7 | 0.3 | 0.7 | 0.3 | 0.7 | 0.3 | 0.7 |
| Wind | 1.8 | 3.0 | 1.8 | 3.3 | 1.8 | 3.3 | 1.8 | 3.1 |
| Geothermal | 0.1 | 0.1 | 0.1 | 0.2 | 0.1 | 0.2 | 0.1 | 0.1 |
| Other Renewables | 1.4 | 1.3 | 1.4 | 1.4 | 1.4 | 1.5 | 1.4 | 1.3 |
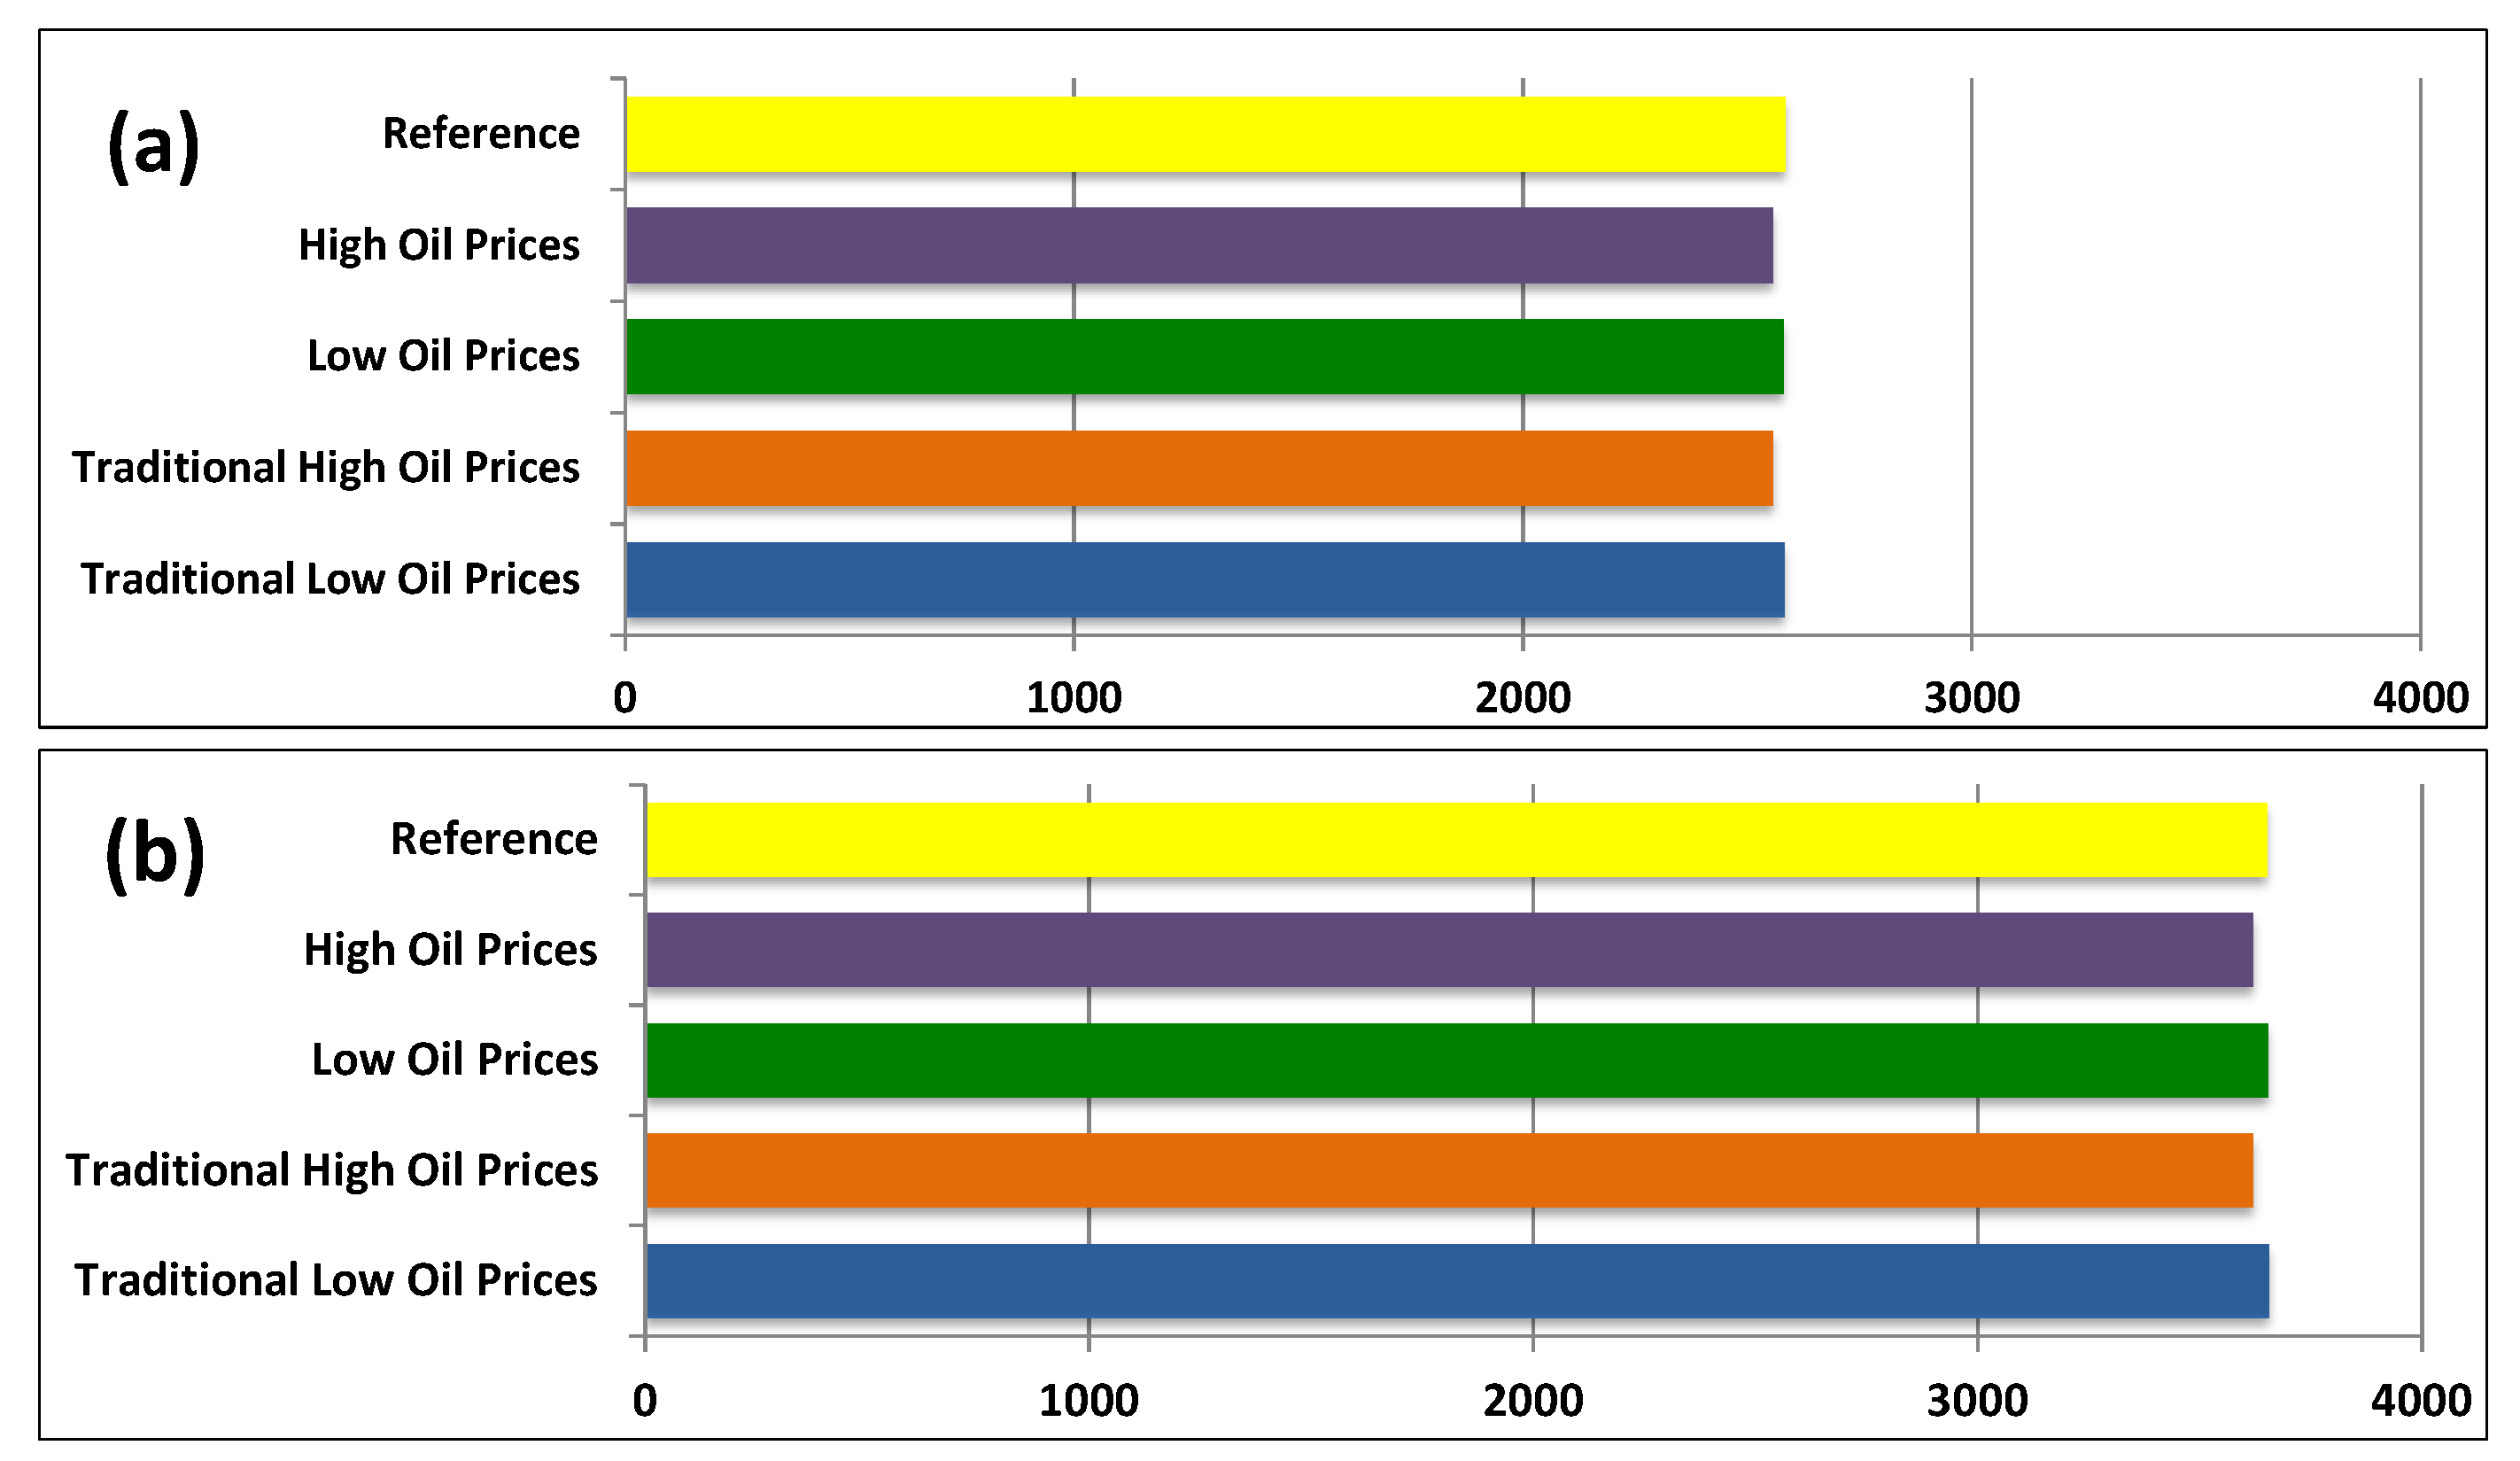
Figure 2 shows the global energy sector’s water footprint in 2012.
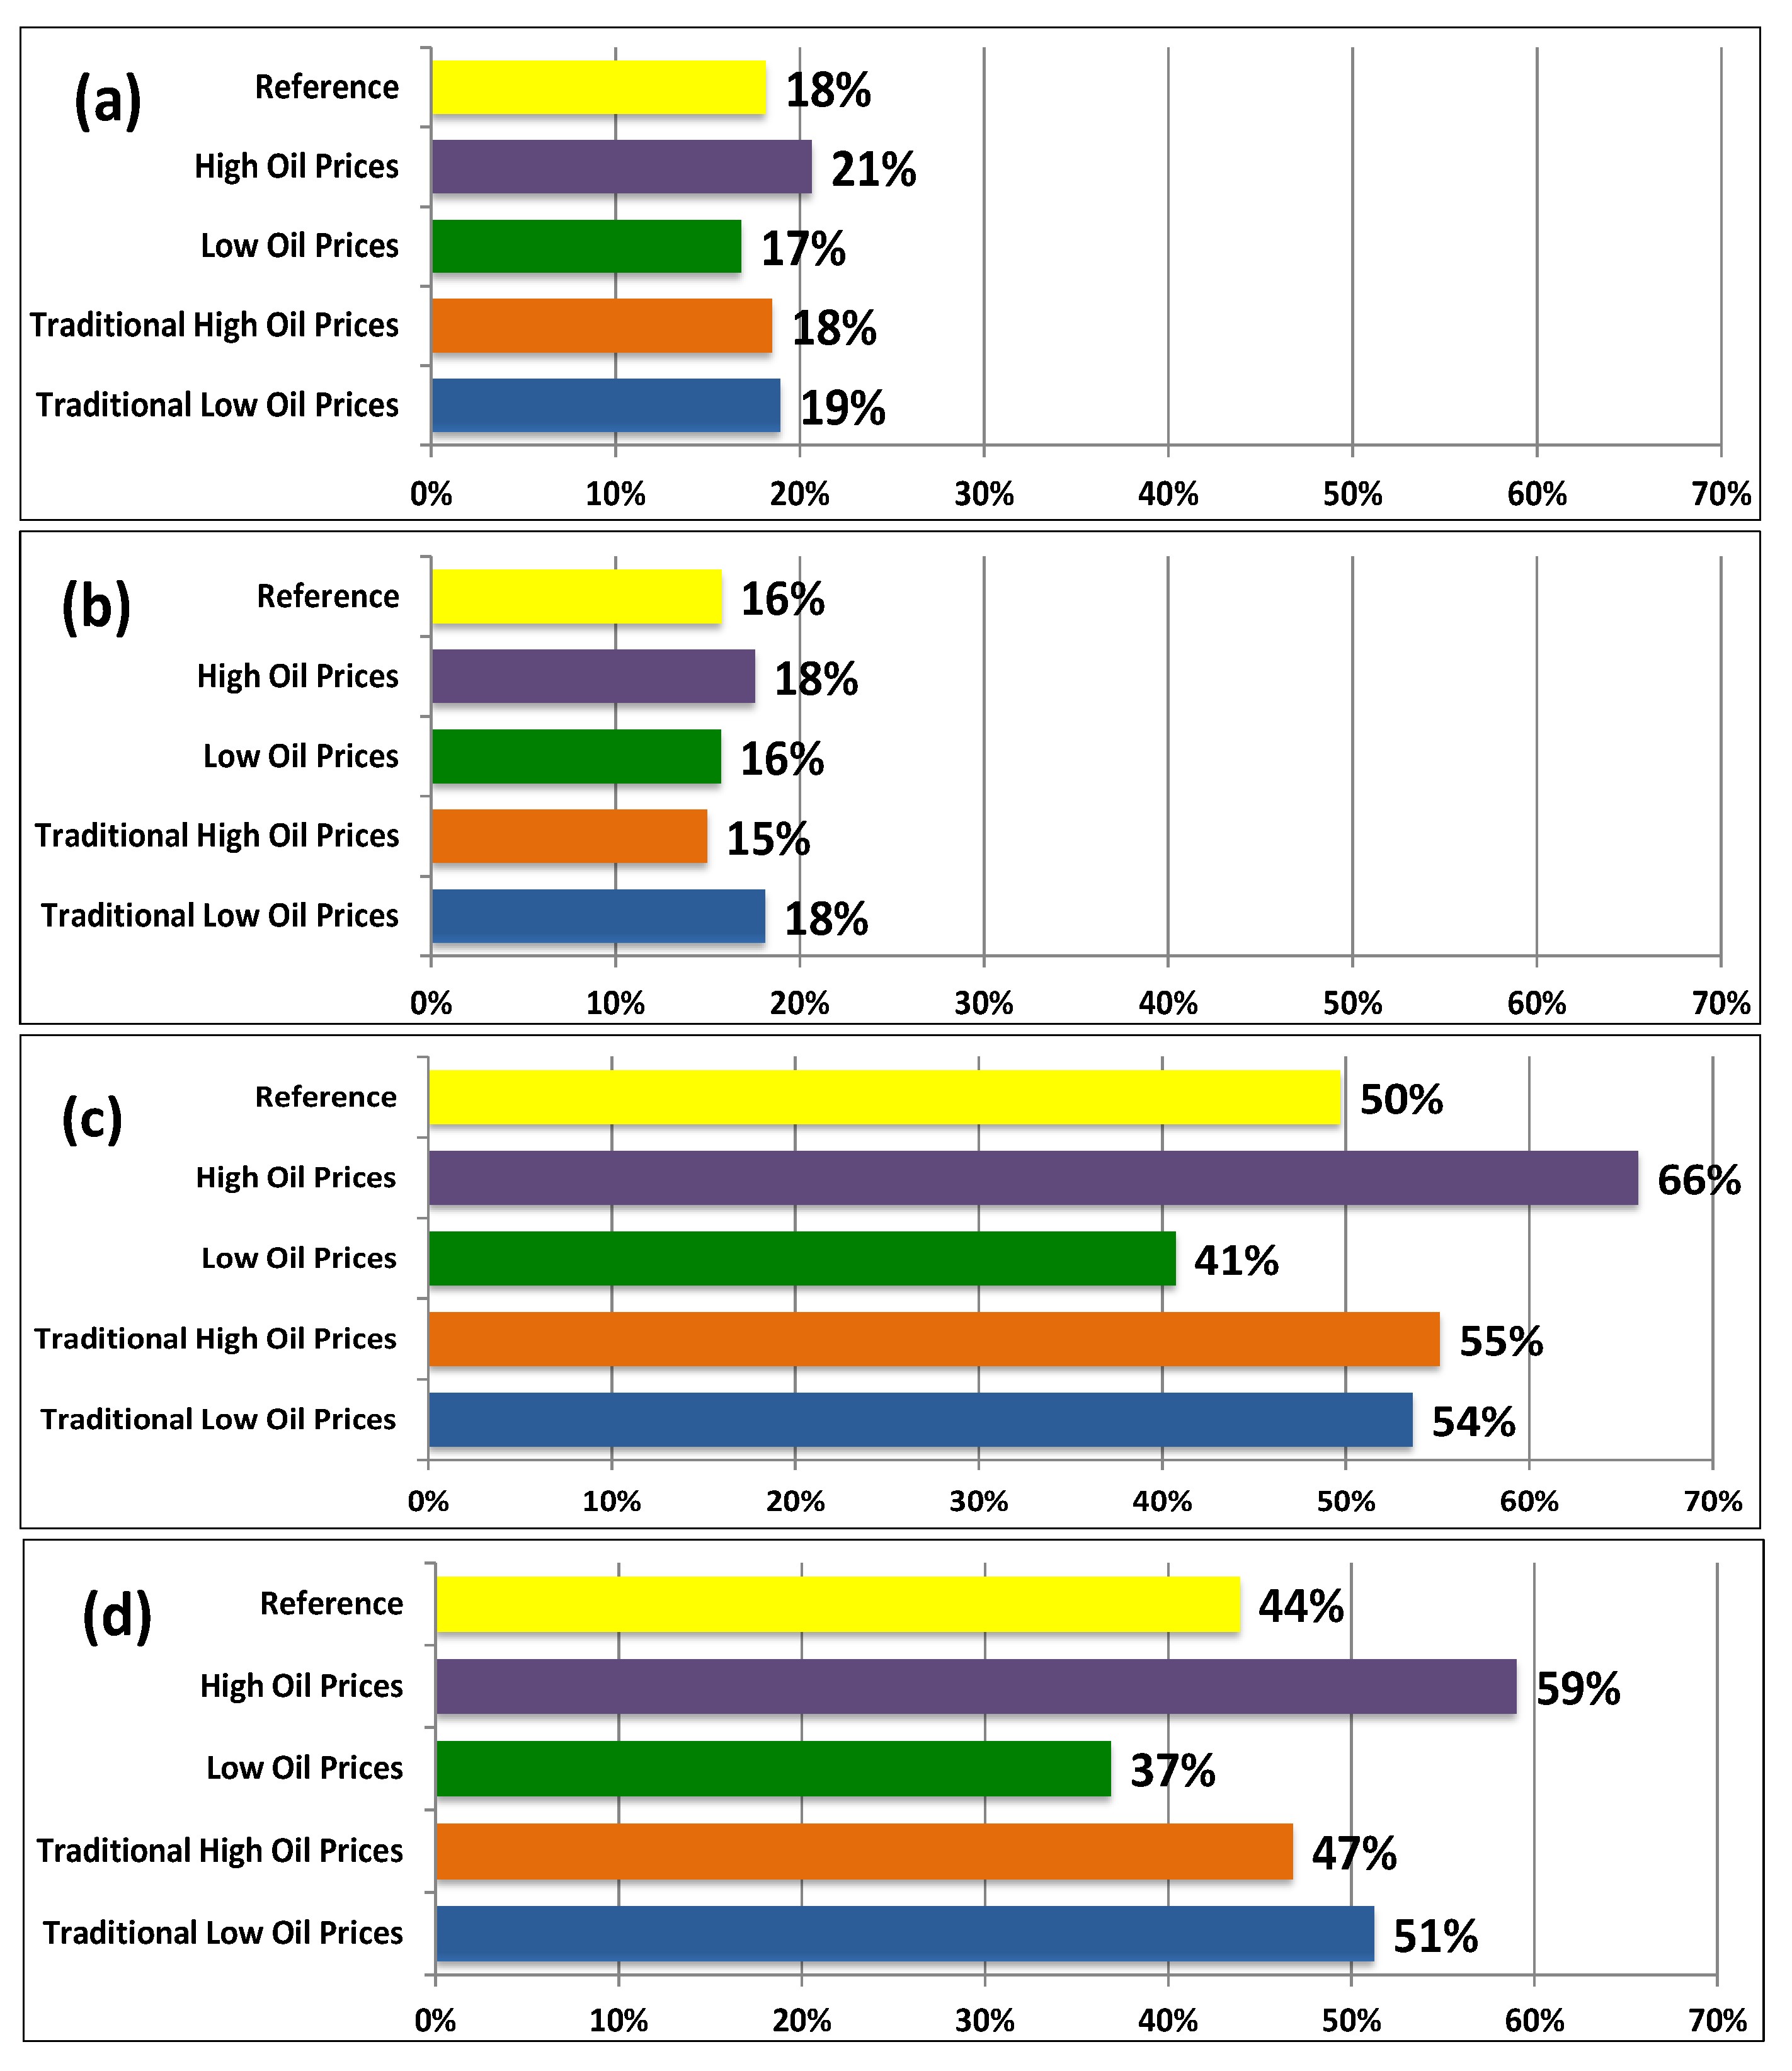
Figure 3 depicts the percent increase in the world’s total water footprint of energy consumption in 2020 and 2035 with respect to base values of 2012. The importance of year 2020 is that the energy targets and mandates for some regions, such as European Union member countries, are set for this year.
Figure 3 indicates the future water use impacts of implemented energy policies in the future. In 2012, almost all scenarios have the same water footprint. In 2035, however, varying water use impact of different scenarios is noticeable, among which the HOP scenario has the highest impact in the future with 59%–66% higher water footprint than 2012. This is because under this scenario, the share of water-intensive energy sources, such as hydropower, biofuels, and unconventional energy sources, increases in the overall energy supply portfolio due to higher oil prices.
According to
Figure 3, water footprint of the world’s energy sector is projected to increase by at least 37% (LOP) and at most 66% (HOP) over the next two decades, while the available water resource for energy is shrinking due to increasing population and climatic changes.
Figure 2.
World’s water footprint of energy consumption in billion cubic meters (BCM) (a) 2012 low estimation; (b) 2012 high estimation.
Figure 2.
World’s water footprint of energy consumption in billion cubic meters (BCM) (a) 2012 low estimation; (b) 2012 high estimation.
Figure 3.
Percent increase in the world’s water footprint of energy consumption compared to 2012: (a) 2020 low estimation; (b) 2020 high estimation; (c) 2035 low estimation; (d) 2035 high estimation.
Figure 3.
Percent increase in the world’s water footprint of energy consumption compared to 2012: (a) 2020 low estimation; (b) 2020 high estimation; (c) 2035 low estimation; (d) 2035 high estimation.
Currently, the agricultural and domestic water sectors are responsible for 70% and 10% of the world’s freshwater consumption, respectively, leaving 20% of the total available freshwater for the industry-energy sector [
34]. The increasing world population of 80 million people per year together with economic development implies increased freshwater demand in the future, putting more pressure on water resources worldwide. Based on our analysis, the amount of world’s renewable water resources required by the energy sector increases from 4%–7% in 2012 to 8%–11% in 2035. This is of particular importance, if the world’s renewable water resources remain unchanged and almost equal to the current 50,000 km
3 [
35,
36] and the world needs more water and food for its increasing population. The estimated quantities, however, depend extensively on the shares of different energy sources, especially renewables, from the total energy production, which are hard to determine due to the uncertainties that exist with regard to the long-term evolution of different energy technologies.
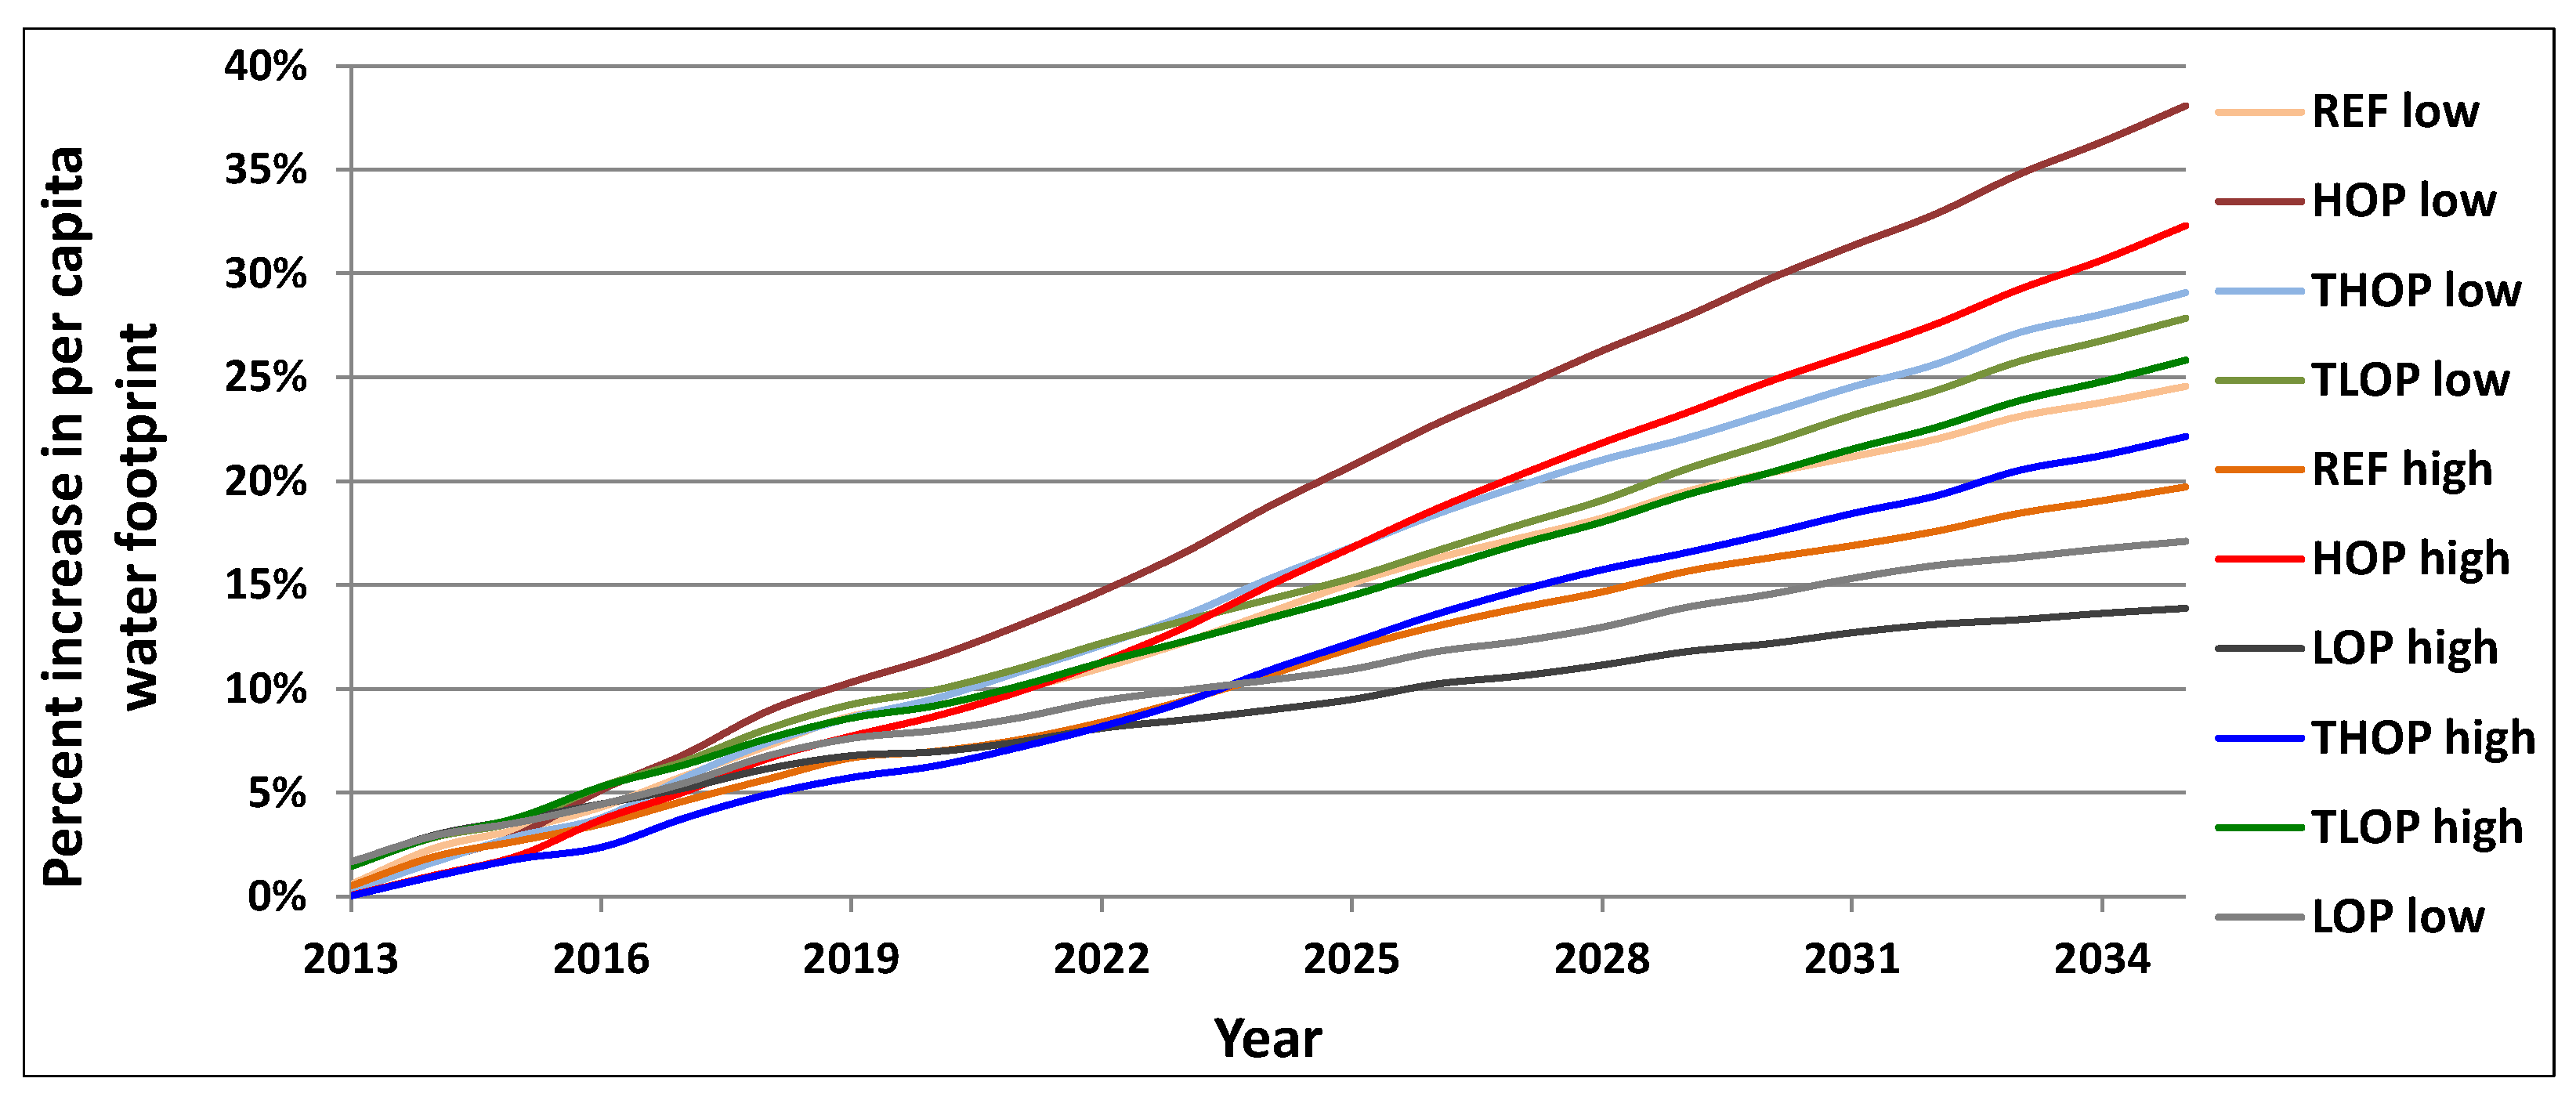
Figure 4 shows the growth of per capita water footprint of the global energy consumption over the 2012–2035 period. For most scenarios, per capita energy’s water footprint growth rate (13%–38%) surpasses the population growth rate (20%) and per capita energy consumption growth rate (18%), indicating a steeper trend in per capita water footprint of global energy production.
Figure 4.
Percent increase in per capita water footprint of global energy production based on different EIA scenarios.
Figure 4.
Percent increase in per capita water footprint of global energy production based on different EIA scenarios.
4. Conclusions
Our analysis suggests that if the 2012 energy sources proportionally keep the same shares of energy production in the future, the global water footprint of energy production will be lower by 1%–10% than the water footprint of other future energy portfolio projections. This is mainly due to the fact that the 2012 energy portfolio excludes high shares of the water-intensive renewable energy sources that are expected to replace today’s fossil fuels in the future. The study findings imply the undeniable fact that global energy portfolios are experiencing a gradual shift toward higher shares of renewables to reduce emissions and combat global warming is not sufficient to secure a sustainable future [
37]. In other words, the general policy of “energy production from renewables” is not sustainable, unless accompanied by detailed analysis of the energy policies’ water use impacts. If the policies shift the future energy production toward more renewable energy sources with a relatively high water consumption, such as biofuels and hydropower, energy-related water footprint might lead to severe water shortage that eventually has negative feedback to energy production. Although the water footprint of different energy technologies is highly variable and depends on the geographic variations and climate [
16], the fact that more water is needed to feed the future’s thirsty energy sector is undeniable. Our analysis shows that projected energy policies’ water-energy ratio rises by 5%–10% in the 2012–2035 period, implying that more water is required per unit of energy. This means an increase of 37%–66%, during the next two decades, in the amount of water required for total energy production in the world. The amount of water that goes to the energy sector will be much higher if low oil production scenarios are realized in the future due to higher shares of water-intensive energy sources such as hydropower and biofuels. Hence, optimizing the energy policies with regard to the water usage, besides reducing emissions, should be an important concern for policy makers and necessary actions must be taken before water shortage becomes another global barrier to sustainable development, if it has not become already. The energy produced from water-intensive energy sources, such as hydropower, is not as “green” as the energy produced from low water consumption energy sources, such as wind energy, although they both have emissions far less than fossil fuels. Future energy mixes must rely more on the energy resources that not only have controllable emissions, but also consume less water. Therefore, future research should focus on improving the water use of different energy technologies, especially the ones with higher negative impacts on water resources.
This study had some major limitations that can be addressed in future studies. Despite its limitations and inaccuracies, however, this study can provide some valuable insights, if its simplifying assumptions are not overlooked, especially when advising policy [
38]. The energy related water footprint calculations in this study were conducted based on the limited data from EIA and did not consider technological evolutions that result in reduction of water consumption in energy production processes over the next decades. Therefore, it is likely that the total water footprint of global energy production falls below or over the values suggested in this study, mostly due to variations in technology and energy efficiency and water use policies and regulations. Furthermore, technology advancements can contribute to improved water recycling and reuse in the energy sector, reducing the lifecycle water footprint of energy production processes. In addition, the shares of different forms of energy in a given category was not clear from the EIA databases, leading to some precision loss in calculations in this study. For instance, the likely shares of solar thermal, solar photovoltaic, wind onshore, and wind offshore were not specified by the EIA. To overcome this ambiguity, the water footprint of such categories were defined as ranges. Here, hydroelectricity was assumed to be produced by large hydropower systems only, ignoring the portion of hydroelectricity supplied by small and run-of-the-river hydropower systems. This might result in overestimation of the water footprint of hydropower, as large hydropower reservoirs have significant water footprints due to evaporative losses. A more detailed composition of the world’s future energy mix provides a more reliable basis for study of the water-energy nexus, policy analysis, and management. In this study, we based our analysis on the scenarios developed by the EIA in order to cover a broad range of possible futures. Future studies might focus on measuring the energy production’s water footprint based on the portfolios developed by other sources such as IEA, WEC, OPEC,
etc.


