1. Introduction
In Canada’s westernmost province, British Columbia (BC), health and nutrition policy makers are increasingly promoting regional food self-sufficiency as a means of improving food security and tackling chronic dietary ill health at a population level. However, policy makers have little information on regional food production especially in relation to local food consumption demand because data and methods to estimate regional food self-sufficiency have not been developed. Regional indicators of dietary ill health are similarly under-developed. Given that Regional Health Authorities (RHAs) in BC have responsibility for food security under the province’s 2007 Public Health Act and, given that policy makers are systematically developing policies and programs to improve access to local foods in order to reduce chronic dietary ill health, it is essential to develop methods and to provide basic information on the extent to which various regions in BC are able to provide local food for their populations and to consider this information in relation to regional indicators of dietary ill health.
British Columbia is a province with approximately 4.5 million people. Only about three percent of the province’s land is arable and these patches of agricultural land are roughly divided into three main regions. In the South West the Fraser Valley is one of the most productive farming regions in North America with fertile soils and benign climate. In the central south of the province the Okanagan valley with its hot dry climate produces wine, tree fruits, and has a large dairy and meat producing sector. Finally, in the North east of the BC, the Peace River Valley, BC’s largest agricultural region, mainly grows grain, canola, and rears cattle.
The province is divided into 80 Local Health Areas (LHAs). In this paper we hypothesize that LHAs with both low “balanced” local food self-sufficiency, and with populations suffering from poor dietary health will be most “at risk” for poor food security and that these regions will require more intensive upstream population and food policy interventions.
The purpose of this paper is three-fold. First, to outline methods to estimate regional food consumption and production and to calculate the capacity for regional food self-sufficiency for most of BC’s LHAs. Second, using regional diabetes Standardized Mortality Ratios (SMRs) to identify LHAs most at risk for poor dietary health. Third, to use these regional indicators of poor dietary health and low balanced food self-sufficiency to identify LHAs in BC most “at risk” for poor food security and most in need for targeted upstream interventions to both improve food self-sufficiency and reduce diet-related chronic ill health.
2. Methodology
The methods section has four sub-sections: (1) estimating food consumption for each Local Health Area; (2) estimating production by LHA; (3) calculating regional capacity for “balanced” food self-sufficiency; (4) using regional diabetes SMRS to identify regions with poor dietary health.
2.1. Estimating Regional Food Consumption
The last major dietary survey conducted in BC was in 1999 [
1]. This was a representative survey of food intake among 1,823 individuals aged 18 to 84. The strength of the survey is that it has accurate estimates, at the provincial level, of food consumption habits for males and females aged 18 to 84. Also, because the survey was based on a sample of 18 to 84 years olds representative of the general population its results can be generalized to the entire population of 18 to 84 year olds. The drawbacks to this survey are that it did not sample across BC’s regions, nor did it sample those under age 18 and it was conducted seven years prior to 2006, the year in which we developed our estimates.
By obtaining estimate for consumption (in kilograms per capita) by age and gender and by applying these to the (in some cases) quite different age and gender structures of BC’s LHAs, we obtain a partial estimate of regional consumption. Further, we adjust the BC Nutrition Survey (BCNS) estimates from 1999, using differences in per capita consumption, for each of six major food categories, as estimated in National Food Disappearance (NFD) data. Please note the National Food Disappearance is calculated by adding the amount of food produced and imported during the year plus stocks available at the beginning of the year. The net supply (
i.e., what is available for consumption) is determined by subtracting domestic stock as well as food used in manufacturing and livestock feed and food that is exported at the end of the year. The net supply is divided by the Canadian population, on 1 July of a given year, to determine per capita food availability for that year. Finally, we obtained estimates of per capita consumption for those aged less than 18 years by using a child and youth adjustment based on the 2004 Canadian Community Health Survey (CCHS). Details of these methods for ascertaining regional consumption in BC can be found in Morrison and Ostry [
2].
2.2. Estimating Regional Food Production
The task at hand is to convert regional estimates of gross production (for animals, herd size, and for plants number of hectares planted with major food crops) obtained from the Agricultural Census in 2006 to the weight of food that is potentially available on the plates of all consumers in 2006. This requires access to Census data (number of animals and number of hectares of plant foods) at the level of geography we are interested in. We obtained Agricultural Census data for 2006 for each LHA in BC through a custom purchase from Statistics Canada. We also require yield data for animals and plants. Yield data for animals, obtained from various Statistics Canada surveys, are essentially the average quantity of meat derived from an animal after it is slaughtered (carcass weight per animal). As the carcass is processed, other waste conversion factors are applied to obtain estimates of the average yield of meat per animal available on the consumers’ plate. Once obtained, these final meat yields are multiplied by the number of animals of each five species (cattle, pigs, sheep, chicken and turkeys) that are raised in each LHA to calculate the final weight of meat produced in 2006 in BC and available on the plate of consumers.
Our approach for animal products (in this case eggs and dairy products) was similar in that we obtained, from Statistics Canada, the number of dairy cattle and laying hens by LHA in 2006. We also obtained yield data in the form of the average number of eggs and volume of milk produced per animal in BC. Numbers of eggs and liters of milk were then converted to weights of eggs and milk produced in each LHA and waste conversion factors applied to theses gross weights to obtain weights of eggs, milk, and dairy products potentially available on consumers’ plates in each of 72 LHAs.
The approach for plant foods is somewhat different. Yield data for most crops are available from Statistics Canada on a yearly basis. Each spring Statistics Canada conducts random representative surveys to estimate the hecterage planted with major food crops. In the fall these surveys are repeated to gather data on the gross weight of each crop harvested. These gross weights are divided by the hecterage planted to determine the yield of food harvested in kilograms per hectare. As for animals, various waste conversion factors are applied to these gross yields to determine the net yield (i.e., the weight of plant food available on the consumer’s plate). These net yields are then multiplied by the hecterage planted to each crop to determine the net weight of plant food produced in 2006 in each LHA.
Once estimates in terms of weight per year were obtained for each species of meat animal, for milk and eggs, and for major local food crops, these were summed within each food category to obtain number of kilograms of these foods potentially available on the plates of consumers in each LHA. Detailed explanations of these methods are available in Morrison and Ostry [
3].
2.3. Balanced Food Self-Sufficiency
The regional Food Self-sufficiency Index (FSI) is calculated by dividing the production of a given food category in a given LHA by consumption of that same food category by the population living in that same LHA. For each of the 72 LHAs, we are able, using this approach to develop FSIs for six major food categories. However, if an LHA produces enough meat for its own population and, even if it has a large surplus, if it also grows little vegetables and fruit, it is unable to provide for the dietary needs of the local population in a balanced fashion. In many LHAs, inability to grow fruit and vegteables will be because climactic, soil, and other conditions do not lend themselves to this type of agriculture. Nonetheless, describing LHAs in terms of their ability to provide a balanced diet is helpful because it shows where important deficits in balanced food production arise. To characterize LHAs in terms of their ability to provide a balanced diet, we have first averaged plant food FSI’s. We have averaged vegetable and fruit FSI s to generate a plant food average FSI for each LHA and also averaged FSIs for eggs, milk and dairy products, and meat to calculate an animal food average FSIs for each LHA. Furthermore we have then cagtegorized them into seven groups as shown in
Table 1.
Table 1.
Food Self-sufficiency Index (FSI) Cut-offs for Grouping Local Health Areas (LHAs) in Terms of their Food Self-Sufficiency.
Table 1.
Food Self-sufficiency Index (FSI) Cut-offs for Grouping Local Health Areas (LHAs) in Terms of their Food Self-Sufficiency.
| FSI Category | Average Cut-offs |
|---|
| Plant | Animal AFSIs |
|---|
| Zero | <5 | <5 |
| Low | <50 | <50 |
| High Animal | <50 | between 50 and 100 |
| High Plant | between 50 and 100 | <50 |
| Very High Animal | <50 | >100 |
| Very High Plant | >100 | <50 |
| Balanced | >50 | >50 |
Any LHA with both an average plant and an average animal FSI less than five was categorized with “Zero” ability to supply a balanced diet to its population. And, at the other extreme, any LHA with both an average plant and animal FSI of greater than 50 was classified as having a balanced abilty to supply its population with food. For the latter category, a cut-off average FSI of 50, is permissive in the sense that some LHAs classified in this fashion may still have less than 100 percent capability of being self-sufficient in both animal and plant foods.
2.4. Using Diabetes Standardized Mortaltiy Ratios (SMR) as Indicators for Regional Dietary Ill Health
Type 1 diabetes can occur at any age, but it is most often diagnosed in children, teens, or young adults. Type 2 diabetes constitutes most diabetes cases. It most often occurs in adulthood, although teens and young adults are now being diagnosed because of high obesity rates. People with Type 2 diabetes are more likely to be obese and to have poor dietary habits [
4,
5,
6,
7]. Regions with high diabetes mortality will likely also have a high proportion of their population who have poor dietary habits, are obese and suffering from many other chronic diet-related health problems making diabetes SMRs a reasonable proxy indicator for regional dietary ill health.
We have obtained SMRs for diabetes for each LHA in BC for the period from 2005 to 2009 [
8]. In regions with small populations there may be few diabetes deaths in a given year. That is why it is necessary to construct SMRs over several years, in this case, the five years from 2005 to 2009 which also include 2006, the year for which we have our food self-sufficiency data. Data are missing for Snow Country and Telegraph Creek LHAs because their populations are so small that even after aggregating diabetes mortality over five years estimates were too unstable. We assume that SMR’s are greater than 1.10 for these two LHAs based on the demographic similarity with Stikine and other nearby LHAs with very high diabetes SMRs.
For all LHAs in BC the median diabetes SMR was 1.10. We use this median cut-off to divide LHAs into “good” and “poor” dietary ill health. We also identify from the LHAs with Zero or Low balanced food self-sufficiency, those that also have diabetes SMRs greater than 1.
There are several limitations in using diabetes SMRs to characterize the dietary and nutritional conditions faced by residents in a given region. The proportion of Aboriginal people living in the LHAs with diabetes SMRs above the median is, generally, higher, and in some cases substantially higher, than the BC average. There is evidence that Aboriginal people are genetically at greater risk for diabetes than non-Aboriginals [
9]. However, genetics alone does not determine the risk for diabetes which is shaped also by exposure to poor social, environmental and dietary conditions. A genetic pre-disposition to diabetes is more likely to be triggered in an individual exposed to a poor social and economic and dietary and nutritional circumstances.
Dyck
et al. [
10] in a study of diabetes in Saskatchewan from 1980 to 2005, found prevalence doubled during this time and suggested this increase was most likely due to environmental (nutrition and lifestyle) factors. And, in a comprehensive review of the literature on diabetes and Aboriginal health conducted in 2000, Young
et al. ([
9], p. 561) concluded that “diabetes can be considered to be indicative of the rapid sociocultural changes experienced by Aboriginal people in the past several decades”.
These conclusions, by researchers, about the importance of the environmental contribution to diabetes among Aboriginal people arise in part because of the unusually rapid rate of increase in diabetes in Aboriginal communities over the past quarter century ([
9,
11] the often huge variation in the prevalence of diabetes according to language group, culture area, geographic location and degree of isolation, both nationally and regionally [
11,
12] and, the considerable variation in rates even between communities of the same tribal background in close proximity [
13,
14]. The rapidity of the increase in diabetes, the variation in prevalence among different groups of Aboriginals and especially the variation between communities sharing similar genetic background, all point to the importance of the dietary and nutritional environment as a driver of diabetes prevalence among Aboriginals and justifies using diabetes SMRs as an indicator of regional dietary ill health even in regions with a high proportion of Aboriginal people.
3. Results
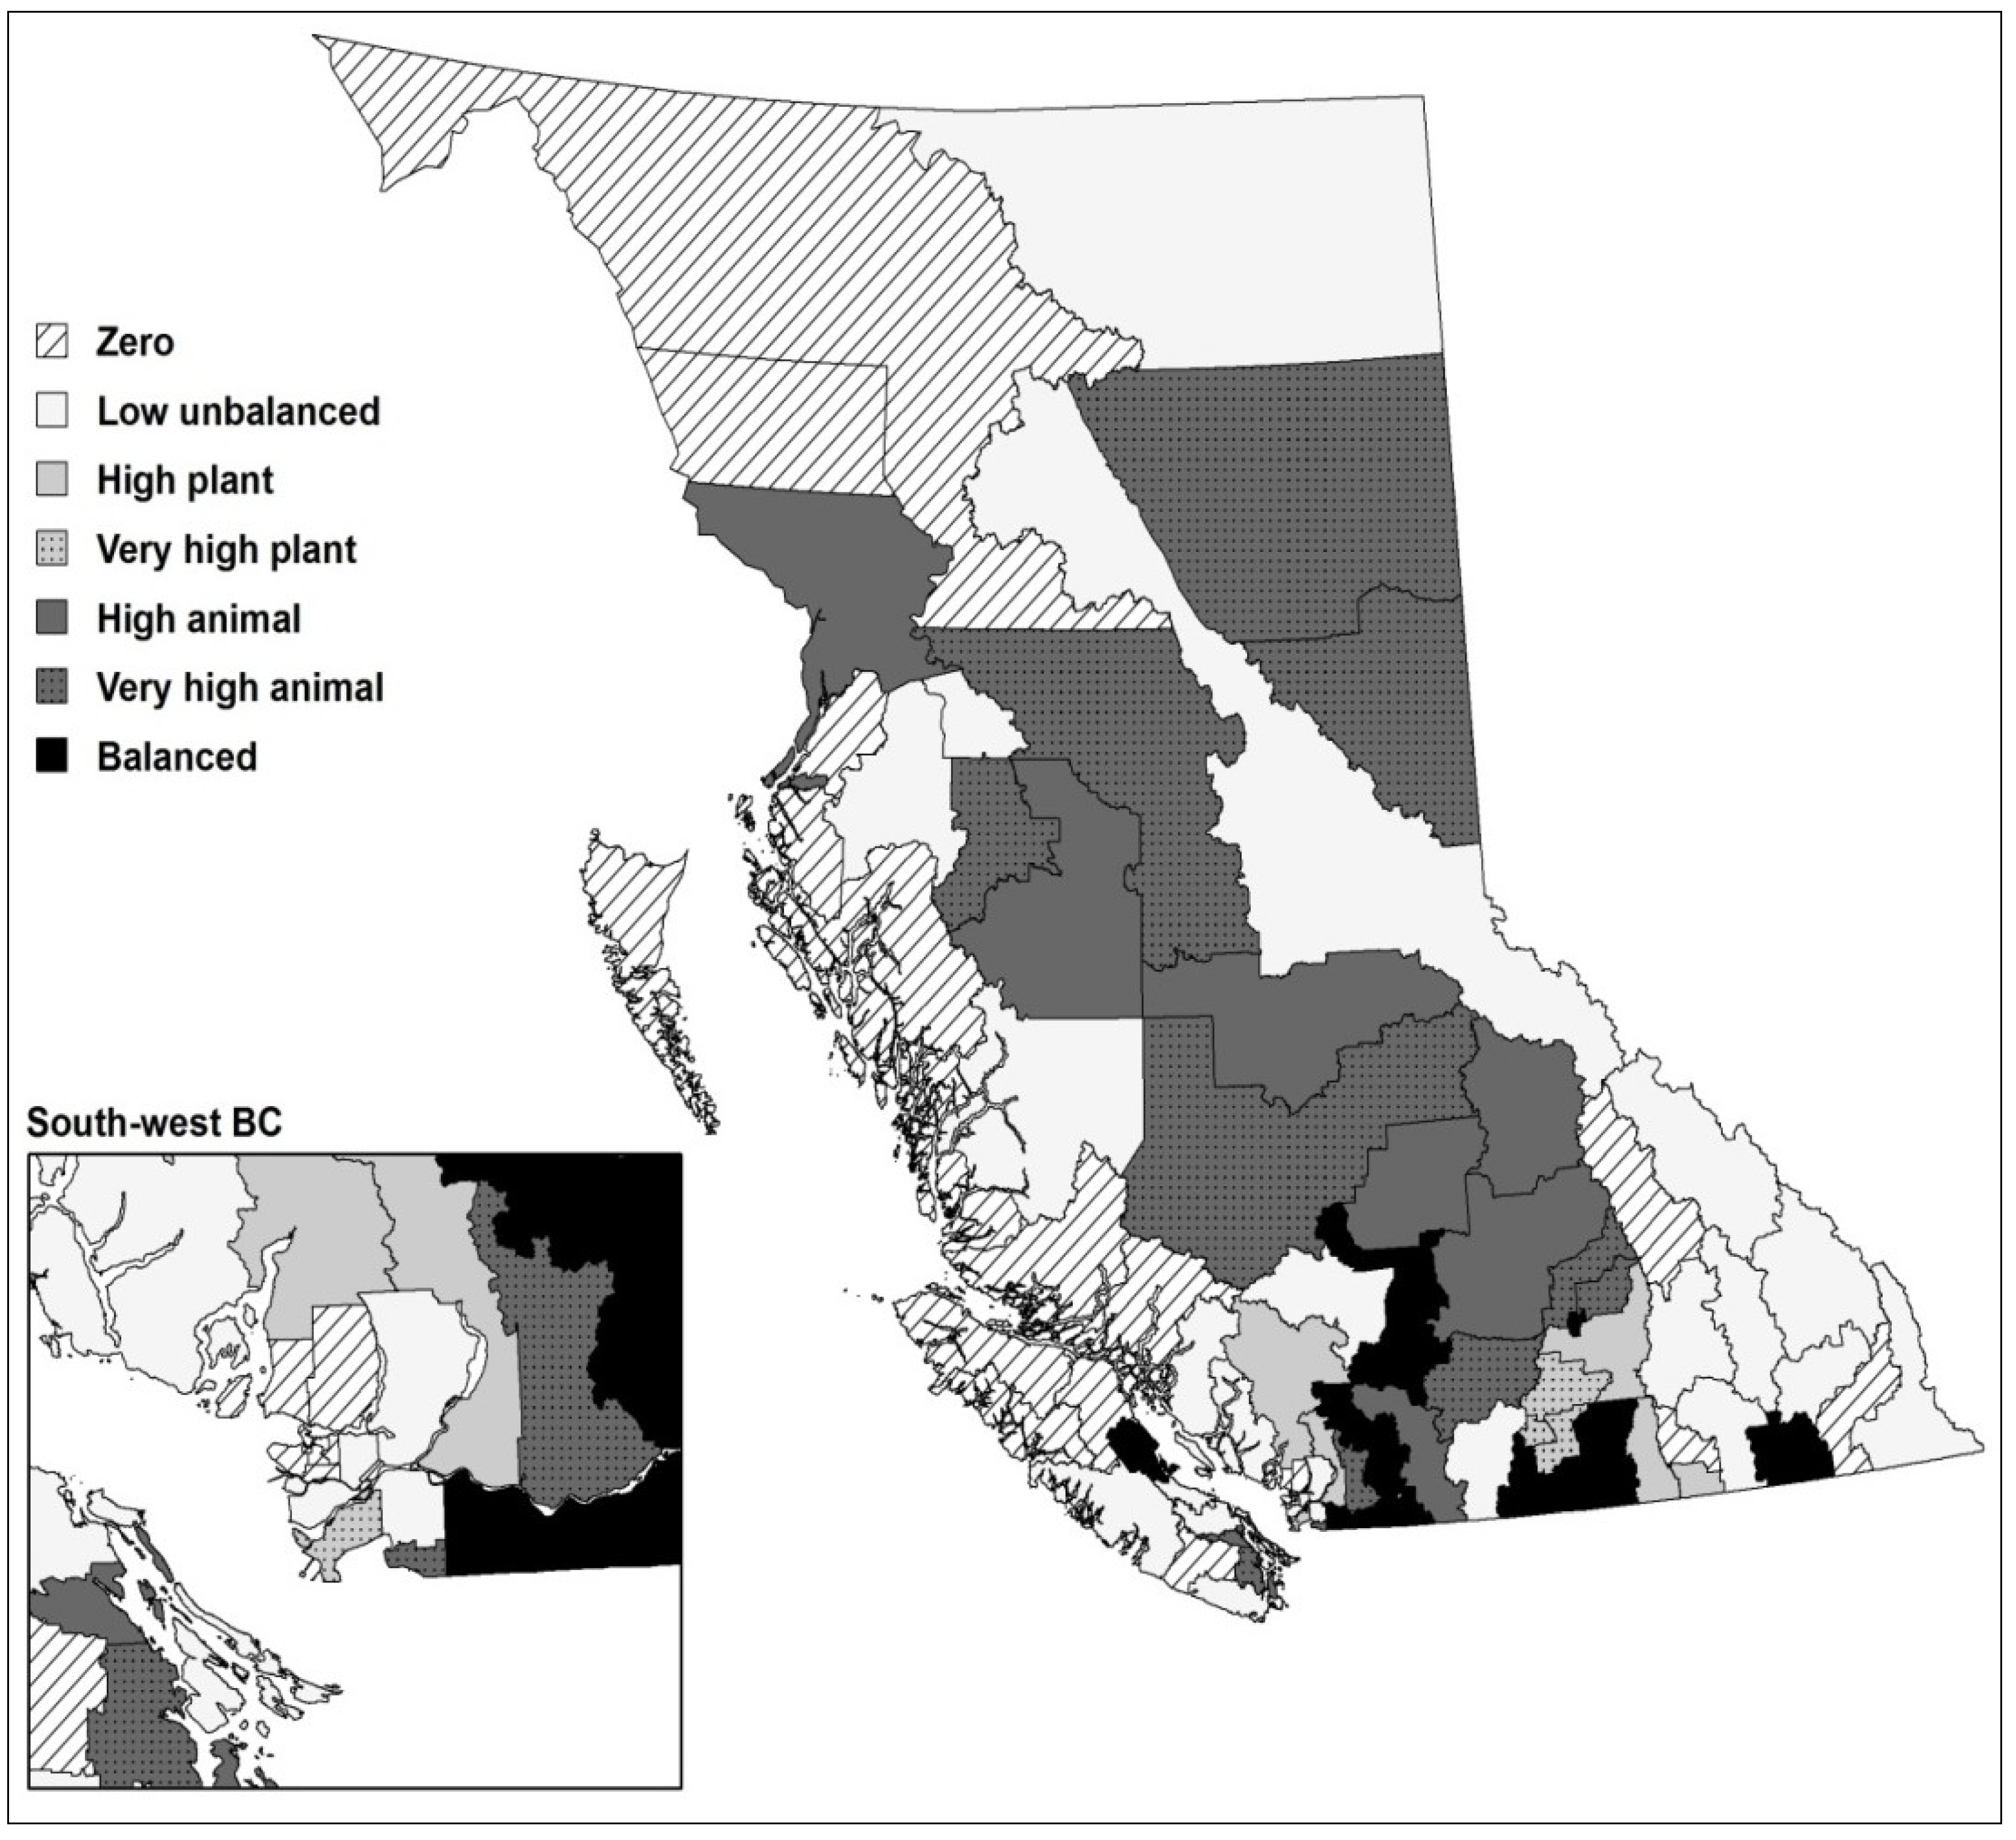
Figure 1 shows LHAs in BC with different levels of balanced food self-sufficiency.
Figure 1.
“Balanced” Plant and Animal Food Self-Sufficiency by LHAs in British Columbia (BC).
Figure 1.
“Balanced” Plant and Animal Food Self-Sufficiency by LHAs in British Columbia (BC).
Forty-nine (55%) of BC’s LHAs have Zero or Low food self-sufficiency. Eleven of these LHAs, are mainly urban with limited agricultural land and no or few farms and cannot be expected to have high, let alone, high balanced food self-sufficiency. Three of these LHAs are peri-urban with significant agricultural activity (Coquitlam, Richmond and Surrey). This leaves 35 LHAs (39%) located outside major urban areas with Zero or Low food self-sufficiency.
Table 2 shows diabetes SMRs for BC’s LHAs in 2005–2009. The Kettle Valley LHA had the lowest Diabetes SMR (0.34) whereas Nisga’a had the highest (4.06). While these differences between Nisga’a and Kettle Valley are extreme,
Table 1 indicates that the range of SMRs across the province’s LHAs is still large. For example, there is about a four-fold difference in diabetes mortality between (the less extreme examples of) Vancouver West Side (SMR = 0.50) and Kitimat (SMR = 2.05).
Table 2.
Diabetes Standardized Mortality Ratios by LHA, 2005 to 2009.
Table 2.
Diabetes Standardized Mortality Ratios by LHA, 2005 to 2009.
| Local Health Area | SMR | Local Health Area | SMR |
|---|
| Kettle Valley | 0.39 | Kimberley | 1.11 |
| Windermere | 0.45 | Peace River North | 1.12 |
| Gulf Islands | 0.48 | Maple Ridge | 1.12 |
| Fort Nelson | 0.50 | Howe Sound | 1.13 |
| Vancouver West Side | 0.50 | Bella Coola Valley | 1.13 |
| West Van.-Bowen | 0.52 | Creston | 1.16 |
| Enderby | 0.55 | Southern Okanagan | 1.17 |
| Saanich | 0.56 | Stikine | 1.19 |
| Kootenay Lake | 0.57 | Kamloops | 1.23 |
| S.Surrey Wh. Rock | 0.66 | Abbotsford | 1.24 |
| Armstrong-Spall. | 0.67 | Nelson | 1.27 |
| Lake Cowichan | 0.70 | Trail | 1.27 |
| Fernie | 0.70 | Princeton | 1.28 |
| Qualicum | 0.71 | Keremeos | 1.28 |
| Sunshine Coast | 0.71 | Lillooet | 1.29 |
| Delta | 0.72 | Campbell River | 1.29 |
| Summerland | 0.75 | Queen Charlotte | 1.30 |
| Coquitlam | 0.80 | Vernon | 1.33 |
| Vancouver Midtown | 0.80 | Surrey | 1.36 |
| Richmond | 0.80 | Nanaimo | 1.37 |
| Arrow Lakes | 0.81 | Smithers | 1.38 |
| City Centre | 0.82 | Castlegar | 1.41 |
| North Thompson | 0.86 | South Cariboo | 1.45 |
| Merritt | 0.89 | Quesnel | 1.46 |
| 100 Mile House | 0.89 | Mission | 1.53 |
| Vancouver Downtown E. Side | 0.89 | Nechako | 1.53 |
| Sooke | 0.90 | Prince George | 1.56 |
| New Westminster | 0.90 | Vancouver Island North | 1.58 |
| Central Okanagan | 0.90 | Cranbrook | 1.59 |
| Cowichan | 0.91 | Alberni | 1.65 |
| North Vancouver | 0.91 | Terrace | 1.73 |
| Vancouver North East | 0.91 | Golden | 1.81 |
| Salmon Arm | 0.92 | Vancouver Island West | 1.91 |
| Langley | 0.93 | Cariboo-Chilcotin | 1.97 |
| Greater Victoria | 0.93 | Kitimat | 2.05 |
| Vancouver South | 0.94 | Hope | 2.11 |
| Chilliwack | 0.95 | Central Coast | 2.12 |
| Burnaby | 0.97 | Peace River South | 2.16 |
| Courtenay | 1.00 | Prince Rupert | 2.16 |
| Grand Forks | 1.03 | Burns Lake | 2.27 |
| Agassiz-Harrison | 1.07 | Upper Skeena | 2.27 |
| Ladysmith | 1.08 | Nisga'a | 4.06 |
| Powell River | 1.09 | Snow Country | - |
| Penticton | 1.09 | Telegraph Creek | - |
| Revelstoke | 1.09 | | |
Twenty-four of the 49 LHAs with Zero or Low food Self-Sufficiency also have Diabetes SMRS greater than 1.10. The mean diabetes SMR for these 24 LHAs is 1.67. These LHAs have both the poorest food self-sufficiency and populations with the worst dietary health in the province (
Table 3).
Table 3.
LHAs with Zero or Low Food Self-Sufficiency and High Diabetes Standardized Mortality Ratios (SMRS) in conjunction with High Levels of Human Economic Hardship.
Table 3.
LHAs with Zero or Low Food Self-Sufficiency and High Diabetes Standardized Mortality Ratios (SMRS) in conjunction with High Levels of Human Economic Hardship.
| RHA | HSDA | LHA |
|---|
| Interior | Thom/Cariboo/Shus. | Lillooet |
| Interior | Kootenay Boundary | Nelson |
| Interior | East Kootenay | Cranbrook |
| Interior | East Kootenay | Golden |
| Interior | East Kootenay | Castelgar |
| Interior | East Kootenay | Kimberley |
| Interior | Okanagan | Princeton |
| Northern | Northwest | Stikine |
| Northern | Northwest | Queen Charlotte |
| Northern | Northwest | Prince George |
| Northern | Northwest | Terrace |
| Northern | Northwest | Kitimat |
| Northern | Northwest | Prince Rupert |
| Northern | Northwest | Upper Skeena |
| Northern | Northwest | Nisga’a |
| Northern | Northwest | Telegraph Creek |
| Vancouver Coastal | N. ShoreCoast Garibaldi | Bella Coola Valley |
| Vancouver Coastal | N. ShoreCoast Garibaldi | Central Coast |
| VIHA | C. Van. Isle | Nanaimo |
| VIHA | N. Van Isle | Campbell River |
| VIHA | N. Van. Isle | Vancouver Island North |
| VIHA | C. Van. Isle | Alberni |
| VIHA | C. Van. Isle | Vancouver Island West |
| Fraser | Fraser South | Surrey |
As can be seen in
Table 2, Surrey and Nanaimo are the only large urban regions with both high diabetes SMRs and low food self-sufficiency. We have added Vancouver’s Downtown-Eastside (DTES) LHA to this group of urban LHAs with low food self-sufficiency and poor dietary health even though diabetes SMR’s for this LHA are 0.89 for the 2005 to 2009 period. This is because the DTES is a unique neighbourhood in BC with a high proportion of poverty-stricken drug addicts and with at population with the lowest life expectancy in the province.
Figure 2 maps the LHAs in BC most at risk for poor food security.
Figure 2.
LHAs in BC Most “At Risk” for Poor Food Security.
Figure 2.
LHAs in BC Most “At Risk” for Poor Food Security.
4. Conclusion
Rural Local Health Areas most at risk for poor food security are mostly located within the Northwest, Vancouver Island North and Central Vancouver Island, Kootenay Boundary, and East Kootenay Health Service Districts (as well as the two “orphan” Vancouver Coastal LHAs of Bella Coola and Central Coast). These are over-whelmingly northern non-urban LHAs with a high proportion of Aboriginal people (averaging 30 percent across these 24 LHAs) in the most economically depressed regions of the province.
In modern societies, people’s ability to access food depends mainly on the retail food system. There is a large and growing non-retail sector consisting of the charitable system of food provision (operating mainly through food banks and emergency and non-emergency meal provision to vulnerable sub-populations such as homeless people), farmers’ markets, farm gates foods sales, etc. The “wild food” sector is also available especially in some rural regions as a third point of food access for people.
Very little research has been conducted in Canada on the extent to which Aboriginal people living in rural regions utilize wild food. One of the best surveys of nutritional status, including use of wild foods, was conducted by Chan
et al., in 2011, in several rural Aboriginal communities in BC [
15]. His survey indicated that there was variation across the Aboriginal communities studied, in terms of the type and of wild foods accessed and the amounts accessed, but that in all surveyed communities, people desired to access more of these foods.
Regions that have zero or low balanced food self-sufficiency are less able to support these three modes of access to the food system. The large retailers rely intensively on globalized food chains often by-passing local suppliers. The food price inflation, that appears to be embedded in these systems of globalized supply, is pushing a rapidly rising proportion of the population into the non-retail sector to obtain their food [
16]. Regions with zero and low food self-sufficiency have less ability, in turn, to provide food and food skills necessary to support the non-retail food sector. Finally, as local regions lose food production capacity they also lose their skilled farming labour force, and associated skills to handle the processing, preservation, and preparation of wild foods, reducing the ability of the wild foods sector to contribute to local food self-sufficiency.
There is some evidence that, especially in isolated remote Local Health Areas with zero and low food self-sufficiency, prices within the retail sector are very high. People in these LHAs have, on average, low incomes, so that a high proportion of the population has limited access to the retail sector [
17] and is forced to rely on the non-retail and/or wild sectors to obtain food. There is limited evidence of under-development of the charitable food sector in non-urban compared to urban places in BC indicating that this segment of the non-retail sector may not be able to support those people who have limited access to the local retail sector especially in remote and isolated LHAs [
18].
In many isolated rural LHAs local farm gate meat sales have historically been an important source of food [
19]. In 2004, in the aftermath of the “mad cow” disease scare in Alberta, the provincial government passed legislation tightening food safety inspections [
20]. However, in some of these regions, there is evidence that farm gate sales may be in decline after the BC’s Meat Processing Regulations were passed in 2004, and in spite of amendments passed to support local meat processors to meet the new food safety requirements [
21,
22].
In urban LHAs with zero or low food self-sufficiency, while food prices may tend to be lower in the retail sector than they are in remote and isolated LHAs, housing costs are very high, and disposable income for food for many people may be low [
17]. In terms of the non-retail sector, charitable food systems may be better resourced and developed than in many non-urban and especially in remote LHAs but they are still over-whelmed and unable to fully supply everyone with nutritious diets [
23].
The number of farmer’s markets in these urban LHAs has exploded in the past few years, but the limited evidence available points to quite high prices for produce sold in them that would tend to exclude those with low incomes [
24]. Finally the opportunity for wild food and farm gate sales is limited in these urban regions (except in the case of berry picking in many urban LHAs in South-West BC) so that the charitable foods sector is increasingly important for food security in these urban LHAs.
Most of the work on food deserts conducted to date in BC has been conducted in urban regions of the province [
25]. We offer here a suite of methods, and illustrate their use, to empirically determine food self-sufficiency at a relatively small level of geography for use in rural places. Furthermore, we have, after identifying regions of lowest food self-sufficiency in BC, superimposed these on regions whose populations have relatively poor dietary ill health. In this way we have demonstrated a methodological way forward to empirically determine regions in the province of BC most at risk for food insecurity. This information should be of interest to health and food planners within the province. These methods may also be useful for researchers and planners in other jurisdictions.


