Article

Sustainability, Health and Environmental Metrics: Impact on Ranking and Associations with Socioeconomic Measures for 50 U.S. Cities

1
National Health and Environmental Effects Research Laboratory, Office of Research and Development, US Environmental Protection Agency, Research Triangle Park, NC 27711, USA
2
National Center for Computational Toxicology, Office of Research and Development, US Environmental Protection Agency, Research Triangle Park, NC 27711, USA
3
Westat, Rockville, MD, USA
*
Author to whom correspondence should be addressed.
Sustainability 2013, 5(2), 789-804; https://doi.org/10.3390/su5020789
Submission received: 11 January 2013 / Revised: 5 February 2013 / Accepted: 6 February 2013 / Published: 22 February 2013

Abstract

:
Waste and materials management, land use planning, transportation and infrastructure including water and energy can have indirect or direct beneficial impacts on the environment and public health. The potential for impact, however, is rarely viewed in an integrated fashion. To facilitate such an integrated view in support of community-based policy decision making, we catalogued and evaluated associations between common, publically available, Environmental (e), Health (h), and Sustainability (s) metrics and sociodemographic measurements (n = 10) for 50 populous U.S. cities. E, H, S indices combined from two sources were derived from component (e) (h) (s) metrics for each city. A composite EHS Index was derived to reflect the integration across the E, H, and S indices. Rank order of high performing cities was highly dependent on the E, H and S indices considered. When viewed together with sociodemographic measurements, our analyses further the understanding of the interplay between these broad categories and reveal significant sociodemographic disparities (e.g., race, education, income) associated with low performing cities. Our analyses demonstrate how publically available environmental, health, sustainability and socioeconomic data sets can be used to better understand interconnections between these diverse domains for more holistic community assessments.

1. Introduction

The mission of the U.S. Environmental Protection Agency (EPA) is to protect human health and the environment. As a result, the EPA has focused its regulatory and research activities on environmental exposures to air, water, toxic wastes and associated ecological and health impacts. More recently, EPA, recognizing the importance of incorporating sustainability into decision making, is working to formally adopt a sustainability paradigm that would underlie agency policies and programs [1].
In recognition of the interdependency between long term infrastructure planning and the potential impact on the health and wellbeing of communities, EPA has joined the Partnership for Sustainable Communities with the U.S. Department of Housing and Urban Development (HUD) and the U.S. Department of Transportation (DOT). Collectively, their efforts will help to improve access to affordable housing, provide more transportation options, and lower transportation costs while protecting the community environment [2]. These three agencies recently announced they will partner with the Governors’ Institute on Community Design to provide enhanced technical guidance to governors seeking to tackle housing, transportation, environmental, and health challenges facing their states.
To educate citizens and help planners evaluate the impact of alternative development choices, EPA posts various municipal scorecards, to demonstrate how planned growth and development can benefit a community [2].

1.1. Comparative Rankings: A Convenient Assessment Tool

An increasingly popular trend among news magazines (e.g., U.S. News, Forbes, Money Magazine, U.S. News and World Report, News Week) feature reports that aim to provide the public with convenient annual rankings of e.g., the best retirement cities, nation’s top 10 hospitals, greenest companies and top U.S. colleges. Often these rankings lead to competition among counties, states and college boards because of the potential economic gain (e.g., increased admissions, economic development or visibility).
An example of a health assessment tool which facilitates such comparative ranking is the University of Wisconsin’s Population Health Institute and the Robert Wood Johnson Foundation County Health Rankings providing information on a wide array of health outcome metrics for every county in all 50 states [3].
With the objective of informing and encouraging citizen participation in policy and land use decisions, SustainLane [4] and Earth Day’s Network [5], via publication with easily extracted datasets and a user guided web site, conducted assessments by ranking best performing based on metrics related to, for example, affordable housing, transportation, environment, health and long term susceptibility measures. Here, we further these efforts by extracting environment (e), health (h) and sustainability (s) metrics from these two sources, and combining them to construct broader based indices, denoted using upper case letters: “E”,“H” and “S” for the combined environment, health and sustainability indices, respectively. We also created an index combining the three indices, denoted “EHS”. In this paper, we provide an assessment of the how these measures interact with and influence each other as well as their relationships with sociodemographic measures for 50 U.S. Cities.

2. Methods

The 50 U.S. cities considered for our study are shown in Table 1.
Table 1. Selected 50 populous U.S. Cities based on 2010 U.S. census.
City Population (2010) City Population (2010)
Albuquerque, NM545,852Memphis, TN646,889
Arlington, TX365,438Mesa, AZ439,041
Atlanta, GA420,003Miami, FL399,457
Austin, TX790,390Milwaukee, WI594,833
Baltimore, MD620,961Minneapolis, MN382,578
Boston, MA617,594Nashville, TN601,222
Charlotte, NC731,424New Orleans, LA343,829
Chicago, IL2,695,598New York, NY8,175,133
Cleveland, OH396,815Oakland, CA390,724
Colorado Springs, CO416,427Oklahoma City, OK579,999
Columbus, OH787,033Omaha, NE408,958
Dallas, TX1,197,816Philadelphia, PA1,526,006
Denver, CO600,158Phoenix, AZ1,445,632
Detroit, Mi713,777Portland, OR583,776
El Paso, TX649,121Sacramento, CA466,488
Fort Worth, TX741,206San Antonio, TX1,327,407
Fresno, CA494,665San Diego, CA1,307,402
Honolulu, HI*337,256San Francisco, CA805,235
Houston, TX2,099,451San Jose, CA945,942
Indianapolis, IN820,445Seattle, WA608,660
Jacksonville, FL821,784Tucson, AZ520,116
Kansas City, MO459,787Tulsa, OK391,906
Las Vegas, NV583,756Virginia Beach, VA437,994
Long Beach, CA462,257Washington, DC601,723
Los Angeles, CA3,792,621
Louisville, KY597,337Total 46,689,922
These cities were selected because they were common to the two sources of data that were used in our analyses i.e., and SustainLane [4] and Earthday’s Network (2008-Urban Environment Report) [5].
Specifically, we extracted extant environmental (e), health (h) and sustainability (s) metric data for the 50 cities from SustainLane [4] and Earthday Network (2008-UER) [5]. We extracted U.S. 2010 census data [6] for the socioeconomic measures. Details of the methodological information for Earthday Network are provided on their website [7]. Briefly, data was extracted from public available data from a wide range of publically available data from the U.S. EPA, American Lung Association, Environmental Natural Resources and Defense Council and other sources. SustainLane [4] methodology and data information were drawn from publically available data bases and from survey and interviews with city leaders, environmental and energy offices, and departments of solid waste, water and planning departments.
The data sources and number of (e), (h) and (s) metrics, we used to derive the E, H, S indices and the integrated EHS Index are shown in (Figure 1). In all, over 65 environmental (e), health (h), sustainability (s) and 10 sociodemographic measures were extracted. Figure 2 provides a pictorial overview of how the E, H, S indices and integrated EHS Index were constructed and the interconnections between and amongst the various metrics and indices evaluated.
Figure 1. Data source and number (e) (h) and (s) metrics used to derive E, H, S Indices and composite EHS Index.
Sustainability 05 00789 g001
Figure 2. Overview of the number of (e), (s), and (h) metrics used to derive E, H, S indices and a composite EHS Index to explore inter-relationships, ranking and socioeconomic features of top performing cities.
Sustainability 05 00789 g002

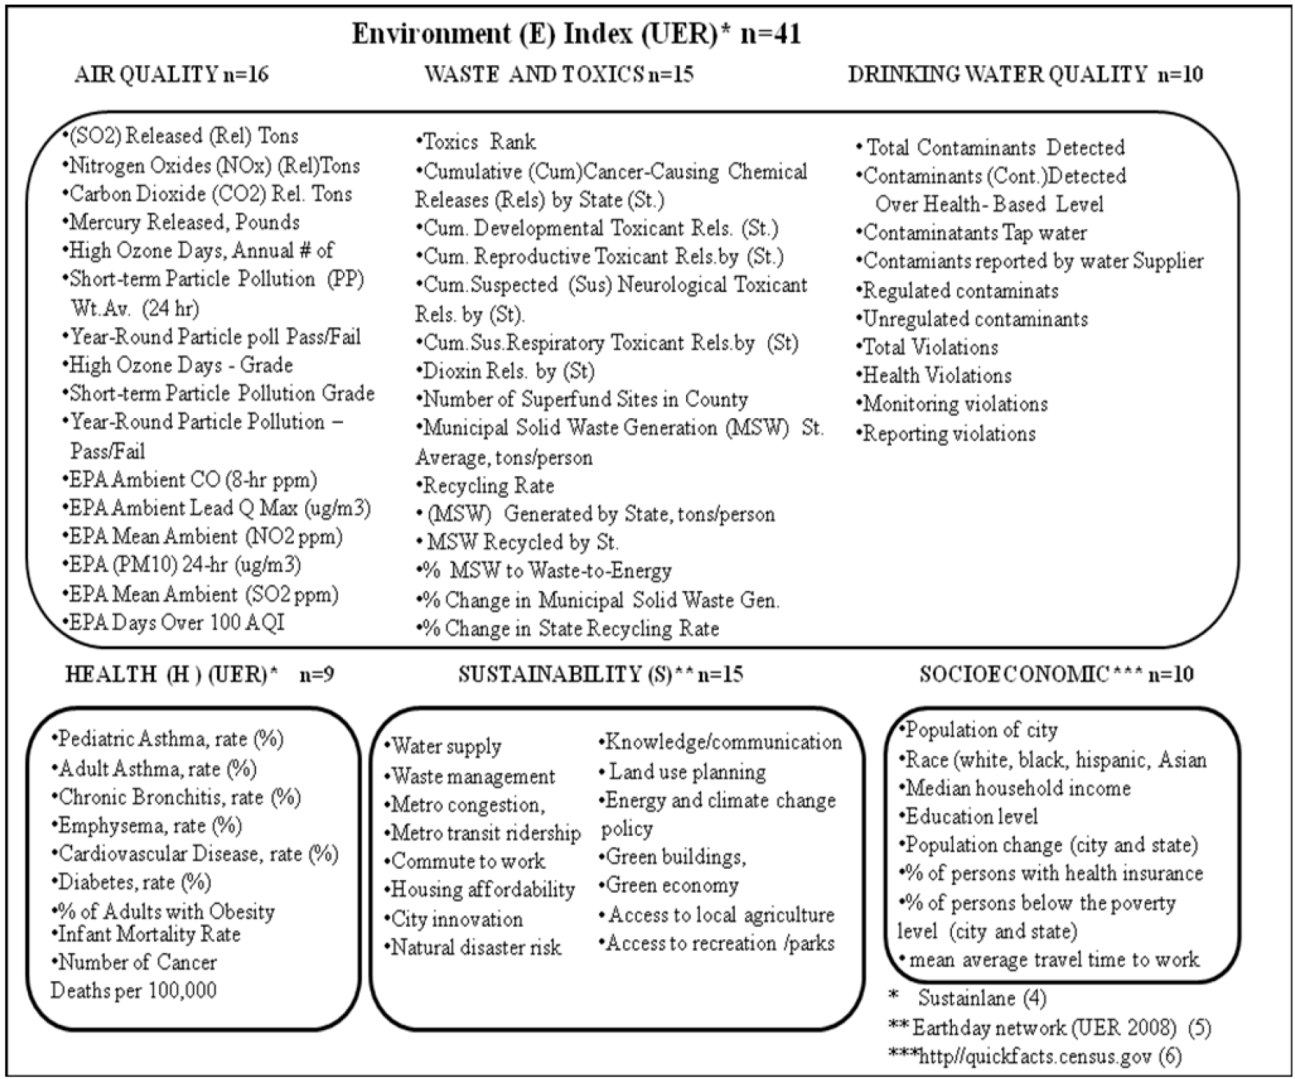
2.1. Derivation of E and H and S Indices

E Index was derived by averaging 3 separate scores for: air quality (e1), waste and toxics (e2) and water quality (e3). The H Index considered n= 9 (h) metrics. The S Index was derived by averaging 15 individual (s) metrics. Some of the S, H and E indice’s component (s) metrics had missing values. The missing values were not substituted with values so, in effect, this was the same as setting the missing metrics equal to the mean with non-missing metrics for that city (Figure 2).

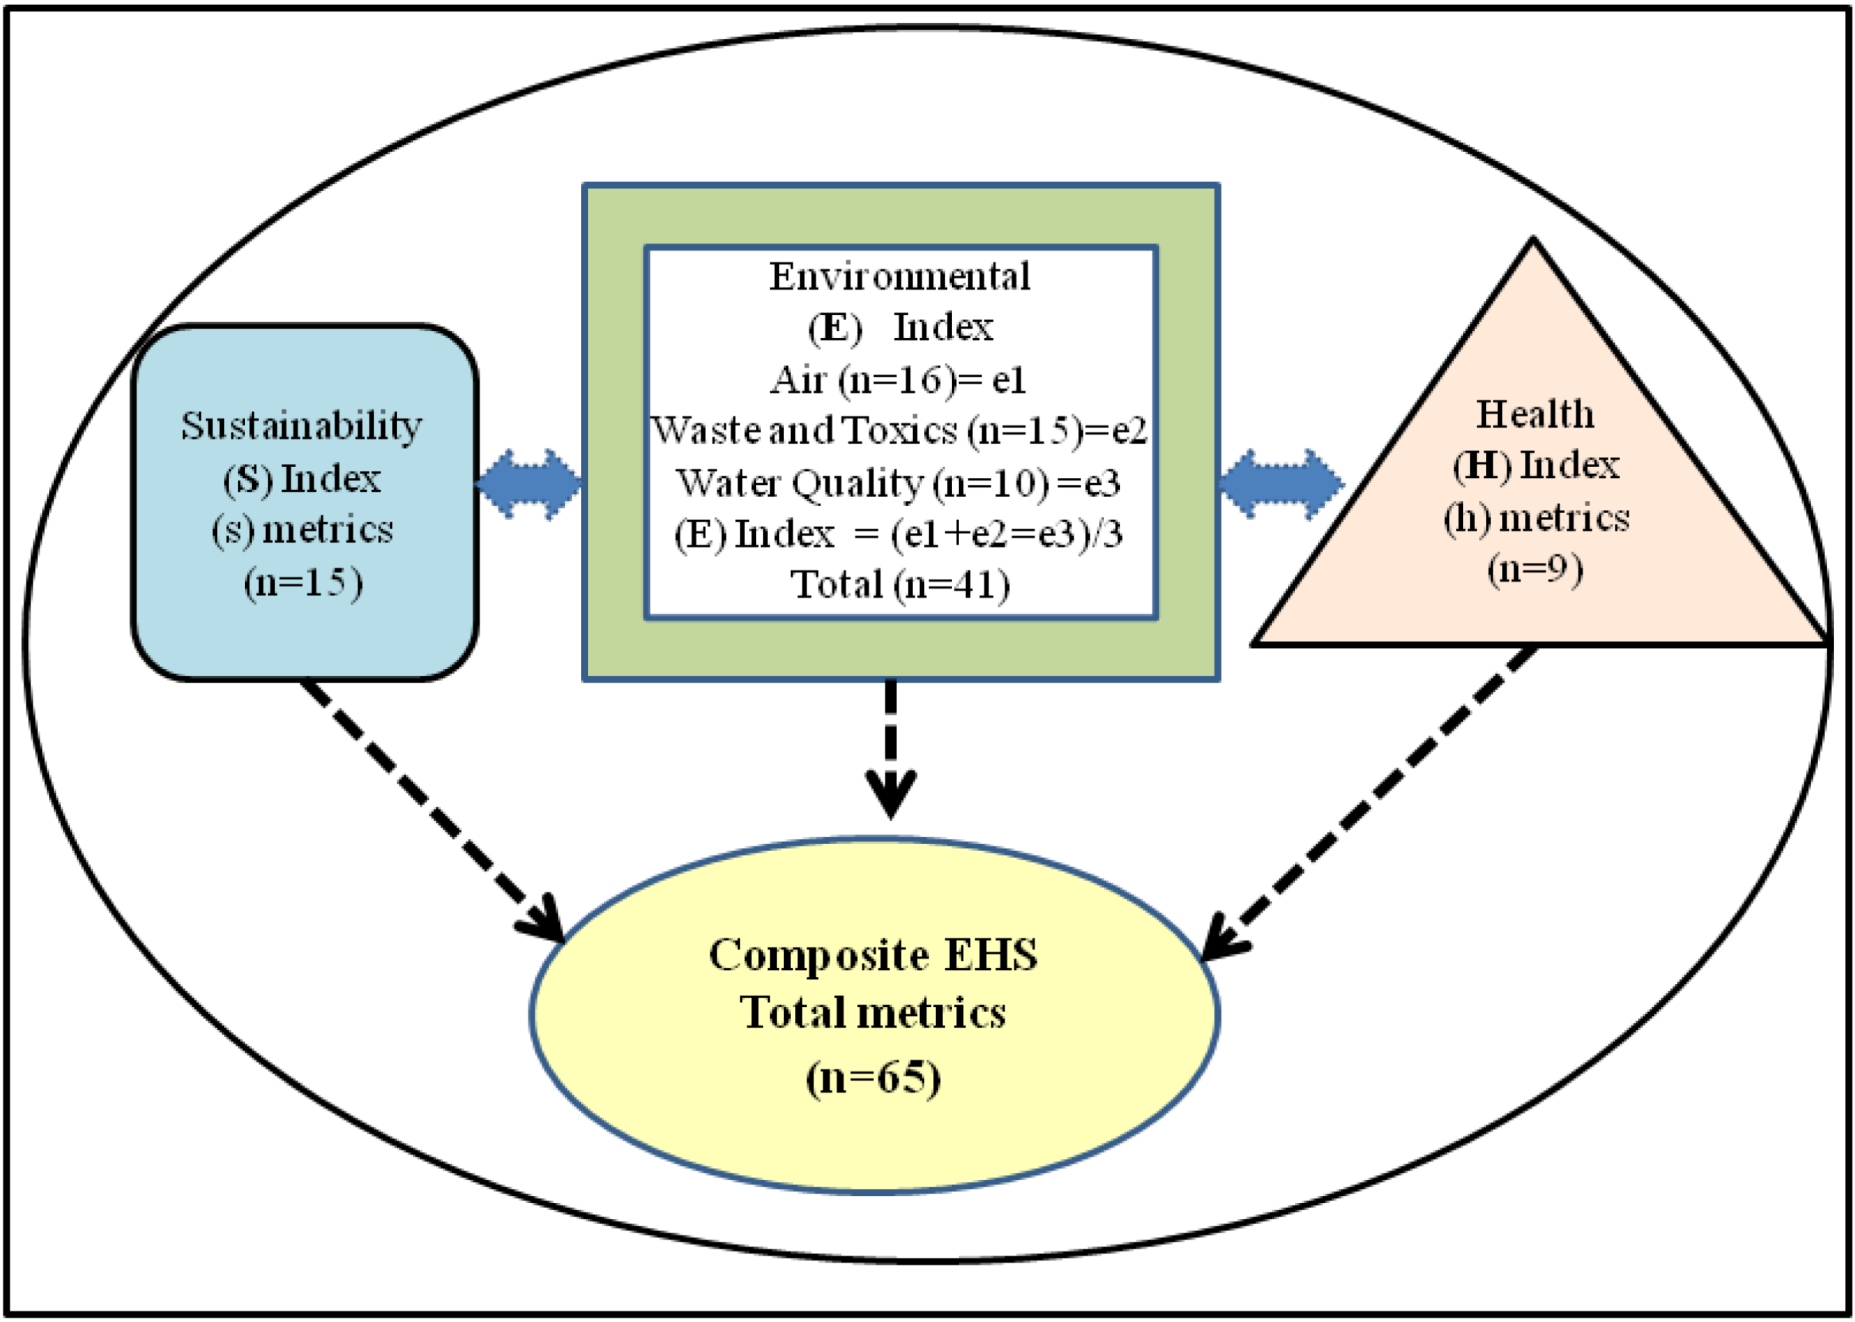
2.2. Normalization of the Scoring/Ranking and Derivation of the Integrated EHS Index

Scores or rankings extracted from the 2008 Urban Environmental Report (UER) and SustainLane differed. For example, SustainLane ranked cities from 1 to 50 while UER’s scoring convention used scores 1–5. For consistency all variables including those from the 2010 U.S. census were normalized by sorting the variable values from worst (lowest rank) to best (highest rank) and assigning ranks (R) calculating Sustainability 05 00789 i001 where Φ represents the cumulative normal distribution function; N = number of values that were ranked. Among groups of cities with the same variable value (i.e., ties), we calculated the average Z and assigned it to each city in the group. For each E, H and S Index, the mean of all normalized variables contributing to the Index was then itself normalized to create the final E, H, S Indices. Finally the integrated EHS Index was derived from E and H and S indices using the following formula;
Sustainability 05 00789 i002
where the notation Z(V) stands for the variable with the normalized scores for variable V. For a city, the mean of all normalized variables contributing to an index was set equal to the mean of the non-missing variable values. All calculations including the standard normalization procedure described above were performed using SAS version 9.2.

3. Results

3.1. Descriptive Statistics

Descriptive statistics (before normalizing) for the socioeconomic measures for the 50 cities are shown in Table 2. The total population represented by the various analyses was approximately 46.6 million people. The smallest and largest cities examined were Honolulu (337,256) and New York City (8,175,133), respectively. Cities with the greatest population gain over a ten year period (2000–2010) were Charlotte, North Carolina (+35.2%) and Fort Worth, Texas (+38.6%). In contrast, Detroit, Michigan and New Orleans, Louisiana lost population (−25.0% and −29.1%), respectively (Data not shown).
Table 2. Descriptive statistics of sociodemographic information.
MeanStd DeviationCV (%)MinMax
Population 933,7981,217,460130.3337,2568,175,133
% population change (city)6.411.94187-29.138.6
% population change (State)12.317.5661.4-0.635.1
% white 42.62616.0137.67.872.2
% black23.0818.9882.20.582.7
% hispanic 23.81418.34774.180.7
% Asian7.4689.152123149.1
% with High school diploma82.8325.7846.9867.496.9
% with College Degrees 31.4749.71430.911.855.1
median household income48,18113,05327.127,349108,032
Mean travel to work (min)24.7323.94315.917.839.2
% below poverty (city) 18.9166.048323.234.5
% below poverty (state) 14.3062.34816.48.618.5
% w/o health care16.934.4426.28.724.5
Except for “% city population change” where n = 48, data reported reflect analysis for 50 cities.

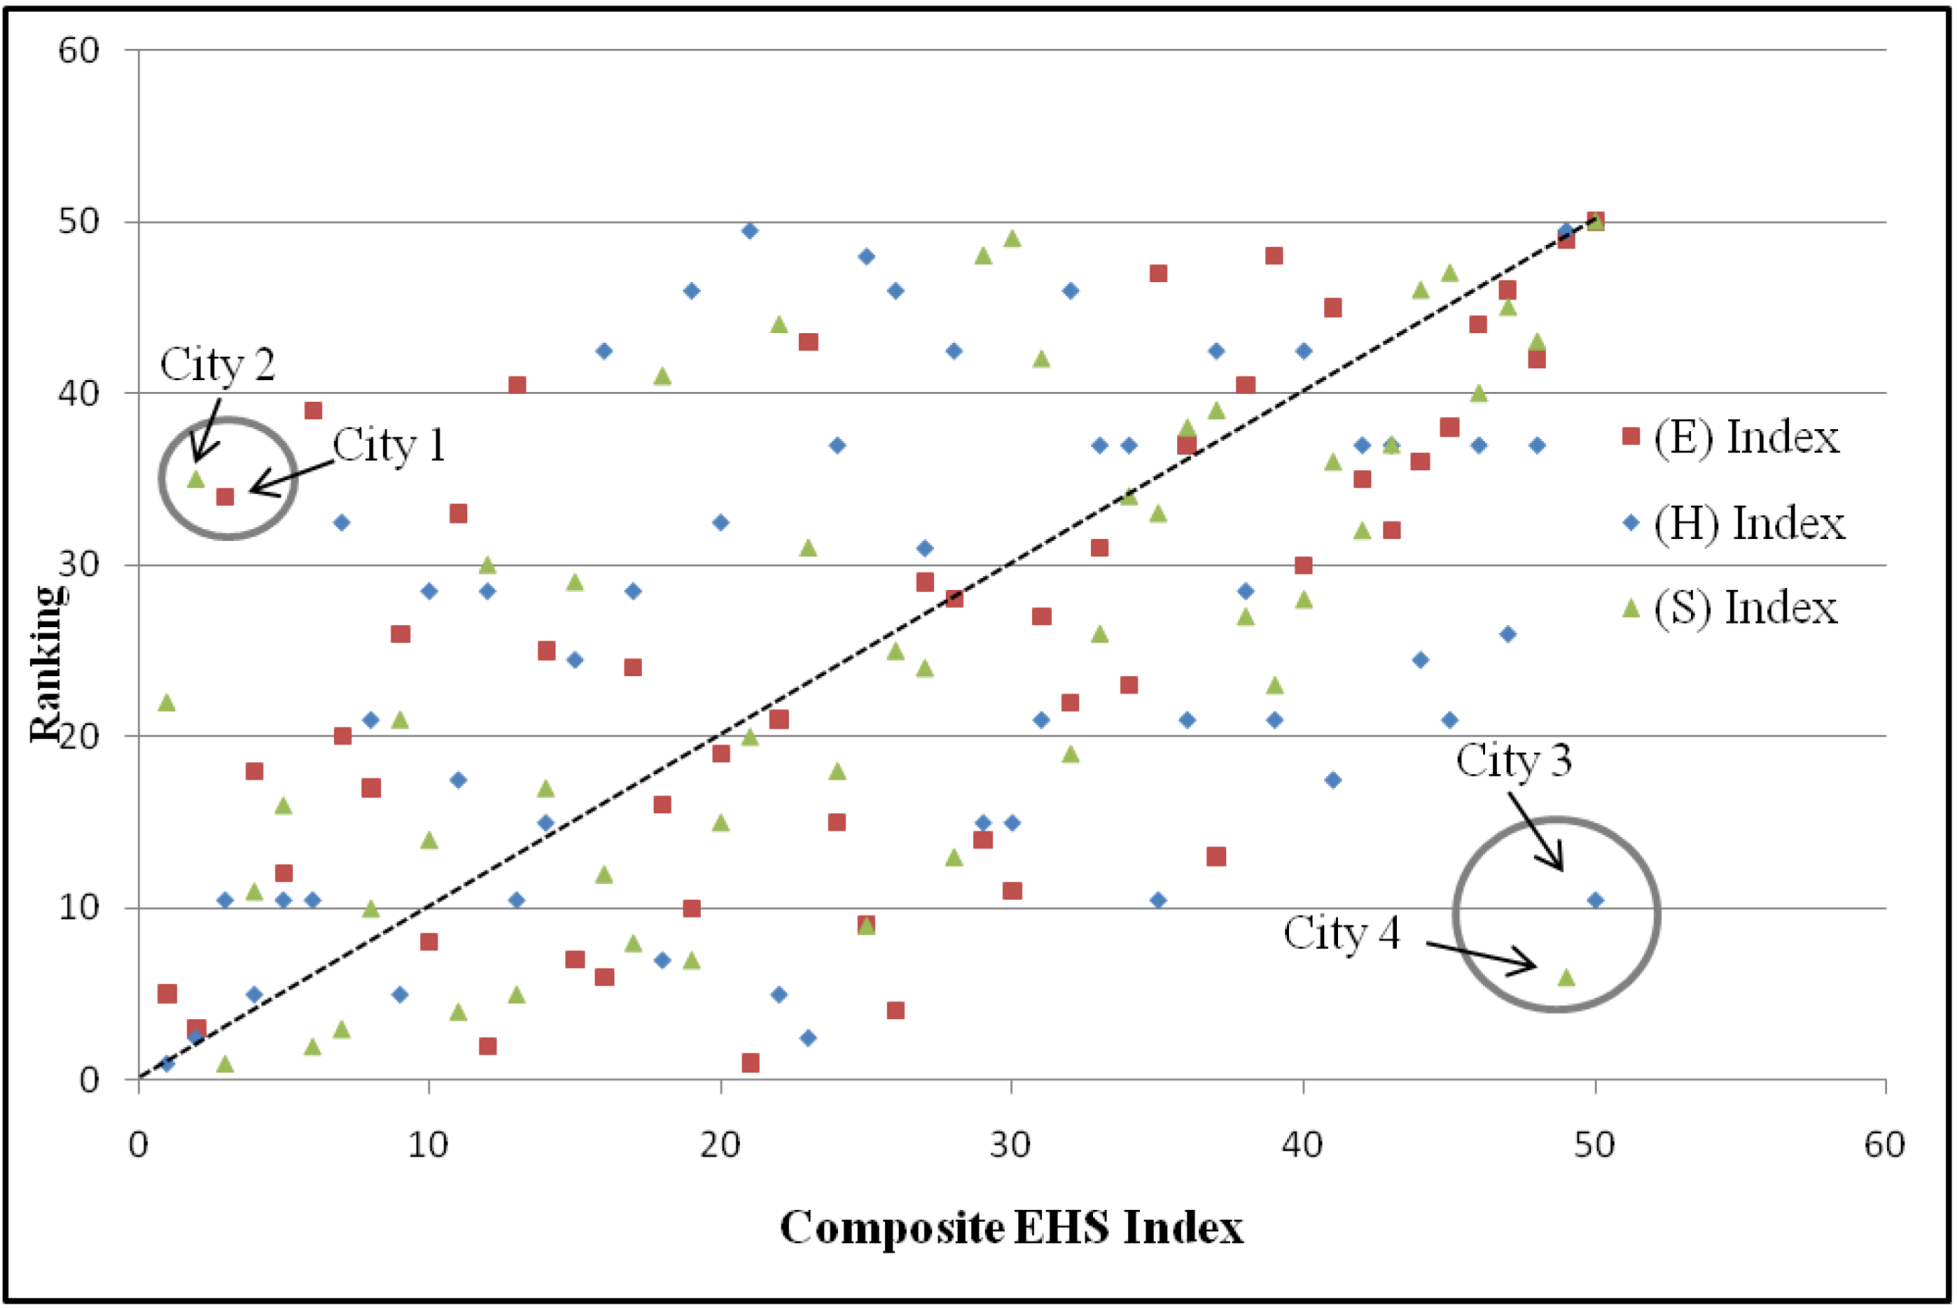
3.2. A City’s Rank Order Depends on the Index Used

Figure 3 is an example of how the rank order of the top 10 best performing cities (based on the S Index) change if those same cities are rank ordered based on an (EH) Index.
Figure 3. A City’s rank order depends on the Index used.
Sustainability 05 00789 g003
For example; using the ten best ranked cities (based on City’s S Index); three of the 10 top performing cities drop in ranking to the lowest 10 performing cities when the performance ranking is defined by the (EH) Index, (A higher rank is better).

3.3. Statistically Significant Correlations of Individual e, h and s Metrics E, H, S Indices and EHS Index with Socioeconomic Indicators

3.3.1. Integrated EHS Index

A higher (better) integrated EHS Index is significantly associated with those cities experiencing a higher city population gain (over the last 10 years), cities with a higher percentage of whites, (lower percentage of blacks), higher percentages of high school and college graduates, higher median household income, lower percentage of individuals living below poverty line. Correlation coefficients (Pearson) and p values are shown in (Table 3).
Table 3. Association between (s), (e) metrics, E, H and S indices and socioeconomic variables.
NegPos % City Population Change% State Population Change% White% Black% Asian% Hispanic% High School% College DegreesMean Travel To WorkMedian Household Income% Below Poverty City% Below Poverty Line in State% Without Health Ins.City Population 2010
*<= 0.05
**<= 0.005
***<= 0.0005
*****<= 0.00005
Variable
Recreation Parks0.230.160.47-0.330.39-0.190.520.39-0.070.51-0.55-0.47-0.290.02
City Innovation-0.33-0.200.100.080.34-0.130.170.400.290.150.07-0.26-0.310.20
Energy/Climate-0.08-0.040.30-0.160.41-0.140.360.560.150.38-0.28-0.17-0.150.07
Green Building0.00-0.020.08-0.080.37-0.090.220.570.340.30-0.15-0.17-0.140.05
Green Economy0.00-0.170.16-0.160.43-0.060.140.420.230.19-0.06-0.22-0.180.14
Housing Affordability0.130.08-0.080.18-0.460.14-0.15-0.38-0.34-0.420.210.280.200.10
Knowledge Communication-0.15-0.090.09-0.120.34-0.010.070.270.310.17-0.01-0.41-0.320.24
Metro Congestion-0.19-0.340.080.02-0.18-0.090.13-0.23-0.47-0.340.20-0.14-0.31-0.28
Metro Transit Rider-0.24-0.03-0.220.190.26-0.10-0.180.180.780.180.04-0.10-0.070.24
Natural Disaster Risk0.040.110.14-0.03-0.300.23-0.07-0.34-0.16-0.290.220.00-0.150.11
Planning Land Use0.00-0.020.08-0.280.350.160.120.450.320.33-0.14-0.11-0.060.23
Waste Management0.000.030.00-0.130.60-0.120.040.220.450.42-0.28-0.34-0.140.25
Water Supply-0.49-0.60-0.100.59-0.19-0.460.08-0.08-0.04-0.370.38-0.13-0.48-0.06
City Commuting-0.33-0.26-0.250.040.31-0.03-0.080.340.610.110.21-0.25-0.380.12
Local Food0.130.05-0.160.16-0.190.04-0.17-0.120.06-0.170.190.050.13-0.03
Air Quality 0.110.140.34-0.340.19-0.190.550.43-0.250.39-0.43-0.17-0.13-0.47
Waste Toxics0.030.010.27-0.280.18-0.200.400.280.090.33-0.27-0.37-0.46-0.25
Water Quality0.15-0.060.270.01-0.170.010.13-0.03-0.30-0.200.010.060.010.01
Health H Index0.500.560.15-0.320.110.320.030.02-0.190.23-0.270.080.48-0.01
Environmental E Index0.140.020.44-0.310.12-0.190.540.34-0.210.29-0.36-0.27-0.30-0.34
Sustainability S Index-0.17-0.210.08-0.020.43-0.100.170.420.410.200.01-0.37-0.410.24
EHS Index0.290.250.40-0.390.400.010.450.490.020.45-0.39-0.34-0.12-0.08
Correlations that are significant are shaded orange (if positive) and blue (if negative). Associations that were not statistically significant are shown in grey.
Table 4. Associations among individual (s) metrics.
NegPosRecreation ParksCity InnovationEnergy/ClimateGreen BuildingGreen EconomyHousing AffordabilityKnowledge CommunicationMetro CongestionMetro Transit RiderNatural Disaster RiskPlanning Land UseWaste ManagementWater SupplyCity CommutingLocal Food
*<= 0.05
**<= 0.005
***<= 0.0005
*****<= 0.00005
Variable
Recreation Parks0.220.330.270.26-0.220.26-0.090.050.120.230.33-0.26-0.01-0.28
City Innovation 0.560.550.74-0.470.74-0.100.44-0.010.510.390.110.65-0.24
Energy/Climate0.680.57-0.490.54-0.220.33-0.150.430.28-0.180.40-0.24
Green Building0.66-0.500.40-0.230.39-0.070.410.21-0.120.590.01
Green Economy--0.400.58-0.140.390.000.480.42-0.030.570.04
Housing Affordability-0.430.41-0.560.34-0.40-0.560.32-0.500.20
Knowledge Communication-0.070.34-0.150.430.35-0.080.53-0.16
Metro Congestion-0.650.26-0.14-0.450.45-0.09-0.02
Metro Transit Rider-0.220.330.58-0.110.510.00
Natural Disaster Risk -0.07-0.24-0.02-0.020.21
Planning Land Use0.26-0.170.480.01
Waste Management-0.170.25-0.20
Water Supply0.060.13
City Commuting-0.12
Local Food-
Correlations that are significant are shaded orange (if positive) and blue (if negative). Associations that were not statistically significant are shown in grey.

3.3.2. Environmental E Index

A higher (better) Environmental E Index is significantly associated with cities with higher percentages of: high school and college graduates, whites, (but lower percentage of blacks), lower percentages of persons; living below the poverty level and without health insurance (Table 3. )

3.3.3. Health H Index

A higher (better) Health H Index is significantly associated with those cities with a significantly higher population gain (over last 10 years), lower percentage; of blacks and persons without health insurance (Table 3).

3.3.4. Sustainability S Index

A higher (better) Sustainability S Index is significantly associated with those cities with higher percentages of Asians but lower percentage of persons: without health insurance and persons living below the poverty line (Table 3).

3.3.5. Associations Among Individual (s) Metrics

Most of the (s) metrics that contribute to the S Index are positively correlated with one another. The notable exception is housing affordability which is negatively correlated with most of the variables (Table 4).

3.3.6. Notable Associations Highlighting Racial, Income, Education Disparities

As the percentage of people living below the poverty line increases there were fewer opportunities related to access to parks and recreation, poorer air quality and a lower (worse) H Index. Cities with increasing percentages of blacks not only had fewer opportunities and access to parks and recreation but poorer air quality. A low H Index was associated with cities with a greater percentage of blacks. In contrast, those cities with higher percentage of persons with college degrees had a significantly higher E Index and in particular better air quality (a component of the E Index). Cities with the highest population gain (over the last ten years) were more likely to have an inadequate water supply (Table 3).

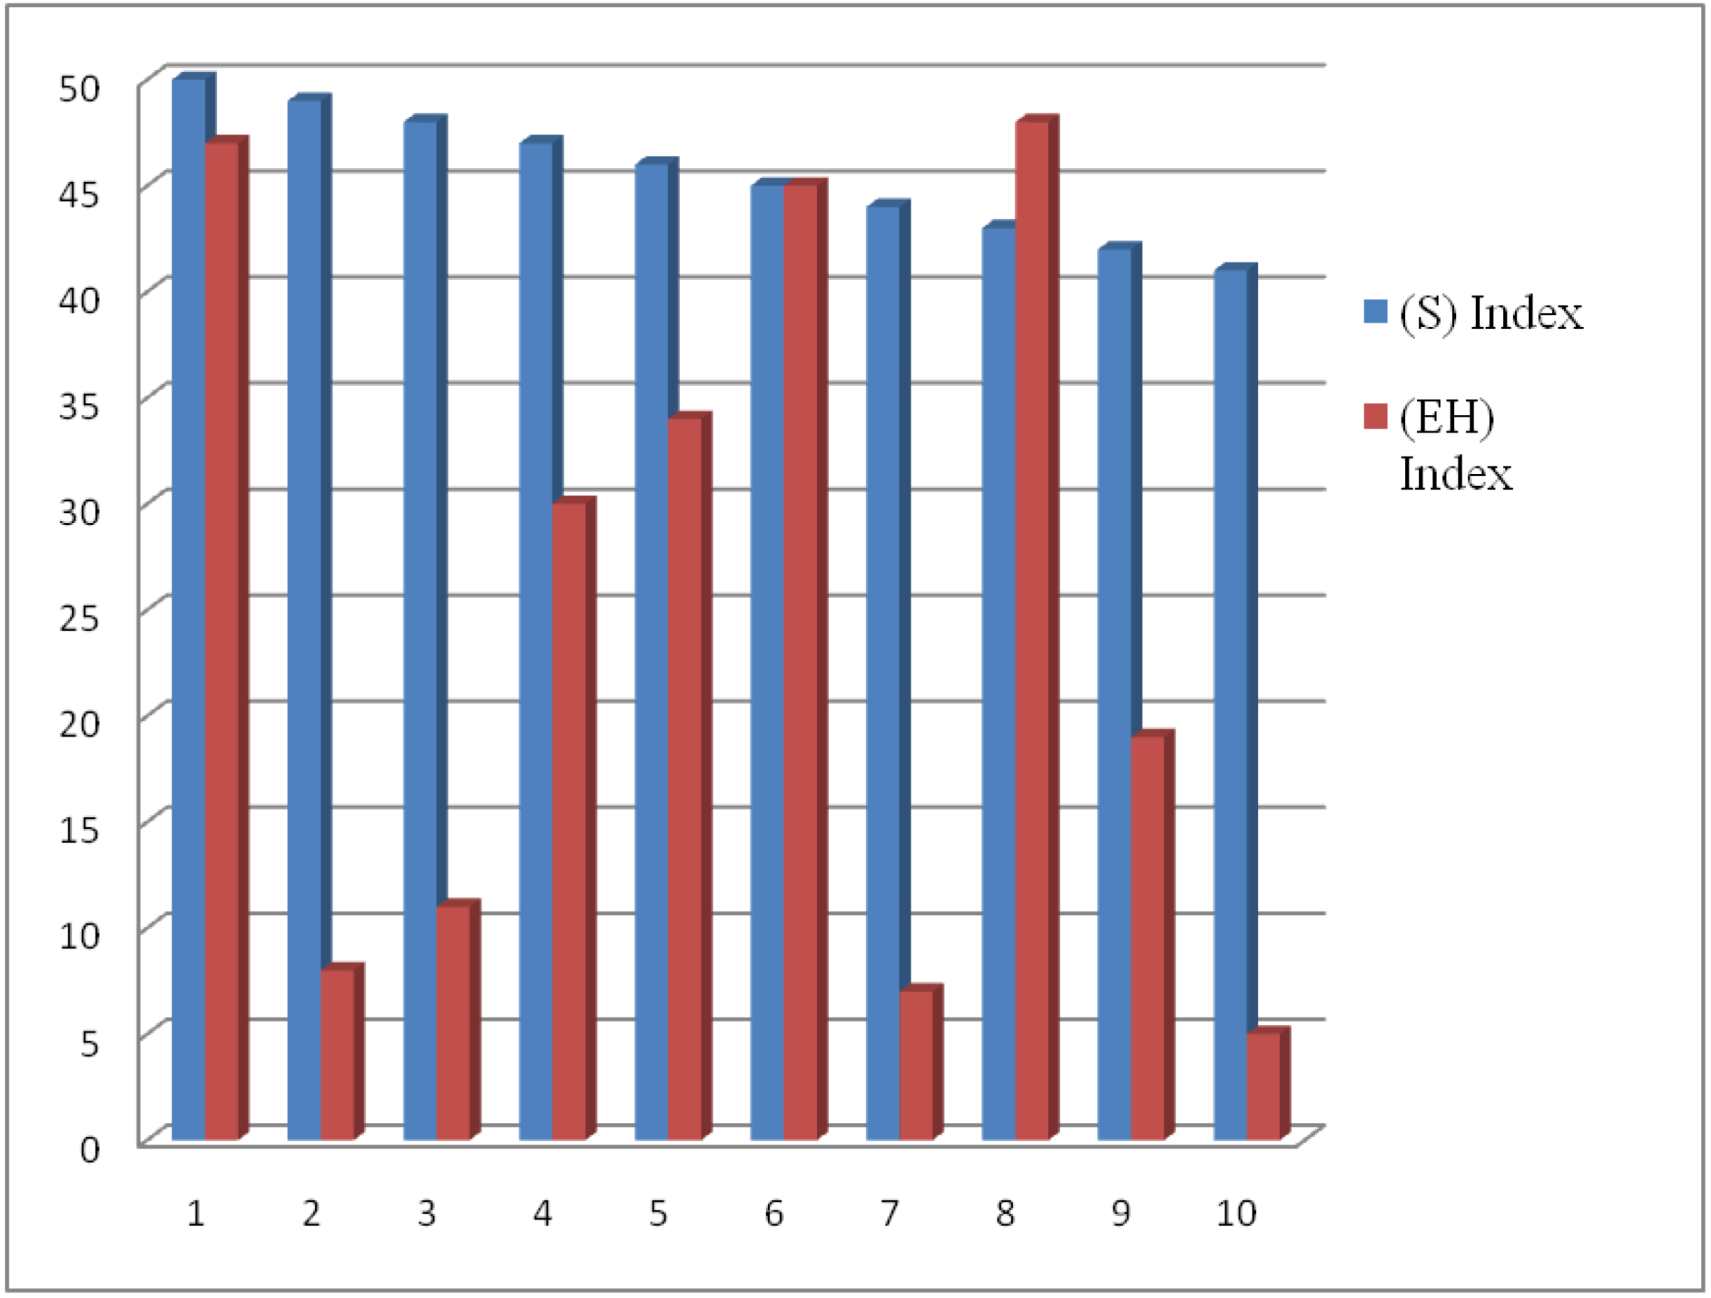
3.4. Deviation of E, H and S Indices and Relative Impact on the EHS Index

Figure 4 shows how the construction of the integrated EHS Index makes more difference for some cities, i.e., those cities that are farther (vertically) from the bulk of points than others, (i.e., those that are close to the X = Y line). The E indices (red squares) in general, are most unusual or inconsistent relative to the bulk of S and H indices. The graphic shows how individual E, H and S indices furthest from the X = Y line can be used by decision makers to identify those cities for which improvements in E, S and H indices would have the most relative impact. For example, Cities # 1 and 2 have a low integrated EHS Index (i.e., fall within the lowest 10 cities); yet rank highest with regard to the E Index (city 1) and or S Index (city 2). Thus, decisions aimed at improving H and or S metrics for city 1 would have the greatest impact on improving the overall integrated EHS Index ranking. Similarly, city (3 and 4) with a high performance ranking (based on the integrated EHS Index) would best benefit from policy decisions aimed at improving the E and S Index for city 3 and E and/or Health Index for city 4.
Figure 4. Identification of those cities which could make the largest stride towards improvement in the integrated composite EHS Index with policies aimed at improving specific (e) (h) (s) metrics components of the E, H and S indices.
Sustainability 05 00789 g004
Circled cities have divergent indexes relative to the 50 cities examined. For example, Cities 1 and 2 have high ranks for one index and low ranks for the other two indexes. Cities 3 and 4 have high ranks for two Indexes but low ranks for one Index.

4. Discussion

According to a recent conference of mayors’ economic report [8] metropolitan areas are home to 83.7% of the U.S population, account for 89.9% of wage and salary income, represent 85.8% of jobs, and produce 90.7% of real Gross Domestic Product. Thus, cities provide us with an excellent opportunity to evaluate the impact of policy decisions and to more comprehensively understand the interdependencies and interactions among the economic, environmental and social factors [9].
Here, we used extant data from SustainLane [4] and Earth Day Network’s Urban Environment report [5] and the 2010 U.S. census data [6] for 50 U.S. populous cities. We used these data to derive performance rankings based on E, H and S indices and an integrated EHS Index to evaluate interrelationships of these indices in the context of socioeconomic data. Germane to policy decisions, we applied an analytical tool to identify those cities for which improvement in one of the E, H, or S indices would most significantly improve their overall performance based on the integrated EHS Index.
We developed matrices that revealed linear associations between the integrated composite EHS Index and race, education and income level. Those cities with a higher (better) integrated EHS Index were cities with significantly higher percentages of; whites and Asians (lower percentage of blacks), persons with college degrees, higher income and lower percentage of persons living below the poverty line. Of particular environmental note were significant associations between poorer air quality and cities with a higher percentage of; blacks, persons living below the poverty level, persons without high school diploma, and higher city population. These results are consistent with many studies conducted over the past decade revealing associations between public health metrics and a wide range of environmental factors including transportation systems, land use, parks and other open space, housing, and energy production [10]. These results are also consistent with other studies showing that higher income inequality within the U.S is often associated with unequal distribution of several morbidity and mortality rates and is often higher for blacks compared to whites even when comparing within similar income levels [11]. Interestingly, Ludwig et al. [12] recently reported that individuals moving from high-poverty to lower-poverty neighborhoods lead to long term improvements in an adult’s physical and mental health and subjective well-being, despite not affecting economic self-sufficiency. That is, subjective well-being was more strongly affected by changes in neighborhood economic disadvantage than racial segregation.
Employing GIS techniques and linking spatial patterns to U.S. EPA’s Toxic Release Inventory (TRI) [13], Abel [14,15] evaluated associations between distance from environmental health hazard sources and socially vulnerable neighborhoods, with potential health inequities. These case studies suggest that minority and low income residents have disproportionately higher potential air pollution exposures compared to exposures averaged across metropolitan St. Louis, MO and Seattle, WA. Our study, along with the Lynch [11], Abel [14,15] and Ludwig [12] studies collectively argue for the importance of continued efforts to connect social and environmental factors to measure and track equity related to environmental health disparities [16].
Importantly, from a public policy point of view, cities with the highest population gains (as measured over a ten-year time span) were more likely to have an inadequate water supply and those cities with the highest populations had more city congestion and poorer air quality. In response to housing and commercial boom, a diverse planning group (C40) assists 59 major cities conserve water and combat climate change and development of a list of best practices based on case studies of varied strategies employed by cities including a water-efficiency program [17]. In fact, municipalities worldwide are exploiting a host of creative solutions to reduce energy consumption, water use, waste and emissions [18].
Our analyses demonstrate that a more holistic community assessment can be obtained by integrating diverse data sets that typically are viewed in isolation. Further, by focusing on individual E, H and S indices in the context of their relative contribution to an integrated EHS Index, cities can both gauge and compare their overall performance ranking, while identifying those (e), (h) or (s) metrics which would most dramatically improve their overall performance ranking based on an integrated EHS Index.

4.1. Limitations of Study

There are several limitations to our study. Although we observed statistically significant associations between sociodemographic features of the cities and the EHS Index, causality is limited because it was based solely on bivariate analyses. Further, other variables of importance were not considered e.g., city crime rate, annual energy consumption, unemployment rate, and availability of social and community services. Miranda et al. [19] argue that all policy decisions should include an analysis of social impact assessments. Secondly, the associations observed between S, H and E indices and their component metrics are likely more complex than the simple representation of the interconnections shown in Figure 2. Carlson [20] for example, suggests that when considering relationships e.g., between built environment and health, that the individual measurements that go into the analyses may not be directly correlated but instead may be correlated through a series of feedback loops that may regulate risk in different ways and different contexts. To understand how a change in one metric may result in changes of other metrics in other categories requires a more thorough evaluation of the processes that link these components.
Some of the data sources limitations are detailed in a paper by Lobdell et al. [21] who are developing an Environmental Quality Index for all 3141 U.S. counties. Briefly, these difficulties relate to finding data sources that track and present data at the same level of spatial and temporal aggregation. Earth Day Network’s methodology [5] indicates that, in some cases, complete data were not available and the scores used in the assessment analyses were not always presented at the city level, but rather at county, state or other relevant subunit and that defining clear city boundaries is not always possible. Our analyses do not take into consideration the multivariate and time-varying interdependencies and interactions between environment, sustainability and health metrics, nor did we evaluate important associations between component health and environmental metrics such as asthma rates and air quality. Such analyses might help define linkages between exposure and health outcomes measures. Further, we did not critically evaluate the approaches used by SustainLane and Earthday Network to develop their individual (e) (h) and (s) components and rankings. While this is an important analysis to conduct, it was beyond the scope of the current paper.

4.2. Strengths of Study

There currently is no single agreed upon, benchmarking approach, nor consistent set of metrics or indicators, that would allow communities to either track improvements or compare them with others with regards to short or long term sustainability goals. For example, Tanguay [22] in his analysis among 17 urban sustainability studies, reports the frequency of use of over 185 sustainability indicators. Niemeijer and Degroot [23] argue that indicators should be used only when it is clear that this can help inform decision-making. Here, we propose a benchmarking approach to allow cities to compare and rate their performance based on a broad array of environmental and sustainability and health metrics, many recommended by the WHO European Healthy Cities Network (WHO-EHCN) [24]. Our analyses demonstrate how socioeconomic, environmental, health and sustainability data can, when taken together with the expertise and local knowledge of community members, can be used to defend through scientific evidence, the impact of various policy changes. Bhatia and Corburn [25] argue that such assessments can be used to increase public awareness, encourage routine monitoring of more broad based determinants for health advocacy and accountability. These approaches may be used to track improvements made over time and/or to compare broad based indicators with those of other communities. Such comparisons could incentivize communication and sharing of successfully implemented policy decisions involving changes in specific environmental, health and sustainability measures.

5. Conclusions

Research over the past decade has revealed connections between public health and a wide range of environmental factors such as transportation systems, land use, parks and other open space, housing, and energy production. The integrated data analyses presented here include over 65 measures across broad environment, health, and sustainability and socioeconomics categories. We have demonstrated how performance rankings of 50 populous U.S. cities are highly dependent on the metrics used in the assessment. Our analytical approach help identify those cities which could make the largest strides toward improving a broader-based integrated EHS Index with polices aimed at improving specific environmental, health and sustainability metrics. Further, despite our simplistic analyses, our study sheds light on a number of important socioeconomic inequalities associated with poorer performing cities’, data consistent with studies applying more sophisticated analyses. Our study draws attention to the significant interconnections between environmental, health, sustainability and sociodemographic factors, using individual and aggregated extant data and, thus, furthers the understanding of the potential positive or negative impact that infrastructure and land use planning decisions might have on these metrics.

Acknowledgements and Disclaimer

The authors are grateful to Urban Environment Report project lead, Emily Hostetter, Director of Research and Technology at Earth Day Network and SustainLane’s W. Kalenzig’s vision and data team. The work was supported in part under contract number EPA-D-07-109 to Westat, Inc., Rockville MD. The perspectives expressed in this article do not necessarily reflect the views or policies of the U.S. Environmental Protection Agency. Mention of trade names or commercial products or linked web sites or any material contained on any linked web site does not constitute agency endorsement or recommendations for use.

Conflict of Interest

The Authors declare no conflict of interest.

References

  1. Committee on Incorporating Sustainability in the U.S. Environmental Protection Agency; National Research Council. Sustainability and the U.S. EPA; The National Academies Press: Washington, DC, USA, 2011. Available online: http://www.nap.edu/openbook.php?record_id=13152 (accessed on 13 February 2013).
  2. Smart Growth. Available online: http://www.epa.gov/smartgrowth/ (accessed on 13 February 2013).
  3. County Health Rankings. Available online: http://www.countyhealthrankings.org (accessed on 13 February 2013) .
  4. Kalenzig, W. The SustainLane U.S. City Rankings. How Green is Your City? New Society Press: British Columbia, Canada, 2007; pp. 21–165. [Google Scholar]
  5. Urban Environment Report. Available online: http://files.earthday.net/UER/report/ (accessed on 13 February 2013).
  6. State & County QuickFacts. Available online: http://quickfacts.census.gov (accessed on 13 February 2013.
  7. Earth Day Network—Urban Environment Report Methodology. Available online: http://files.earthday.net/UER/report/pdfs/EDN_UER_Methodology_121206.pdf (accessed on 13 February 2013).
  8. Metro Economies Report Index. Available online: http://usmayors.org/metroeconomies/ (accessed on 13 February 2013).
  9. Fiksel, J. Sustainability and resilience: Toward a systems approach. Sustain. Sci. Pract. Pol. 2006, 2, 14–21. [Google Scholar]
  10. Diez Roux, A.V.; Mair, C. Neighborhoods and health. Ann. NY Acad. Sci. 2010, 1186, 125–145. [Google Scholar] [CrossRef]
  11. Lynch, J.; Smith, G.D.; Hillemeier, M.; Shaw, M.; Raghunathan, T.; Kaplan, G. Income inequality, the psychosocial environment, and health: comparisons of wealthy nations. Lancet 2001, 358, 194–200. [Google Scholar]
  12. Ludwig, J.; Duncan, G.J.; Gennetian, L.A.; Katz, L.F.; Kessler, R.C.; Kling, J.R.; Sanbonmatsu, L. Neighborhood effects on the long-term well-being of low-income adults. Science 2012, 337, 1505–1510. [Google Scholar]
  13. Toxics Release Inventory (TRI) Program. Available online: http://www.epa.gov/tri/ (accessed on 13 February 2013).
  14. Abel, T.D. Skewed riskscapes and environmental injustice: A case study of metropolitan St. Louis. Environ. Manage. 2008, 42, 232–248. [Google Scholar] [CrossRef]
  15. Abel, T.D.; White, J. Skewed riskscapes and gentrified inequities: Environmental exposure disparities in Seattle, Washington. Am. J. Public. Health 2011, 101, S246–S254. [Google Scholar] [CrossRef]
  16. Payne-Sturges, D.; Gee, G.C.; Crowder, K.; Hurley, B.J.; Lee, C.; Morello-Frosch, R.; Rosenbaum, A.; Schulz, A.; Wells, C.; Woodruff, T.; et al. Workshop summary: Connecting social and environmental factors to measure and track environmental health disparities. Environ. Res. 2006, 102, 146–153. [Google Scholar] [CrossRef]
  17. Biello, D. How green is my city. Sci. Am. 2011, 305, 66–69. [Google Scholar] [CrossRef]
  18. Fischetti, M. The Efficient City. Sci. Am. 2011, 305, 74–75. [Google Scholar] [CrossRef]
  19. Miranda, M.L; Mohai, P.; Bus, J.; Charnley, G.; Dorward-King, G.E.; Foster, P.; Munns, W. Human-Ecological Interconnections: Policy Concepts and Applications. In Interconnections Between Human Health and Ecological Integrity; Digiullio, R., Benson, W., Eds.; Setac Press: Pensacola, FL, USA, 2002; pp. 15–42. [Google Scholar]
  20. Carlson, C.; Aytur, S.; Gardner, K.; Rogers, S. Complexity in built environment, health, and destination walking: A neighborhood-scale analysis. J. Urban Health 2012, 89, 270–284. [Google Scholar] [CrossRef]
  21. Lobdell, D.T.; Jagai, J.S.; Rappazzo, K.; Messer, L.C. Data sources for an environmental quality index: Availability, quality, and utility. Am. J. Public Health 2011, 101, S277–S285. [Google Scholar] [CrossRef]
  22. Tanguay, GA.; Rajaonson, J.; Lanoie, P. Measuring the sustainability of cities: An analysis of the use of local metrics. Ecol. Indicat. 2010, 10, 407–418. [Google Scholar] [CrossRef]
  23. Niemeijer, D.; De Groot, R.S. A conceptual framework for selecting environmental indicators sets. Ecol. Indicat. 2008, 8, 14–25. [Google Scholar] [CrossRef]
  24. Webster, P.; Sanderson, D. Healthy cities indicator—A suitable instrument to measure health? J. Urban Health 2012. [Google Scholar] [CrossRef]
  25. Corburn, J.; Bhatia, R. Lessons from San Francisco: Health impact assessments have advanced political conditions for improving population health. Health Affair 2011, 30, 2410–2418. [Google Scholar] [CrossRef]

