1. Introduction
In Hardin’s original essay [
1], self-interest drives over-consumption of the resource—a common pasture, in his example—to the detriment of all. Over the last half-century, the tragedy of the commons has been a very useful model for understanding the degradation of many common-pool resources, including natural resources (e.g., fossil fuels, atmosphere, fisheries) as well as manmade resources (e.g., social welfare, health care, the Internet). The concept spurred scientific research, as well as broader communication about environmental degradation. On the other hand, Hardin’s model also served to justify the privatization of some common resources [
2], when in fact, even under private ownership, other factors, such as the discount rate, can incentivize overexploitation of resources [
3].
In Hardin’s basic model of the shared commons where herdsmen graze their cattle, his main point was to illustrate the tension between group and self-interest—the benefits of overgrazing were individualized while the costs of overgrazing were shared. Hardin’s model has been repeatedly discussed as overly simplistic [
4], although it seems likely this was Hardin’s intent, and surely some of the model’s success is due to its simple elegance.
In his common pasture model, Hardin [
1] was not explicit about a very important nuance of the tragedy of the commons. Hardin writes, “As a rational being, each herdsman seeks to maximize his gain.” In his model of the commons, each herdsman contributes to overgrazing the commons: “…the rational herdsman concludes that the only sensible course for him to pursue is to add another animal to his herd. And another; and another…this is the conclusion reached by each and every rational herdsman sharing the commons”. In the section on pollution, Hardin goes on that, “the rational man finds that his share of the cost of the wastes he discharges into the commons is less than the cost of purifying his wastes…Since this is true of everyone, we are locked into a system of ‘fouling our own nest,’ so long as we behave only as independent, rational, free-enterprisers”.
Later in essay, however, when Hardin is discussing human population growth, he notes: “People vary. Confronted with appeals to limit breeding, some people will undoubtedly respond to the plea more than others. Those who have more children will produce a larger fraction of the next generation than those with more susceptible consciences. The differences will be accentuated, generation by generation”.
This pattern of extreme asymmetry Hardin referred to is evident in many common-pool resources when it comes to who or what consumes them. An analogy can be found in food web theory, where the recognition of “keystone species”—a species that has a disproportionate effect on the environment relative to its abundance or biomass—changed our understanding of ecology [
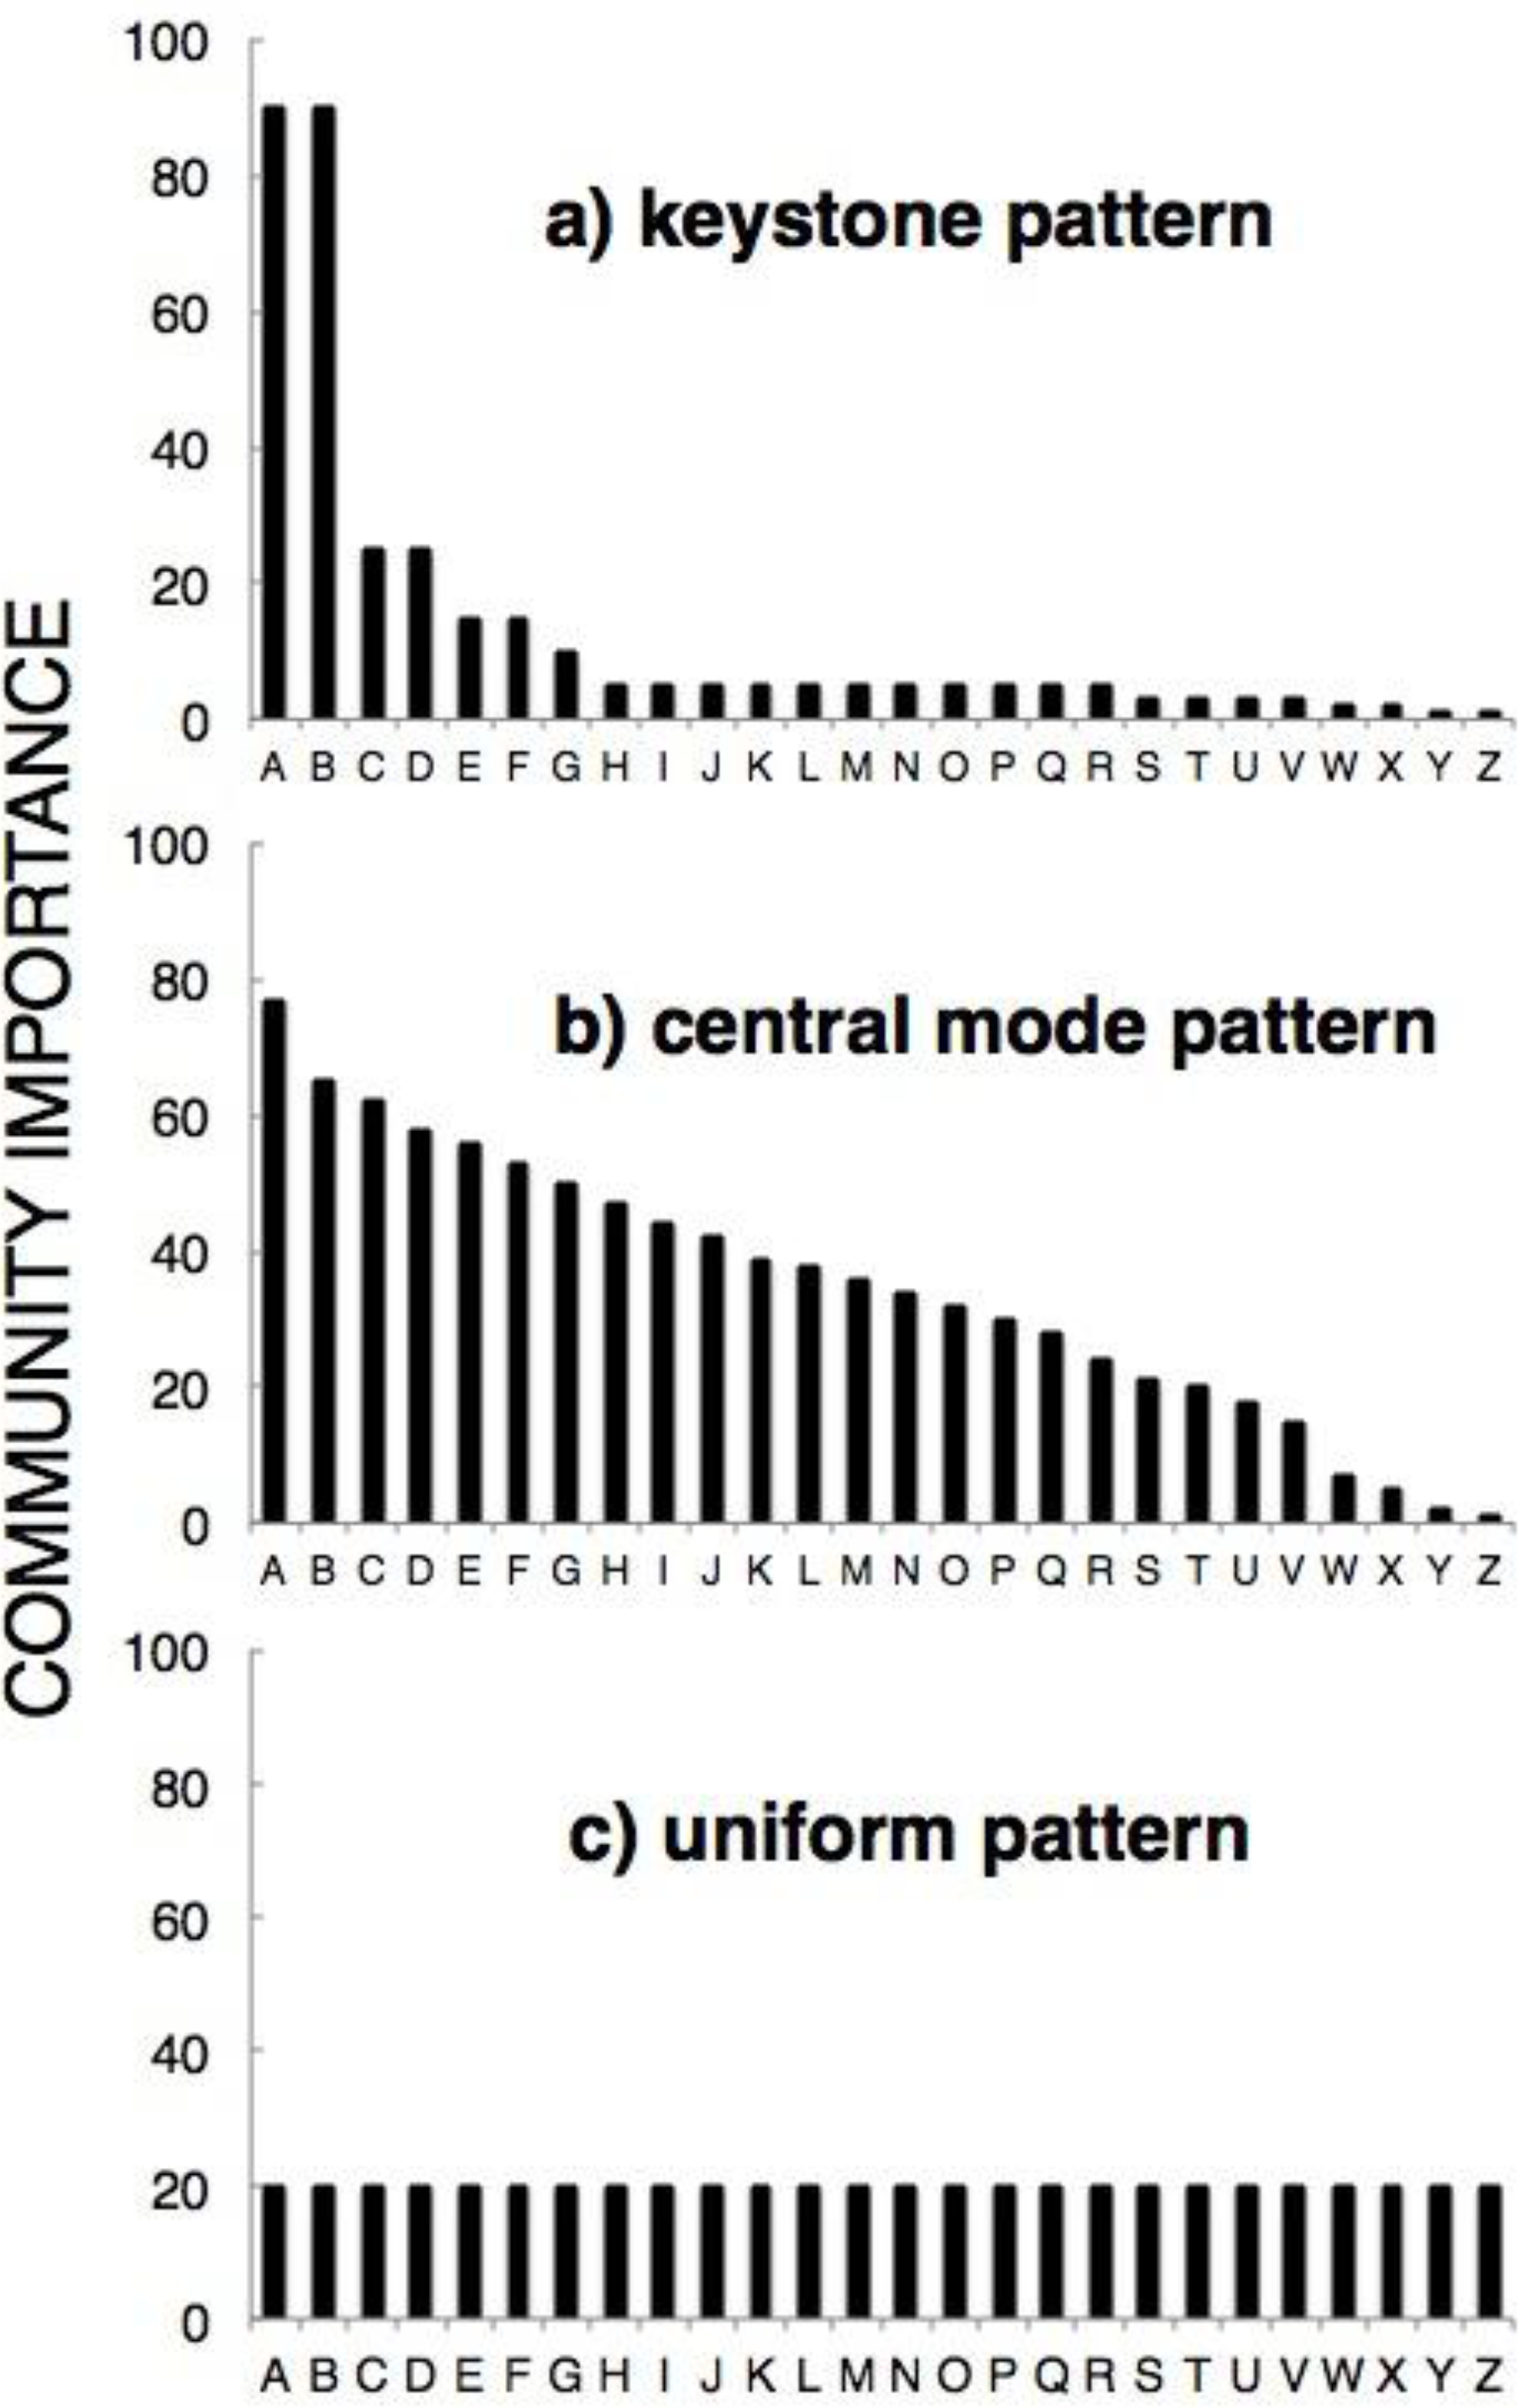
5]. If a keystone species is eliminated from an ecosystem, we can often expect a dramatic shift. The important thing here is to note the keystone pattern as it compares to other patterns of community importance present in food web theory (
Figure 1). In Hardin’s model of the herdsmen and shared pasture, where “each and every rational herdsman” contributes to overgrazing, resource consumption is similar to the uniform pattern in food web theory (
Figure 1c), while contributions to human overpopulation or greenhouse gas emissions might look more like the central mode or even the keystone pattern (
Figure 1a, b), in which certain humans contribute more to the social dilemma than others.
In this paper, we will provide examples to show that extreme asymmetries—where some consumers disproportionately affect the resource compared to others—are prevalent in contributions to tragedies of the commons. We will demonstrate that these patterns of asymmetry have been frequently underappreciated by conservation initiatives and investments. Finally, we will make some recommendations regarding how to reconcile conservation with patterns of asymmetry.
Figure 1.
Expected distributions of community importance values (percent of species lost due to the removal of the species) based on keystone species model and food web theory [adapted from 6].
Figure 1.
Expected distributions of community importance values (percent of species lost due to the removal of the species) based on keystone species model and food web theory [adapted from 6].
2. A Few Cases of Asymmetrical Contributions to the Tragedy of the Commons
In many classic examples of ‘the tragedy of the commons’, patterns of asymmetry prevail. Asymmetry in contributions to the tragedy of the commons can result from a number of different motivations, and we do not attempt to provide a comprehensive typology here. However, causes could be classified under asymmetrical characteristics of the resource or asymmetrical characteristics of the consumers, or a combination of both.
Asymmetrical availability of resources is quite straightforward—some regions have much greater reserves of freshwater, some have greater swaths of forests, and some have much richer fishing grounds. On the other hand, certain fishermen might be more adept at catching those fish than others are (in fact, fish catches are often highly asymmetric between boats, which is why, when catch shares have been introduced, they are most often based on previous catch histories [
7]). The reasons for asymmetrical characteristics of consumers themselves are vast, including differences in access to capital, access to information e.g., [
8], as well as differences in “conscience,” which Hardin discussed in his essay, and which have been described in work on social preferences (e.g., Social Value Orientation [
9]). The following examples demonstrate asymmetrical contributions to the tragedy of the commons, although we admit that we cannot enumerate the full suite of motives for why these asymmetries prevail.
2.1. The Case of “Headend” and “Tailend” Users of a River
For an example of an outcome that is driven by asymmetry in the availability of the resource itself, consider the asymmetries in water use than can arise for consumers along a river. As headend users have first access to the water, they often consume more than downstream users. This situation can lower overall agricultural productivity, which was observed in the Thambesi irrigation system in Nepal, where headenders grew water-intensive rice during the pre-monsoon season, which left tailenders without sufficient water for cultivation. Based on that system, Ostrom and Gardner [
10] built a simple, two-agent bargaining model and showed that if users had grown a less water-intensive crop like wheat, a much larger area could have been irrigated. Downstream users also had fewer incentives to provide labor to maintain the shared irrigation system, and the model also demonstrated that headenders and tailenders could achieve a mutually beneficial water-for-labor exchange if headenders used less water, and, in exchange, tailenders provided more labor to maintain the irrigation system.
Janssen
et al. [
11] expanded on this work by constructing an analogous game in the laboratory. They found that subjects downstream were able to indirectly punish upstreamers in subsequent rounds by investing less in the “infrastructure” for the provision of the common pool resource. They also found that introducing communication led to improved coordination on extraction levels and investment levels. Asymmetry in extraction may be perceived as fair when there is the opposite asymmetry in investment. Elsewhere Janssen
et al. [
12] compared results of asymmetric commons dilemmas played in the laboratory by small groups of U.S. college students and rural villagers at field sites in Colombia and Thailand. In these games, five participants decided how much to invest in shared infrastructure and then took turns extracting the resource in an established order, again with headenders consistently having first access to the resource. The college students were given the opportunity to communicate during the course of the game, which led to greater coordination on investment and extraction levels than at the field sites, where communication was precluded and investment declined slightly over the course of the game. However, the following qualitative results were robust across contexts: headenders extract more of the resource than tailenders, and that more inequality of extraction in a round led to less investment in infrastructure in subsequent rounds. On this relationship between equality and efficiency, the authors speculated plausibly that the “tolerable” level of inequality for tailenders depends on the cost/benefit ratio of investment, the production function, and group size. In general, headenders take advantage of their relative position, but are punished by tailenders for significantly unequal extraction.
2.2. The Public Goods Experiment
Patterns of asymmetry in the tragedy of the commons might also arise due to asymmetries in behavior, which can be the result of any number of factors, as discussed above, including asymmetrical social preferences or asymmetric access to capital. Asymmetrical social preferences, for instance, are what drive differences in the public goods game—an experimental paradigm used to examine cooperation. Participants (who most often remain anonymous to one another) each begin the game with a certain amount of endowed capital and can choose to donate all, some, or none of it to a “public goods” project. Donations are then multiplied and redistributed evenly to all players, regardless of who contributed. Therefore, both the endowed capital at the start of the game, as well as additional public funds to be gained are, in general, perfectly symmetrical across all participants.
In contrast to Hardin’s herdsmen, the subjects in a public goods experiment work together to build something, rather than extract it (examples of public goods include community wells, health care systems, and Wikipedia). However, the incentive structure of the experiment is similar to the tragedy of the commons due to the tension between individual and group interest and, for games with a sequence of rounds, cooperation almost always decreases over time. Consistent with the prisoner’s dilemma (the public goods game is an n-player prisoner’s dilemma), as well as the tragedy of the commons, the “rational” strategy for an individual participant is to withhold contributions to the public good and instead collect the payoffs from the generosity of others. However, the conclusion reached by each and every participant in these experiments is not always the ‘rational’ decision to free ride.
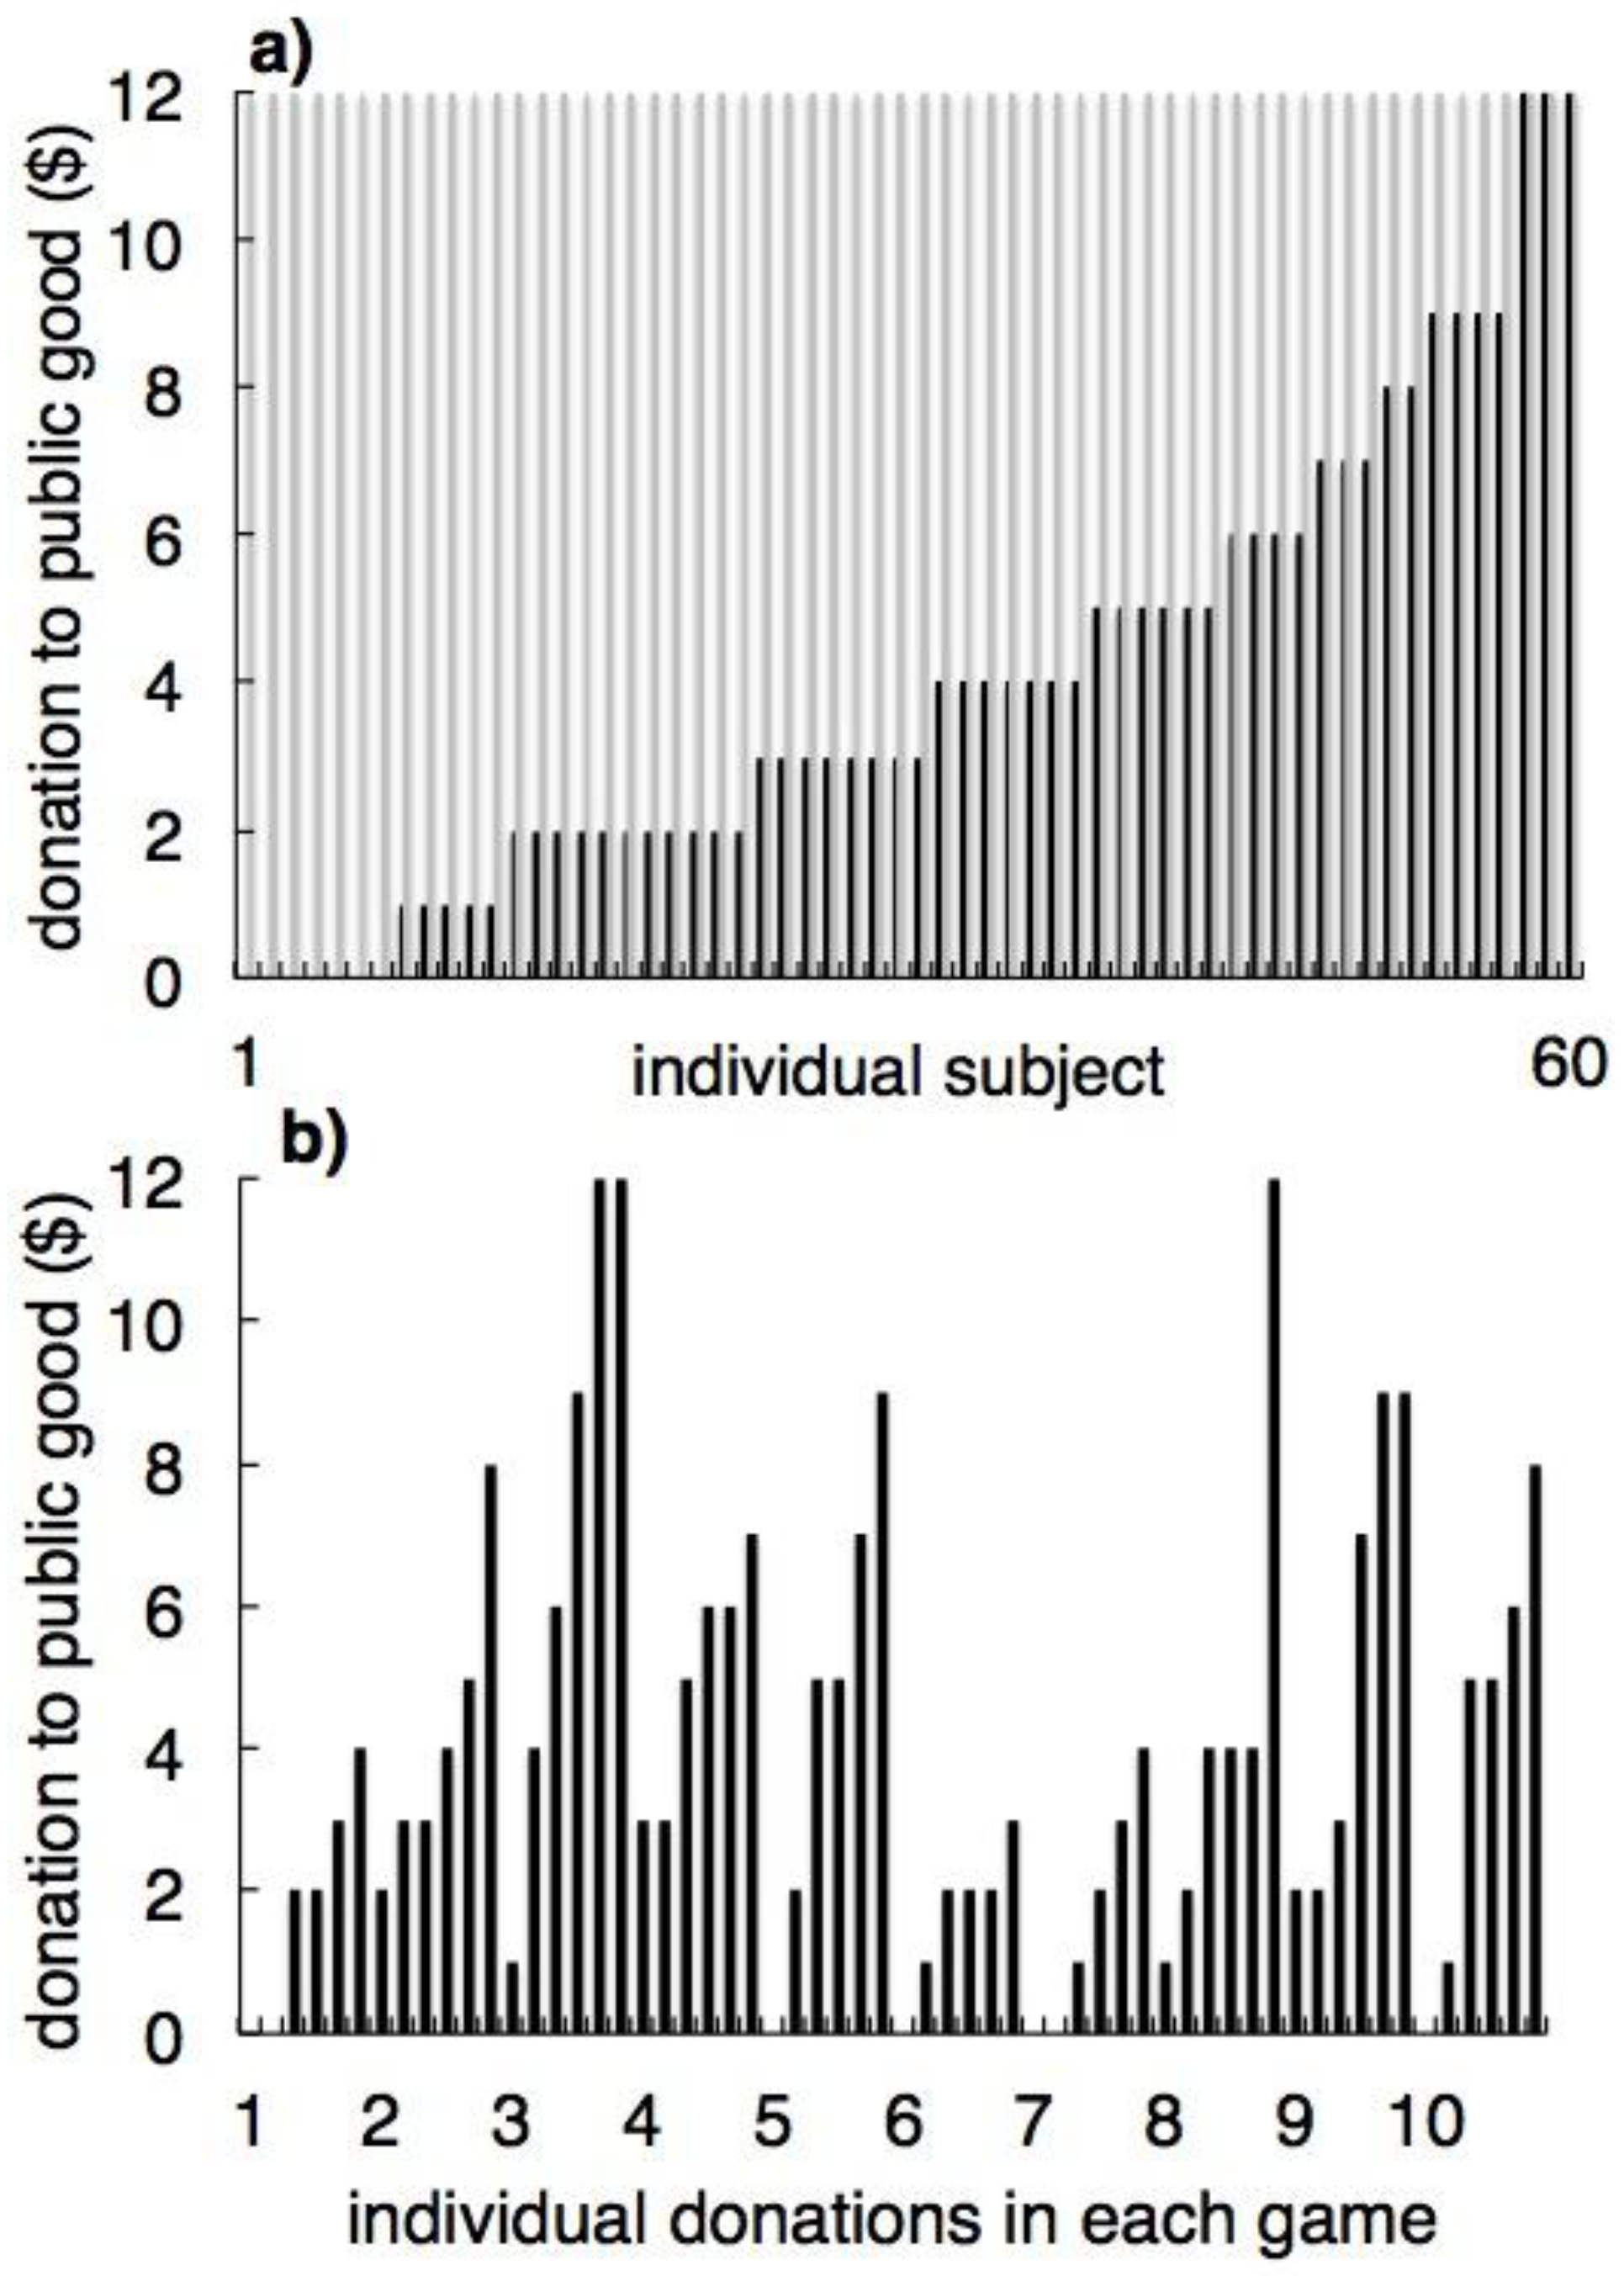
Figure 2 presents data from a “control” condition of a public goods experiment consisting of 10 games of 6 players each in which all players remained anonymous, out of view from one another, and unable to communicate with one another throughout the course of the game [data from 13]. There were 12 rounds and each player was allotted $12 at the beginning of the game (thus each player had symmetrical access to capital)—each subject could choose to give $1 or $0 at each round, and after each round the donations were doubled and redistributed evenly to all subjects (thus each player received symmetrical payoffs from donations). The egalitarian result, where all subjects would contribute $12 thereby leading to the maximum gains for the maximum number of subjects, is shown alongside the actual and extremely asymmetrical decisions (ranging from $0 to $12) in ascending levels of donations of the 60 different players (
Figure 2a). This pattern of asymmetry is not only obvious on aggregate—it is also visible in each of the 10 games (
Figure 2b).
These data show extreme asymmetries that typically prevail in public goods experiments. Of 60 subjects, 12% gave $0—the ‘rational’ decision—while the remaining 88% contributed some amount of money to the public good. The mean contribution to the public good was $4.03 ± 3.14 st.dev., the mode contribution was $2, and the median contribution was $3. The public goods experiment frequently illustrates asymmetries in human behavior due to different individual preferences rather than as the result of asymmetries in resource availability.
Figure 2.
(a) Donations ranked from least to most generous individual players in 10 different 6-player public goods experiments with 12 rounds (maximum contribution was $12); (b) individual donations in each of the 10 games ranked by least to most generous player [data from 13].
Figure 2.
(a) Donations ranked from least to most generous individual players in 10 different 6-player public goods experiments with 12 rounds (maximum contribution was $12); (b) individual donations in each of the 10 games ranked by least to most generous player [data from 13].
2.3. Delinquent Taxpayers in California
Even among free riders, patterns of asymmetry prevail. A real life example of the public goods experiment is the tax system, which pays for government services that are non-excludable and therefore benefit everyone, such as roads, public hospitals, parks, and access to clean drinking water. In the case of taxes, asymmetries are evident in both the resource itself (in both income and tax rates) as well as taxpayer preferences. In the state of California, for instance, 90% of people reportedly pay their taxes; however, the 10% who do not leave the state with a large tax gap.
Since 2007, the state of California’s Franchise Tax Board has published the names of the top delinquent individual and corporate taxpayers (as long as their delinquencies exceed $100,000; all delinquents also receive notice of the listing and can avoid it if they pay their tax liability in full; the state published only the top 250 until 2011, after which they published the names of the top 500 delinquents). From these data [
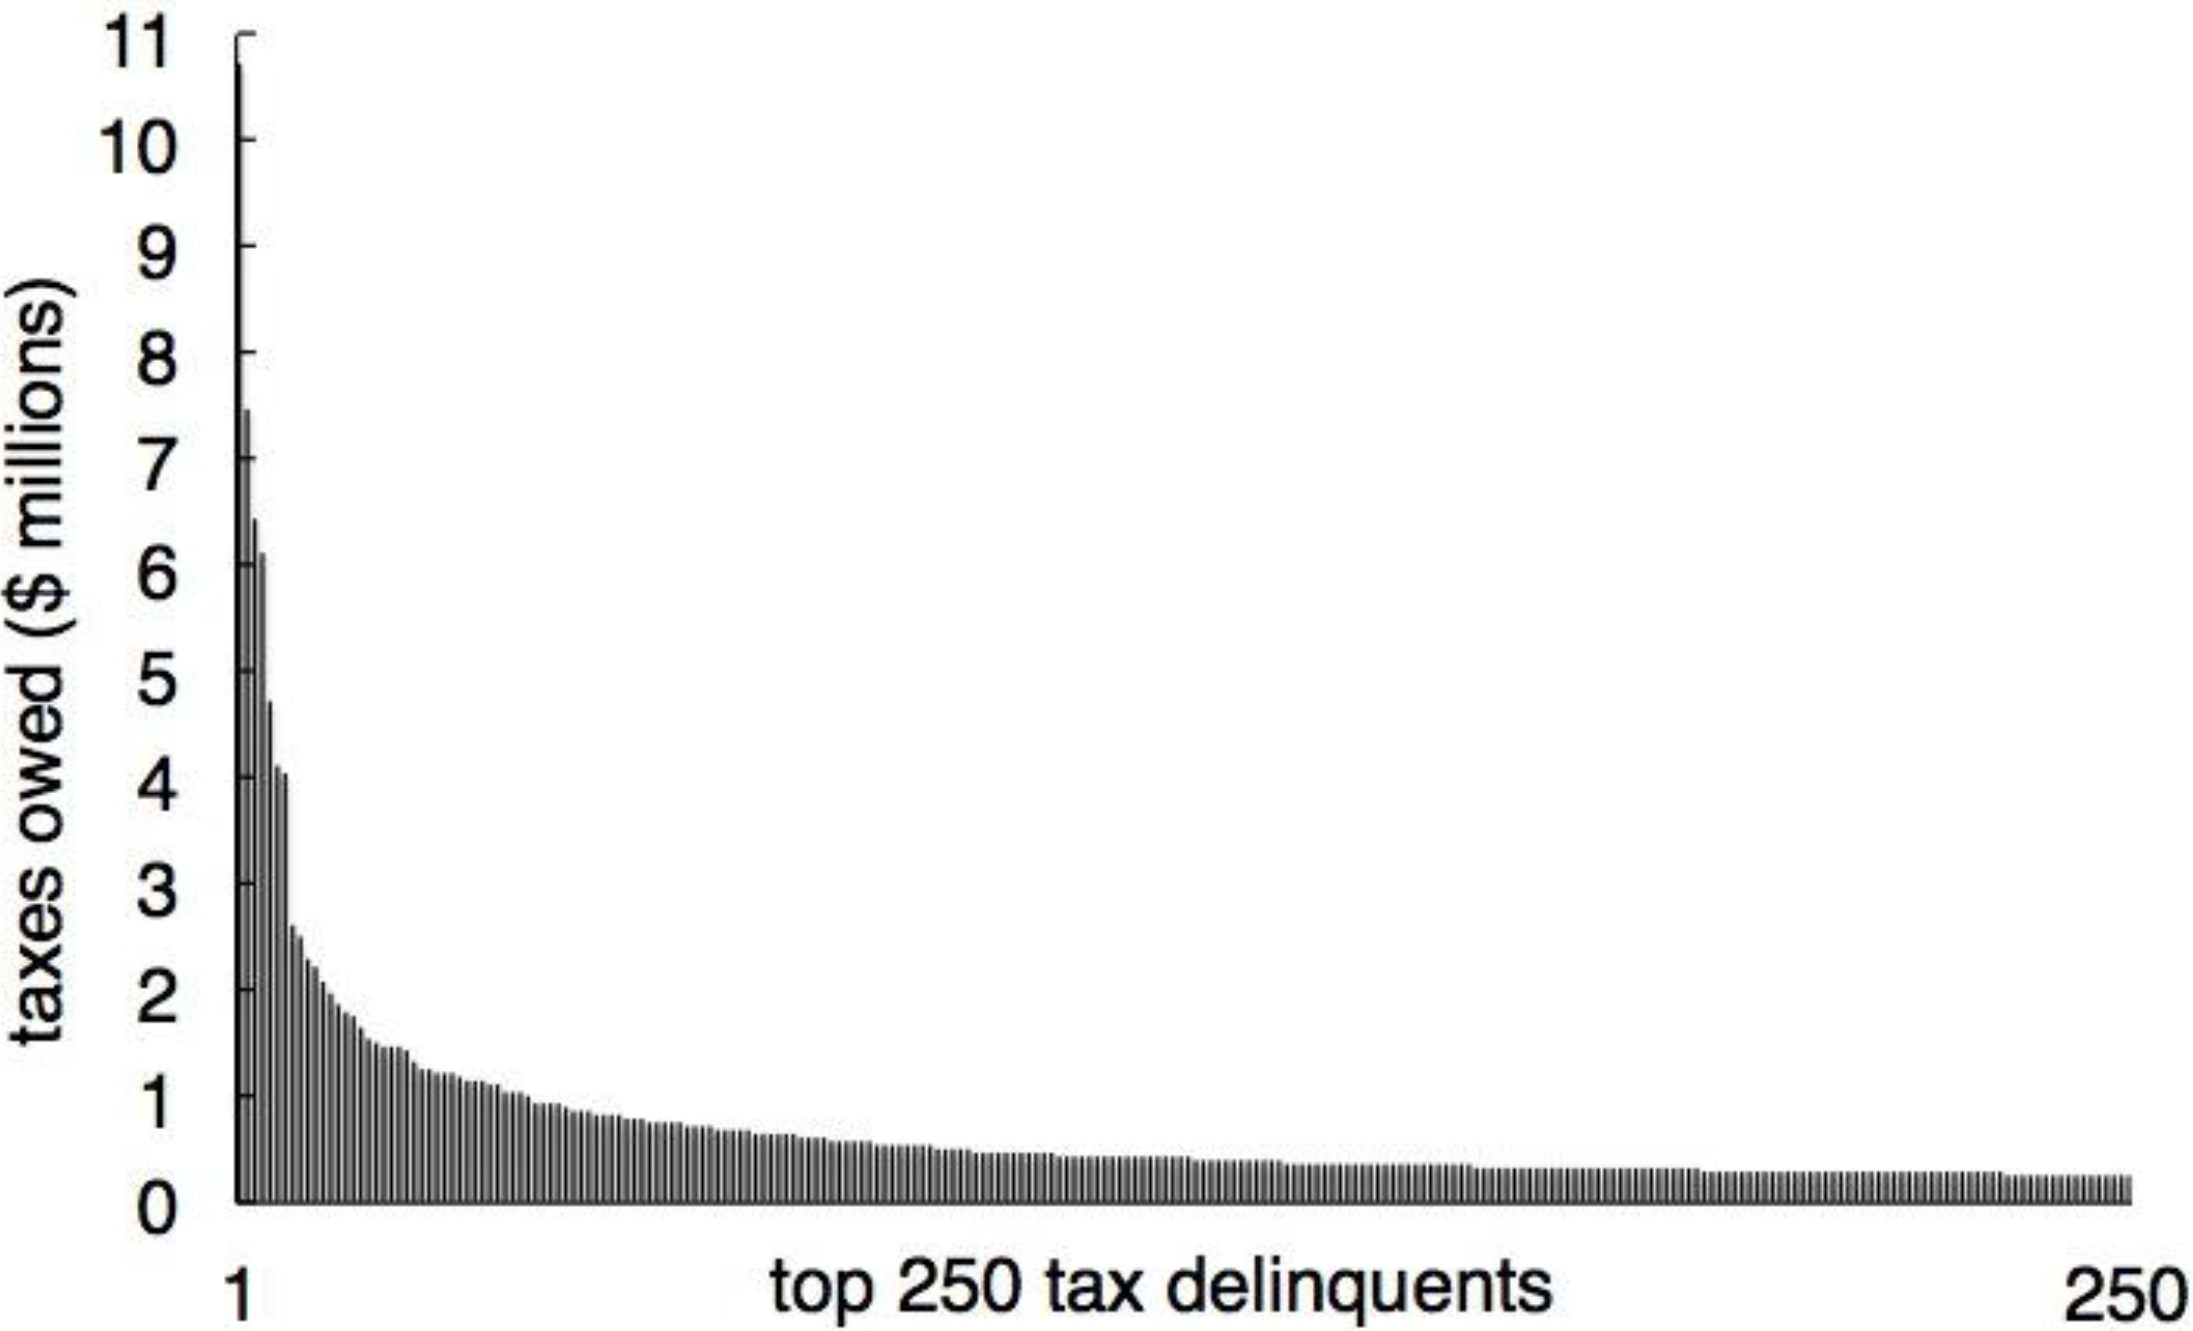
14], we can see the patterns of asymmetry that prevail even among people who do not pay their taxes, and that some individuals and corporations have contributed disproportionately to the state’s tax gap. For the top 250 individual and corporate delinquents in 2012, the top 10% owe 41% of the unpaid taxes (
Figure 3).
Figure 3.
Top 250 individual and corporate tax delinquents in the state of California in 2012 ranked from most to least taxes owed [data from 14].
Figure 3.
Top 250 individual and corporate tax delinquents in the state of California in 2012 ranked from most to least taxes owed [data from 14].
2.4. Farmed Animals as Seafood Consumers
A pattern of asymmetry also prevails in the consumption of wild-caught seafood. On average, about one-third of capture fisheries is used for ‘non-food purposes’, the majority of which is reduced for fishmeal and fish oil, and the remainder of which is used for ornamental purposes, for culture for farming fish, for bait, for pharmaceutical uses as well as for direct feed in aquaculture, livestock, and fur animals [
15]. Therefore, forage fish are diverted from the diets of foraging marine species, toward fishmeal and fish oil to be fed to farmed fish, chicken and pigs [
16]. Fish farms alone (e.g., salmon) consume around half of fishmeal [
16].
As a result, farmed fish, pigs, and chickens consume the equivalent amount of wild seafood as industrialized countries combined [
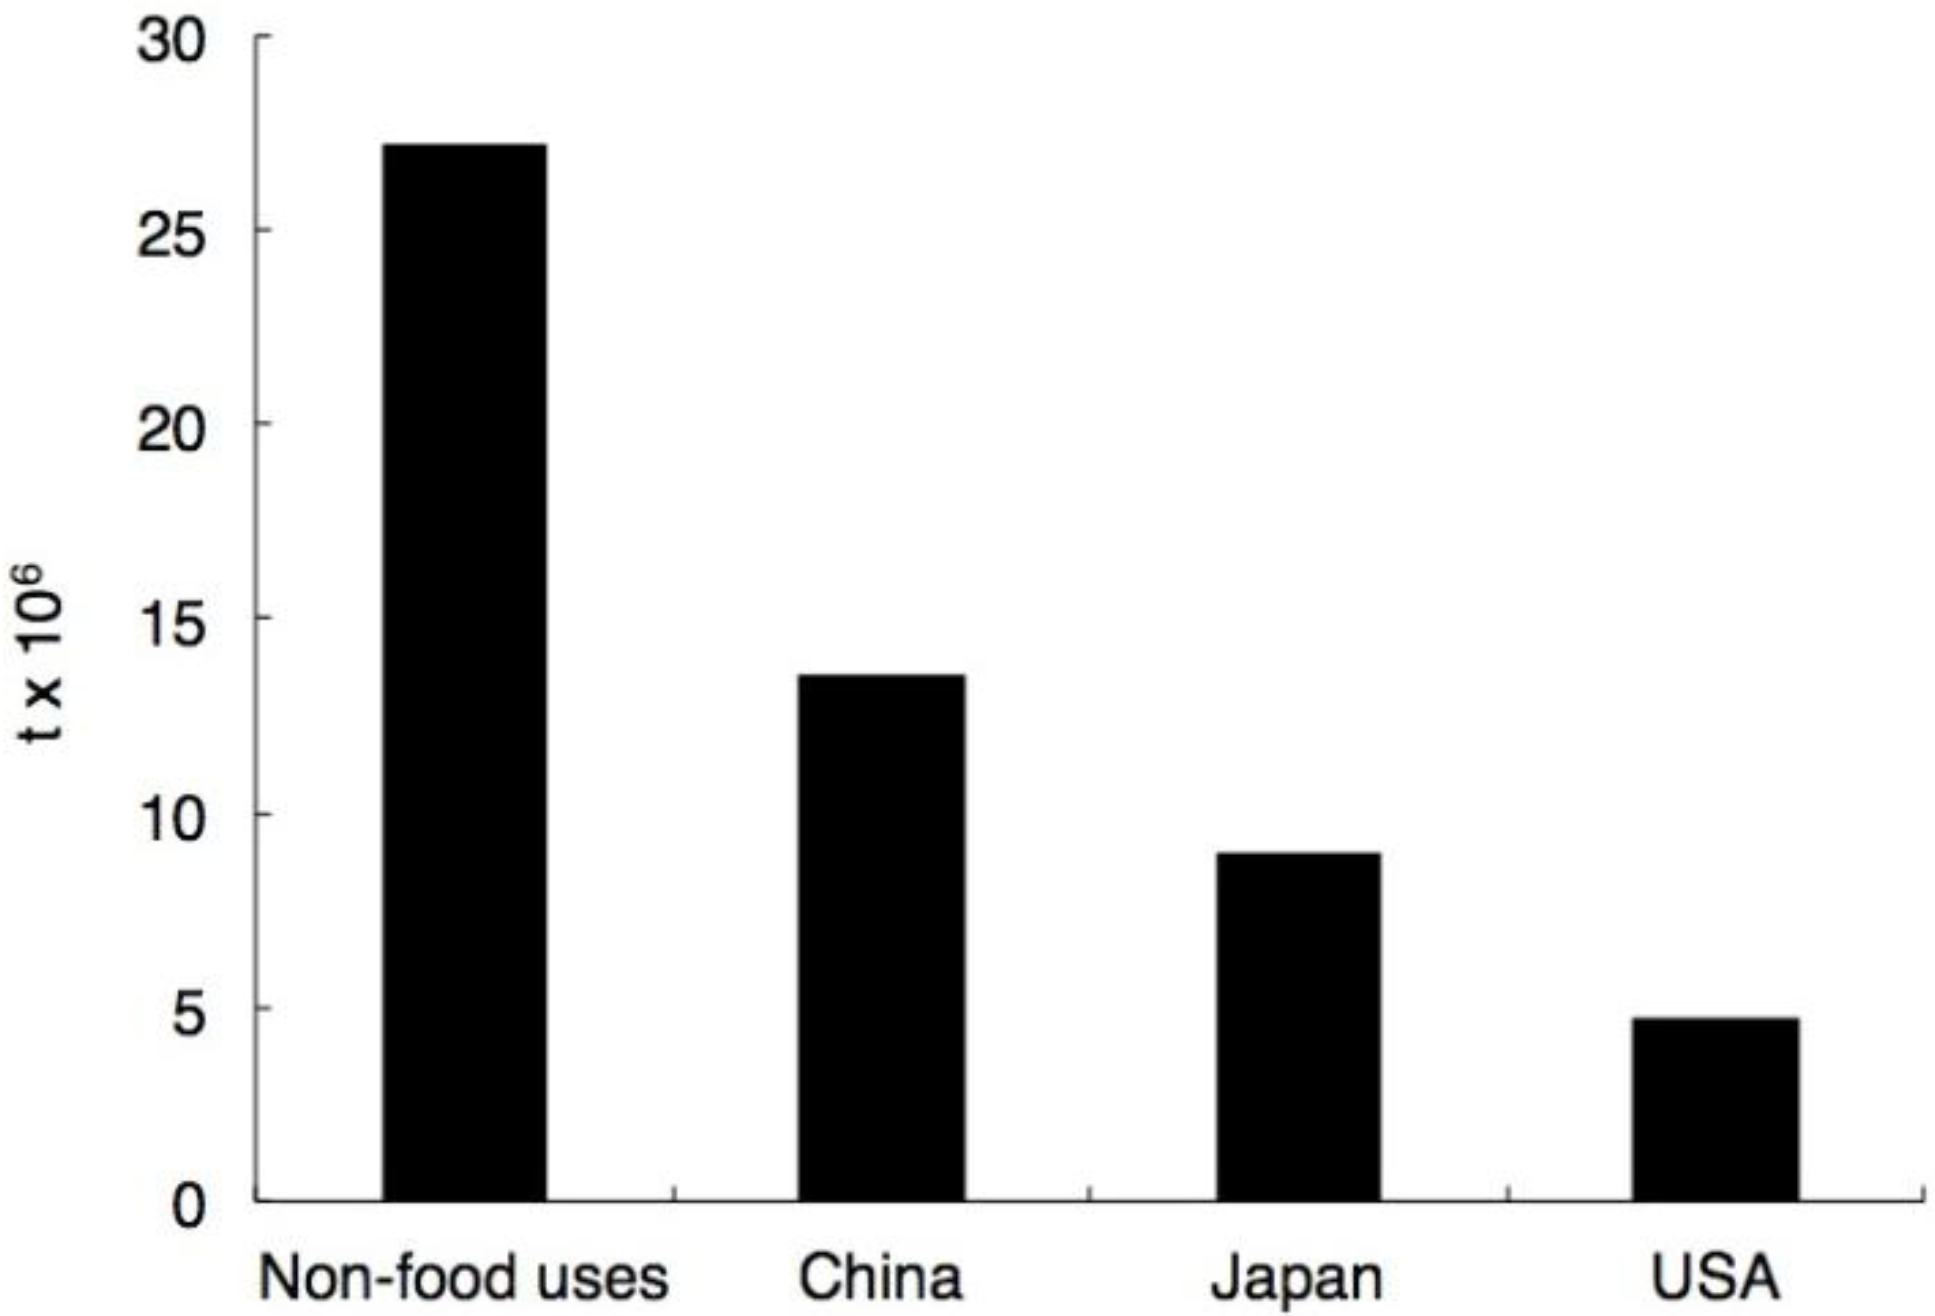
17]. In 2009, a reported 27.2 million tonnes of wild-caught seafood went to non-food purposes [
17], more than double the amount of wild seafood consumed directly by people in China, more than three times the amount consumed by people in Japan, and six times more wild seafood than was eaten directly by U.S. consumers (
Figure 4). As we will see in the next section, major conservation funders interested in sustainable seafood campaigns have underappreciated this pattern of asymmetry and, as a result, invested relatively little money in reforming the fishmeal industry.
Figure 4.
Consumption of wild-caught seafood by sector/country in 2008 (in millions of tonnes).
Figure 4.
Consumption of wild-caught seafood by sector/country in 2008 (in millions of tonnes).
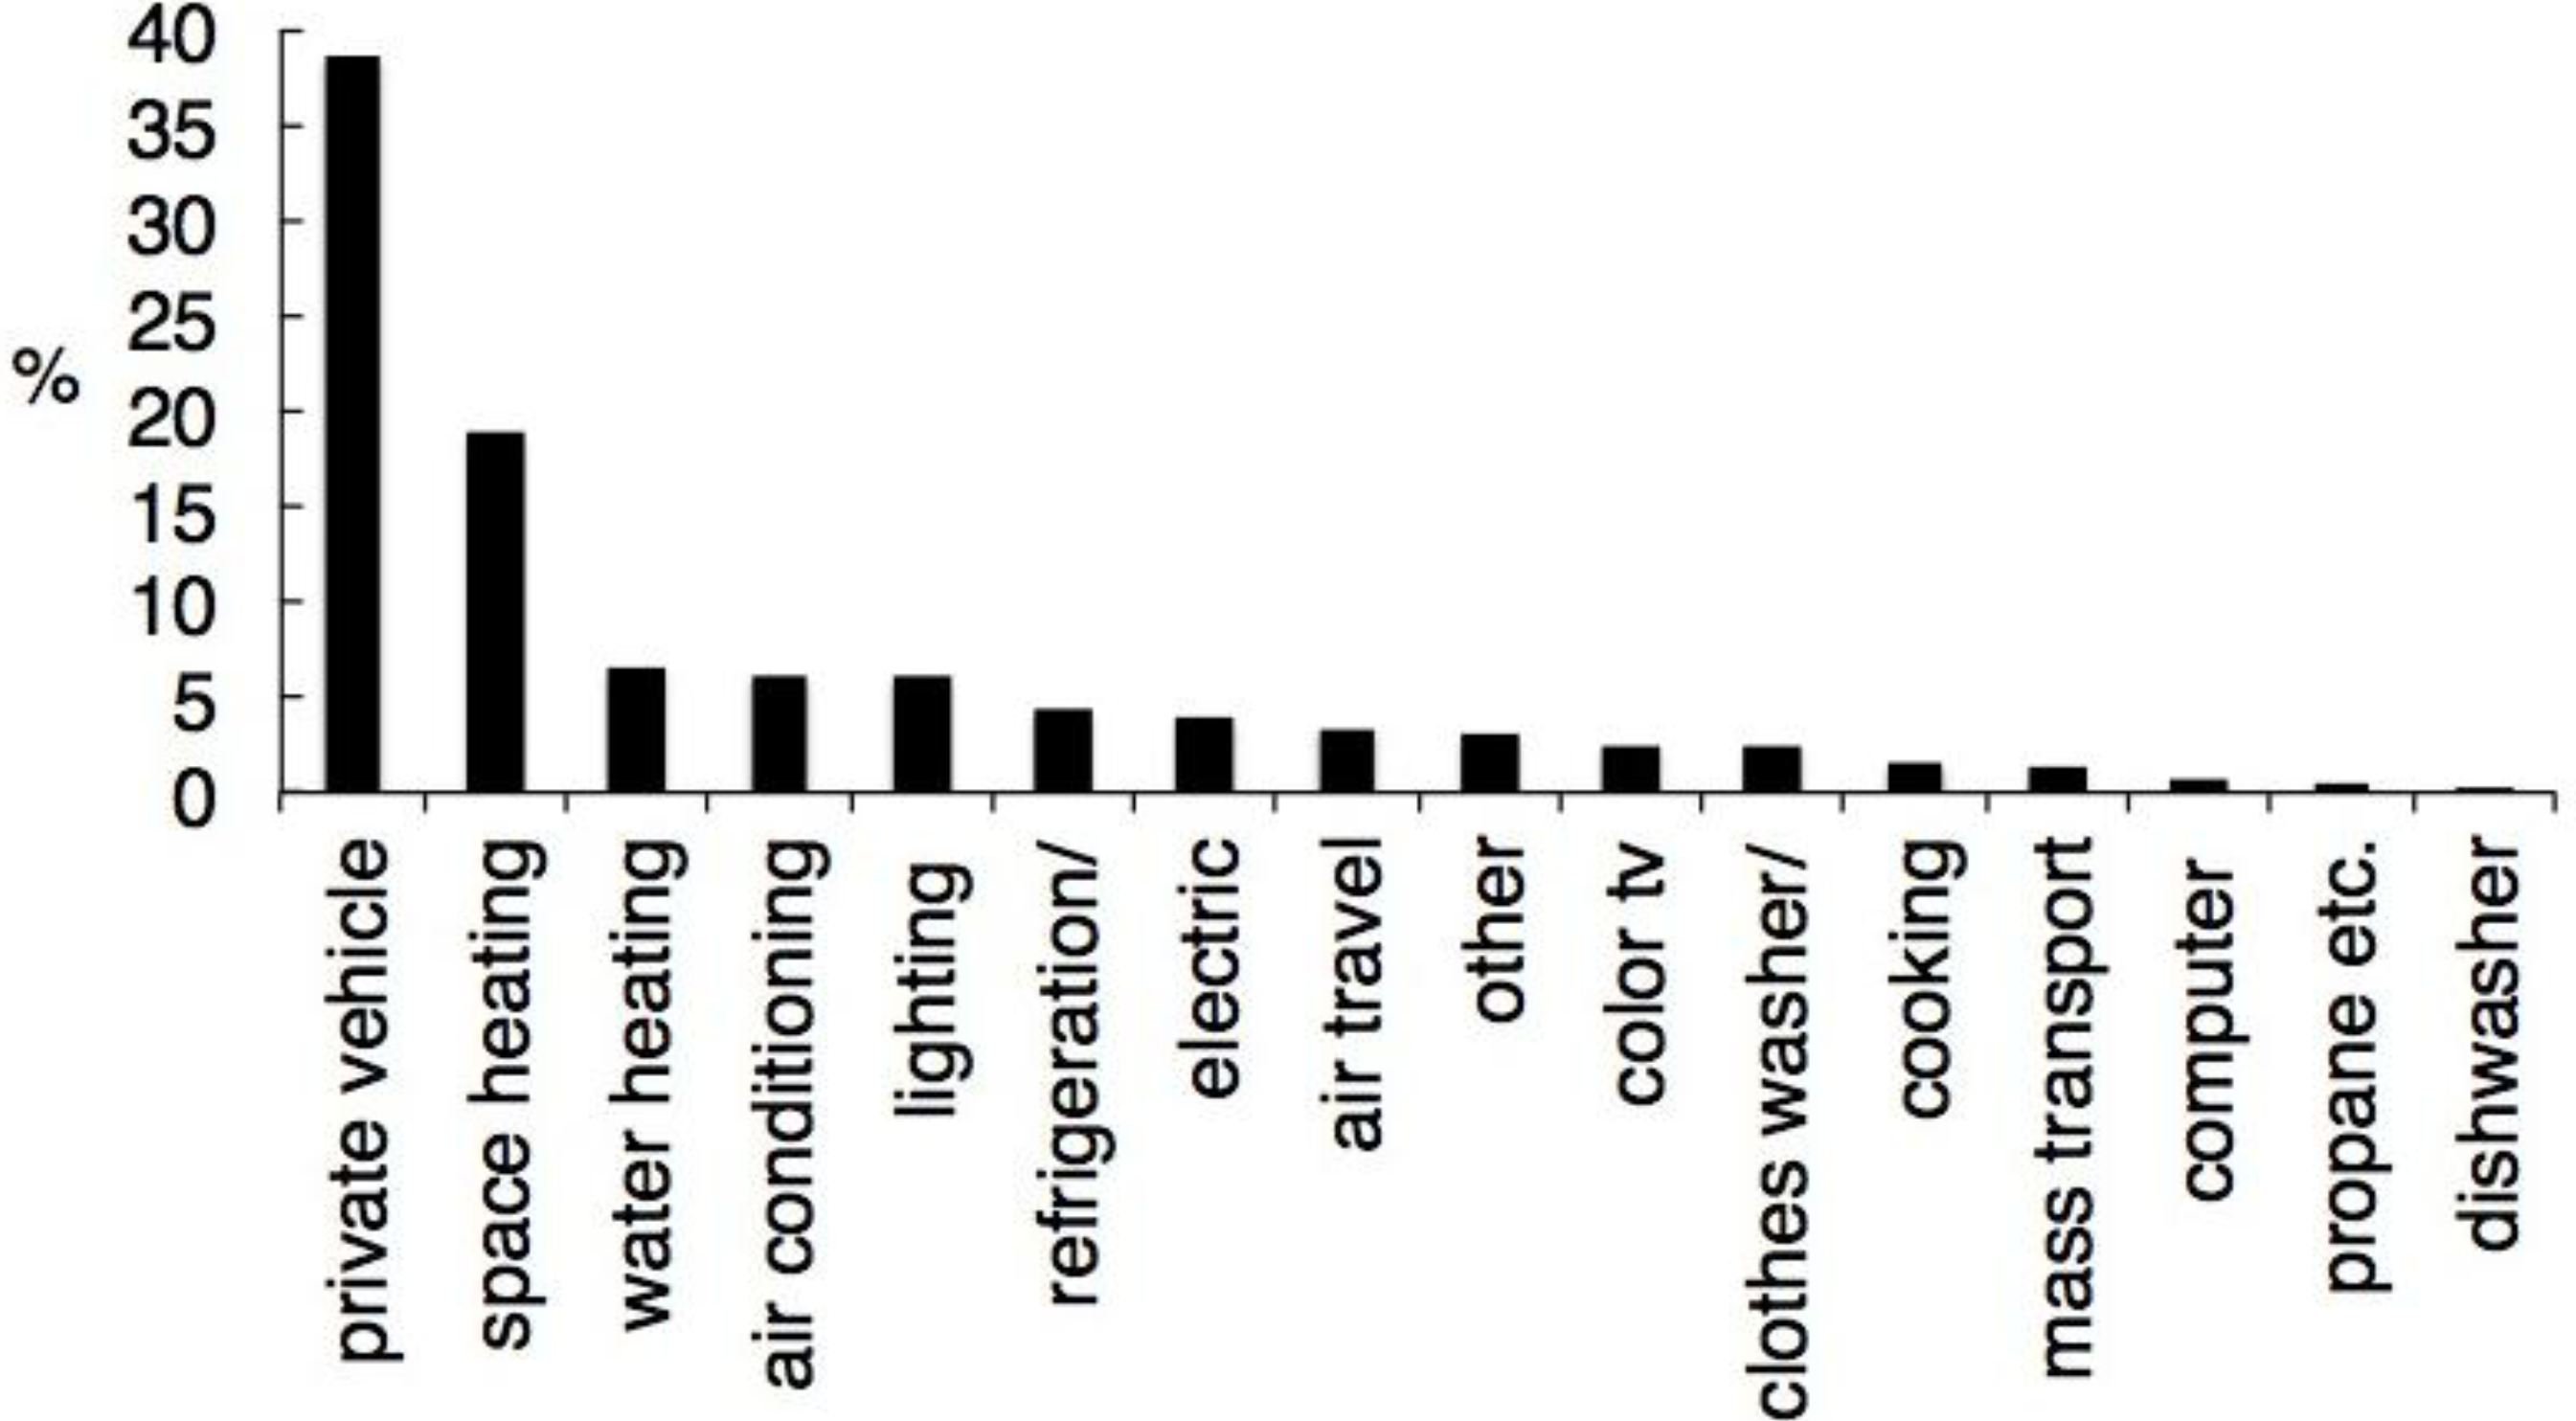
2.5. Patterns of U.S. Household Energy Use by Appliance
Not all asymmetries in patterns of consumption are the direct result of organisms. For instance, U.S. household appliances contribute asymmetrically to overall household energy use, with private vehicles accounting for 39% of energy use and space heating account for 19%, and the remaining appliances each contributing less than 10%, including lighting [
18]. Note the obvious keystone-like pattern in household energy use by appliance in
Figure 5.
Figure 5.
Percentage of U.S. household energy use by appliance [data from 18].
Figure 5.
Percentage of U.S. household energy use by appliance [data from 18].
3. Conservation vs. Contributions to the Tragedy of the Commons
The captured fish and crustaceans used for ‘non-food purposes’ are low trophic-level species groups such as sardines, anchovies, herrings, and krill, which are essential to the diets of larger fish, marine mammals and seabirds (and thus often referred to as ‘forage fish’). Scientists have recently called for a reduction of fishing pressure on forage fish due to their important role in marine food webs [
19], and a more precautionary approach to fishing where information is less reliable [
20]. At the same time, scientists have recognized the paradox that aquaculture as it currently exists (farming primarily carnivorous species) puts additional pressure on wild fish stocks, rather than relieves it by increasing demand for forage fish for feed. Naylor
et al. [
21] wrote: “if the growing aquaculture industry is to sustain its contribution to world fish supplies, it must reduce wild fish inputs in feed”. Duarte
et al. [
22] stated that for “a sustainable aquaculture model to be achieved” fish farming needs to reduce pressure on wild fish stocks and get to a point where “feed is produced in the farm”. Diana [
23] listed “fish meal and its concomitant overexploitation of fish stocks” as one of the main negative effects on marine biodiversity. Duarte
et al. [
24] insisted that “mariculture must close the production cycle to abandon its current dependence on fisheries catches”.
Given the large demand for wild-caught fish for ‘non-food purposes’ and the need to reform the aquaculture sector, it is puzzling that conservation investments to reform the market for capture fisheries remain focused on human consumers in the U.S. and Europe [
25]. For example, the U.S.-based Packard Foundation, one of the most generous foundation funders focused on sustainable seafood, has an explicit goal to “build demand for sustainable seafood to transform global seafood markets, aquaculture operations, and fishing practices” through “market intervention” [
26].
A survey of their grants database [
27], a laudably transparent system, reveals that between 2006–2012, the Packard Foundation invested $37.3 million dollars into conservation and science related to ‘sustainable seafood’, including many programs to change individual consumption through wallet cards and fisheries certification ($9.7 million went directly to the London-based Marine Stewardship Council—an eco-label for seafood that has become contentious; [e.g., 28-30]). In the ‘sustainable seafood’ category, the Packard Foundation granted only $310,000 for forage fish research and conservation, $250,000 to grants to address wild seafood markets in China, and $170,000 to grants to address Japanese sustainable seafood markets, despite each of these markets consuming much more seafood than U.S. consumers (
Figure 4). An additional $16 million was given for conservation and science related to ‘aquaculture’ and about 20% of this funding ($3.2 million) did go to grants related to herbivorous aquaculture or reducing fish feed, including one grant of $150,000 to continue “research studying the Chinese aquaculture industry and its use of feed resources.” It should be noted that within their broad sustainable seafood efforts, some Packard-funded efforts (e.g., Greenpeace, Fishwise) encourage businesses to shift to farmed fish that do not rely heavily on wild feed, and that Packard is soon to expand its work in Japan and other Asian countries. Nonetheless, reforming the U.S. seafood market has been a top conservation priority, while reforming the fishmeal industry has not (not at Packard or any other foundation we know of), despite the fishmeal industry demanding more wild-caught fish than the consumers in any single country (and six times that of the U.S.).
In contrast to the seafood example, over the same time period, the Packard Foundation invested $33.4 million dollars into conservation and science related to ‘energy’, and 45% of this was spent on sustainable energy programs in China, the world’s largest emitter of carbon dioxide. In this case, Packard is clearly considering the asymmetrical patterns of emissions when allocating their funding.
However, not every climate campaign appears to consider asymmetrical contributions to climate change. For instance, given that the most developed countries, including the U.S., caused the extreme growth in atmospheric carbon dioxide concentration in the second half of the 20th century (from 311 ppm in 1950 to 369 ppm in 2000 [
31]), it seems appropriate that
An Inconvenient Truth, the 2006 Oscar-winning documentary about climate change, was produced for U.S. audiences. However, the film finishes with the recommendations to: “buy energy efficient appliances and light bulbs, change your thermostat, weatherize your house, recycle, and, if you can, by a hybrid car.” Yet, household lighting, the very first recommendation, accounts for only 2.3% of total U.S. carbon emissions (38.2 mTc out of 1647 MtC annually [
18,
32]) and 6% of overall household energy use (excluding diet;
Figure 5). Since lighting contributes relatively little overall consumption (
Figure 5), a more proportional recommendation would have targeted private vehicle use and/or heating systems, which could have had a greater conservation impact or influence on perception. Personal vehicles account for 39% of U.S. household carbon emissions and 15% of total U.S. emissions, as well as consume more than six times more household energy use than lighting (
Figure 5). A recent survey of 505 subjects from 7 different metropolitan U.S. areas showed that the most popular response for the single most effective things subjects could do to conserve energy in their lives was to turn off their lights. Almost 20% of respondents mentioned this solution, compared with 13% who said “drive less”, while neither eating less meat nor switching to a meat-free diet was mentioned [
33], although research shows that U.S. greenhouse gas emissions would be reduced by 6% if Americans switched to plant-based proteins [
34].
Similar paradoxes in energy use and conservation recommendations occur in Britain. In 1999, the UK government launched the “Are You Doing Your Bit?” campaign, which recommended, among other things, energy savings by filling teakettles with just the right amount of water. Marshall [
35] pointed out that “...a return flight to Australia (from the UK) will have the same climate-change impact as 730,000 plastic bags or 176,000 overfilled kettles.” MacKay [
36] showed that the frequent recommendation in the UK to unplug mobile phone chargers were also a distraction because this individual action would result in the same energy savings as not driving the average car for
one second. MacKay [
36] showed that turning the thermostat down is the easiest and most effective energy-saving technology available to a typical British person, along with consuming less, driving less, stopping air travel, and eating meat only one day per week.
4. Discussion
Here we review evidence to confirm that asymmetrical contributions prevail in many tragedies of the commons, as we have shown with reference to game-theoretical models, experimental data, and empirical data. Several case studies suggest that conservation efforts have underappreciated the patterns of asymmetry in social dilemmas, and have focused investments and attention on sectors or groups of consumers that contribute relatively little to the overall tragedy (e.g., energy efficient light bulbs).
When attempting to address any social dilemma, including environmental problems, it is necessary to ask who is responsible, how that responsibility is distributed, and what the appropriate or attainable metric for responsibility is. When examining per capita ecological footprints by country, for instance, people living in Qatar, Kuwait, and the United Arab Emirates have the greatest per capita impact [
37], but when the per capita ecological footprint is multiplied by country population, the U.S., China, and India stand out. When carbon dioxide emissions are presented by country, the U.S. and China stand out as top contributors, whereas when they are presented per capita, the wealthiest 600 million humans appear most responsible [
38]. Chakravarty
et al. [
39] recognized the asymmetries in carbon dioxide emissions, and demonstrated that an individual emission cap of 10.8 t CO
2 per year would allow us to meet a 13 GtCO2 reduction by 2030 and would only affect 1.13 billion people—less than 15% of the projected 2030 population. We argue that these patterns should drive conservation priorities, and that large foundations and other granting organizations ask conservation efforts to justify their focus in light of them.
However, we also recognize that not all conservation efforts are defined by patterns of asymmetry. For instance, a conservation group might choose to focus the majority of efforts on changing behavior in the U.S., even though other countries might have bigger impact, because the potential for change is much greater there, or because they prefer to create jobs and/or visibility in their home country. Surely there are many motivations for why organizations choose to tackle the problems they do. However, we believe that too often conservation funders and organizations have not appreciated the scale or relative size of the threats that make up the problem they are attempting to solve.
In ecosystems, biologists identify keystone species and often identify them as conservation priorities because their disappearance could cause the loss of many other species [
6]. Similarly, analyzing the pattern of consumption in a particular tragedy of the commons is an appropriate first step in solving it, and a way of identifying priority areas for conservation.
