Article

Can We Model the Scenic Beauty of an Alpine Landscape?

1
Institute for Alpine Environment, EURAC research, Viale Druso 1, 39100 Bolzano, Italy
2
Institute of Ecology, University of Innsbruck, Sternwartestr. 15, 6020 Innsbruck, Austria
*
Author to whom correspondence should be addressed.
Sustainability 2013, 5(3), 1080-1094; https://doi.org/10.3390/su5031080
Submission received: 20 December 2012 / Accepted: 22 February 2013 / Published: 7 March 2013
(This article belongs to the Special Issue Measuring Socio-Economic Well-Being)

Abstract

:
During the last decade, agriculture has lost its importance in many European mountain regions and tourism, which benefits from attractive landscapes, has become a major source of income. Changes in landscape patterns and elements might affect scenic beauty and therefore the socio-economic welfare of a region. Our study aimed at modeling scenic beauty by quantifying the influence of landscape elements and patterns in relationship to distance. Focusing on Alpine landscapes in South and North Tyrol, we used a photographic questionnaire showing different landscape compositions. As mountain landscapes offer long vistas, we related scenic beauty to different distance zones. Our results indicate that the near zone contributes by 64% to the valuation of scenic beauty, the middle zone by 22%, and the far zone by 14%. In contrast to artificial elements, naturalness and diversity increased scenic beauty. Significant differences between different social groups (origin, age, gender, cultural background) occurred only between the local population and tourists regarding great landscape changes. Changes towards more homogenous landscapes were perceived negatively, thus political decision makers should support the conservation of the cultural landscape.

1. Introduction

All over the European Alps, major land-use changes result in altered landscape patterns [1,2,3]. Whereas productive areas continue to be used, less productive areas have been abandoned, leading to natural reforestation [4,5]. Such land-use change produces a change in the appearance of the landscape. The visual character of landscapes affects human well-being in different ways, especially in terms of aesthetic appreciation, human health, and human relations [6,7,8]. Hence, an attractive environment can support a positive future development in Europe’s mountain areas, especially, in terms of economic benefits related to tourism, as mountain landscapes are appealing environments [4,9,10,11]. Scenic beauty assessments and modeling approaches, which consider recent landscape dynamics, can support the local decision makers and landscape planners towards a sustainable development [4,12].
When assessing scenic beauty, human perceptions and physical properties of landscapes with all visual elements and also their composition have to be taken into account [13,14,15,16,17]. Bourassa [18] relates landscape aesthetics to the cultural, biological and personal dimensions. Based on the biological dimension and cultural/social behavior, diverse studies have analyzed landscape appreciation [8,19]. The biological dimension includes evolutionary principles, describing landscape composition and scenic beauty through visual concepts or attributes [9,19,20,21]. With regard to Alpine landscapes, several authors discussed attributes like naturalness, wilderness, and diversity and studied the consequences of land-use processes of intensification, abandonment, and reforestation [4,9,19,22]. Tveit et al. [20] define naturalness as the closeness to a preconceived natural state. This relates to the perceived degree of naturalness, which may differ greatly from the “degree of naturalness” as understood by scientists [23]. In landscape aesthetics, naturalness is considered as an important positive predictor [21,23,24] and great scenic beauty has been associated with natural landscape features like mountains, water, and vegetation [11,25,26]. In contrast, anthropogenic influences, for example, urban growth, infrastructures, or garbage, are perceived negatively [11,12,23,24,25]. Besides specific landscape features, also landscape patterns can be related to scenic beauty and landscape diversity is perceived positively [9,20,25]. Furthermore, distance, in terms of openness or extent of view, has also been mentioned as a major aspect of scenic beauty in several studies [21,25,28,29]. However, visual scale concepts, such as landscape rooms, visibility, openness, enclosure, spaciousness [20] have mostly been tested in flat areas or landscapes with small topographical variation [30]. In alpine landscapes, places with higher elevation have longer vistas in respect to flat landscapes, but mountains can also limit the view [30,31]. With increasing distance, the long vistas affect visual properties, object appearance, color differences, and lightness contrast [32]. To account for these visual variations, several studies related scenic beauty assessments to different distance zones and distinguished usually three zones [30,31,32,33,34]. Ribe et al. [33], for example, tested impacts of vistas and harvests on public perception with regard to forest management. Germino et al. [30] examined the total visible proportional area for 0–10 km, 10–15 km, and 50–150 km, mentioning that especially for distant views over more than a few kilometers, the perception of viewsheds is not very well discussed. Their results imply that the near zone is particularly important for humans’ perceptions and helps shape the way people assess and understand a landscape. Schirpke et al. [31] adapted the distance zones for the European Alps (0–1.5 km, 1.5–10 km, 10–50 km) to perform a visibility analysis accounting for scale and color variations with increasing distance. However, none of these studies related humans’ perceptions of landscape changes in relationship to different distance zones. In this study, we therefore focus on the influence of distance on perceived scenic beauty of mountain regions.
To support a sustainable development of touristic mountain regions [4,12], it is important to consider landscape perceptions of both the local population and tourists. Different studies examined whether landscape perceptions depend on social groups [11,18,26,35]. Bourassa [18] refers to cultural rules which play an important role for perceived scenic beauty, because humans’ perceptions are related to specific backgrounds creating social groups which are derived from cultural developments. As different social groups have diverse expectations of a landscape [27], they may evaluate its scenic beauty differently. Bauer et al. [35] showed in their study in Switzerland that the German-speaking part had a positive attitude to increasing forest areas while the French-and Italian-speaking parts had a negative attitude to the same phenomenon. Beza [11] explained the different perceptions of a mountain landscape between tourists and the local population by specific cultural ideas. In contrast, many studies found substantial agreement across different groups [29,36,37] indicating that the variations between observer’s judgments are less than the variations between landscapes [38]. These studies, however, did not focus on differences between tourists and local residents.
The objective of our study was to generate a model for scenic beauty of mountain regions based on depth of view, landscape elements, and perceptions of different social-demographic groups. Real [24] specified that predictors based on the psychophysical paradigm [39] are suitable for building a general model of scenic beauty. Thus, we used a photo-based questionnaire with different Alpine landscapes for quantifying the influence of distance as well as the positive and negative effects of landscape elements on scenic beauty to propose a simple approach for modeling scenic beauty. Our modeling approach was based on the following hypotheses:
(1)
The more view zones are visible in a landscape, the greater is its scenic beauty.
(2)
The closer a landscape element is to the observer, the stronger its influence (negative or positive).
(3)
Perceptions vary between socio-demographic groups.

2. Methods

2.1. Study Sites

The present study was carried out in South Tyrol (Italy) and North Tyrol (Austria), both situated in the Central Alps. The landscape of the study site in South Tyrol, the Gsies valley, with a size of 109 km², is dominated by coniferous forests (50% of the municipal area), grassland with high land-use intensity (10% of the municipal area), and grassland with low land-use intensity in the subalpine–alpine zones (20% of the municipal area). Settlement takes up 5% of the valley floor. The municipality has experienced a big increase in forest (+12%) within the last 60 years and a decrease in grassland with low land-use intensity (-33%). The study site in North Tyrol, Neustift im Stubaital, with a size of 249 km², is characterized by a densely settled valley floor (1% of the municipal area is urbanized). The landscape is composed of rock and scree areas (33.6% of the municipal area), coniferous forests of the montane and subalpine zone (18%), alpine meadows and dwarf shrub communities (22%), and the Stubai Glacier (9%). In both study sites, arable farming has almost ceased.

2.2. Questionnaire and Interviews

To analyze the landscape features in relationship to distance and people's differences in the perception of scenic beauty, we used a standardized photograph-based questionnaire containing six photo series; each series was made up of four images: one real photograph and three different versions of the original photograph modified with Adobe PhotoShopTM (Figure 1). There are different techniques for visualizing landscape scenarios, for example on-site visits, photographs, digital image editing and virtual landscape simulators [40]. For our study, we used digital image editing to generate natural-looking and photo-realistic images [19,41]. The technique allows changing only one variable in the picture, while the others are controlled or remain constant [40]. Simulated environments can be used to visualize hypothetical conditions [25,35].
To test the hypotheses 1 and 2, we used the three distance zones according to Schirpke et al. [31]: in the near zone (0–1.5 km), scattered elements (e.g., trees, row of trees, water, houses) and land-use types can be recognized; in the middle zone (1.5–10 km), elements and land-use types make up complexes of shapes and forms (e.g., different types of forest areas, diverse landscapes); in the far zone (>10 km), only mountain silhouettes with large-scale areas (forest, agricultural area, snowfield or glacier) are clearly identifiable. The different photo series were related to the hypotheses 1 and 2 as described in the following:
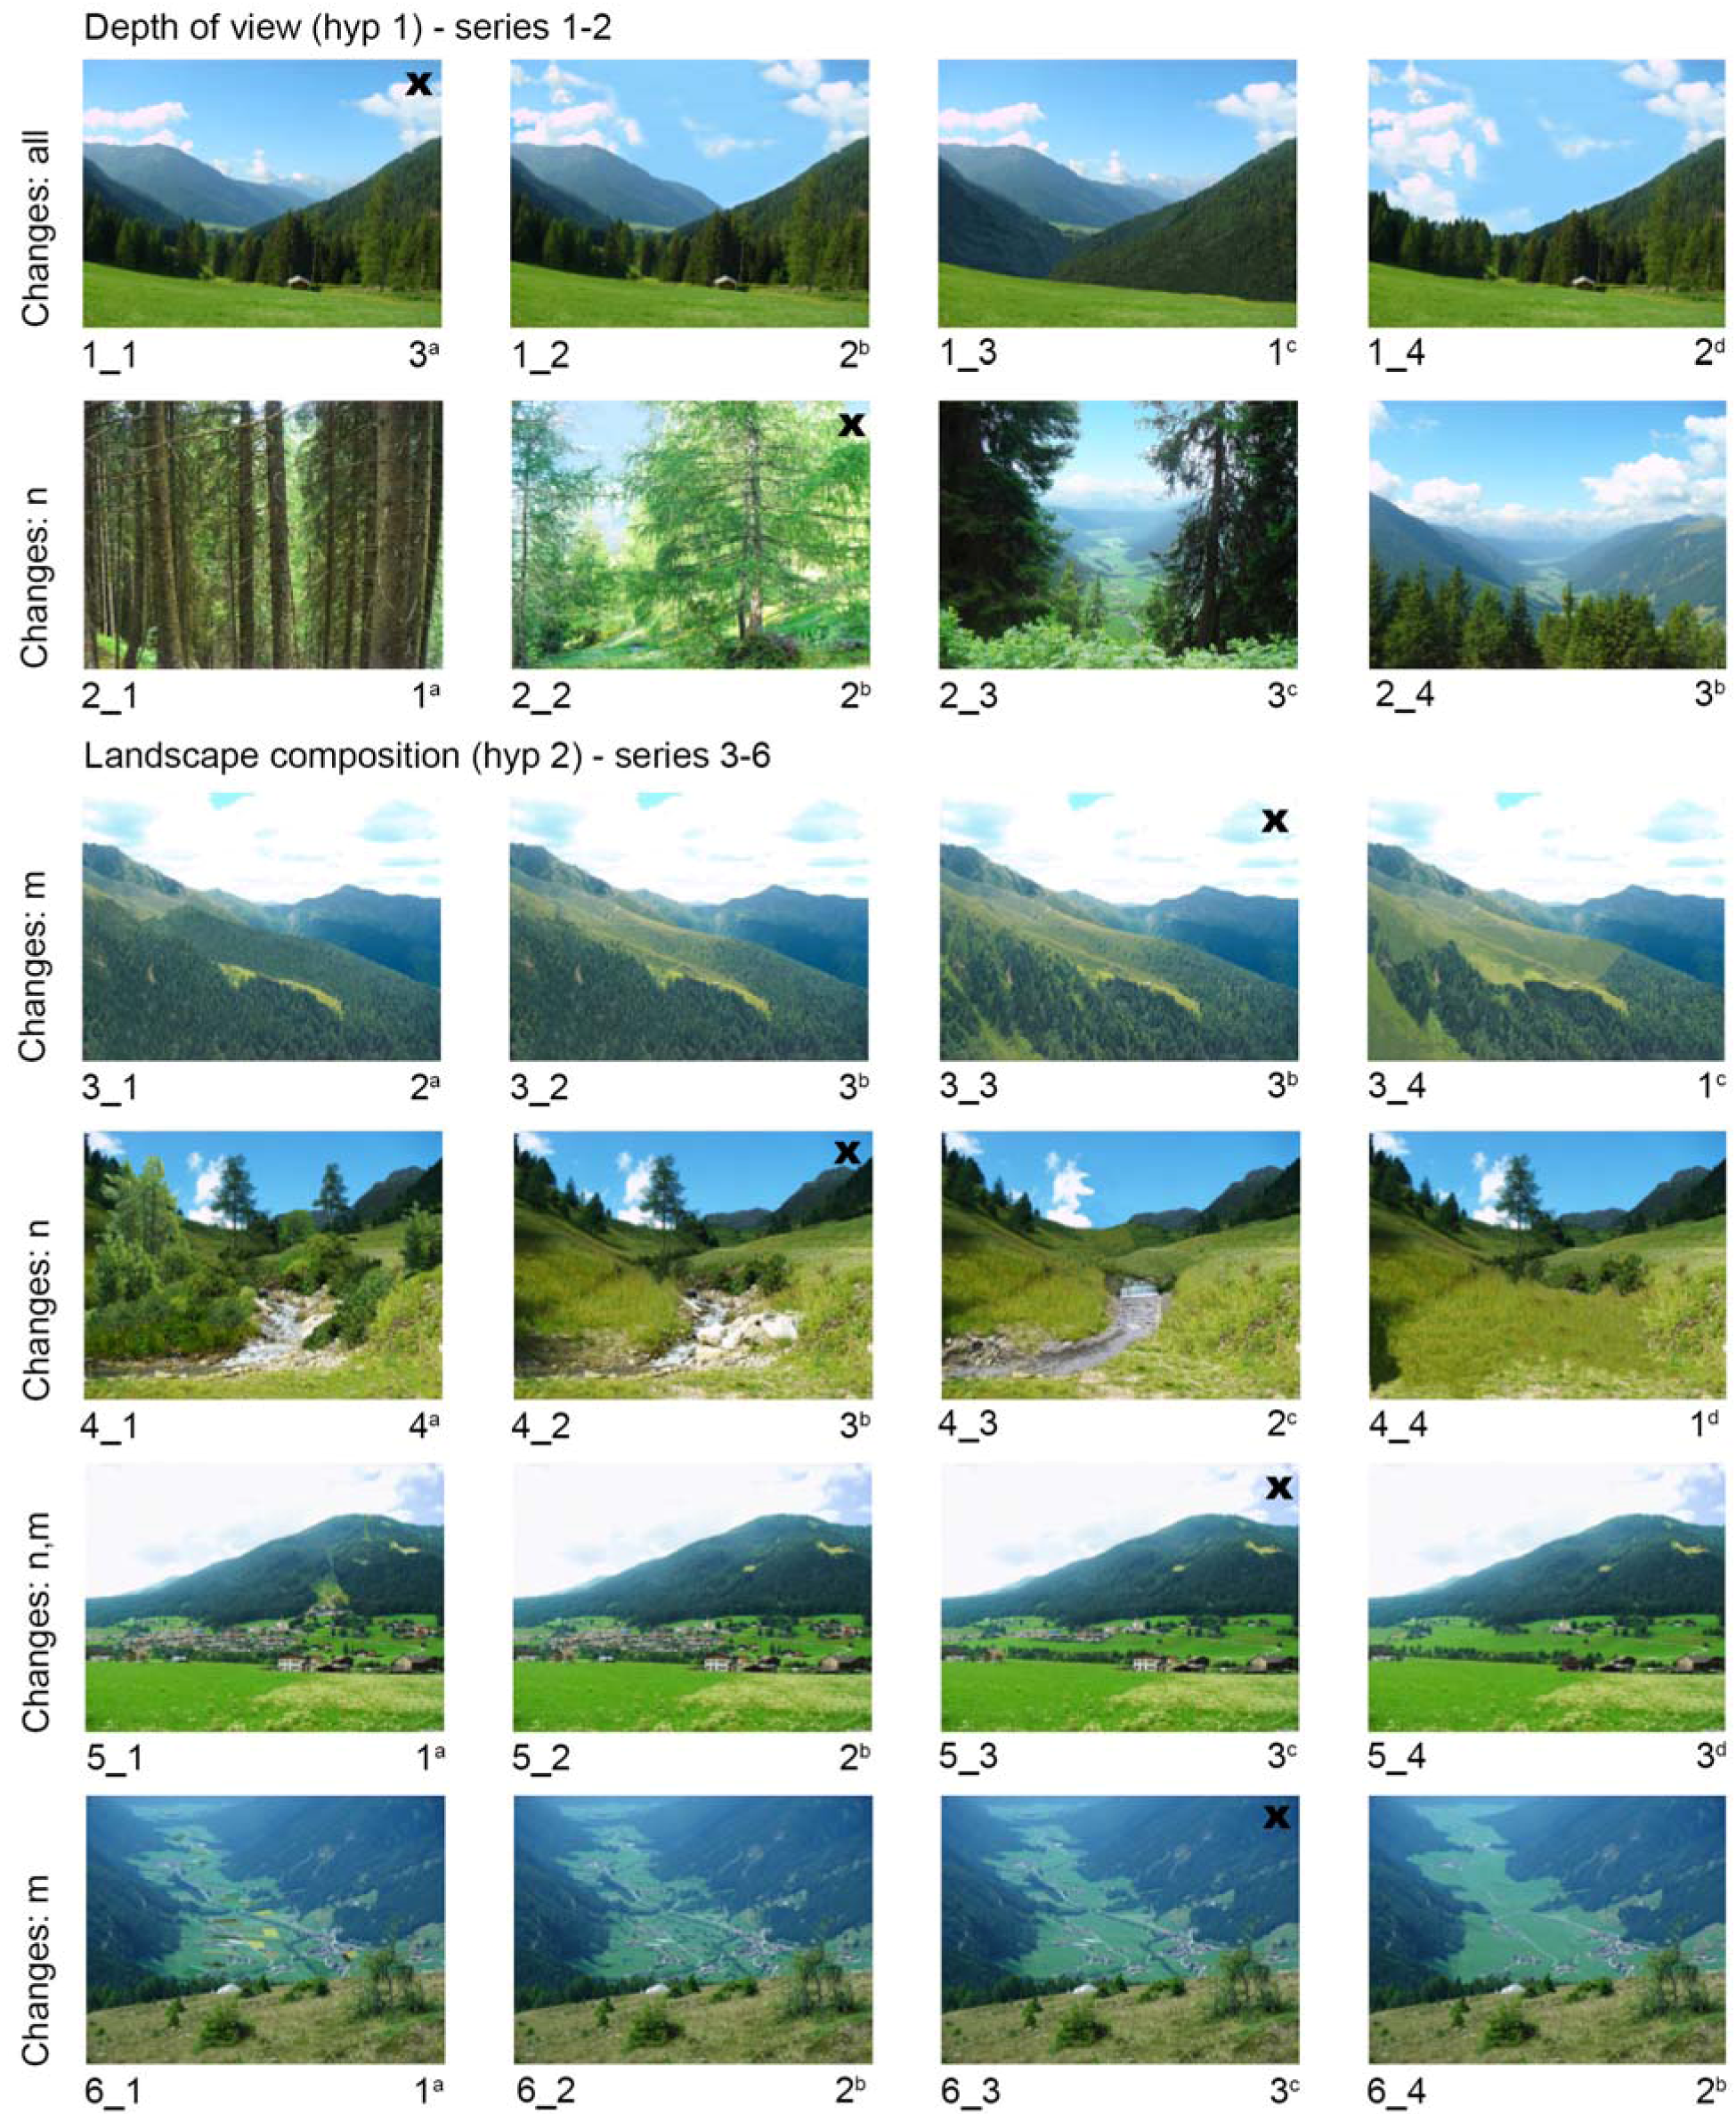
  • Hypothesis 1: To analyze the influence of the depth of view, we created Series 1 by removing the landscape features related to the distance zones from the original picture (Figure 1). Series 2 was composed of different pictures with different view extents.
    Series 1. (depth of view): pic 1_1: all three distance zones; pic 1_2: near and middle zone. pic 1_3: all distance zones but without any elements in the near zone; pic 1_4: only near zone.
    Series 2. (depth of view): pic 2_1: dense forest with no vistas; pic 2_2: sparse forest with small vistas; pic 2_3: dense forest with a small clear cutting with vista; pic 2_4: vista above tree tops.
  • Hypothesis 2: To verify the influence of specific landscape elements from literature, we used the picture Series 3–6 (Figure 1). Naturalness (Series 3 and 4), urban sprawl (Series 5), and landscape diversity (Series 6) may have a positive or negative influence on scenic beauty [9,26,27]. The picture of Series 3 was modified in the middle zone indicating different degrees of human influence. In Series 4, we used a landscape with and without a stream because water, one aspect for a natural environment, is highly preferred [26]. Series 5 represented different degrees of urban sprawl in the near and middle zones. Series 6 showed different landscape patterns in the middle zone.
    Series 3. (naturalness): pic 3_1: slope with widespread dense forest; pic 3_2: slope with dense forest and strong human influence; pic 3_3: slope with sparse forest; pic 3_4: slope with sparse forest and strong human influence.
    Series 4. (naturalness): pic 4_1: near-natural stream and riparian vegetation; pic 4_2: near-natural stream; pic 4_3: artificial stream course; pic 4_4: landscape without a stream course.
    Series 5. (urban sprawl): pic 5_1: large human settlements and ski tourism (17% of the picture); pic 5_2: large human settlements (14% of the picture); pic 5_3: actual situation (7% settlements of the picture); pic 5_4: only isolated buildings (3% of the picture).
    Series 6. (landscape diversity in the valley floor): pic 6_1: diverse land use; pic 6_2: prevalent grassland landscape with many structural elements; pic 6_3: prevalent grassland landscape with a few structural elements; pic 6_4: prevalent grassland landscape without any structural elements.
To answer hypothesis 3, the respondents were selected in public places on the basis of a stratified random sampling, with the aim to get more than 50 persons in each group (origin, gender, age, cultural background) (Table 1). The response rate was 89% and the 253 participants, locals and tourists of both study areas, were asked to rank the Series 1–6 by their scenic beauty without the possibility of equal rankings: from 1 = least beautiful to 4 = most beautiful. The respondents spent in average 5–10 minutes to fill out the questionnaire.
Figure 1. Pictures of landscape scenarios 1–6 with information on the manipulated view zones: near zone (n), middle zone (m), and far zone (f). The original pictures are marked with a cross. The pictures of each series were ranked from 1 = least beautiful to 4 = most beautiful. The median is shown under each picture, on the right. The letters (a, b, c, d) describe the significant differences of evaluation of the pictures per series (Mann-Whitney U test, p< 0.05).
Sustainability 05 01080 g001
Table 1. Socio-demographic characteristics of the respondents.
Origin (N = 253)Gender (N = 253)Age (N = 253)Cultural background-Tourists ( N = 125)
LocalsTouristsFemaleMale< 3030–60> 60GermanItalian
12812513511873127536461
The rankings of the six different picture series were not comparable with each other because each series was related to a specific theme and the pictures were ranked only within each series. To compare the different themes, a seventh series was added at the end of the questionnaire, composed of the six original photographs from Series 1–6. The respondents were also asked to rank Series 7, ranking here ranging from 1 = least beautiful to 6 = most beautiful.

2.3. Statistical Analyses

The statistical analyses were arranged in SPSS Statistics 17. The median of the ranked scenic beauty (total respondents) was calculated for all pictures. Each group (origin, gender, age, cultural background of tourists) was tested. We used the Mann-Whitney U test (p < 0.05) to compare the median values of the series. Based on Series 1, we derived weighting factors for the distance zones. By Series 2, the weighting result was verified. Series 3 to 6 were used to identify and quantify the influence of landscape elements by calculating landscape composition factors. Based on Series 7, a scenic beauty model was defined by using generalized linear models (GLM).

3. Results

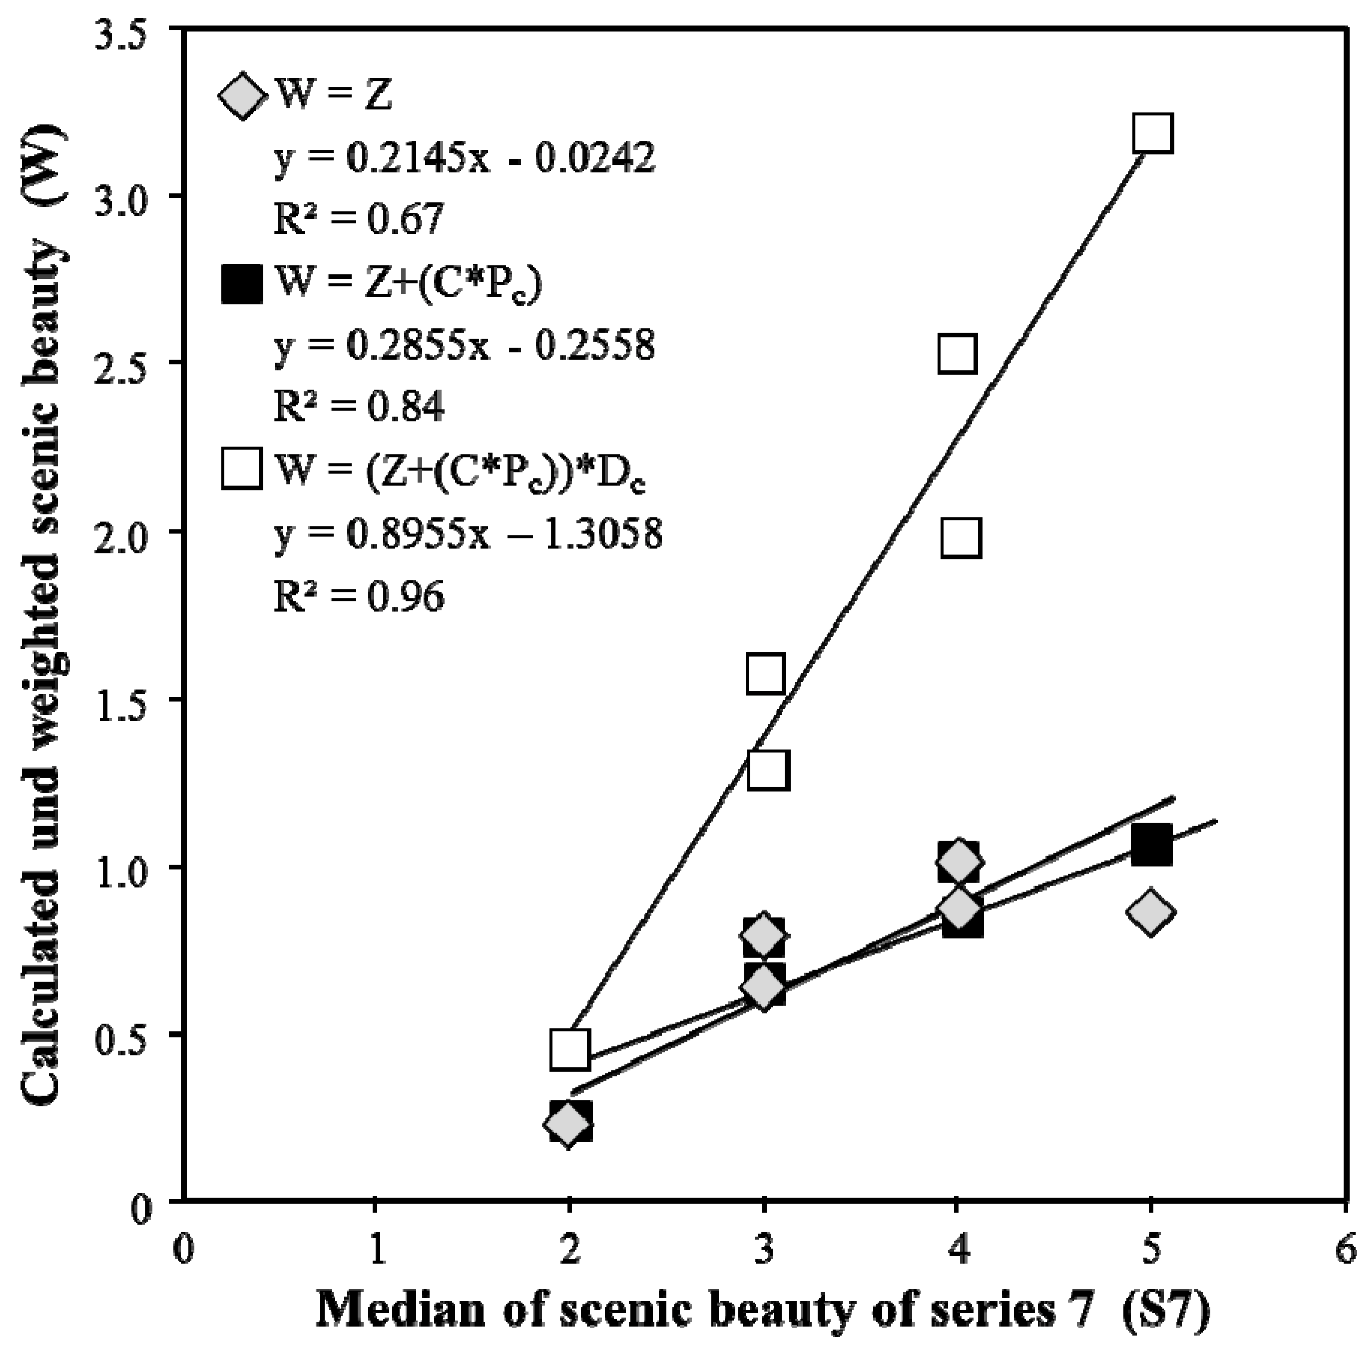
3.1. Modeling Scenic Beauty and Sensitivity Analyses

According to our hypotheses, depth of view and the closeness of specific landscape elements are important aspects of scenic beauty. To evaluate the influence of distance, but also the composition of the landscape in the near zone (positively or negatively perceived elements) on the perception process and, thus, on the scenic beauty of landscapes, we developed a general model allowing us to compare landscape properties and to evaluate its scenic beauty. We generated the scenic beauty model in two steps: (1) distance weighting factors, and (2) landscape composition factors.

3.1.1. Distance Weighting Factor

The results of Series 1 and 2 supported the hypothesis 1. The most beautiful landscape was the landscape with all visible distance zones (picture 1_1). While dense forest without any vista was rated worst (picture 2_1), respondents preferred the vista above tree tops (picture 2_4). Furthermore, Series 1 indicated that the influence of landscape elements on scenic beauty depends on distance. Judged as least beautiful by 63% of the respondents was the landscape without landscape elements in the near zone (picture 1_3). Even the landscape with only the near zone was rated better (picture 1_4). To build the scenic beauty model, in a first step, weighting factors for the distance zones Z(n,m,f) were determined based on the Series 1 (Equation 1 to Equation 3). The sum of all 3 zones together is Z = 1. The following weighting factors for the 3 distance zones were derived: near zone Z(n) = 0.64, middle zone Z(m) = 0.22, and far zone Z(f) = 0.14. Each original value of the survey (Series 7) was then multiplied with these weighting factors (Table 2).
Sustainability 05 01080 i001
Sustainability 05 01080 i002
Sustainability 05 01080 i003
where by Z(n) = near zone weighting factor, Z(m) = middle zone weighting factor, and Z(f) = far zone weighting factor. Sustainability 05 01080 i004
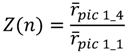
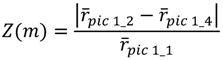
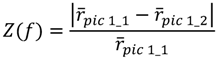
pic = mean rank of scenic beauty of the pictures 1–4 of Series 1 (see Figure 1).

3.1.2. Landscape Composition Factors

Hypothesis 2 was tested by analyzing Series 3 to 6. In the near zone, naturalness and also diversity of elements emerged as very important factors in scenic beauty as shown by the results of Series 4 (Figure 1). The most liked landscape was the one with the near-natural stream and the riparian vegetation. The landscape with an artificial stream and the same landscape without a stream received the worst ratings. In the middle zone, a sparse forest with a strong human influence (picture 3_4) was even less liked than a dense forest (picture 3_1). Increasing urban sprawl in the near and middle zones of Series 5 was evaluated negatively. Series 6 put the focus of attention to landscape diversity in the middle zone. The actual landscape in the study area today, a typical grassland landscape, was liked best. In contrast, the landscape with diverse land use was less preferred. The results suggest that in the near zone naturalness and diversity are important, but that strong urban sprawl can lower the perceived scenic beauty. The results of Series 3 to 6 indicate also that the influence of landscape characteristics or single elements changes with distance.
To account for the positive or negative influence of landscape elements on scenic beauty in relationship to their distance from the observer, we introduced three different factors. First, the composition weighting (C) for different elements, whether positive (increasing scenic beauty) or negative (decreasing scenic beauty), derived from literature [11,12,25,27]. All element compositions not clearly attributed as positive or negative were considered neutral and were not weighted. Second, we assessed dominances of these positive or negative landscape elements (Pc) by calculating their area-weighted distribution on the picture. Third, we counted the different landscape area types (not the single elements) such as forests, grasslands, settlements, and arable lands to consider landscape diversity (Dc) (Table 2). Finally, the weighted scenic beauty (W) was calculated by applying equation (4):
W = (Z+(C*Pc))*Dc
where Z = distance weighting factor, C = positive/negative composition weighting, Pc = dominance, Dc = diversity.
The coefficient of determination (R2) increased when considering the distance weighting factor (Z) and stepwise including the landscape composition factors (C, Pc, Dc) reaching finally a high correlation (R2 = 0.96) (Figure 2) .
Table 2. Median of scenic beauty of Series 7 (S7) and weighted scenic beauty (W) for each picture. The weighted scenic beauty (W) was calculated by using the distance weighting factor (Z), positive/negative composition weighting (C), dominance (Pc), and diversity (Dc).
Picture numberDistance weighting factorLandscape composition factorsScenic beauty
Visible distance zonesZCPcDcS7W
1_1Z(n) + Z(m) + Z(f)1.0urban sprawl = negative (-1)0.01241.98
2_2Z(n) + Z(f)0.78neutral (0)0231.56
3_3Z(n)0.64neutral (0)0231.28
4_2Z(n) + Z(m)0.86water = positive (+1)0.2353.18
5_3Z(m)0.22urban sprawl = negative (-1)0.07320.45
6_3Z(n) + Z(m)0.86urban sprawl = negative (-1)0.02342.52
Figure 2. Correlation of the medians of scenic beauty of Series 7 and weighted scenic beauty (W) using the distance weighting factor (Z), positive/negative composition weighting (C), dominance (Pc), and diversity (Dc).
Sustainability 05 01080 g002

3.2. Viewing Human Impact

Hypothesis 3 was not approved completely because there were significant differences in only 28.1% of all ratings in the different groups (cf. Table 3). In the gender group, only two significant differences could be found for pictures 2_1 and 6_3. The results of the origin group suggest that landscapes with human influence in the form of artificial elements (picture 5_1) are rated better by tourists than by locals. In addition, tourists also rated reforestation better than locals (pictures 2_1, 3_1). Analyzing the two cultural background groups of tourists (Italian, German), we found that Italian tourists rated artificial elements (picture 4_3) and reforestation (picture 2_1) in the landscape better than German tourists did. The age group returned particularly significant differences between respondents over 60 years and those under 60 years. The older generation rated open, structured landscapes better than younger respondents did (pictures 5_1, 6_1, 3_4). As hypothesis 3 was not verified, we did not include specific perception of different socio-demographic groups in our modeling approach.
Table 3. The median of scenic beauty of Series 1–6 in the groups origin, gender, age and cultural background. Group differences were tested with a Mann-Whitney U test (p < 0.05). The letters (a, b, c) describe the significant differences between the pictures within a group and are highlighted in grey.
Origin (N = 253) Gender (N = 253) Age (N = 253) Cultural background-tourists (N = 125)
Picture Locals Tourists Female Male < 30 years 30–60 years > 60 years German Italian
1_1 4 3 3 4 4 3 3 4a 3b
1_2 3 3 3 3 3 3 3 3 3
1_3 1 2 1 1 2 2 1 1a 2b
1_4 2 2 2 2 2 2 2 2 2
2_1 1a 1b 1a 1b 1 1 1 1a 2b
2_2 3a 2b 3 2 3 2 3 2 2
2_3 3 4 4 3 4 3 4 4 3
2_4 3 3 3 3 3a 3a 2b 3a 3b
3_1 2a 2b 2 2 2 2 2 2a 2b
3_2 3 3 3 3 3 3 3 3 3
3_3 3a 3b 3 3 3 3 3 2a 2b
3_4 2 1 1 1 1a 1a 2b 1 1
4_1 4 4 4 4 4 4 4 4 4
4_2 3 3 3 3 3 3 3 2a 2b
4_3 2 2 2 2 2a 2b 2 3a 3b
4_4 2a 1b 1 1 1 1 2 1 1
5_1 1a 2b 1 1 1a 1a 2b 1a 2b
5_2 2 2 2 2 2 2 2 2 2
5_3 3a 3b 3 3 3a 3a 3b 3 3
5_4 4a 3b 3 4 3 4 3 3 3
6_1 1 1 1 1 1a 1a 1b 1 1
6_2 2 2 3 2 3 2 3 2 2
6_3 3a 3b 3a 3b 3a 3b 3c 3a 3b
6_4 2 3 2 3 2 3 3 2 3

4. Discussion

4.1. Influence of View Zones and Distance

The results suggest that distance played a major role in the perception of Alpine landscapes. Topography influences the depth of view which is central to our understanding of landscapes and perceived scenic beauty [32,34]. As confirmed by Tveit [8], the distance from the observer was important for the perception of scenic beauty because people’s ability to distinguish between features is decreasing with distance [47]. We used the distance zones, adapted to the Alps, by Schirpke et al. [31]: the near zone 0–1.5 km, the middle zone 1.5–10 km, and the far zone 10–50 km. For each distance zone, we derived the distance weighting factors: near zone 64%, middle zone 22%, and far zone 14%.
Landscape attributes and elements like naturalness, diversity and urban sprawl are often used as predictors for scenic beauty, however, mostly not related to view zones [11,21,24,25,26]. Similar to other studies [21,34,43,44,45], attributes like naturalness, presence of water, and diversity of elements emerged as positive predictors for scenic beauty in the near zone. In contrast, the modern human settlement in the near zone and also human influence as ski tourism infrastructure in the middle zone were evaluated negatively. An unexpected result emerged for the landscape diversity of the middle zone (Series 4). In the literature, diversity is generally considered an attribute for a high scenic beauty of landscapes [28,41,46]. Accordingly, Lindemann-Matthies et al. [41] found a high preference for diverse landscapes with structural elements in the middle zone but a low rating for arable land. In our study, it was not the most diverse landscape that was rated highest but a medium structured grassland [48]. This result may be explained by the view of the valley seen from above and at a larger distance. Furthermore, the results indicate that the younger generation (under 60 years) was not familiar with the pattern of a diverse landscape and that for the middle zone concepts like coherence [1,20,44] and legibility [26] were more important than diversity [20,26,44].

4.2. Influence of Group Differences

Contrary to the hypothesis 3, no significant differences emerged for 71.9% of all ratings in the different groups indicating that the landscape variations were much greater than the variations of observer’s judgments as also confirmed by other studies [29,36,37,38]. Although 28.1% of all ratings were significantly different, the median values are in most cases the same. Our study therefore reflects the perceptions of all respondents without distinguishing between different socio-demographic groups [13]. Nevertheless, some differences have to be pointed out. Locals in South and North Tyrol evaluated landscape changes more critical than tourists. The local group seemed to be attached to the current landscape or would prefer a development towards traditional cultural landscapes. In contrast, the tourist group seemed to be more open to greater landscape changes like reforestation or human-caused landscape elements.
According to our results, the locals are familiar with the cultural landscape through their professional or leisure uses of it [27]. Big changes (e.g., reforestation or urban sprawl) may be interpreted as loss of home land [4]. Unlike younger people, the 60+ generation also preferred traditional cultural landscapes with great landscape diversity. With the decrease of diverse landscapes today, people are not familiar any more with landscape diversity and thus not able to read the landscapes [26]. The older generation, however, has known these landscapes from childhood. As the perception of scenic beauty starts at an early age, the older generation rated this landscape type better [35].
Tourists rated a landscape characterized by artificial elements and facilities but also natural reforestation higher than locals did. In tourist destinations like South Tyrol and Tyrol, skiing areas and the related facilities offer many holiday options for tourists. Hunziker [4] stated that an ideal landscape depends not only on its scenic beauty but also on other interests. If a ski lift is relevant for touristic interests, then the tourists will rate such a landscape more positively. Moreover, differences between the German- and Italian-speaking groups could be found. While the Italians were more open to extreme landscape changes, for the Germans among the tourist respondents, naturalness was more important.

4.3. Limitations of the Method

Although the questionnaire consisted of a small number of pictures and general conclusions are limited, our results indicate that the modeling approach is a suitable option for creating a scenic beauty model. To validate the model, the study should be repeated with a higher number of pictures indicating clearly the different distance zones and testing various landscape elements especially in the near zone. Furthermore, the ranking of the pictures was problematic for comparing the different series among each other. The pictures should therefore be rated to allow a direct comparison.

5. Conclusions

Related to the initial three hypotheses, we deduce the following conclusions from our results:
(1)
Distance zones have an important influence on how humans recognize and understand a landscape. Landscape elements in the near zone have the most influence on scenic beauty. In terms of view depth, pictures with all three distance zones are voted best. Considering processes like reforestation in Alpine landscapes, the effect of long-distance views should be taken into account and the aspects of vistas should be included into regional planning.
(2)
Naturalness and diversity of structural elements have a positive influence whereas artificial elements are judged negatively, especially if they are in the near zone. Political decision makers should keep in mind that landscape changes towards more homogenous landscapes are perceived negatively. Future governance structures should therefore support the conservation of the cultural landscape.
(3)
Particularly locals are closely connected to the cultural landscape and find landscape changes problematic. Tourists seem more open to landscapes changes with reforestation or human elements. Regional planning should respect the perceptions of the local population to assure the quality of life for the inhabitants and, at the same time, account for perception of scenic beauty of tourists to support an economic growth of the region.
In general, the modeling results have some important implications for managing sustainable landscapes. In terms of tourism development, viewpoints and forest clearings along roads or hiking trails should be maintained or created to allow long vistas. This is especially important for the alpine zone, which is highly important for touristic activities and where the abandonment of grasslands mostly takes place. As urban sprawl is perceived negatively, the urbanized area should not be extended, but its density increased. In contrast, natural landscape features should be preserved or restored, for example, river landscapes with natural riparian vegetation. Furthermore, landscape diversity in general should to be preserved.

Acknowledgments

This work was funded by the INTERREG IV—EU project (Agri)cultural landscape—Strategies for the cultural landscape of the future, Project No. 4684, CUP: B26D09000010007.

Conflict of Interest

The authors declare no conflict of interest.

References and Notes

  1. Antrop, M. Landscape change and the urbanization process in Europe. Landscape Urban Plan. 2004, 67, 9–26. [Google Scholar] [CrossRef]
  2. Schneeberger, N.; Bürgi, M.; Hersperger, A.M.; Ewald, K.C. Driving forces and rates of landscape change as a promising combination for landscape change research—An application on the northern fringe of the Swiss Alps. Land Use Policy 2007, 24, 349–361. [Google Scholar] [CrossRef]
  3. Tasser, E.; Ruffini, F.V.; Tappeiner, U. An integrative approach for analysing landscape dynamics in diverse cultivated and natural mountain areas. Landscape Ecol. 2009, 24, 611–628. [Google Scholar] [CrossRef]
  4. Hunziker, M. The spontaneous reafforestation in abandoned agricultural lands: Perception and aesthetic assessment by locals and tourists. Landscape Urban Plan. 1995, 31, 399–410. [Google Scholar] [CrossRef]
  5. Tasser, E.; Walde, J.; Tappeiner, U.; Teutsch, A.; Noggler, W. Land-use changes and natural reforestation in the Eastern Central Alps. Agr. Ecosyst. Environ. 2007, 118, 115–129. [Google Scholar] [CrossRef]
  6. Costanza, R. Ecosystem Services and Ecological Indicators, In Ecological Indicators for Assessment of Ecosystem Health; Jørgensen S.E.;, Xu, F.; Costanza, R., Eds.; Taylor & Francis: Boca Raton, FL, USA, 2010; pp. 189–198. [Google Scholar]
  7. Millennium Ecosystem Assessment. Ecosystems and Human Well-being; Synthesis, Island Press: Washington, DC, USA, 2005.
  8. Tveit, M.S. Indicators of visual scale as predictors of landscape preference; a comparison between groups. J. Environ. Manage. 2009, 90, 2882–2888. [Google Scholar] [CrossRef]
  9. Lindemann-Matthies, P.; Junge, X.; Matthies, D. The influence of plant diversity on people’s perception and aesthetic appreciation of grassland vegetation. Biol. Conserv. 2010, 143, 195–202. [Google Scholar] [CrossRef] [Green Version]
  10. Soliva, R.; Rønningen, K.; Bella, I.; Bezak, P.; Cooper, T.; Flø, B.E.; Marty, P.; Potter, C. Envisioning upland futures: Stakeholder responses to scenarios for Europe's mountain landscapes. J. Rural Stud. 2008, 24, 56–71. [Google Scholar] [CrossRef]
  11. Beza, B.B. The aesthetic value of a mountain landscape: A study of the Mt. Everest Trek. Landscape Urban Plan. 2010, 97, 306–317. [Google Scholar] [CrossRef]
  12. Grêt-Regamey, A.; Bishop, I.D.; Bebi, P. Predicting the scenic beauty value of mapped landscape changes in a mountainous region through the use of GIS. Environ. Plan. B: Planning and Design 2007, 34, 50–67. [Google Scholar] [CrossRef]
  13. Augenstein, I. Die Ästhetik der Landschaft: Ein Bewertungsverfahren für die Planerische Umweltvorsorge (in German); Weißensee-Verlag: Berlin, Germany, 2002. [Google Scholar]
  14. Jessel, B. Elements, characteristics and character—Information functions of landscapes in terms of indicators. Ecol. Indicators 2006, 6, 153–167. [Google Scholar] [CrossRef]
  15. Lothian, A. Landscape and the philosophy of aesthetics: Is landscape quality inherent in the landscape or in the eye of the beholder? Landscape Urban Plan. 1999, 44, 177–198. [Google Scholar] [CrossRef]
  16. Nohl, W. Landschaftsplanung: Ästhetische und rekreative Aspekte; Patzer Verlag: Berlin/Hannover, Germany, 2001. [Google Scholar]
  17. Weinstoerffer, J.; Girardin, P. Assessment of the contribution of land use pattern and intensity to landscape quality: use of a landscape indicator. Ecol. Model. 2000, 130, 95–109. [Google Scholar] [CrossRef]
  18. Bourassa, S.C. The Aesthetics of Landscape; Belhaven Press: London-New York, UK, 1991. [Google Scholar]
  19. Soliva, R.; Hunziker, M. How do biodiversity and conservation values relate to landscape preferences? A case study from the Swiss Alps. Biodivers. Conserv. 2009, 18, 2483–2507. [Google Scholar] [CrossRef]
  20. Tveit, M.S.; Ode, Å.; Fry, G. Key Concepts in a Framework for Analysing Visual Landscape Character. Landscape Res. 2006, 31, 229–255. [Google Scholar] [CrossRef]
  21. Purcell, A.T.; Lamb, R.J. Preference and naturalness: An ecological approach. Landscape Urban Plan. 1998, 42, 57–66. [Google Scholar] [CrossRef]
  22. Junge, X.; Jacot, K.A.; Bosshard, A.; Lindemann-Matthies, P. Swiss people's attitudes towards field margins for biodiversity conservation. J. Nature Conserv. 2009, 17, 150–159. [Google Scholar] [CrossRef] [Green Version]
  23. Rüdisser, J.; Tasser, E.; Tappeiner, U. Distance to nature—A new biodiversity relevant environmental indicator set at the landscape level. Ecol. Indicators 2012, 15, 208–216. [Google Scholar] [CrossRef]
  24. Real, E.; Arce, C.; Sabucedo, J.M. Classification of landscapes using quantitative and categorical data and prediction of their scenic beauty in North-Western Spain. J. Environ. Psych. 2000, 20, 355–373. [Google Scholar] [CrossRef]
  25. Taylor, J.G.; Czarmowski, K.J.; Sexton, N.R.; Flick, S. The importance of water to Rocky Mountain Natural Park Visitors: An adoption of visitor employed photography to natural resources management. J. Applied Recr. Res. 1996, 20, 61–84. [Google Scholar]
  26. Kaplan, R.; Kaplan, S. The Experience of Nature: A Psychological Perspective; Cambridge University Press: New York, NY, USA, 1989. [Google Scholar]
  27. Gehring, K. Landscape Needs and Notions. Preferences, Expectations, Leisure Motivation, and the Concept of Landscape from a Cross-Cultural Perspective; Swiss Federal Research Institute WSL: Birmensdorf, Switzerland, 2006. [Google Scholar]
  28. Dramstad, W.E.; Tveit, M.S.; Fjellstad, W.J.; Fry, G.L.A. Relationships between visual landscape preferences and map-based indicators of landscape structure. Landscape Urban Plan. 2006, 78, 465–474. [Google Scholar] [CrossRef]
  29. Tveit, M.S.; Fry, G. Advantages of using different data sources in assessment of landscape change and its effect on visual scale. Ecol. Indicators 2010, 10, 24–31. [Google Scholar]
  30. Germino, M.J.; Reiners, W.A.; Blasko, B.J.; McLeod, D.; Bastian, C.T. Estimating visual properties of Rocky Mountain landscapes using GIS. Landscape Urban Plan. 2001, 53, 71–83. [Google Scholar] [CrossRef]
  31. Schirpke, U.; Tasser, E.; Tappeiner, U. Predicting scenic beauty of mountain regions. Landscape Urban Plan. 2013, 111, 1–12. [Google Scholar] [CrossRef]
  32. Bishop, I.D.; Wherrett, J.R.; Miller, D. Using image depth variables as predictors of visual quality. Environ Plan. 2000, 27, 865–875. [Google Scholar] [CrossRef]
  33. Ribe, R.G.; Armstrong, E.T.; Gobster, P.H. Scenic Vistas and the Changing Policy Landscape: Visualizing and Testing the Role of Visual Resources in Ecosystem Management. J.Landscape 2002, 21, 42–66. [Google Scholar] [CrossRef]
  34. Patsfall, M.R.; Feimer, N.R.; Buhyoff, G.J.; Wellman, J.D. The prediction of scenic beauty from landscape context and composition. J. Environ. Psych. 1984, 4, 7–26. [Google Scholar] [CrossRef]
  35. Bauer, N.; Wallner, A.; Hunziker, M. The change of European landscapes: Human-nature relationships, public attitudes towards rewilding, and the implications for landscape management in Switzerland. J. Environ. Manag. 2009, 90, 2910–2920. [Google Scholar] [CrossRef]
  36. Kearney, A.R.; Bradley, G.A.; Petrich, C.H.; Kaplan, R.; Kaplan, S.; Simpson-Colebank, D. Public perception as support for scenic quality regulation in a nationally treasured landscape. Landscape Urban Plan. 2008, 87, 117–128. [Google Scholar] [CrossRef]
  37. Cañas, I.; Ayuga, E.; Ayuga, F. A contribution to the assessment of scenic quality of landscapes based on preferences expressed by the public. Land Use Policy 2009, 26, 1173–1181. [Google Scholar] [CrossRef]
  38. Daniel, T.C. Whither scenic beauty? Visual landscape quality assessment in the 21st century. Landscape Urban Plan. 2001, 54, 267–281. [Google Scholar] [CrossRef]
  39. Zube, E.; Sell, J.; Taylor, J. Landscape perception; research, application and theory. Landscape Urban Plan. 1982, 9, 1–32. [Google Scholar] [CrossRef]
  40. Karjalainen, E.; Tyrväinen, L. Visualization in forest landscape preference research: A Finnish perspective. Landscape Urban Plan. 2002, 59, 13–28. [Google Scholar] [CrossRef]
  41. Lindemann-Matthies, P.; Briegel, R.; Schüpbach, B.; Junge, X. Aesthetic preference for a Swiss alpine landscape: The impact of different agricultural land-use with different biodiversity. Landscape Urban Plan. 2010, 98, 99–109. [Google Scholar] [CrossRef]
  42. Shafer, J.; Elwood, L.; Brush, R.O. How to measure preferences for photographs of natural landscapes. Landscape Plan. 1977, 4, 237–256. [Google Scholar] [CrossRef]
  43. Hagerhall, C.M.; Purcell, T.; Taylor, R. Fractal dimension of landscape silhouette outlines as a predictor of landscape preference. J. Environ. Psych. 2004, 24, 247–255. [Google Scholar] [CrossRef]
  44. Sevenant, M.; Antrop, M. Cognitive attributes and aesthetic preferences in assessment and differentiation of landscapes. J. Environ. Manag. 2009, 90, 2889–2899. [Google Scholar] [CrossRef]
  45. Strumse, E. Environmental attributes and the prediction of visual preferences for agrarian landscapes in Western Norway. J. Environ. Psych. 1994, 14, 293–303. [Google Scholar] [CrossRef]
  46. Nohl, W. Sustainable landscape use and aesthetic perception-preliminary reflections on future landscape aesthetics. Landscape Urban Plan. 2001, 54, 223–237. [Google Scholar] [CrossRef]
  47. Miller, D. A method for estimating changes in the visibility of land cover. Landscape Urban Plan. 2001, 54, 93–106. [Google Scholar] [CrossRef]
  48. Tappeiner, U.; Tappeiner, G.; Hilbert, A.; Mattanovich, E. The EU Agricultural Policy and the Environment-Evaluation of the Alpine Region; Blackwell: Berlin-Wien, Germany, 2003. [Google Scholar]

