1. Introduction
Cities have always been hot spots of innovations, but since the beginning of industrialization they have also faced severe environmental impact due to the high concentration of industries, population and infrastructures. Today, and in the coming decades, cities can also be seen as hot spots of greenhouse gas emissions, being areas most exposed to the impacts of climate change [
1]. This is particular true for cities in developing regions, where the urbanization rate and number of industries is increasing at a high pace. According to the UN Habitat [
1] about 40% to 78% of global greenhouse gas emissions are estimated to originate in urban areas.
Therefore, low carbon city strategies and concepts implicate large greenhouse gas (GHG) mitigation potential. At the same time, with high population and infrastructure densities, as well as concentrated economic activities, cities are particularly vulnerable to the impacts of climate change and need to adapt. Scarce natural resources further constrain the leeway for long-term, sustainable urban development.
1.1. Background to LCFC Project
This paper presents outcomes of the Sino-German Low Carbon Future Cities (LCFC) project. The aim of the project is to develop an integrated, urban, low carbon adaptation and circular economy strategy to address the large mitigation potential in urban areas by, and through, engaging cities and stakeholders in both China and Germany in an integrated approach. The study focuses on two pilot regions—one in China (Wuxi) and one in Germany (Düsseldorf)—and is conducted by a German-Chinese research team supported by the German Stiftung Mercator.
The purpose of the present study within the LCFC project was the analysis of the
status quo and the assessment of the likely future development for the city of Wuxi, taking into account three project dimensions:
greenhouse gas emissions and related mitigation potentials;
vulnerability to climate change and adaptation options
material and resource uses.
The outcomes of this study form the scientific basis for the development of LCFC strategy.
The study has been divided into five main working areas. The emission inventory gives an overview on the present relevant GHG emissions; it follows the IPCC-guidelines and uses data of the Wuxi statistical yearbook (WMBS) [
2]. The results are
inter alia basis and important criteria for the identification of key sectors relevant to policy, resource use (for energy and construction sector), vulnerability to climate change and future trends. The vulnerability to climate change in Wuxi was assessed by analysing recent climatic changes, and projecting expected changes in temperature and precipitation over the coming four decades. The future development of energy demand and related CO
2 emissions in 2030 were simulated in the current policy scenario (CPS). This modeling approach uses five different sub-models and implies Wuxi’s low carbon targets. Selected aspects of Wuxi’s current material and water flows in the energy transformation sector and the buildings sector were investigated and modelled. After shortly describing the applied methodologies, the paper summarizes the results and provides first conclusions for decision-makers as well as for research.
1.2. Background to Wuxi and Current Policy Approach
The pilot city Wuxi is located in the East of China on the lower Yangtze River, about 130 km from Shanghai. Wuxi has a population of about six million and its economy has witnessed a considerable increase in recent years.
Wuxi is a regional hotspot of energy-intensive industry operations, especially for steel, iron and chemical production. The overall GDP was CNY 575.8 billion (EUR 64.3 billion) in 2010, double that of 2005 and with an average annual growth rate of 14% (2006–2010). All these achievements make Wuxi’s comprehensive strength and competitiveness rank high among large and medium cities in China.
The GDP per capita of Wuxi is high, resulting in relatively low carbon intensity. However, its relative emissions, i.e., CO2 per capita, are very high compared to Chinese average. Nonetheless, the Wuxi city government is an early mover in promoting low carbon development in China and has adopted several policy documents to emphasize this role. Among the key documents are the 12th Five Year Plans from 2011 (Low Carbon City Construction Plan; Energy Conservation Plan; Energy Development Plan). They are strategic documents that lay out the city’s low carbon strategy in different sectors. An important target is to reduce CO2 emissions by 20% per unit GDP within the 12th Five-Year Plan period (2011–2015). This means that Wuxi’s carbon intensity target is three percentage points more ambitious than the national target, despite its strong dependence on energy-intensive industries. For 2020, the Wuxi government has committed itself to reduce the carbon intensity of the city’s economy by 50% compared to 2005.
Exemplified for specific sectors, the following future targets are set, e.g., the city government aims to alleviate the carbon footprint of the local industry by gradually phasing-out energy intensive enterprises and accelerating the development of a less carbon-intensive service sector. The heavily coal-reliant energy supply will be diversified through stopping further construction of coal-fired power plants and increasing natural gas utilization, as well as the usage of renewables in power and heat generation. These policies were taken into account for the future trend assessment.
3. Results and Discussion
3.1. Emission Inventory
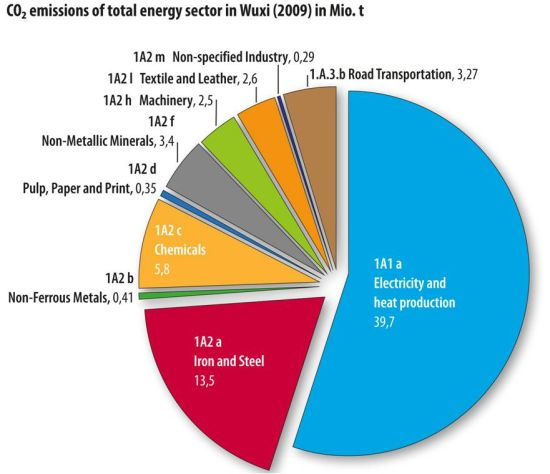
The main source for Wuxi’s emissions is the combustion of raw coal, which is needed to meet the high demand for energy. Electricity and heat production are main sources of emissions, representing more than half of the current carbon dioxide emissions (39 million tons CO
2). The total CO
2 emissions of the energy, manufacturing industry and transport sectors (calculated at almost 72 million tons CO
2 in 2009—see
Figure 1 sum up to about a fourth of the corresponding CO
2 emissions of the industrial center of Germany North Rhine-Westphalia or the total CO
2 emissions of the country Chile. In the manufacturing industries’ energy-intensive branches, like the iron and steel industry, and the chemical industry, are currently most relevant for the total CO
2 emissions, but other sectors also have considerable emissions (see
Figure 2,
Table 3 and section on key sectors). Although we intended to analyze and integrate all “Kyoto” greenhouse gases, the data availability did not allow for a complete calculation. Thus, for non-CO
2 emissions and non-energy related CO
2 emissions, qualitative assumptions or process descriptions have been given. As Wuxi hosts several industries with potentially high process-related emissions, the current total emissions are higher than the figures calculated in the inventory. For agriculture only some exemplified sub-sectors have been calculated.
Figure 1.
Total CO2-emissions (in million tons) of IPCC sectors 1A1-1A3 (energy-related emissions), divided into sub-sectors.
Figure 1.
Total CO2-emissions (in million tons) of IPCC sectors 1A1-1A3 (energy-related emissions), divided into sub-sectors.
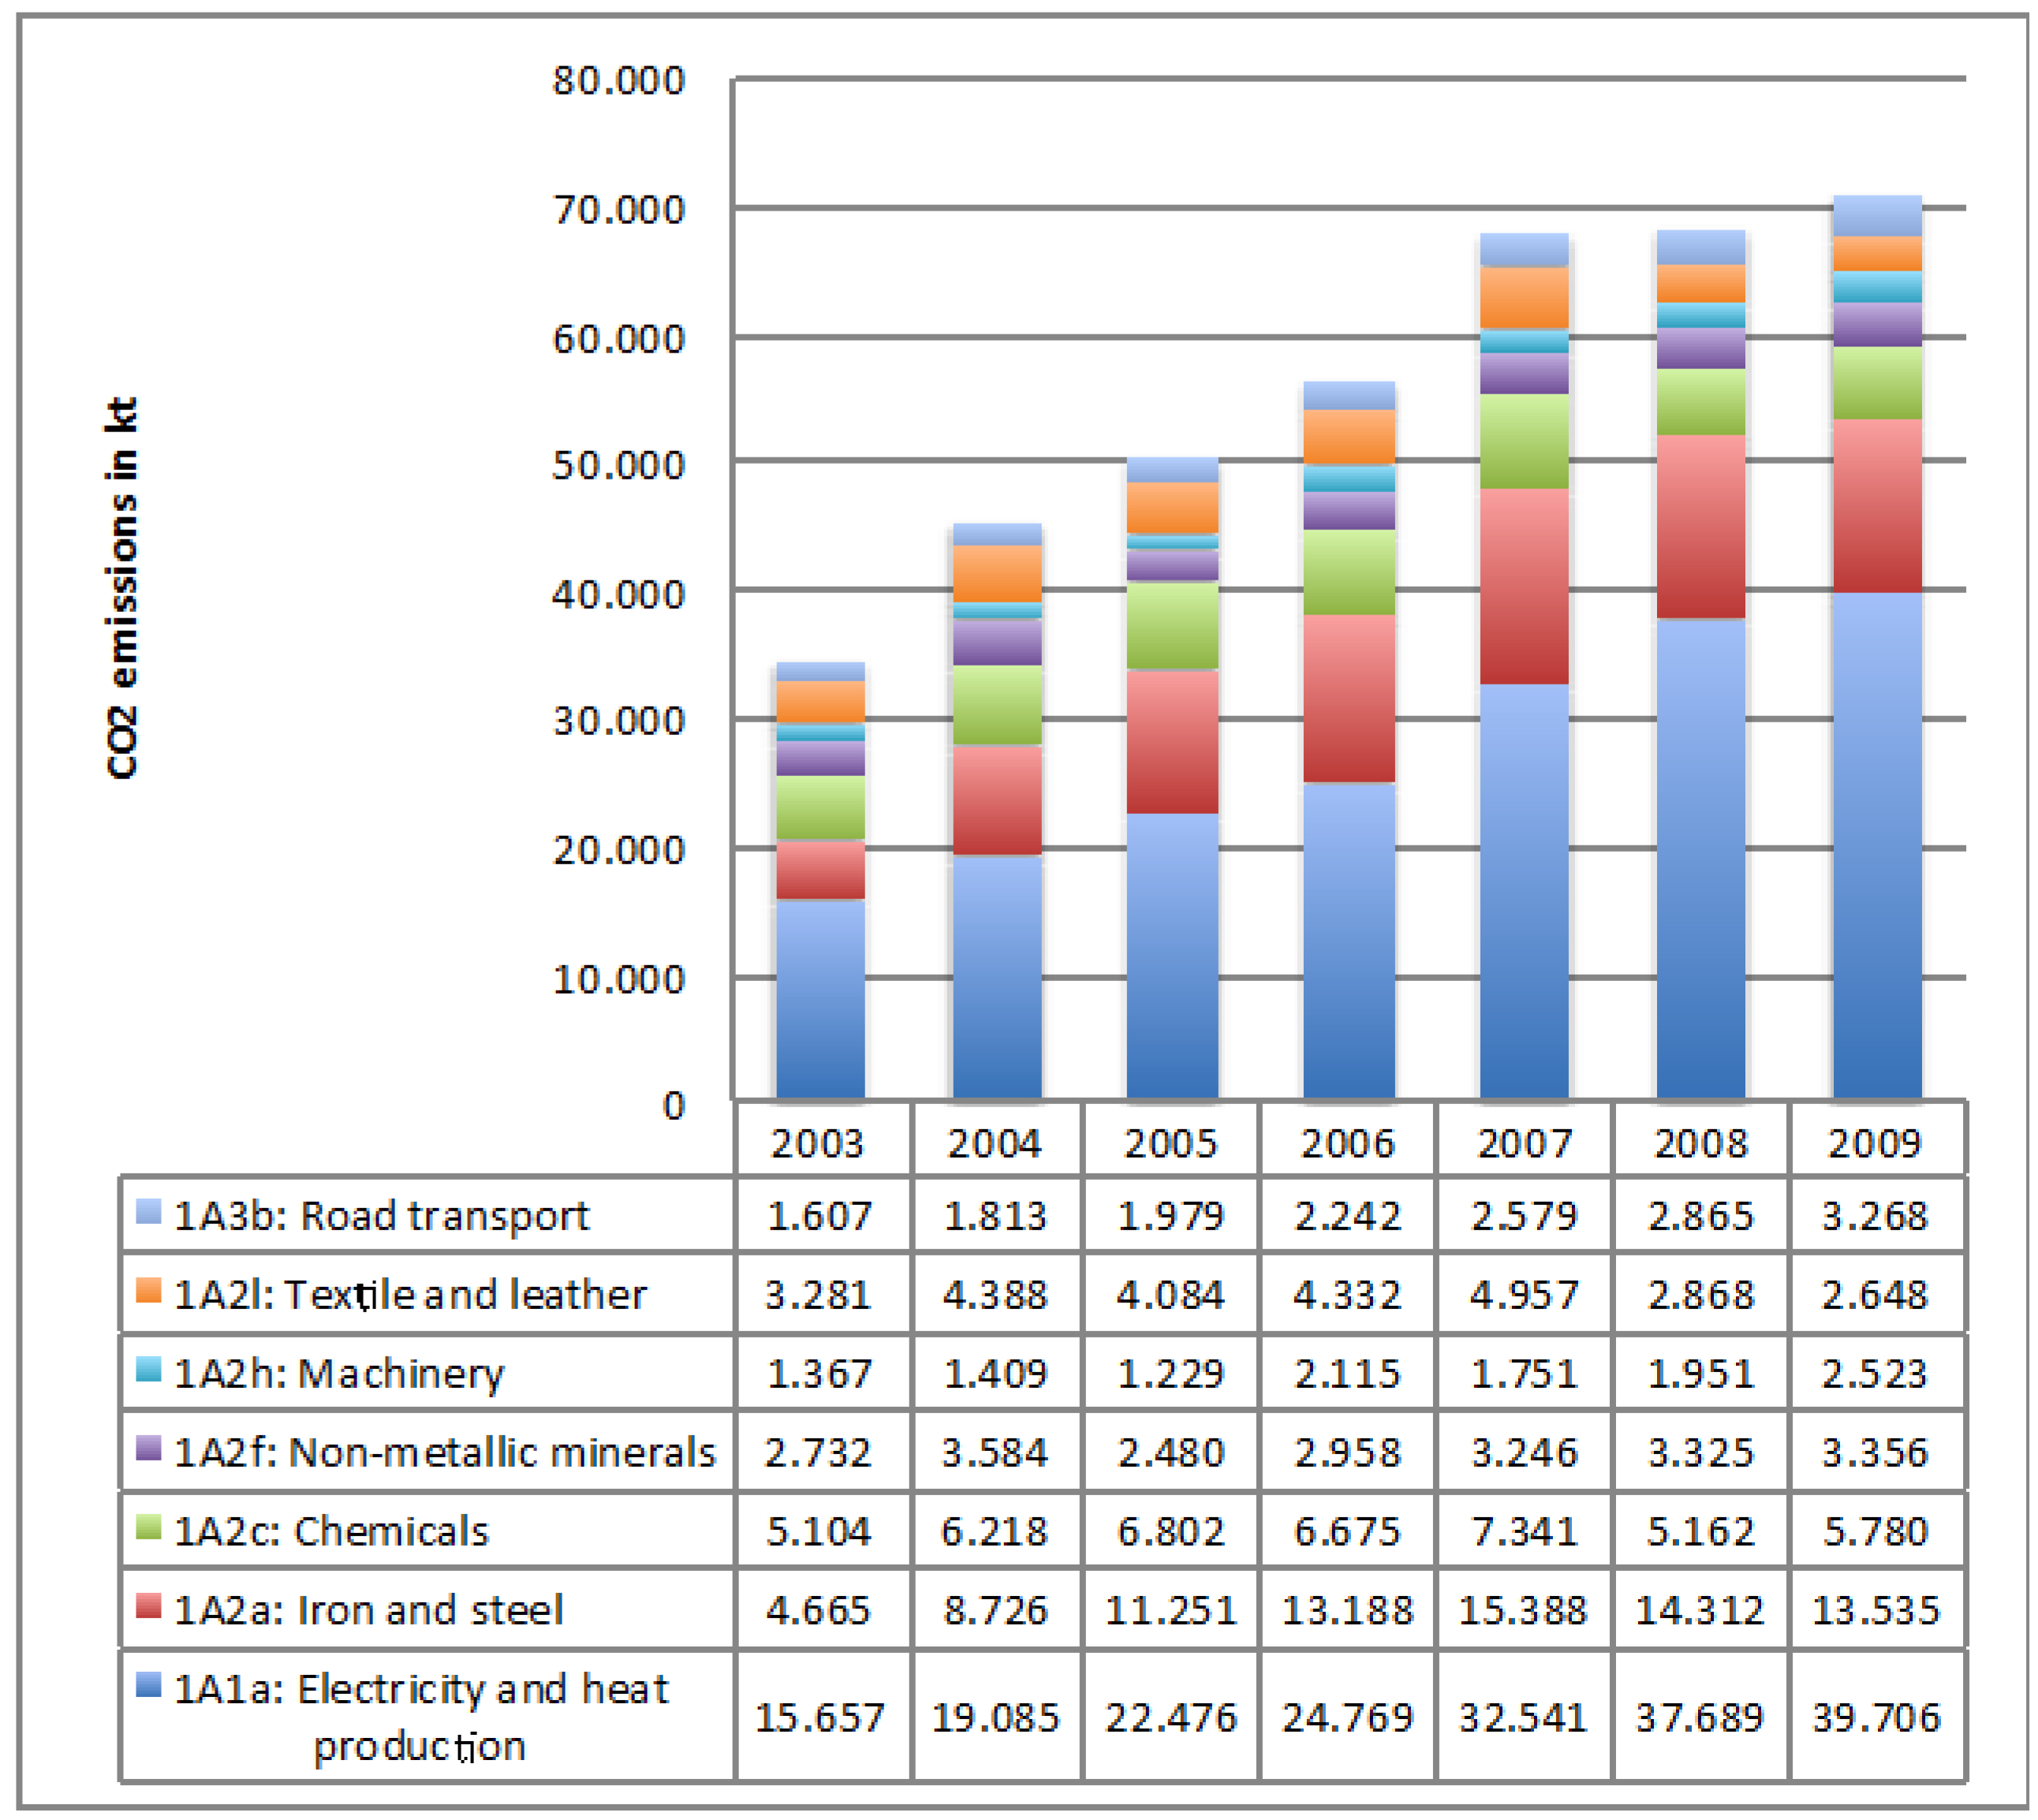
Figure 2.
Development of energy-related CO2 emissions (in kilotons CO2; 2003–2009) in Wuxi of some relevant sectors in the energy industry (1A1), manufacturing industry (1A2) and transport sector (1A3).
Figure 2.
Development of energy-related CO2 emissions (in kilotons CO2; 2003–2009) in Wuxi of some relevant sectors in the energy industry (1A1), manufacturing industry (1A2) and transport sector (1A3).
Due to the lack of appropriate activity data, emissions from waste disposal have so far not been calculated. However, waste could be a relevant source of emissions in Wuxi and also a sector with high mitigation potential. Thus, for future emission monitoring work of Wuxi experts, the data availability of this sector should be modified.
Thus, high improvement potentials are given for future inventory work. On the other hand it has to be stated that the data sources for Wuxi are already been very detailed compared to other cities around the world (including in comparison to European cities).
3.2. Key Sectors Identified
Sectors with high present and future CO2 emissions, a high impact on the environmental performance of Wuxi and high mitigation potentials were selected as key sectors to be addressed in detail in the process of strategy development. The key sectors in the pilot cities were selected in the course of a research and dialogue process among the project partners. For the identification of most relevant sectors, four aspects have been taken into account. According to the focus on low carbon and mitigation, one criterion is the current greenhouse gas emissions and future trends (based on the inventory and CPS). The relevance for political planning in the Wuxi municipality has also been considered as an important factor. Besides the mitigation dimension, climate change impacts were also taken into account, as well as the aspects of material and resource use according to the three dimensional approach.
Table 3.
Total greenhouse gas emissions of all Intergovernmental Panel on Climate Change (IPCC) sectors (CO2, CH4 and N2O) in CO2 eq; Key sectors.
An identification of important sectors is given in
Table 3, differentiated by sectors with high relevance, the most dominant is electricity and heat production within the energy sector, which is responsible for more than half of the calculated CO
2 emissions, deriving from the combustion of coal. During the analyzed period of 2003 to 2009, emissions more than doubled, from 15.7 to 39.7 million tons. The importance of the energy sector has already been reflected in Wuxi’s 12
th Five-Year Energy Conservation Plan, but still—reflecting the results of the CPS (3.4.)—the emissions of the electricity production are very likely to increase further in the future, due to the high increase of the final energy demand.
Most of the remaining of the key sectors are industry sectors, like the iron and steel industry, the chemical industry, non-metallic minerals (cement), as well as electric equipment and machinery manufacturing. The iron and steel industry particularly stands out, which is why Wuxi has a specific 12th Five-Year Plan on iron and steel industry development, aiming to bring the energy saving and environmental protection of Wuxi’s industry to the international level.
The enormous increase of road transport, its related emissions, air pollution and future infrastructure challenges, makes it a key sector to be considered for Wuxi’s intended low carbon future development.
Although for some sectors the direct GHG emissions within the city boundaries of Wuxi were not significant in the inventory, due to other relevant aspects they were also considered key sectors. This is true for the construction sector, which is an important sector due to the high material uses, further planned constructions, relatively short lifecycle of buildings compared to Europe, and the increasing electricity needs for room cooling and heating purposes. This aspect also has relevance for adaptation needs, due to increasing temperatures and living standards. Linked to the construction of buildings are the residential and the commercial (service) sectors, which are facing highly increasing electricity needs mainly due to increase of living standards and air conditioning needs, which should therefore also be regarded as two relevant key sectors.
3.3. Changes in Climate Parameters and Vulnerability Aspects
The vulnerability to climate change in Wuxi has been assessed by analyzing recent climatic changes and by projecting expected changes. For the period from 1961 to 2009, data from seven meteorological stations in Wuxi were used, and the projections until 2100 were based on an ensemble of three General Circulation Models (GCMs).
The results show that in the last 50 years all temperatures increased. While the minimum temperature increased in almost all months, the increases in maximum temperature mainly occurred in summer and autumn. For the changes in precipitation, it can be summarized that April and September became drier and January became wetter.
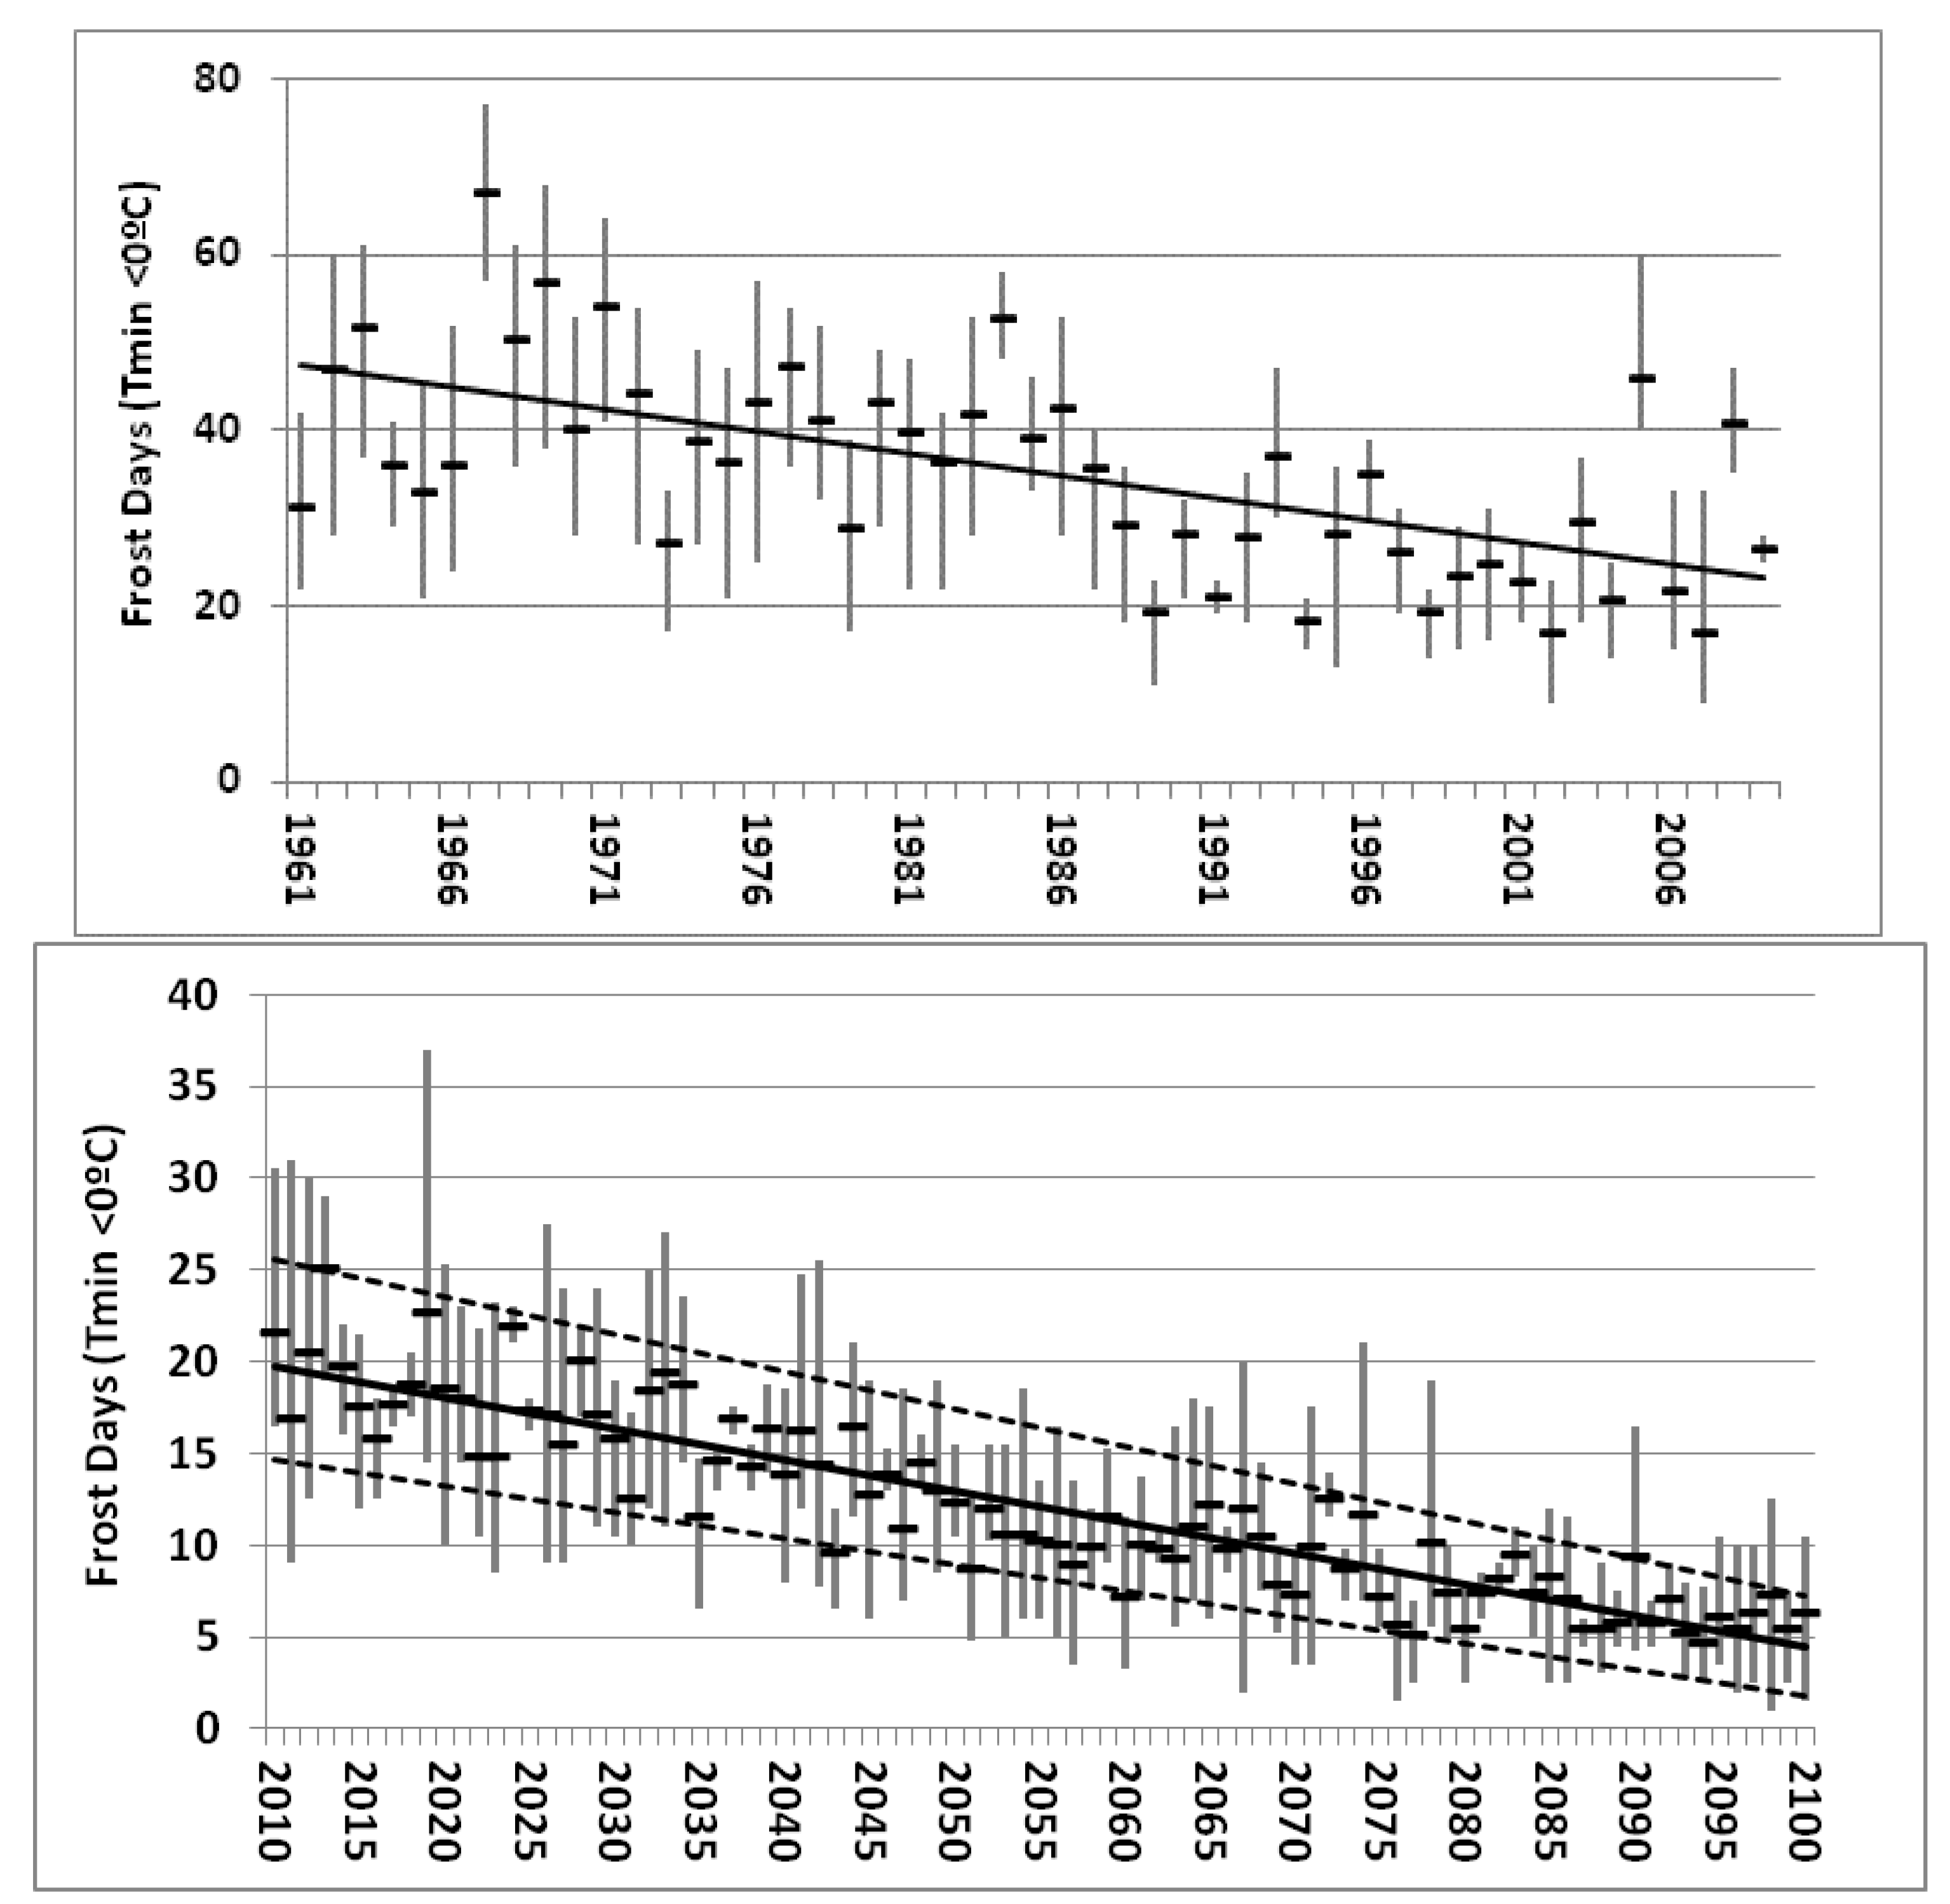
In the future, the temperatures are projected to further increase in each month at least until 2099, whereas the increase in summer is lower than during winter. Heavy and very heavy rain days are projected to increase non-significantly. The highest changes in climatic parameters (both observed and projected) were detected for frost days (decreasing, see
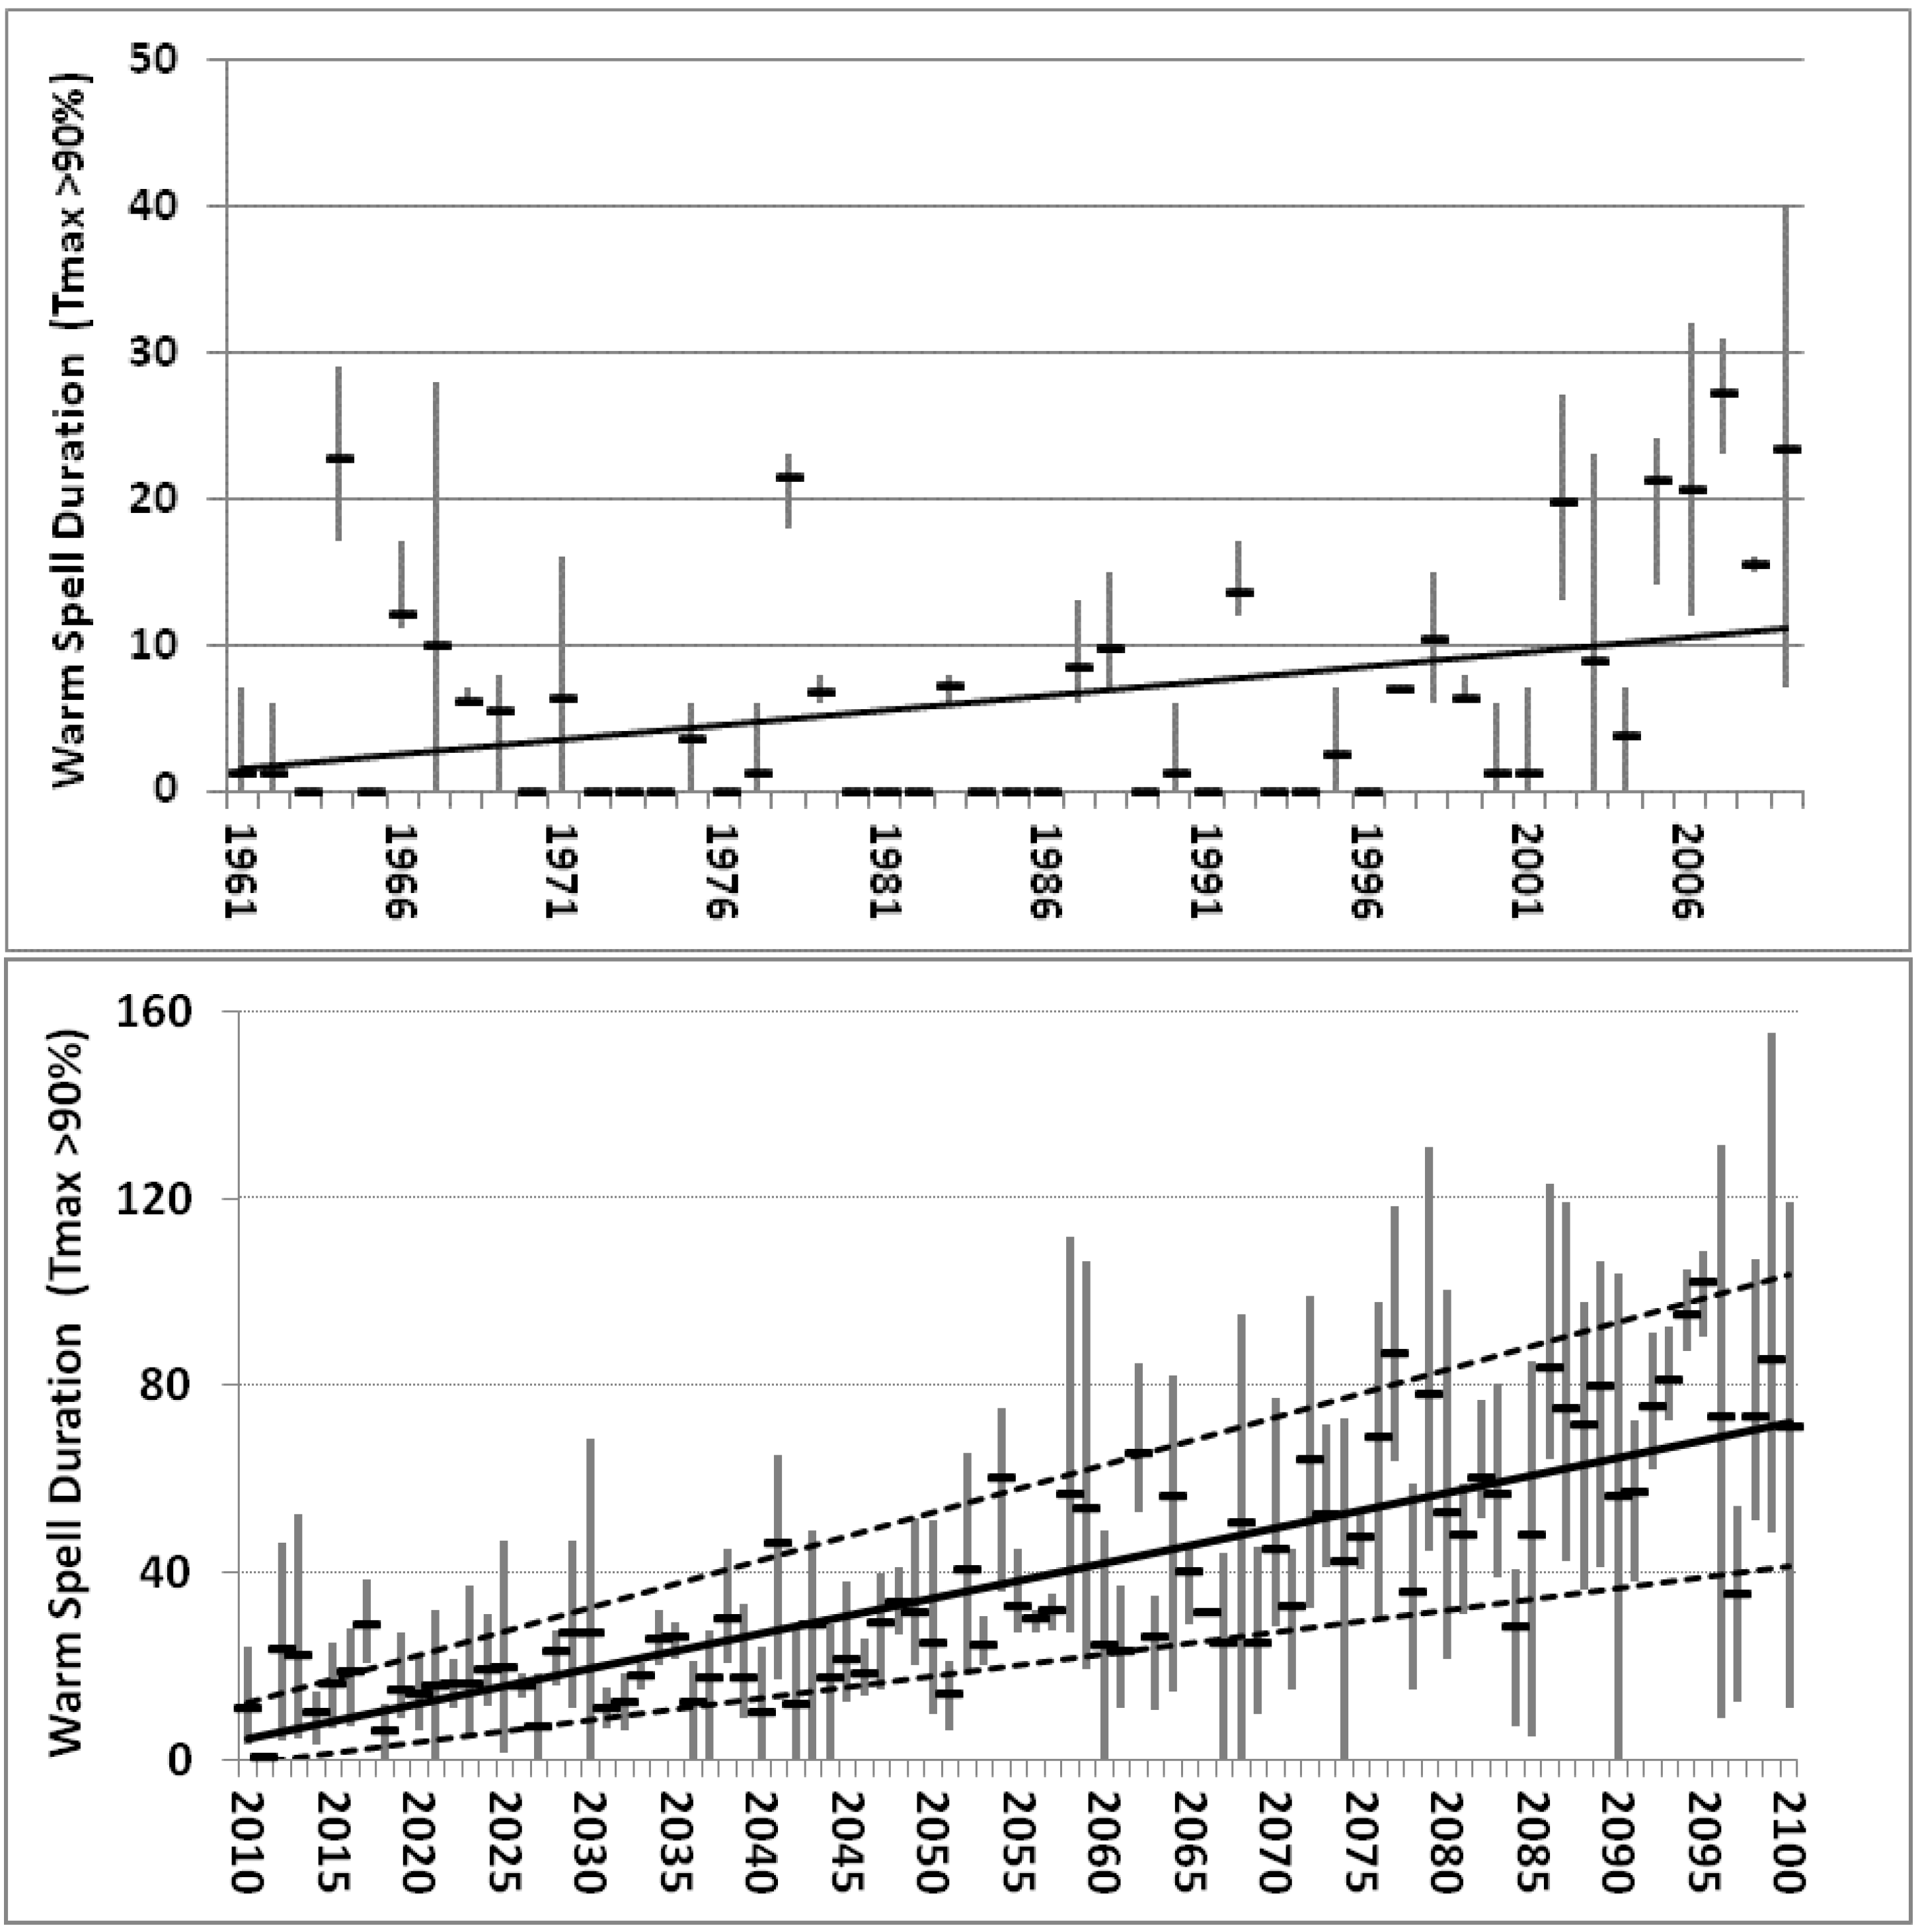
Figure 3), summer days (increasing), warm spells (increasing,
Figure 4), and cold spells (decreasing). Water levels did not exhibit a changing trend, and no changes in the water balance are expected for the coming decades.
Figure 3.
Annual number of frost days observed (left) and projected (right) for Wuxi.
Figure 3.
Annual number of frost days observed (left) and projected (right) for Wuxi.
Figure 4.
Annual warm spell duration observed (left) and projected (right) for Wuxi.
Figure 4.
Annual warm spell duration observed (left) and projected (right) for Wuxi.
For Wuxi’s vulnerability (coping capacity × damage potential), it is assumed that the risk will increase due to higher damage potentials, especially for floods/rain and temperature. More details on the recent and future developments in Wuxi can be found in the background paper [
8].
3.4. CPS
The future development of energy demand and related CO
2 emissions in 2030 were simulated in the CPS, using five different sub-models as described in
Section 2.1.2. The assumptions were made in accordance with Wuxi’s Low Carbon Plan (set targets until 2020) while for the later decades national scenario values were translated into a local CO
2 intensity reduction path.
The Wuxi government has committed itself to reduce the carbon intensity of the city’s economy by 50% by 2020 compared to 2005. For the time after 2020 we assumed, in the CPS, that carbon intensity of industry will develop according to the whole economy’s development in the baseline scenario of the ERI [
6] study (2030:−65%; 2040:−70%; 2050:−75%).
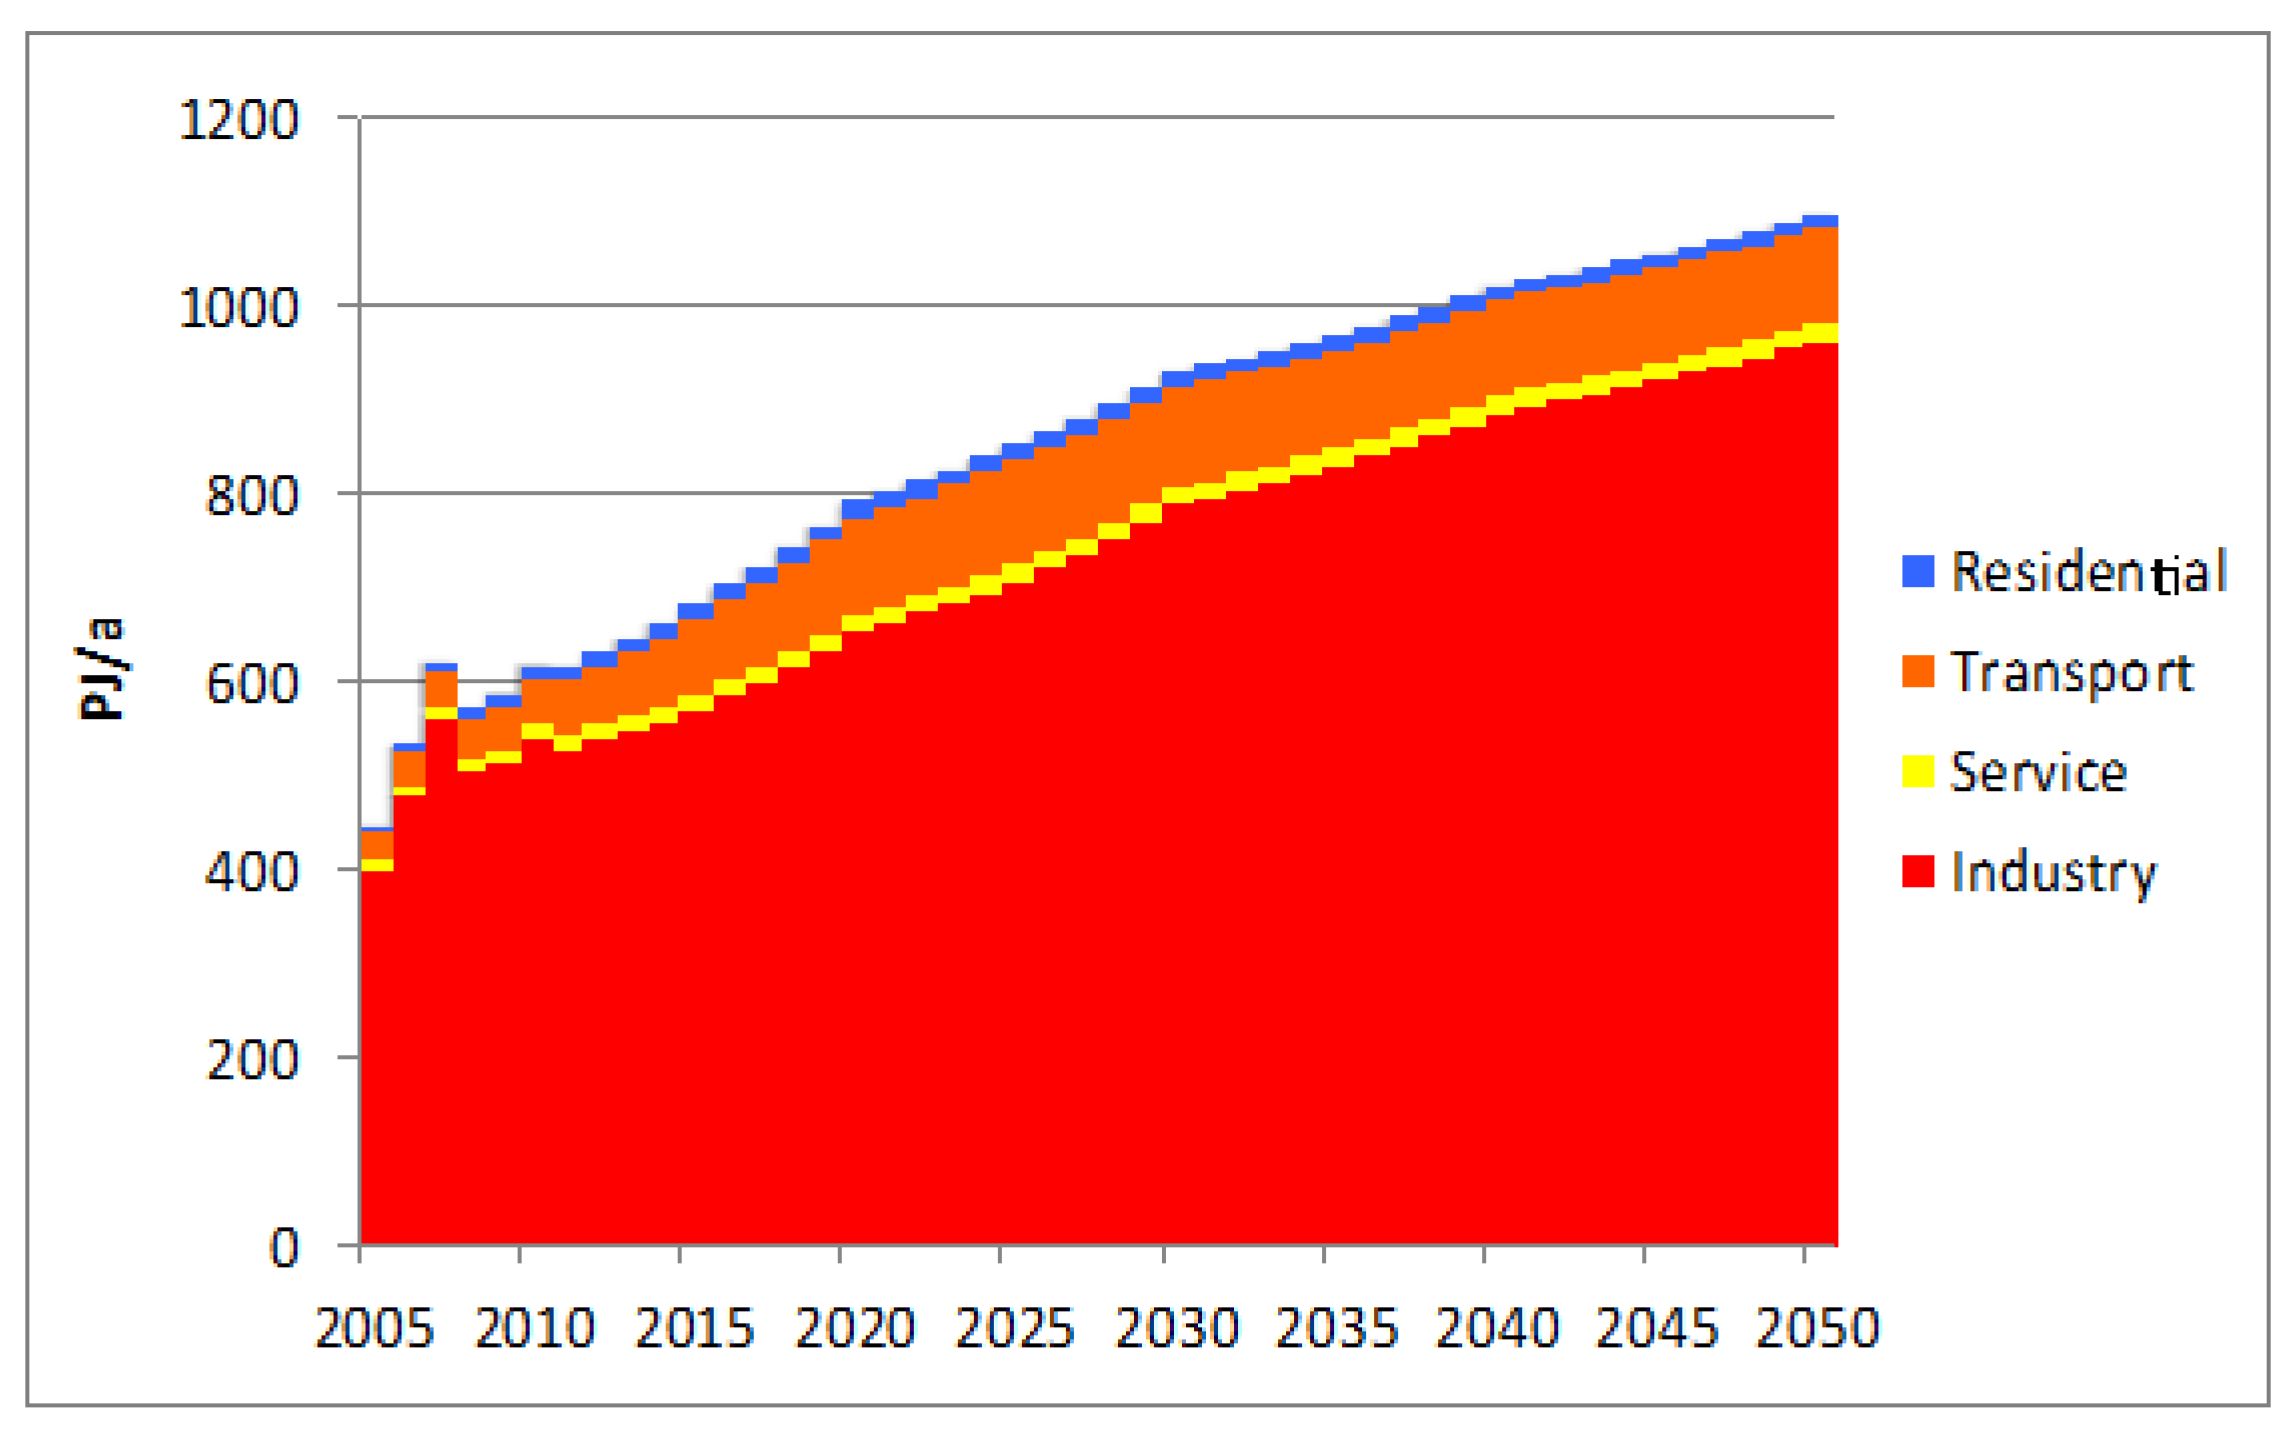
Figure 5.
Energy carrier structure in Wuxi’s industry 2005–2050. Source: Wuxi Statistical Yearbook [
2], China Environment Research (CER)/Wuppertal Institute (WI)(projection).
Figure 5.
Energy carrier structure in Wuxi’s industry 2005–2050. Source: Wuxi Statistical Yearbook [
2], China Environment Research (CER)/Wuppertal Institute (WI)(projection).
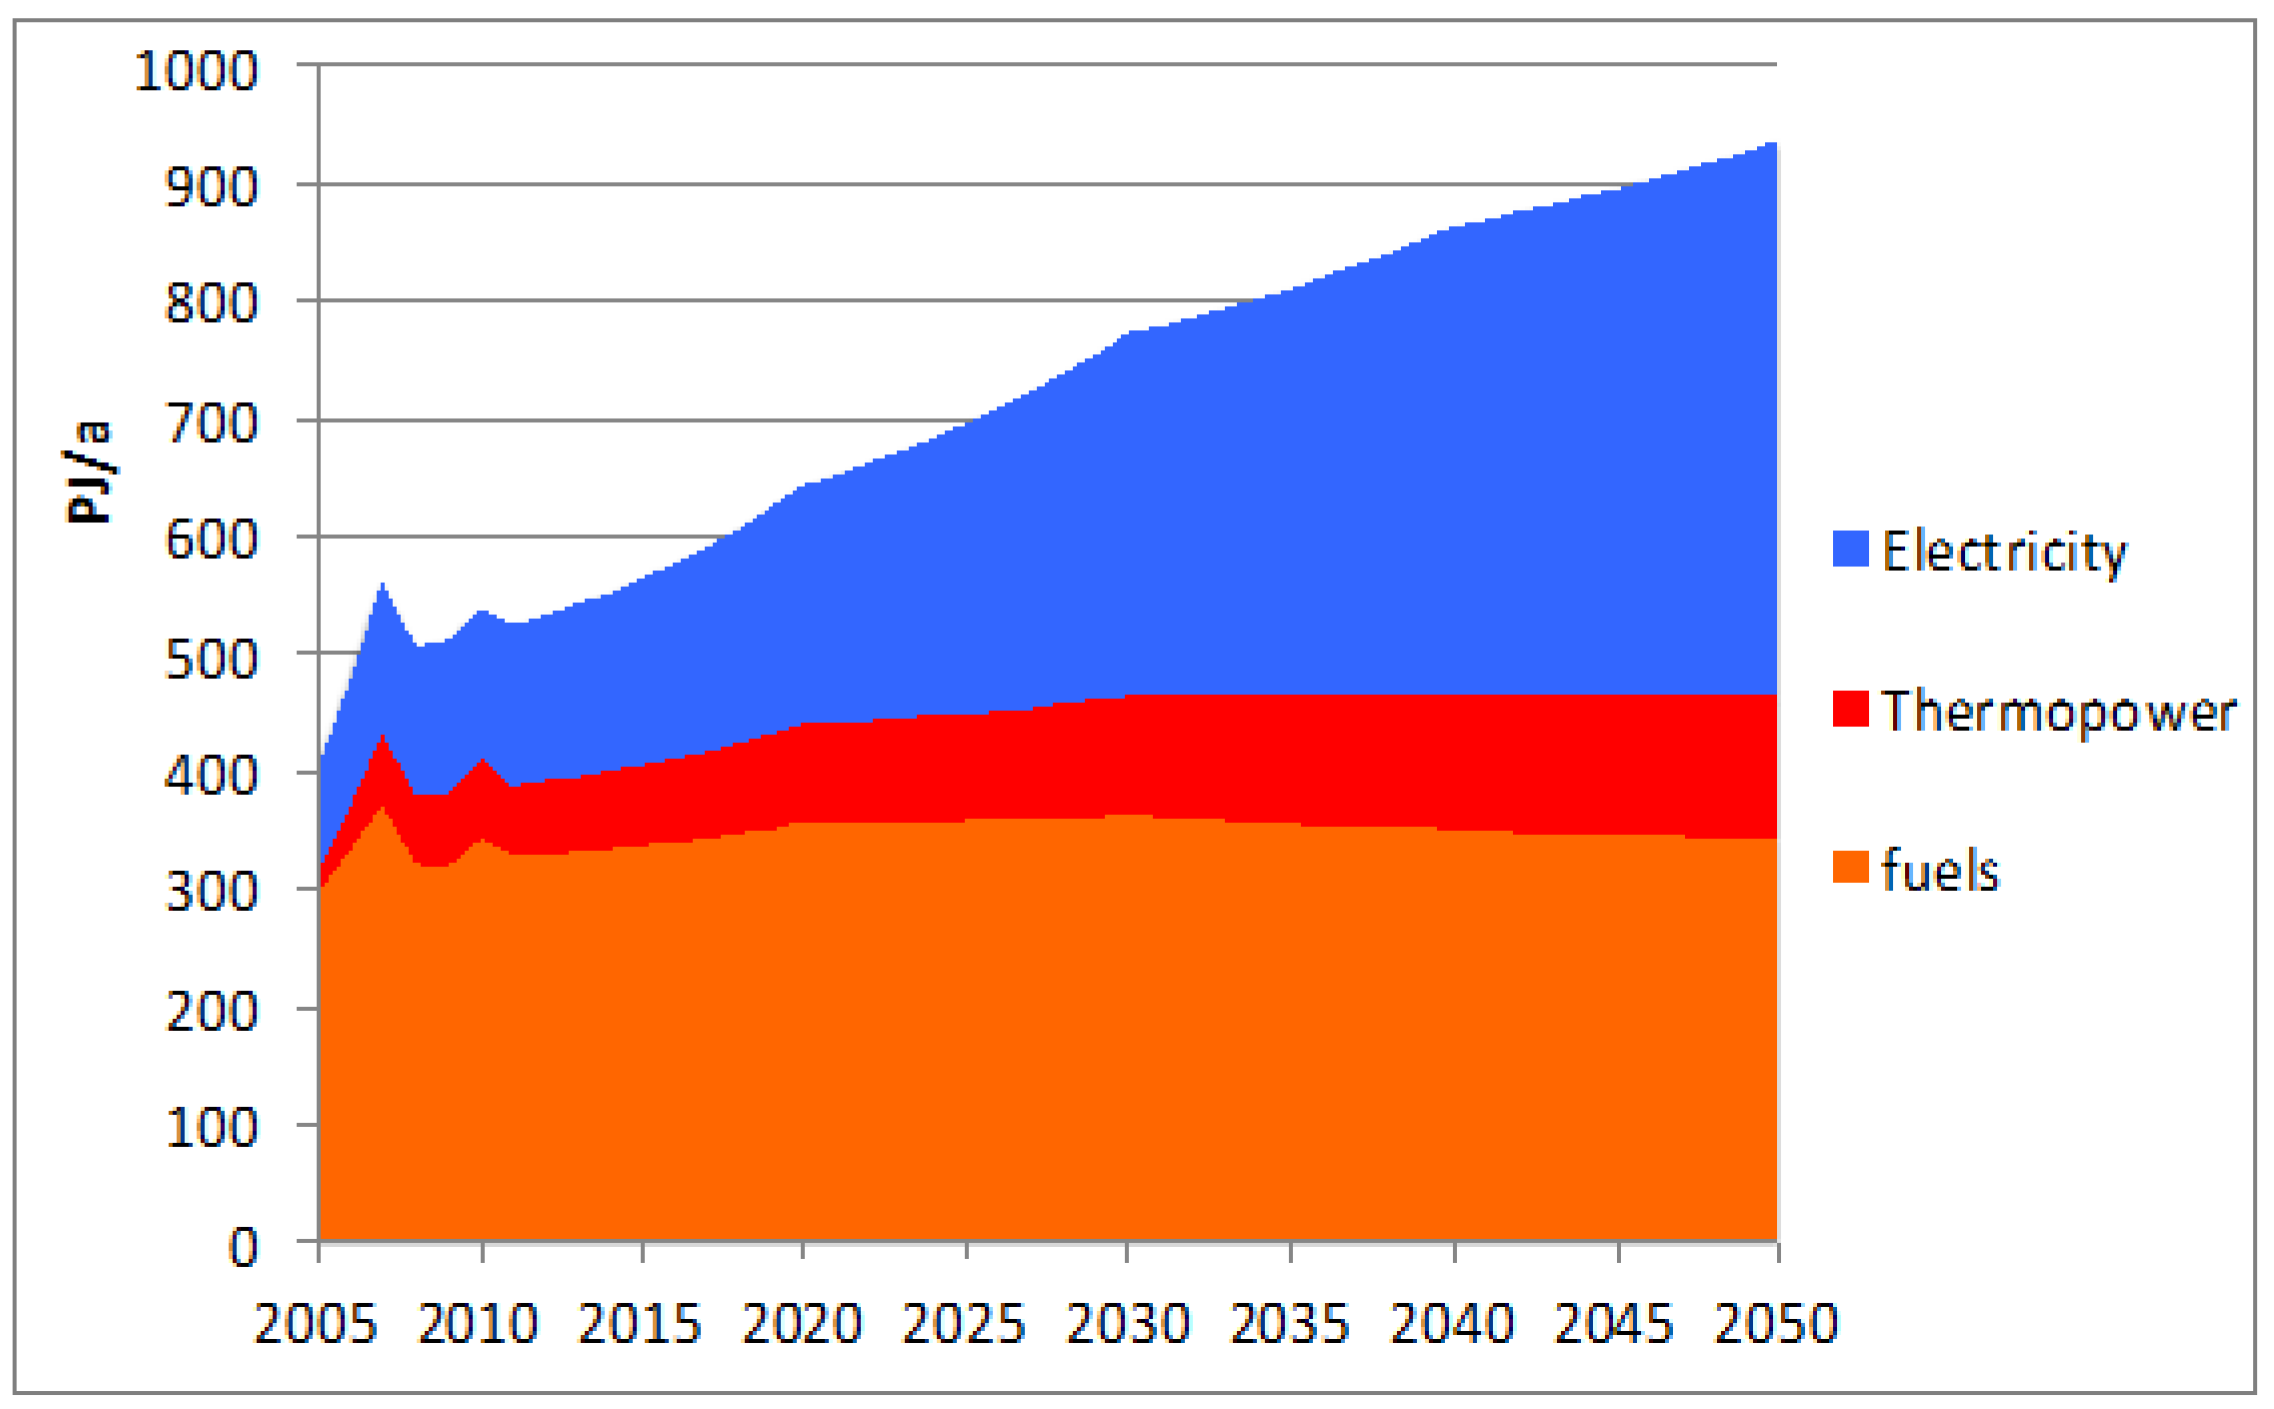
Mainly due to economic growth, the final energy demand in the CPS is expected to grow by 86% (2050 compared to 2009), which can be seen in
Figure 6.
Figure 6.
Development of final energy demand in the Current Policy Scenario.
Figure 6.
Development of final energy demand in the Current Policy Scenario.
In parallel, structural change is supposed to occur, thus non-energy intensive industries and the service sector would grow stronger than others. Nevertheless, energy intensive industry would still exist in Wuxi in 2050 and maintain their production, but with a lower share in GDP.
Figure 5 shows the final energy demand of industry, differentiated per energy carrier.
In our CPS there is only little advancement in industrial energy efficiency after 2020, however, the overall energy intensity of the sector is supposed to decline due to structural changes within industry and not due to an improvement of technical processes.
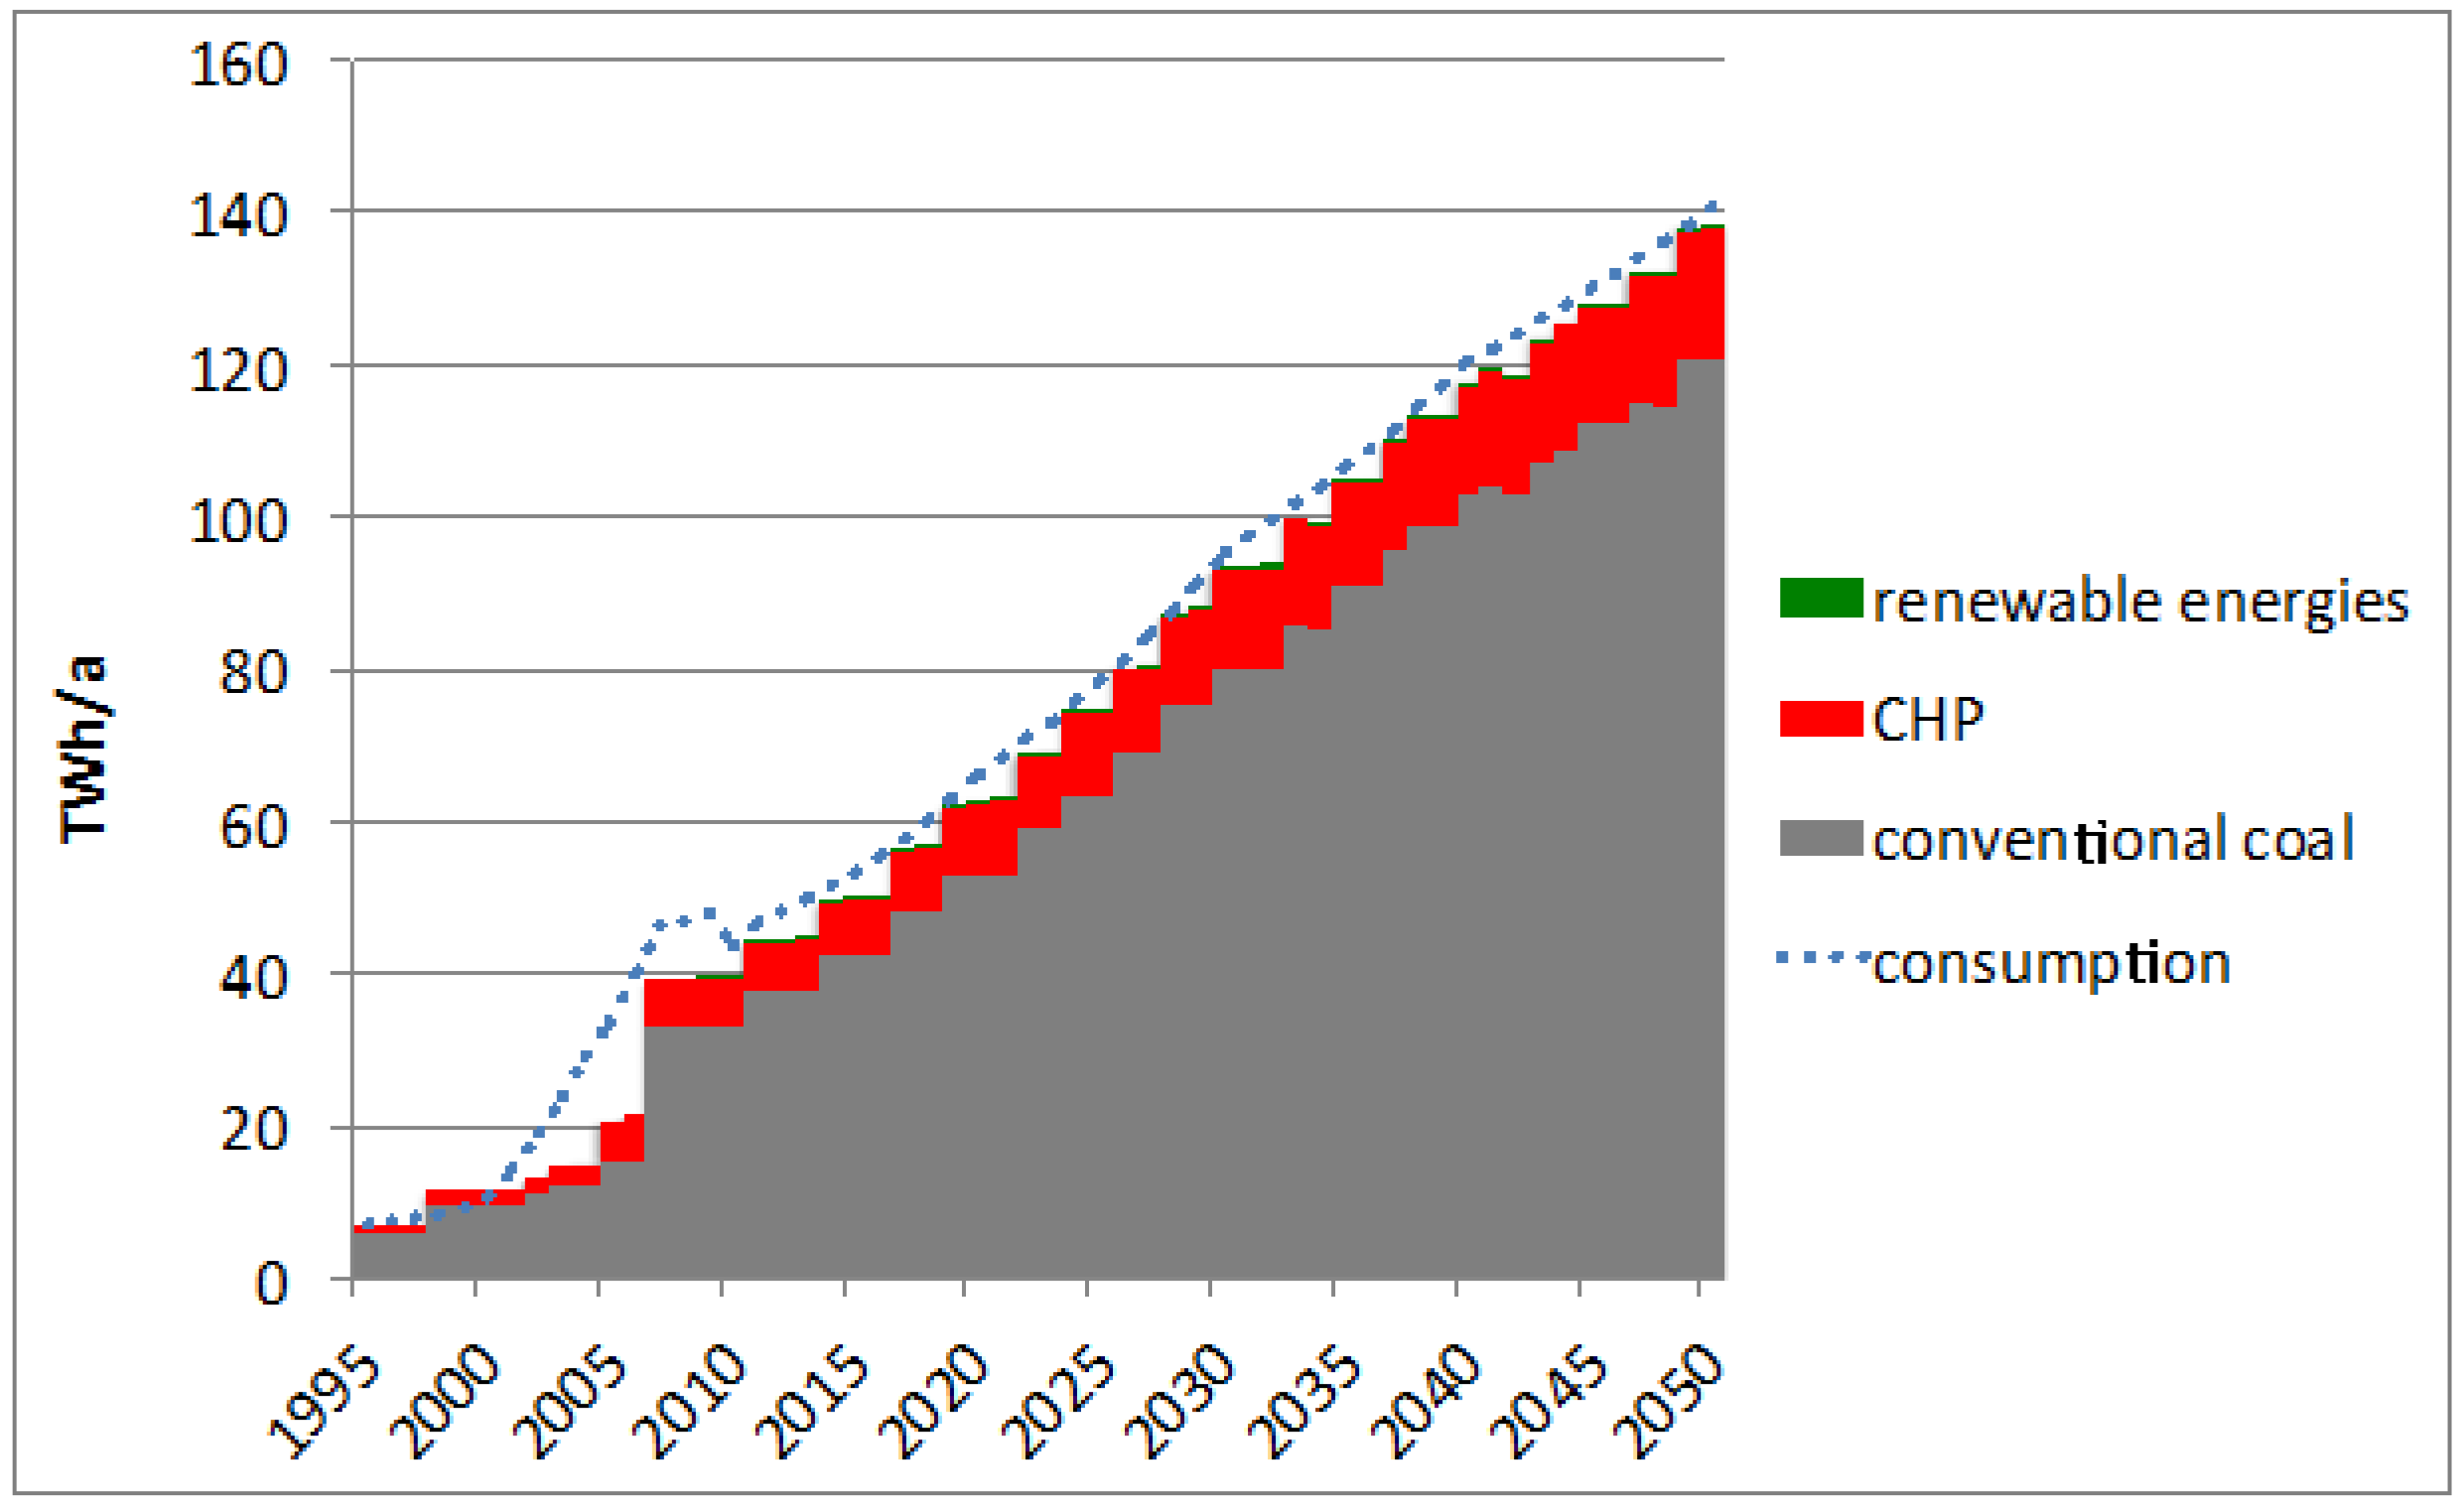
Due to the economic growth, an energy carrier shift to electricity and a phase-out of electricity imports, emissions from electricity generation would be of even more importance than today in the CPS. Total local electricity demand and production in Wuxi is shown in
Figure 7.
Figure 7.
Electricity production and demand. Source: Wuxi Statistical Yearbook (WMBS) [
2], Wuppertal Institute (WI) (projection).
Figure 7.
Electricity production and demand. Source: Wuxi Statistical Yearbook (WMBS) [
2], Wuppertal Institute (WI) (projection).
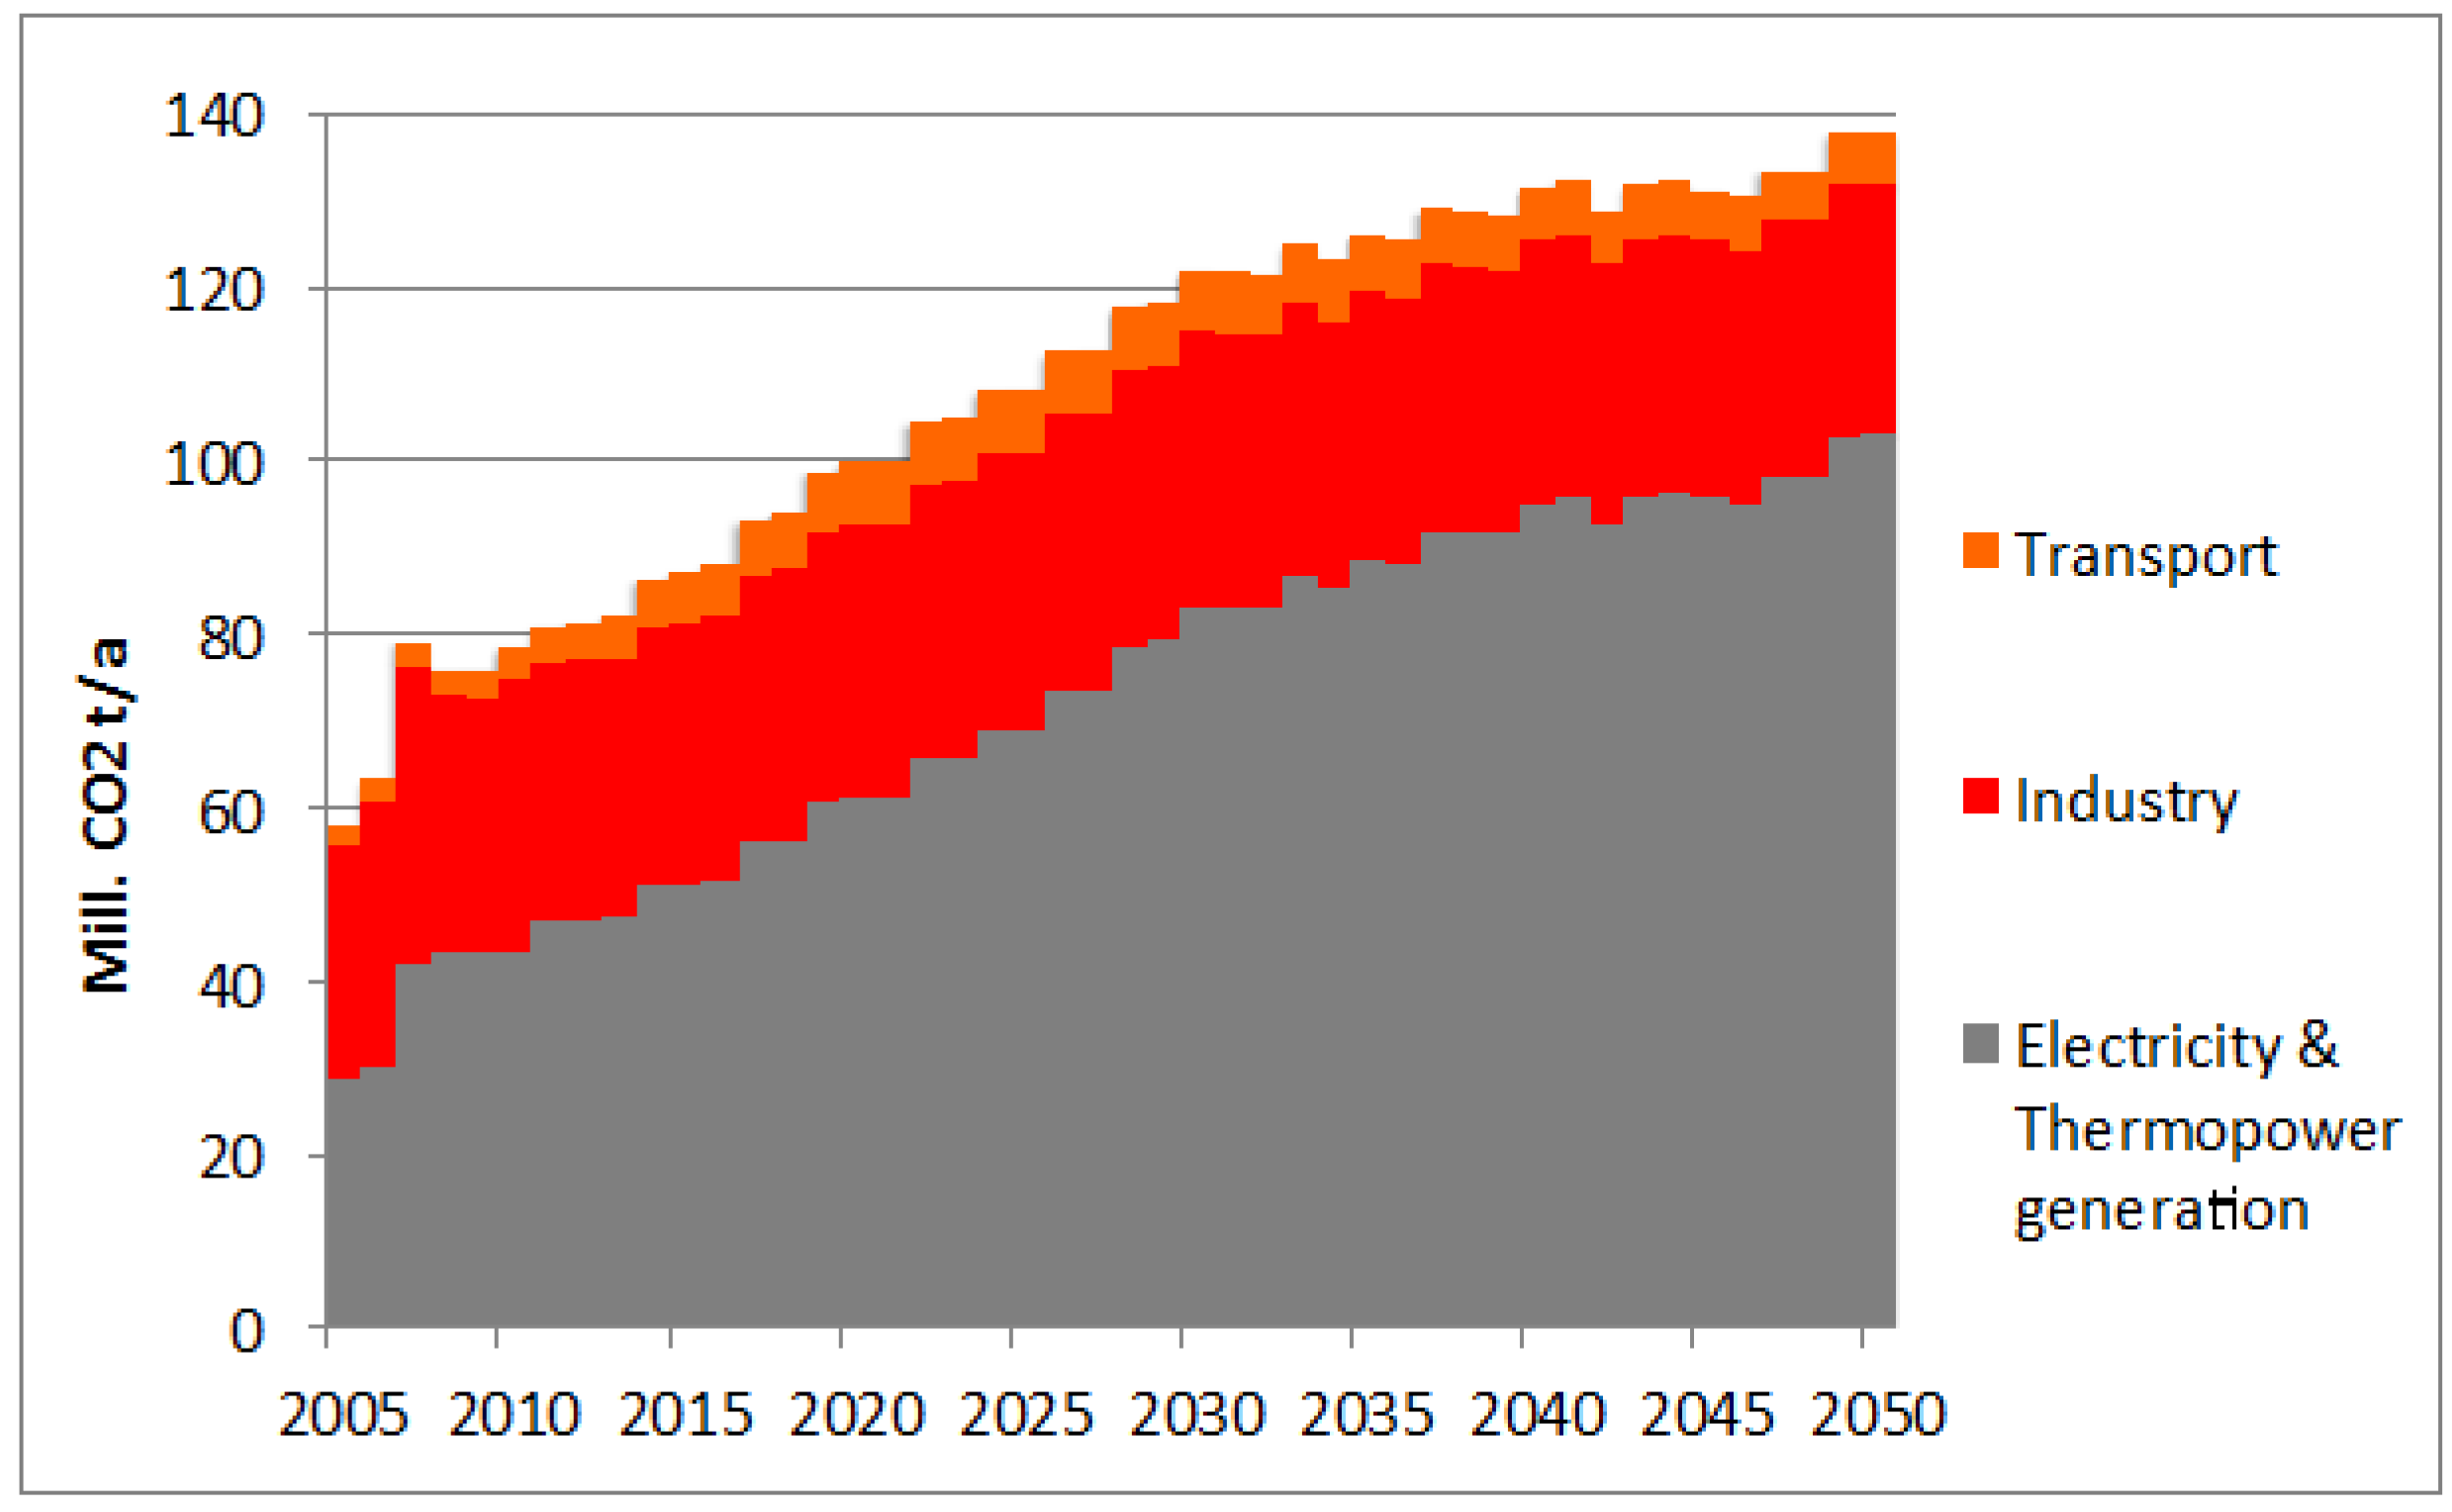
Although in the scenario the intensity targets are supposed to be achieved, this would not lead to absolute emission reductions, as the projected growth would over-compensate the relative reduction. In the CPS, the old energy intensive industries could even keep up their high emission levels while the new industries’ additional demand for electricity would result in higher emissions of the power plants (
Figure 8).
Figure 8.
Total CO
2 emissions in the Current Policy Scenario. Source: Wuxi Statistical Yearbook (WMBS) [
2], Wuppertal Institute (WI) (projection).
Figure 8.
Total CO
2 emissions in the Current Policy Scenario. Source: Wuxi Statistical Yearbook (WMBS) [
2], Wuppertal Institute (WI) (projection).
Direct per capita CO
2 emissions in Wuxi were 9.7 tons per capita in 2005, which is already above the Chinese average of 7.2 tons in 2011 [
15]. According to the CPS, this will more than double to about 23.6 tons in 2050.
Regarding 2 tons of CO2 per capita as a target in 2050 the gap is quite clear, even if Wuxi claims CO2 “credits” to some extent, as its share in the Chinese production of CO2 intensive products like steel, cement or caustic soda is higher than its population share.
In the forthcoming work of LCFC project, Low Carbon Scenarios shall set more ambitious paths to reduce the emissions in Wuxi. Hence, two further scenarios shall be developed: a “Low Carbon Technology Scenario”, which is supposed to show an accelerated use of low carbon technologies especially after 2020 and an “Extra Low Carbon Scenario”, which will be designed as a target scenario where ambitious climate protection targets are met by additionally using non-technical measures and behavioral change.
3.5. Resource Use
For the energy transformation and the residential building sector, the current status quo, as well as the future material and water flows, have been analyzed and modeled, combining two methods of material flow analysis.
For electricity and heat production not only the direct use of coal in Wuxi is relevant, but also the indirect material flows associated with the extraction, i.e., the ecological rucksack. A high share of the materials and water flows resulting from electricity and heat consumption in Wuxi occur elsewhere, like the resources needed for imported electricity. In 2009 the total material flow sums to 60 million tons. More than 5 times higher is the associated water consumption (332 million tons; 1 ton of water = 1 cubic meter of water). These figures will significantly increase under the assumptions of the CPS.
In 2005, Wuxi’s residential buildings represented a stock of 464 million tons of materials. Further increase in population and living standards lead to an increasing building stock. At the same time, older buildings, which have far shorter “life expectancy” than European buildings, are demolished and replaced by bigger housings. Thus, the related demand for construction materials and disposal of building waste also needs to be considered and will be highly significant in both near- and long-term. More details on the resource use can be found in the comprehensive background report to the study [
3].
4. Conclusions
The picture we get from the analysis is impressive in a manifold manner. From a European perspective, the geographic boundaries and economic structure of Wuxi reach beyond “normal” city dimensions, and so do the emissions. If Wuxi would be counted as a country, it would be among the 50 countries with highest CO2 emissions in the world.
Wuxi has several direct emission sources, especially in the industrial sectors, which are almost immeasurable, meaning that due to the high number of complex industry processes and limited data on these processes, only the direct carbon dioxide emissions could be quantified in the inventory, while for most of the other process-related emissions and so-called “Kyoto-gases”, only some qualitative assessments could be given. To be able to monitor the future GHG emissions (of direct emissions within the boundaries of Wuxi), not only the establishment of a regular inventory reporting is recommended, it would also be important to improve data quality and calculation methodologies according to local conditions, especially for non-CO2 sources like waste disposal and agriculture, but also for process-related emissions, there is high improvement potential for data and methods.
To help Wuxi focus on the most relevant sources in future low carbon measures, we identified key sectors, based on the current greenhouse gas emissions, also taking into account the relevance for regional policies, vulnerability to climate change and future trends. A number of nine broad key sectors that cover more than 90% of Wuxi’s CO2 emissions were selected. Behind the dominant power and heat sector, most of the key sectors are industrial sectors (iron and steel, chemical, non-metallic minerals, etc.) with high energy demand. This huge demand is not only linked to the traditionally energy intensive industries, but also to the high need for electricity in other upcoming “modern” industry sectors, in the increasing service sector as well as in the residential sector. In addition, the construction sector is relevant, due to the high material/resource uses and the increasing electricity demand for cooling and heating purposes. The final selected relevant sector was road transport, which has increased tremendously (the number of private cars in Wuxi has increased 20-fold since 2000) and is supposed to carry on in the next decade.
Due to the higher electricity needs and higher production capacities within the city in Wuxi’s future outlined by the CPS, direct emissions from electricity generation in Wuxi will be of even more importance than today. Wuxi’s goal of reducing CO2 intensity by 50% until 2020 compared to 2005 is a good starting point, but as can be seen in the CPS, it is by far insufficient to ensure that Wuxi will be a city with low emission levels. Despite the relative reduction of energy intensity (related to local GDP), the projected economic growth will overcompensate the relative reduction and no absolute emission reductions will occur.
Looking at the per capita emissions, the dimensions become even more apparent. In 2005 Wuxi’s per capita emissions had been around 9.7 tons CO2 per year. This is already above the average Chinese emissions of 7.2 tons (in 2011) and far above discussed average global emissions of 2 tons CO2 per capita per annum.
Although the current discussions on climate change, mitigation and low carbon strategies mainly focus on greenhouse gas emissions and their impacts, the environmental pressures from the demand for coal and other resources, like construction materials and water flows, must not to be forgotten. In the long-term they are as relevant (or even more) for the sustainability of the global environment. About double the material flow related to the coal combusted in Wuxi needs to be added to account for the extraction of this fossil fuel. Considering the same assumptions as the CPS for future development, the high increase of electricity needs and imports is supposed to correspond with increasing resource demands. Furthermore, increasing population and living standards lead to an increasing building stock. Thus, the related construction and disposal of building waste also needs to be considered, and is expected to retain high significance.
In order to understand past and future changes of Wuxi’s regional vulnerabilities to climate change, we analyzed climatic parameters and the changes that have been observed and projected. The temperature risk will increase due to climate change, i.e. the frequency and magnitude of heat waves and maximum temperatures will increase. Although the risk of economic losses due to temperature hazards is relatively low today, it might dramatically rise in the future. Linked to the temperature changes in combination with the need for higher living standards are the above-mentioned increased needs for cooling and heating of residential buildings.
Of greater importance for economic development is the risk of flood and heavy rains, despite the fact that this hazard did not, and will most probably not, severely change. However, due to an increasingly dense infrastructure, Wuxi’s vulnerability to floods and heavy rainfall is projected to grow. Therefore, it is recommended to increase Wuxi’s coping capacity against such weather events in order to reduce impacts of temperature and flood hazards and thereby reduce the city’s vulnerability.
Overall, it is concluded that although Wuxi’s city government has set reduction targets and developed a low carbon plan, the projection results show that more ambitious efforts are needed to overcome the challenges faced and reduce the total CO2 emissions and material uses. The results of the analysis above try to give a full picture of the real status quo and possible future development under current policy conditions, which is crucial basis set the path for a low carbon future in the city of Wuxi and to develop a sound an ambitious low carbon roadmap in the coming years.


