Article

Effects of Reduced Tillage on Crop Yield, Plant Available Nutrients and Soil Organic Matter in a 12-Year Long-Term Trial under Organic Management

1
Institute of Crop Science, Coordination for Organic Farming and Consumer Protection (340d), University of Hohenheim, Stuttgart 70593, Germany
2
Institute of Crop Science, Agronomy (340a), University of Hohenheim, Stuttgart 70593, Germany
3
Claus-Felix Teufel, Landratsamt Konstanz, Amt für Landwirtschaft Stockach, Winterspürer-Str. 25, Stockach 78333, Germany
4
Institute of Crop Science, Bioinformatics (340c), University of Hohenheim, Stuttgart 70593, Germany
*
Author to whom correspondence should be addressed.
These authors contributed equally to this work.
Sustainability 2013, 5(9), 3876-3894; https://doi.org/10.3390/su5093876
Submission received: 14 June 2013 / Revised: 4 September 2013 / Accepted: 6 September 2013 / Published: 12 September 2013
(This article belongs to the Special Issue Organic Farming and a Systems Approach to Sustainable Agroecosystems)

Abstract

:
A field experiment was performed in Southwest Germany to examine the effects of long-term reduced tillage (2000–2012). Tillage treatments were deep moldboard plow: DP, 25 cm; double-layer plow; DLP, 15 + 10 cm, shallow moldboard plow: SP, 15 cm and chisel plow: CP, 15 cm, each of them with or without preceding stubble tillage. The mean yields of a typical eight-year crop rotation were 22% lower with CP compared to DP, and 3% lower with SP and DLP. Stubble tillage increased yields by 11% across all treatments. Soil nutrients were high with all tillage strategies and amounted for 34–57 mg kg−1 P and 48–113 mg kg−1 K (0–60 cm soil depth). Humus budgets showed a high carbon input via crops but this was not reflected in the actual Corg content of the soil. Corg decreased as soil depth increased from 13.7 g kg−1 (0–20 cm) to 4.3 g kg−1 (40–60 cm) across all treatments. After 12 years of experiment, SP and CP resulted in significantly higher Corg content in 0–20 cm soil depth, compared to DP and DLP. Stubble tillage had no significant effect on Corg. Stubble tillage combined with reduced primary tillage can sustain yield levels without compromising beneficial effects from reduced tillage on Corg and available nutrient content.

Graphical Abstract

1. Introduction

Soil degradation is one of the main challenges to maintaining soil quality and ensuring food production in the years to come. The primary soil degradation processes, such as soil erosion or the loss of soil organic matter, are strongly associated with soil management and tillage systems in particular. Reduced tillage or no-till systems (conservation tillage/non-inversion tillage) are suitable tools in conventional farming to prevent soil degradation, to increase ecosystem services, such as water retention capacity [1,2,3], and decrease production costs [3,4]. In recent years the potential to increase soil organic matter gained attention because soils are now considered to be CO2 sinks and carbon sequestration in agricultural soils is a potential strategy to mitigate climate change [2,5]. No-till and reduced tillage systems lead to changes in the soil carbon dynamics compared to conventional tillage. Soil organic carbon (Corg) becomes enriched in the topsoil and depleted in the subsoil [1,6,7]. Whether or not reduced tillage and no-till systems have the potential to increase total soil carbon stocks is debated and evidence from field trials is contradictory. When higher carbon stocks under reduced tillage are found, this is attributed to a decreased decomposition rate of organic matter due to less soil disturbance and less destruction of soil aggregates. In addition, C accumulation in micro-aggregates is enhanced by no-till, which leads to a reduced decomposition rate and an increased storage duration in the soil [8]. A meta study comparing no till and conventional (inversion) tillage systems, found that out of 78 studies analyzed, 40 showed higher soil stocks with no-till systems, 31 the same stocks, and seven lower stocks [9]. A mere reduction of tillage had no significant effect on soil organic matter compared to conventional (inversion) tillage in long-term experiments [10]. Other authors [11] strongly doubt positive effects of no-till and reduced tillage on carbon storage; they attribute these results mainly to biases derived from methodological problems, for example, by shallow soil sampling with a maximum depth of 30 cm. The accumulation of C in reduced tillage or no-till systems is then overestimated because C depletion in deeper soil horizons is not taken into account. Therefore, it is necessary to take soil samples at greater soil depths.
Up to now, reduced tillage and no-till systems are not widely applied in organic agriculture, even though these management strategies can improve soil quality, which is very much in line with the core idea of organic agriculture: the improvement of soil fertility. According to Watson et al. [12], soil fertility management in organic farming involves a long-term systems-oriented approach that is contrary to the short-term, target-oriented management practices in conventional farming. Organic agriculture particularly relies on soil organic matter for the release of nutrients, a feature that is less important for conventional farming systems. When comparing different aspects of soil fertility, organic farming in most cases performs better than conventional farming. Organically managed soils tend to accumulate more soil organic matter than soils in conventional agriculture, as confirmed by several recent reviews and meta-analyses [13,14,15,16,17]. This soil organic matter accumulation from organic management practices like perennial leys or manure application leads to the assumption that organic farming can enhance C sequestration in agricultural soils and thereby contribute to the mitigation of greenhouse gas emissions [18]. Up to now, despite the benefits of reduced tillage and no-till systems, some obstacles prevent their use in organic farming: yield reduction due to high weed pressure, limited N availability, difficulties in managing poorly drained soils, problems applying the techniques in high rainfall areas, and a limited choice of suitable crops [19]. In cool and humid climates, weed management is the crucial factor for lower yields of reduced tillage systems, compared to inversion tillage, in organic farming systems [20]. Perennial weeds (e.g., Cirsium arvense) can be particularly difficult to manage [21,22]. Reduced tillage systems are more easily adopted by conventional farmers due to the application of herbicides to control weeds. However, organic farmers must rely mainly on mechanical weed control methods, including primary tillage. No-till is, therefore, usually not an option for organic farmers, even though the use of cover crops for weed control could be a solution under certain conditions [23]. If this is the case, yield levels can even exceed those of conventional tillage [24]. A specific problem arises when perennial grass/clover (leys) or very productive cover crops have to be removed without plowing. Because herbicide use is not allowed in organic farming, mechanical weed management practices must be applied to destroy the plants and to incorporate the plant material in the soil. Soil quality maintenance is a core issue in organic farming and the existing benefits from organic management practices could be further enhanced by introducing reduced tillage systems despite the challenges described above. In order to maintain yield levels and to improve soil properties, organic farmers could reduce tillage frequency, depth, or switch from soil inversion by the moldboard plow to non-inversion tillage by the chisel plow.
Little information is available on long-term Corg and nutrient development under different tillage systems in organic agriculture. As changes within the distribution of nutrients and Corg in a soil profile are rather slow processes, it is essential to evaluate data from long-term trials. In addition, the durations of organic rotations have to be considered when yield data is evaluated. The objectives of the present study were to evaluate the effects of different organic reduced tillage strategies (reduced in frequency, depth and type of tillage (inversion/non-inversion)) in a temperate climate, on crop yields, humus budget and soil parameters (Corg, plant available P and K), to a soil profile depth of 60 cm. We set up the following hypotheses: (a) reduced tillage leads to a stratification of plant available P, plant available K and Corg along a depth gradient, (b) reduced tillage leads to reduced yields in the rotation compared to the inversion tillage treatment, and (c) reduced tillage increases Corg despite lower yields, and thus contributes to C sequestration in organic agriculture.

2. Experimental Section

2.1. Field Experiment

The field experiment was established in the year 1999 at the research station for organic farming Kleinhohenheim, at the University of Hohenheim, Stuttgart, Southwest Germany. The research station is 435 m above sea level, with an average annual precipitation of 700 mm and an average annual temperature of 8.8 °C. In 1994, the research station was converted to organic management and has been managed ever since according to the organic standards of the European Union and of three German organic farming associations (Naturland, Demeter, Bioland). Until 2010 the farm kept sheep (0.9 livestock units per ha), and the sheep manure was composted. Fertilization and all other management measures apart from the experimental treatments were done according to best management practice. As a specialty, bio-dynamic preparations were applied according to the standards of Demeter. Sheep husbandry was given up in 2011, and the farm is now managed without livestock. The soil type at the experimental site was a Haplic Luvisol from loessic loam. Because the field was on a slight slope to the east, the replicates were arranged along this gradient to consider possible effects by soil erosion in the statistical analysis.
The field experiment was originally established in a one factorial block design with four different treatments of primary tillage and four replicates. The design was modified to a two factorial split plot design in 2005, with the main factor primary tillage maintained as in the years before. Shallow stubble tillage by a skimmer plow, shortly after crop harvest, was introduced in 2005 as a second factor. Four different treatments of primary tillage were applied: (1) deep moldboard plow 25 cm full inversion tillage to 25 cm depth (DP, complete soil inversion), (2) double layer plow to a depth of 15 cm + 10 cm (DLP, combines soil inversion and non-inversion in one implement: soil inversion only of the upper 15 cm by a moldboard, while loosening the soil at the same time by a chisel with a goose-foot shaped blade 10 cm below the inverted soil), (3) shallow moldboard plow to a depth of 15 cm (SP, complete soil inversion), and (4) chisel plow to a depth of about 15 cm (CP, no soil inversion). To determine the effect of the stubble tillage, the plots (size 20 m × 40 m) were divided in two-subplots of equal size (10 m × 40 m); one sub-plot served as control while the other was tilled at 7 cm, with a skimmer plow directly after harvest (several weeks or months prior to primary tillage). Primary tillage was usually performed in autumn for both winter and spring crops. The soil was not tilled at all during the period of grass/clover.
Table 1. Crop rotation and fertilization in the field experiment.
CropYearFertilisation with composted sheep manure (t ha−1 dry matter)
Spelt (Triticum aestivum subsp. spelta)2000
Potatoes (Solanum tuberosum)200124
Triticale (xTriticosecale Wittmack)2002
Grass/clover mix (Trifolium pratense, T. repens, Medicago sativa, Lolium perenne, Phleum pratense, Festuca pratense and others) 2003
Grass/clover (see above)2004
Winter wheat (Triticum aestivum)200518
Oat (Avena sativa)2006
Faba bean (Vicia faba)2007
Spelt (T. aestivum subsp. spelta)2008
Maize (Zea mays)200924
Triticale (xTriticosecale Wittmack)2010
Grass/clover (undersown in 2010), see above2011
Grass/clover (see above)2012
The crop rotation is typical for an organic farm in central Europe and was designed for a mixed organic farm (Table 1). The grass/clover mixture of 2011 and 2012 was established as under sown in triticale in 2010. Mustard (Sinapis alba) or oilseed radish (Raphanus sativus) were sown as after-harvest cover crops in all years when a spring crop followed the next year. Fertilization with composted sheep manure was done in the years 2001 (24 t ha−1), 2005 (18 t ha−1), and 2009 (24 t ha−1, Table 1).

2.2. Soil Sampling

To examine the long-term effects of different tillage systems on soil characteristics, soil samples were taken on 11 March, 2011, during the grass/clover ley in order to minimize direct effects of tillage operations in particular on bulk density. For soil chemical analyses, five randomly distributed samples were taken with an auger on each plot at depths of 0–20 cm, 20–40 cm, and 40–60 cm. The five samples per soil depth and plot were mixed, stored in the field in a cool box, then frozen and stored at −18 °C. Storage and sample treatment is in line with the sampling method for Nmin analyses and allows for all further analyses of plant available nutrients [25].
To minimize direct effects of tillage operations on bulk density in particular in the soil depth 0–20 cm, bulk density was determined in the grass/clover stand. The last tillage operation on the sites took place in October 2009 (before sowing of triticale; grass/clover was then undersown in triticale without additional tillage). Soil cores were taken on 28 April 2011 in a 1 m × 1 m × 1 m profile established on one plot of each tillage treatment without stubble tillage. Soil cores were only taken in one plot per tillage treatment in order to minimize destruction on the plots. In each soil depth three soil cores were taken; the soil did not contain stones or gravel.

2.3. Chemical and Physical Soil Analyses

Frozen soil samples were thawed and used for Nmin-determination according to VDLUFA [25] by extraction with CaCl2. NO3 and NH4+ were measured in a flow analyzer (FIA 5012 TECTATOR). The remaining soil of each sample was air dried and sieved to 2 mm for further analyses. Soil pH was measured 1:10 in 0.01 M CaCl2 [25]. Plant available phosphorous (Pavail) and potassium (Kavail) were extracted at pH 3.6 by calcium-lactate [25]. Following, P was determined by a flow analyzer (FIA 5012 TECTATOR) and K by a flame photometer (ELEX 6361 Eppendorf). Total carbon (Ct) and (Nt) were determined by combustion using finely ground samples (Variomax CNS). For the determination of inorganic C soil samples were first reduced to ashes at 550 °C in a muffle furnace. The remaining C in the ashes is determined as Canorg and was analysed by combustion (Variomax CNS). Corg was calculated as the difference of Ct and Canorg. For bulk density determination, fresh soil cores were dried at 105 °C degrees for 24 h.

2.4. Yield

Yield was determined by harvesting one track in the center of each plot equal to the width of the combine harvester, except silage maize (hand cuts on 2 × 0.75 m2 per plot). Sub-samples of the harvested fresh biomass (grains; or above-ground biomass for maize and grass/clover) were used for the determination of dry matter content by weighing the fresh biomass, drying at 80 °C for 48 h until constant weight, and then re-weighing.

2.5. Humus Budget

A humus budget is used to assess the inputs and outputs of soil humus for a given area based on the crop rotation (cropping sequence and harvested produce). By using such calculations, the potential for carbon storage or carbon loss can be described for a cropping system. Humus reproduction in our budget calculation describes the losses and gains of carbon in the stable humus fraction. Humus reproduction values (“humus carbon”, Table 2) are fixed coefficients for crops and organic inputs given in [26]. Calculations were done for crops and organic manure to provide an overview of the humus budget of the area. The procedure was done in accordance with the EU cross compliance standards, where.–among other requirements.–a simple humus budget is required if farmers apply for direct payment subsidies from the European Union [27,28]. The method of calculation in Germany follows official standards with fixed standard values for crop yields, crop residues and organic fertilizers (Table 2), as provided by the rural administration of the federal states (for the study: [29]). The values for humus reproduction were summed up over the whole time of the experiment to obtain the budget.
Table 2. Basic data for calculation of carbon inputs by crops, catch crops and organic manure according to EU cross compliance standards [27,28] for Germany; cereal straw removed from the field for animal bedding. Humus reproduction positive: humus increasing; negative: humus loss.
Crop, organic manureStandard yield t ha−1 * Humus reproduction
(“humus-carbon” kg C ha−1 yr−1)
Winter wheat, triticale6−280
Oat, spelt5−280
Potatoes30−760
Silage maize14−560
Faba beans3160
Cover crop (non-legume)No data80
Grass/clover undersownNo data200
Grass/clover main cropNo data600
Manure compost (55% dry matter)See Table 196 kg humus-C per t substrate
* Fixed yields provided by the standards.

2.6. Statistics

The data was evaluated by SAS statistic software using the procedure “mixed”. The data is modeled as a three-factorial experiment performed in a split-plot design. The model in the syntax of Patterson [30] is as follows:
Y + PT + ST + PT·ST + PT·Y + ST·Y + PT·ST·Y:R + MP + SP + R·Y + MP·Y
with year (Y), primary tillage (PT), and stubble tillage (ST). Effects for replicate (R), main-plot (MP), and sub-plot (SP), and their interaction with year were assumed as random. The data was log-transformed to obtain normal distribution and homogeneity of variance within years. We further allow the model to fit year specific variance. To avoid convergence problems, the interaction between year and main-plot was dropped from the model. For the illustration in graphs, values were back-transformed. The degrees of freedom for testing fixed effects were estimated by the Kenward-Rogers approximation. Multiple pair wise comparison of least square means were performed only after finding significant differences via F-Test.
For soil data the same experimental setting and statistical procedures were used, but instead of “year” the third factor was soil-sampling depth (D). Consequently the syntax for the statistical analysis of soil data reads as follows:
D + PT + ST + PT·ST + PT·D + ST·D + PT·ST·D:R + MP + SP + R·D + MP·D
No transformation was needed. Additionally we allowed that errors from different depths within sub-plots to be correlated. We therefore fitted an unstructured covariance structure for the error.

3. Results and Discussion

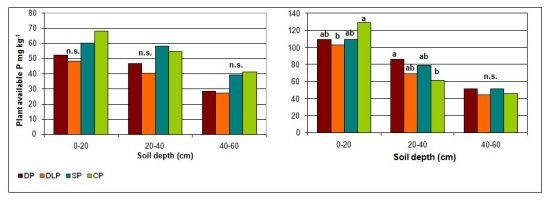
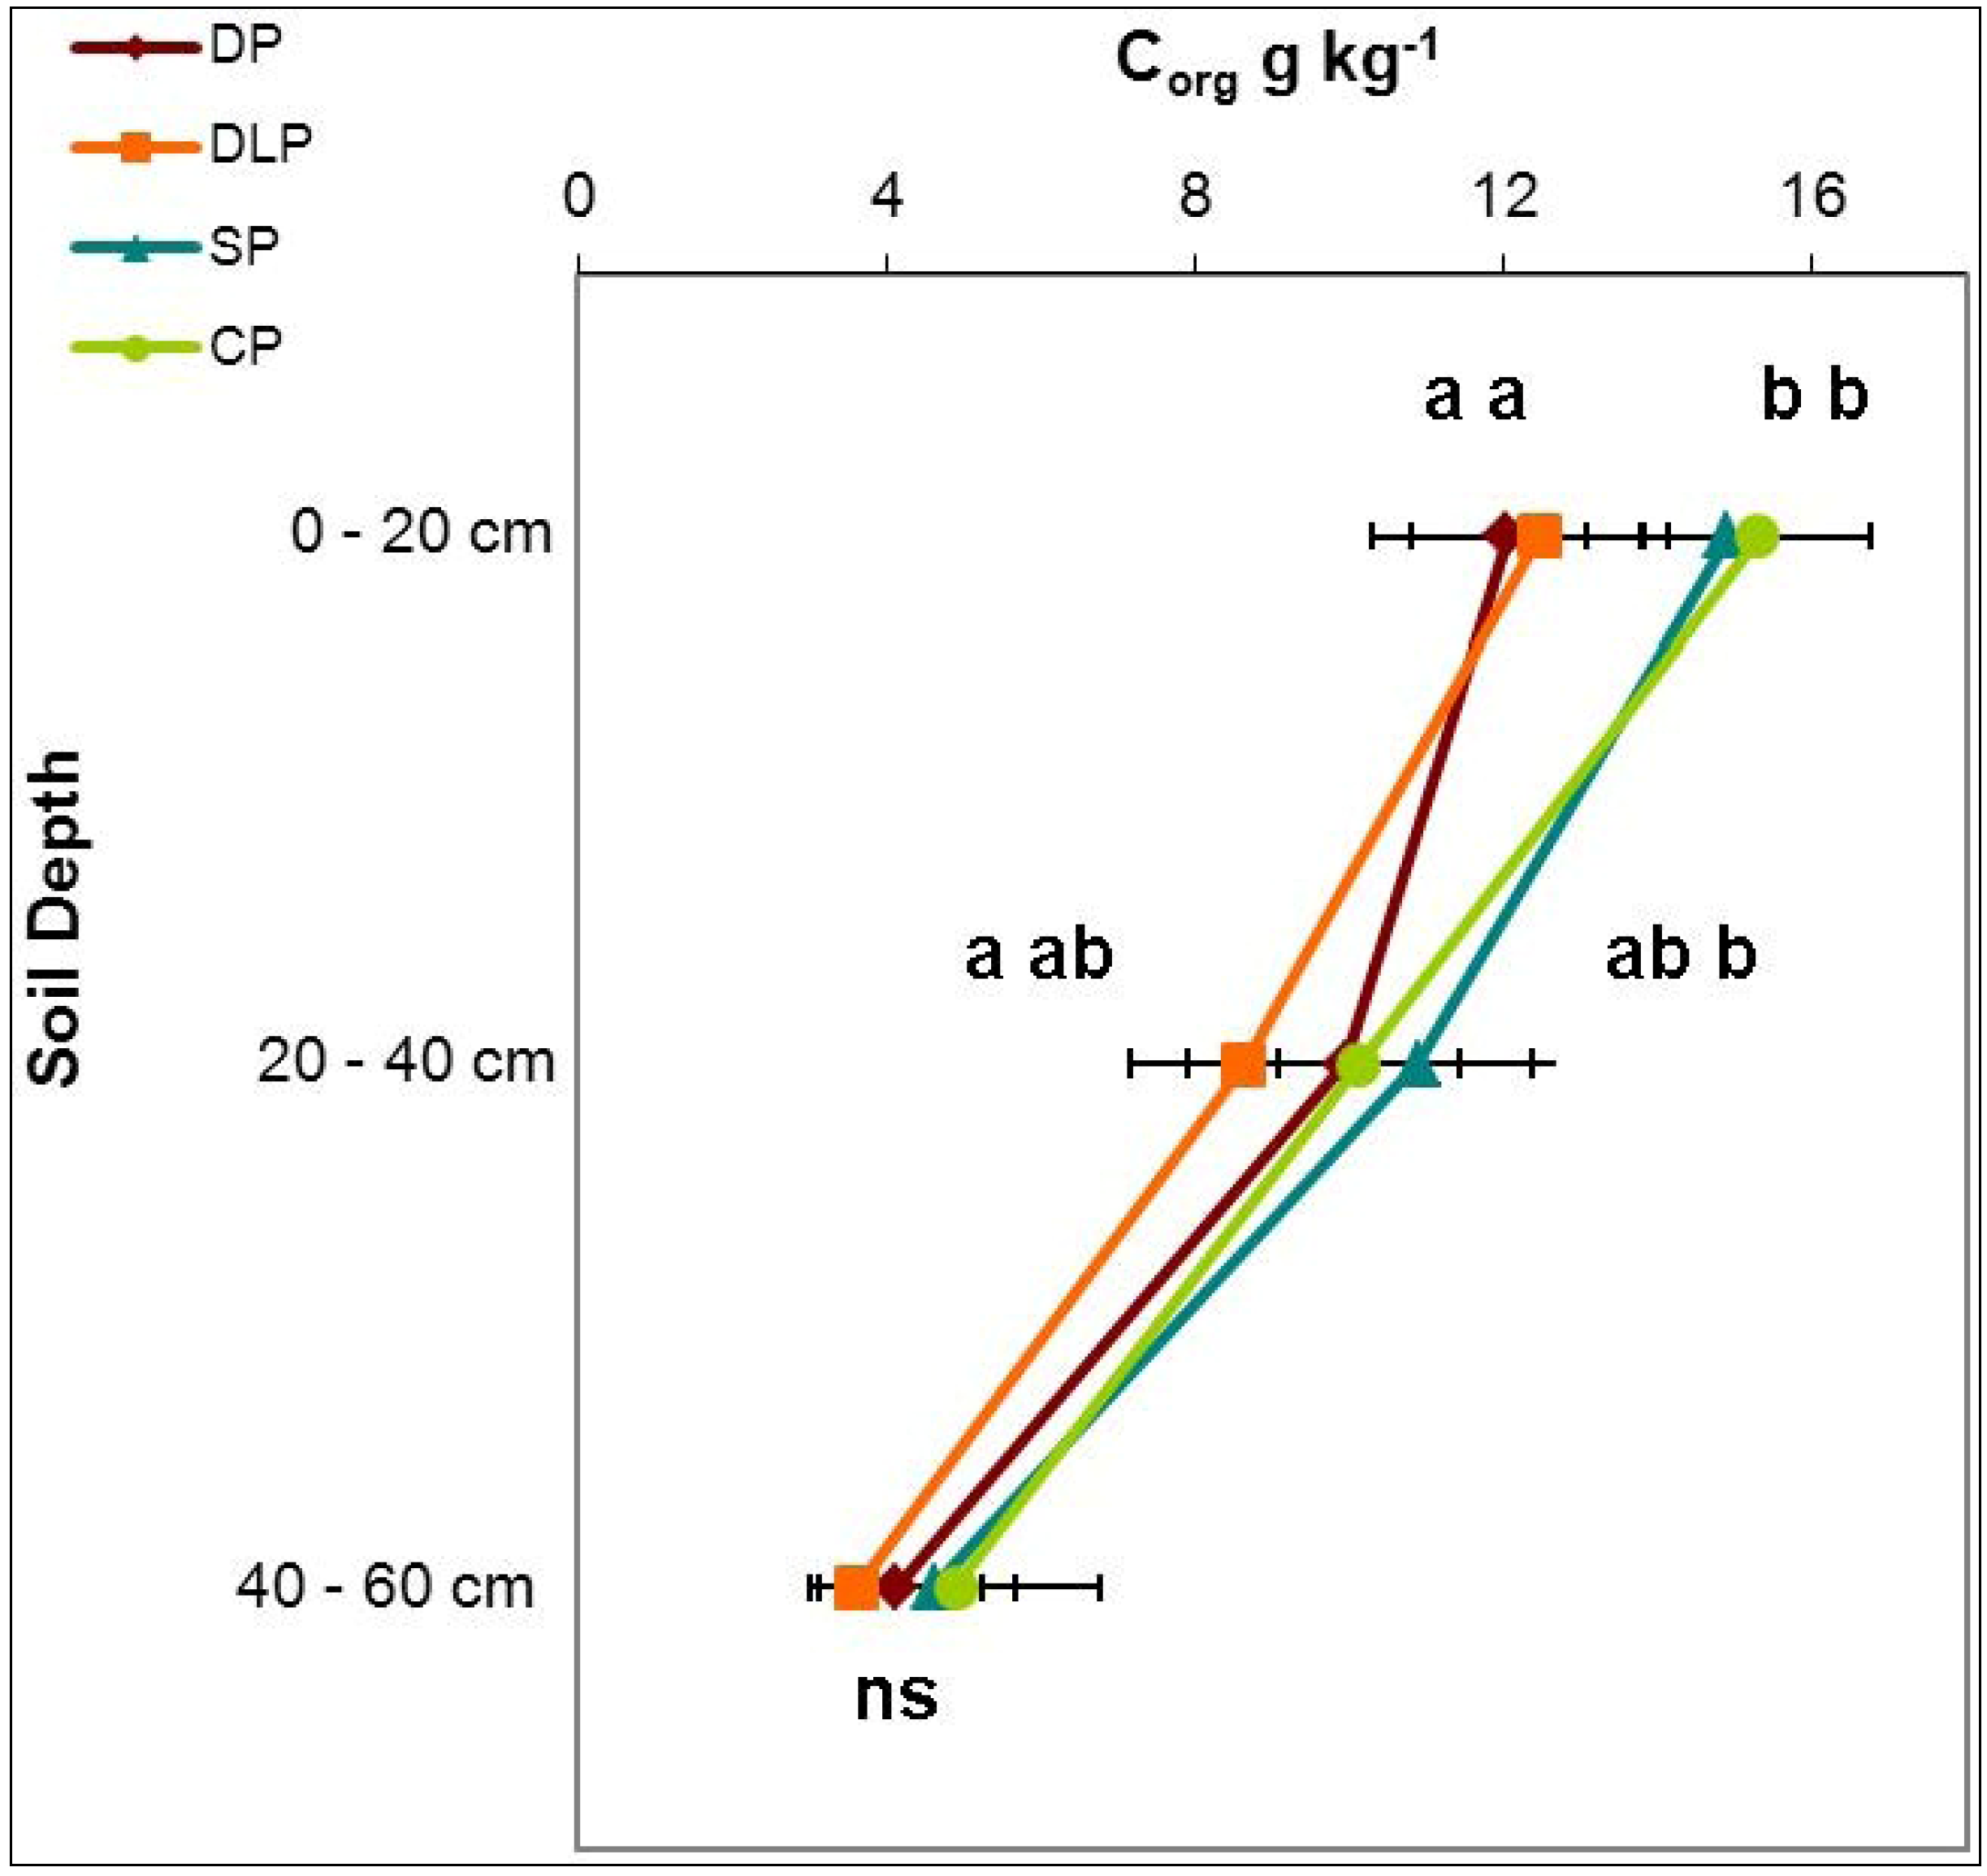
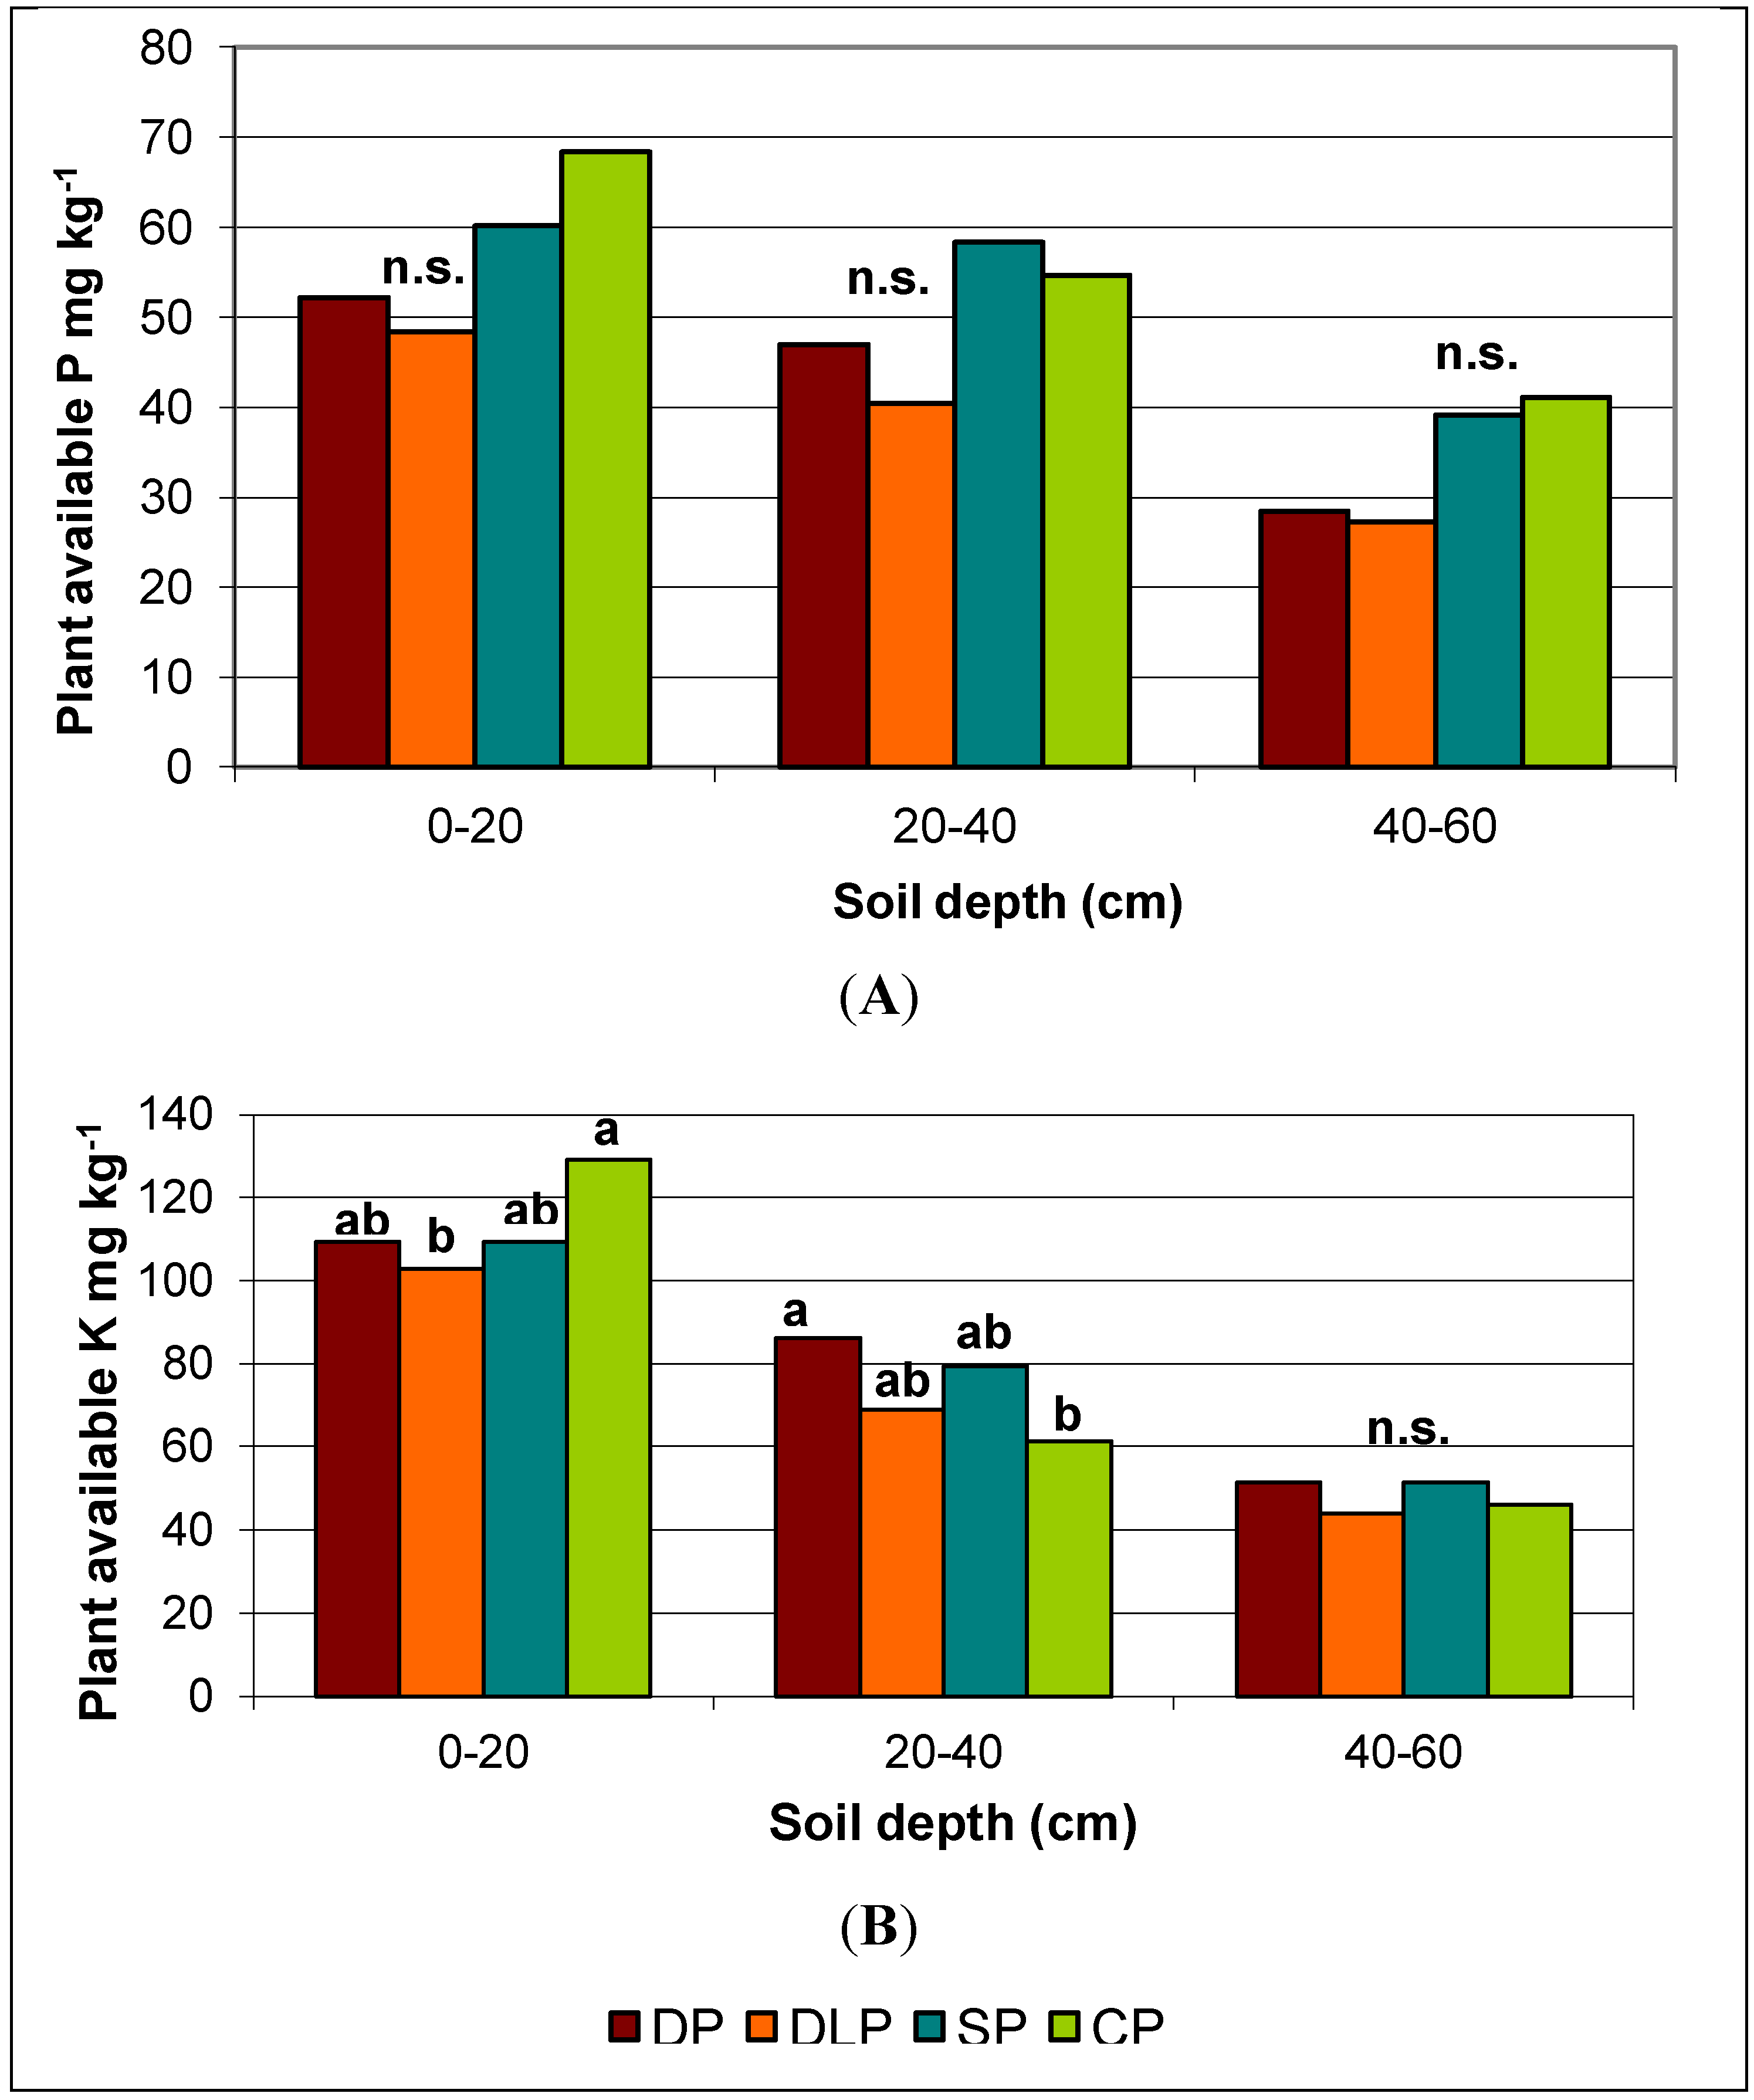
3.1. Soil Parameters

The soil parameters showed a clear differentiation between the various sample depths (Table 3). A clear gradient with depth existed for all parameters, in particular for Kavail, Pavail and Corg. Nutrient content and Corg were lower in greater soil depths. Canorg showed an inverse trend with lower values in the sample depth between 0 and 20 cm; this trend is a typical result of weathering under humid conditions and is not affected by tillage. Liming was not done during the experiment; therefore no management practices affected Canorg contents. A clear differentiation along a depth gradient was not visible for pH (Table 3). All plots showed high levels of Kavail and Pavail compared to the findings of other authors, who document much lower levels of P and K after long-term organic management [31]. Particularly for Pavail the nutrient status of the plots was on the average very high for sites under organic management compared to other studies [31,32,33]. Kavail supply was also high on average, ranging from 113 mg kg−1 to 48 mg kg−1 between 40 to 60 cm. Corg contents were on average 13.7 g kg in the top soil (Table 3) with a maximum of 15.3 g kg−1 in the plots with CP (Figure 1). Bulk density of the topsoil differed between the tillage treatments, with the lowest bulk densities in the SP treatment (1.4 g cm−3) and highest in the CP treatment (1.6 g cm−3). Differences became smaller between the treatments with soil depth ranging from around 1.5 to 1.6 g cm−3 for all treatments (data not shown). As only a limited number of samples were taken, statistical evaluation of the effects of tillage systems on bulk density was not possible.
After extended periods of reduced tillage or no-till, many authors found clear differences in the stratification of plant available nutrients and pH depending on the tillage regime [3,34,35]. In the field experiment none of the variables tested were affected by stubble tillage. Analysis of variance showed highly significant effects of soil depth for the available nutrients P, K and Corg (Table 4) with higher contents in the top 20 cm (Figure 1 and Figure 2A,B). pH had a similar (data not shown). None of the variables were affected by stubble tillage.
Figure 1. Soil organic carbon from 0–60cm soil depth effects after 12 years of conventional and reduced tillage in organic farming. Error bars: Standard deviation; DP: deep moldboard plow (25cm), DLP: double layer plow (15 + 10cm), SP: shallow moldboard plow (15cm), CP: chisel plow (15cm). Different letters depict statistically significant differences between the treatments for p < 0.05; comparison only within each depth.
Sustainability 05 03876 g001
Figure 2. Plant available phosphorus (A) and plant available potassium (B) in soil depths from 0–60 effects after 12 years conventional and reduced tillage in organic farming. DP: deep moldboard plow (25 cm), DLP: double layer plow 15 + 10 cm, SP: shallow moldboard plow (15 cm), CP: chisel plow (15 cm). Different letters depict statistically significant differences of means for p < 0.05; comparison only within each depth.
Sustainability 05 03876 g002
Table 3. Mean, standard deviation, minimum and maximum of soil parameters at each sample depth, independent from primary tillage and stubble tillage (n=32 for each sampling depth, except for bulk density were n=3 per sampling depth).
MeanSdMinMax
Soil Depth 0–20 cm
Variable
Kavail mg kg−11132173164
Pavail mg kg−1572435137
pH 6.30.26.16.7
Canorg%0.050.030.020.14
Corg g kg−113.72.29.117.9
Nt g kg−11.490.21.031.86
C:N ratio91810
Soil Depth 20–40 cm
Variable
Kavail mg kg−1741841121
Pavail mg kg−1502820134
pH 6.40.36.07.1
Canorg%0.040.030.020.16
Corg g kg−19.92.06.415.3
Nt g kg−11.120.200.791.49
C:N ratio91811
Soil Depth 40–60 cm
Variable
Kavail mg kg−148123382
Pavail mg kg−134336176
pH 6.40.45.57.3
Canorg%0.070.080.020.35
Corg g kg−14.31.32.38.4
Nt g kg−10.550.120.340.89
C:N ratio92618
Table 4. ANOVA for Corg, plant available P, plant available K and pH in different soil depths at the organic research station Kleinhohenheim (SW Germany, organic farming) under four modes of primary tillage.
CorgPlant available PPlant available KpH
EffectDFF-valuePr > tDFF-valuePr > tDFF-valuePr > tDFF-valuePr > t
Depth (D)2567.40<0.001270.21<0.0012552.49<0.00123.090.0616
Primary tillage (P)35.760.013030.280.838630.550.657030.340.7959
Stubble tillage (S) ns ns ns ns
P × S ns ns ns ns
P × D69.43<0.00161.360.0662611.47<0.00162.020.0901
S × D ns ns ns ns
P × S × D ns ns ns ns
Statistically significant effects of primary tillage could be only detected for Corg while depth had an statistically significant influence on Corg, plant available P and K. Significant interactions of both, depth and primary tillage, could be detected only for Corg and plant available K (Table 4). Maybe the slope of the experimental field and inherent, though non-apparent, soil erosion has caused considerable variability in the tested factors. Figure 1 shows a clear differentiation of Corg contents as a function of soil depth and tillage system. Corg contents were significantly higher in the top 20 cm of the plots under CP tillage and SP (15 cm) compared to the two deep plowing systems (DP 25 cm and DLP 10 cm + 15 cm) (Figure 1). For the soil depth 20–40 cm, below the plowing depth, a statistically significant difference was only visible for DLP and SP with significantly higher Corg contents for the latter treatment. For the soil depth 40 cm to 60 cm m no statistically significant effects were visible at all (Figure 1). Similar enrichments of Corg in the topsoil are often found in no-till and reduced tillage systems in both conventional [4,35] and organic experiments [34,36]. This results from reduced mineralization due to lower soil aeration in no-till or reduced tillage systems. Because of these findings some authors [2,4,18] attribute the potential of C sequestration to no-till or reduced tillage systems. For example, changes from intensive tillage to reduced tillage in Great Britain led to increases of 310 kg C ha−1 yr−1 compared to losses of 180 kg ha−1 yr−1 in the upper 30 cm of the soil [37]. The current experiment’s 12-year duration exceeded such short-term studies and therefore the differences in Corg between the treatments can be attributed to the tillage system. Because Corg contents, at greater soil depths, did not decline significantly with reduced tillage, a mere redistribution of Corg in the soil profile with high contents in the top soil and low contents in the subsoil could be excluded. These findings favor the assumption that by reducing tillage operations, an overall enrichment of C and its sequestration is possible in reduced tillage systems in organic agriculture.
Tillage did not affect pH in the current study, though differences between inversion tillage and shallow non-inversion tillage can occur after several years under organic management; this decline is attributed to the accumulation of organic acids in the top 5 cm of the soil thereby decreasing soil pH [34]. In conventional no-till or reduced tillage systems, lower pH values in the top soil are usually also attributed to the acidifying properties of ammonia fertilizers due to their nitrification, but this is not valid for organic farming systems because these fertilizers are not permitted.
No significant effects from tillage were found under the different tillage regimes for Pavail (Figure 2A). Other authors found, on the contrary, a clear stratification of Pavail in no-till systems compared to inversion tillage with the highest values in the upper 5 cm of the no-till treatments [38]. As soil disturbance was more intensive in our study compared to the no-till treatments of Piegold et al. [38], such clearly pronounced stratification could not occur. In addition, as the overall P status in the experimental area was high and very heterogeneous (Table 1), and as P is a rather immobile element, changes in the P status between the different tillage systems may not be visible even after 12 years of trial duration.
Kavail is more mobile in the soil and differences between tillage systems should become apparent much sooner than for P. The top 20 cm of plots managed by CP contained the highest amounts of Kavail (Figure 2B). Similar findings were reported by Lewis et al. [39], who detected higher contents of Kavail in the top 30 cm of a field trial after three years of conversion to organic farming and reduced tillage (CP 15 cm depth) in a continental climate in the US.
All in all, abandoning inversion tillage in exchange for the CP resulted in a stratification of K and Corg with soil depth including enrichment in the upper 20 cm. For Corg accumulation in the topsoil, the effects of SP and CP were very similar. In order to receive insights in the Corg stocks the amount of Corg stored was calculated on a per hectare basis. We included bulk density and soil depth in our calculation and did not use the soil equivalent mass procedure as suggested by Wendt and Hauser, 2013 [40]. According to our estimation, shallow plowing led to approximately 91 t Corg ha−1 for SP. For CP the stocks were even higher at 93 t Corg ha−1 per ha compared to DP (83 t Corg ha−1) and the DLP (75 t Corg ha−1). This confirms the hypothesis that a reduction of tillage operations leads to an overall increase of Corg as also shown by Emmerling [41]. By taking soil samples at a depth of 60 cm, the current study avoids the bias of shallow soil sampling, which might overestimate the Corg accumulation in no-till and reduced tillage systems because depletion of C in the subsoil is not taken into account [11]. The lower bulk density in the top soil of DP (1.4 kg m−3) compared to 1.6 kg m−3 in the CP plots might lead to an underestimation of Corg contents in CP as described by Wendt and Hauser, 2013 [40]. Corg equilibria in agricultural soils are highly dependent on management practices [18], but C retention in soils is also determined by factors like the chemical composition of the organic matter, surface chemistry and reactivity of minerals, climatic conditions, by clay mineral composition, the presence of water, soil reaction, redox state and soil biota [42]. For the Haplic Luvisol derived from the loessic parent material at the research sites, the equilibrium for the given management conditions with reduced tillage may not yet be reached, even after a 12-years trial, and C sequestration may take place for even longer periods; for intensive, conventional tillage the equilibrium maybe lower, even under organic management and reached much earlier. Nevertheless, under reduced tillage the inherent limit to C sequestration will be reached one day and the possibility for C sequestration will cease unless technologies are developed to overcome inherent limits of soils for C accumulation [43].

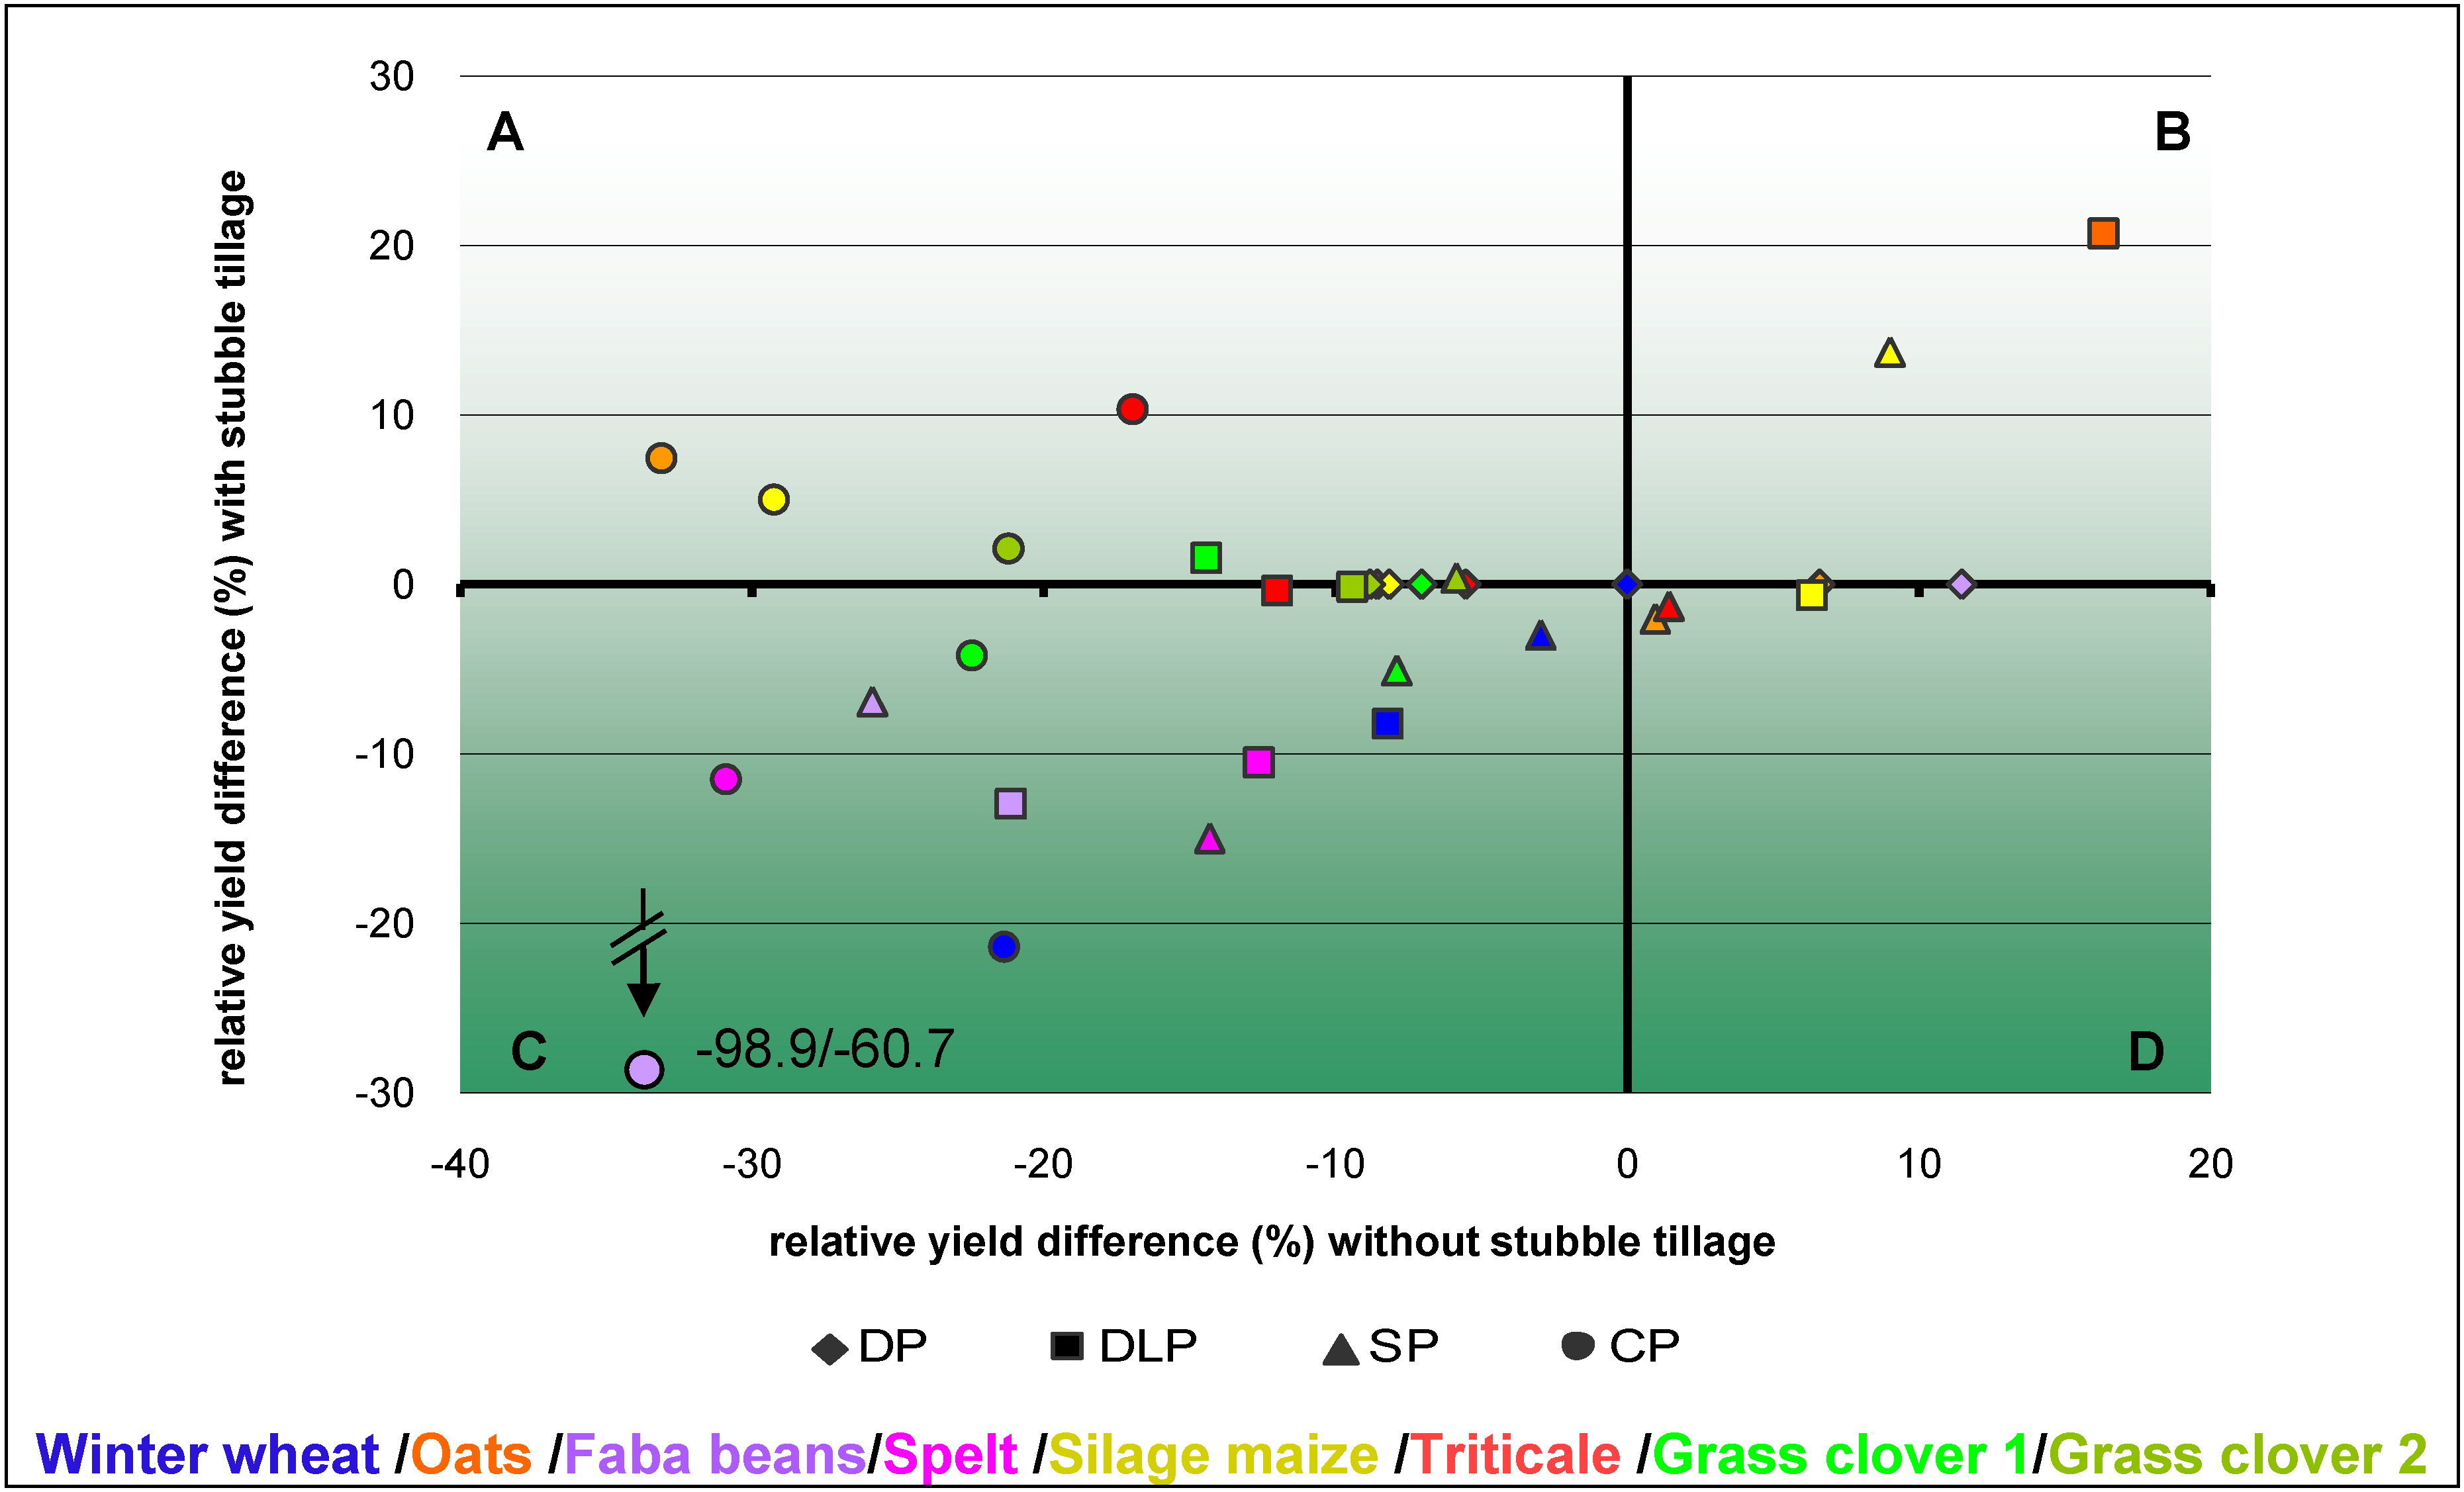
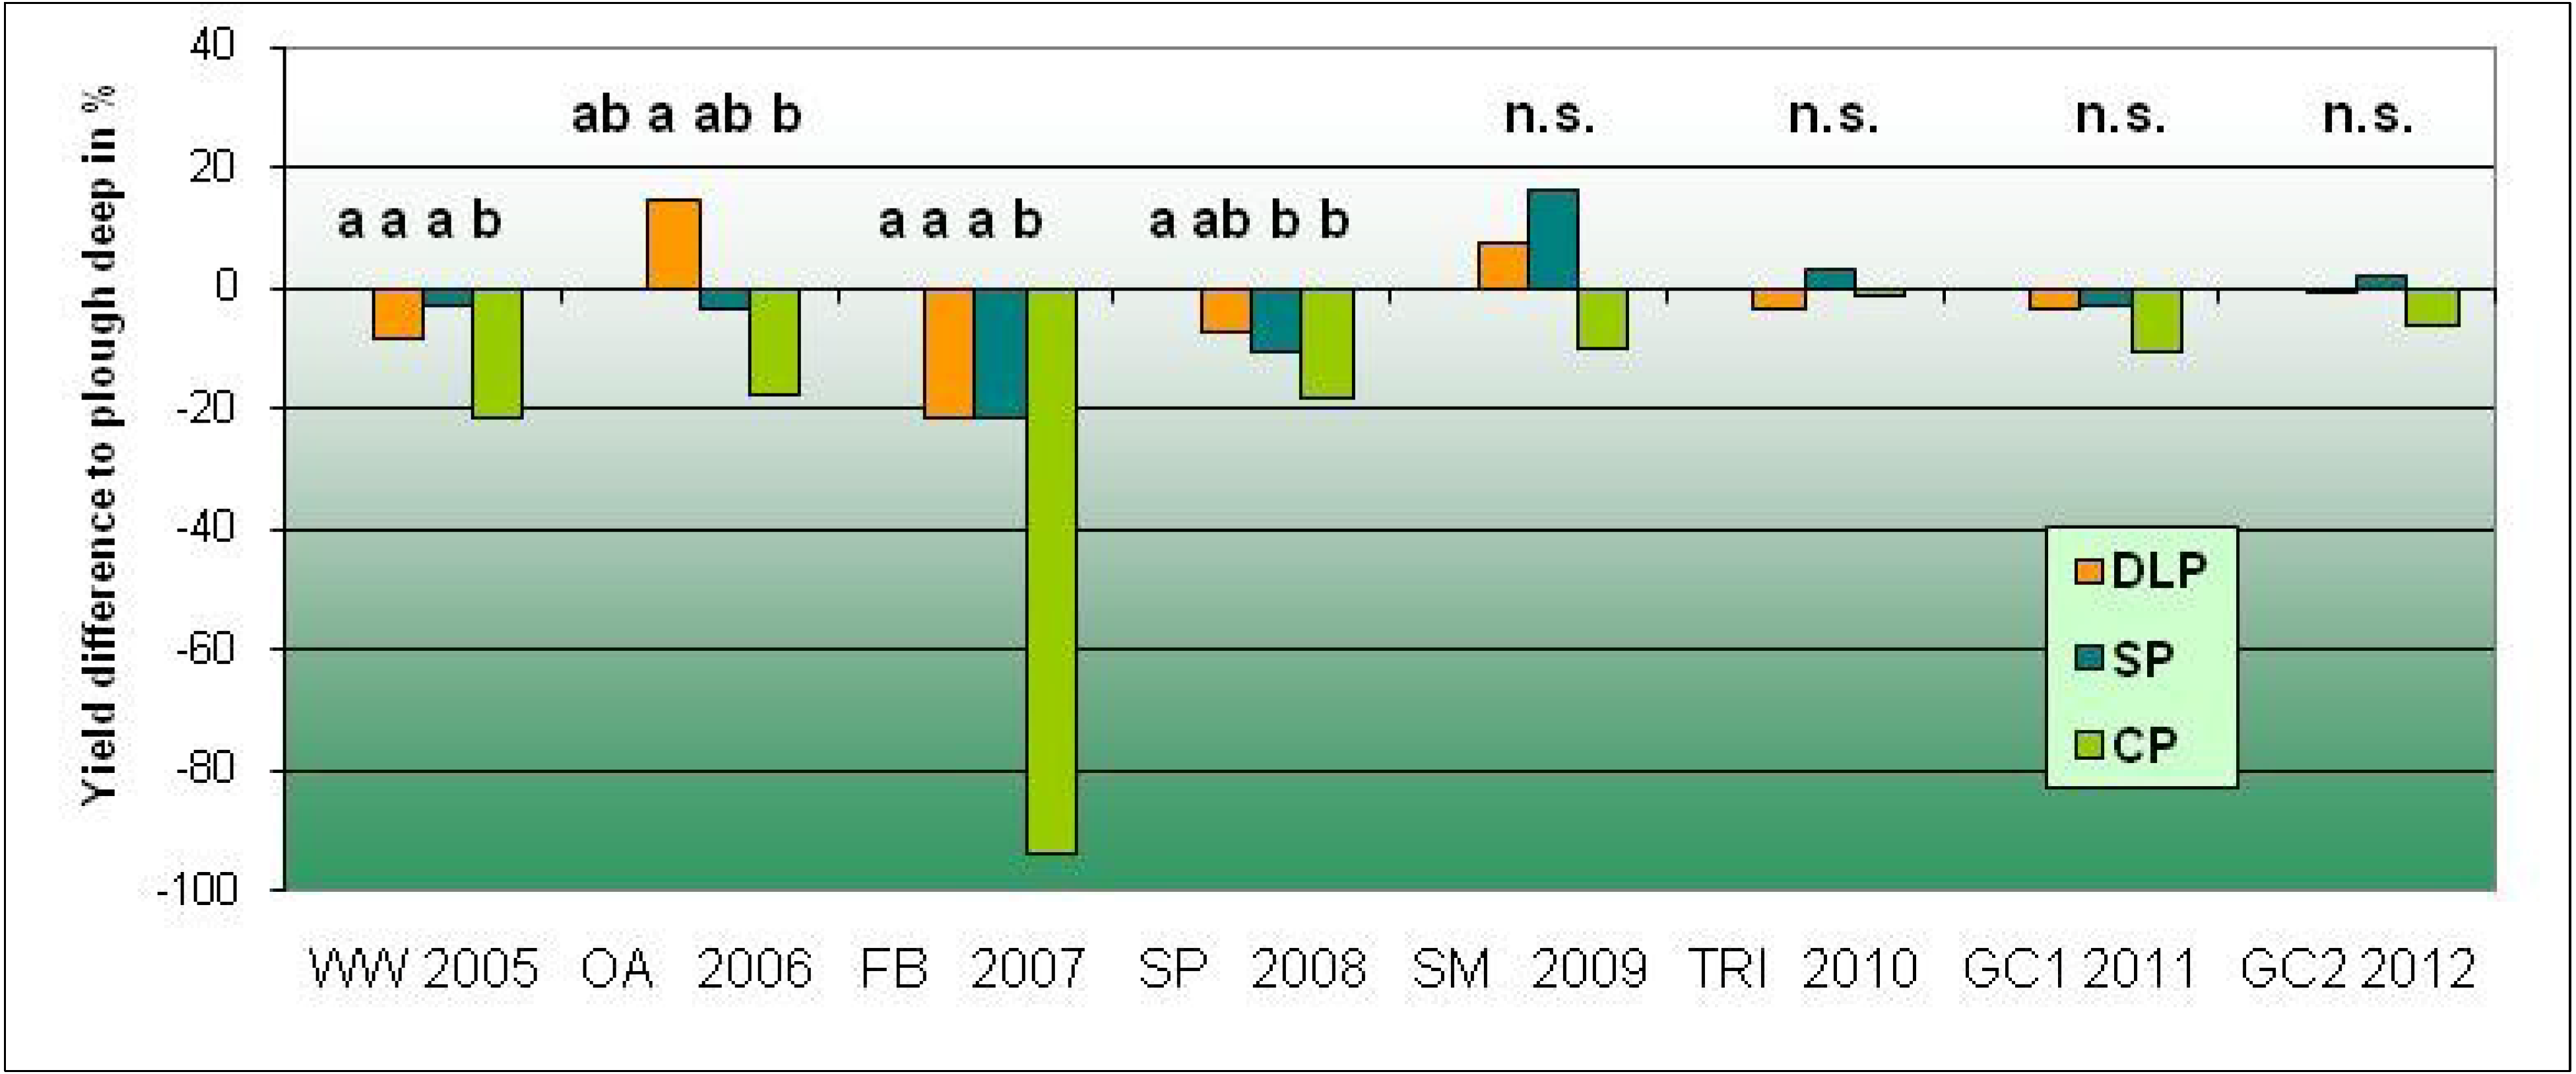
3.2. Yield and Humus Budget

The main effects of primary tillage and stubble tillage were significant (Table 5), and also the two-fold interactions between primary tillage with stubble tillage and with year, respectively.
Table 5. Table of variance for crop yields in one completed eight-year rotation (seven crops; one crop per year, grass/clover biennial) on the experimental station Kleinhohenheim (SW Germany, organic farming) after four types of primary tillage and with or without preceding stubble tillage.
EffectDFF-valuePr > t
Year (Y)7248.59<0.0001
Primary tillage (P)323.93<0.0001
Stubble tillage (S)119.88<0.0001
P × S312.51<0.0001
P × Y212.820.0003
S × Y71.640.1372
P × S × Y211.330.1720
The effect of stubble tillage was not correlated with the year, and only relevant for the yield in a specific combination with the following primary tillage: only if primary tillage was performed by CP, additional stubble tillage significantly increase the yield (p < 0.001; data not shown). Yields also slightly increased by stubble tillage for the three other treatments, but not significantly.
The majority of crops, from 2005 until 2012, had similar or lower yields than the high disturbance standard tillage (DP + stubble tillage absolute yields for the standard provided in Table 6) if they were grown under a reduced tillage system (Figure 3, quarter C).
Table 6. Crop yield (grain, or total plant biomass for silage maize and grass/clover) during an eight-crop organic crop rotation (one crop per year) over 13 years, for the standard tillage treatment (primary tillage with deep mouldboard plowing, and stubble tillage prior to primary tillage); standard error of means in parentheses for data from 2005 until 2012.
YearCropYield (t DM)
2000SpeltNot available
2001PotatoesNot available
2002Triticale4.5
2003Grass/clover4.7
2004Grass/cloverNot available
2005*Winter wheat (WW)4.6 (0.30)
2006Oat (OA)4.2 (0.56)
2007Faba bean (FB)1.3 (0.28)
2008Spelt (SPE)2.4 (0.15)
2009Silage maize (SM)16.8 (2.32)
2010Triticale (TRI)3.4 (0.30)
2011Grass/clover (GC)12.5 (1.23)
2012Grass/clover (GC)10.1 (0.97)
* no stubble tillage before WW, but additional chiseling to destroy the preceding grass/clover in 2004.
Figure 3. Crop yield during an eight-year organic crop rotation (SW Germany, one crop per year from 2005–2012) under various tillage systems (primary tillage, stubble tillage), depicted as yield difference (%) to standard tillage (DP with preceding stubble tillage). Primary tillage DP: deep moldboard plow (25 cm), DLP: double layer plow (15 + 10 cm), SP: shallow moldboard plow (15 cm), CP: chisel plow (15 cm); shape of symbols indicates mode of primary tillage (depicted in black in the legend), color of symbols indicates crop species. Quadrant A: yield superiority of the treatment to the standard if stubble was performed additionally; B: yield superiority of primary tillage independent of stubble tillage, C: yield inferiority by primary tillage independent of stubble tillage; D: yield superiority if no stubble tillage was performed.
Sustainability 05 03876 g003
For these treatments (crop × tillage), the additional stubble tillage prior to primary tillage could not compensate for the disadvantages for yield formation, which were caused if no deep plowing was performed. For some other treatments, mainly primary tillage by CP, additional stubble tillage could increase the yields. This effect was already described for the years 2005 to 2007 for the same experiment [22], and the trend is now confirmed over a much longer period. Across both stubble tillage treatments, primary tillage by CP reduced crop yield by between 2 to 94%, on average 22%, compared to the standard DP plus stubble tillage with the highest soil disturbance (Figure 4). DLP and SP reduced the yields by only 3% on average. Reduced tillage in organic farming often shows lower yields than in conventional farming [20], but the effect seems to be dependent on the grown crop species; some crops are obviously more tolerant to reduced tillage. High weed infestation is a major factor for yield reduction under reduced tillage, particular in organic farming [19,20,22,44]. Weeds were most probably the driving factor for lower yields in the current study under reduced tillage. Mainly the treatments under CP without stubble tillage suffered in crop performance under high weed infestation, namely Canada thistle (Cirsium arvense). Stubble tillage is a suitable measure to reduce perennial weeds such as C. arvense [45]. The type of stubble tillage seems also to be crucial for the success of weed control: a skimmer plow, as we used in our experiment, seems to be superior to non-inversion stubble tillage [45].
Figure 4. Yield difference (%) between three different modes of reduced primary tillage (across stubble tillage treatments) and conventional tillage as standard (=0), during a full eight-year crop rotation in organic farming, SW Germany. DP: deep moldboard plow (25cm, standard), DLP: double layer plow 15 + 10 cm, SP: shallow moldboard plow (15cm), CP: chisel plow (15cm). WW: winter wheat, OA: oats, FB: faba bean, SP: spelt; SM: silage maize, TRI: triticale, GC1: grass/clover 1st year, GC2: grass/clover 2nd year. Significant differences for values with the same letters at p ≤ 0.05.
Sustainability 05 03876 g004
It is not possible to clearly separate the effects of years from the effects of crops, because there was only one crop per year, and the crops were rotated only one time in the period of evaluation, so that all crops were represented by only one cropping year. During the period of grass/clover the yields did not seem to differ very much. As grass/clover mixtures are tolerant to weeds, the higher weed pressure encountered on the CP plots did not affect yield levels.
Winter wheat performed only apparently poorer if a reduced till system was applied; this is due to the fact that only results from non-stubble tillage in all plots exist for winter wheat. The wheat was sown in autumn after mechanical elimination of the preceding grass/clover, and the skimmer plow was not employed for this operation. All in all, the differences between the tillage systems seemed to decrease with the duration of the crop rotation. This effect can be contributed to random crop or year effects, or to the adverse effects of the poor elimination of grass/clover in 2004 with the CP treatment, which resulted in higher weed pressure the following two years.
The calculated mean annual humus budget for the trial accounted for 476 kg C ha−1 from 2000 until spring 2011, a value which has to be classified as high (range of official classification from <−200 (“very low”) to >600 kg C ha−1 yr−1 (“very high”) according to SMUL [26]. The basic data for the calculation of the humus budget do not fully depict the real situation of the current field experiment because the actual yield effects are not considered. Instead, humus reproduction refers to a fixed yield as given in Table 2. The actual yields of the field experiment were not the same as the standard yields the values of humus reproduction refer to. Yields in organic farming tend to be lower than in conventional farming and therefore result in lower biomass inputs. The humus increase by crop residues (roots, stubble, rhizodeposition) as assumed is probably over-estimated. Even though the humus budget showed a rather high surplus of C inputs mainly derived from grass/clover mixtures, the actual content of Corg remained comparatively low. This is reflected in the low C:N ratio of 9 in the soil (Table 3) which indicates a fast turnover of the added organic material. In particular the perennial grass/clover mixtures, which are the main C input in the experiment, are characterized by low C:N ratios. Consequently this material may not have provided considerable contribution to the enrichment of Corg under organic management [31]. In another field trial in Wisconsin/USA, where high amounts of fresh cattle manure were used and grass/clover leys were a part of the crop rotation for organic farming but not for the conventional system used for comparison, the lack of differences in Corg content between the systems were attributed to a rapid C decay [46]. As composted sheep manure was used only in moderate amounts of approximately 5.5 t ha−1 yr−1 in the current study, the amount of organic matter from composted manure, which decomposes slowly, was probably not sufficient to lead to overall higher Corg contents, as documented for fertilization with composted materials [47]. The overall Corg content in our field trial is low, therefore it is very likely that a potential for an increase in carbon content exists and reduced tillage will lead to a new steady-state for Corg at a higher level than for inversion tillage. This was confirmed by the findings that up to the sampling date, no stratification of Corg with the soil depth was visible for SP and CP; only a relative accumulation of Corg occurred in the topsoil with no clearly visible differentiation in deeper soil layers between the different tillage systems (Figure 1).

4. Conclusions

Changes in the distribution and content of Kavail and Corg under reduced tillage in organic farming, compared to conventional tillage, became visible within approximately 12 years in a temperate climate. Double layer plowing shows very similar effects on studied soil parameters as did deep inversion tillage by a moldboard plow. Chisel plowing can contribute to Corg enrichment and to C sequestration in organic farming. Yield decrease, as a disadvantage of reduced tillage, could be compensated by stubble tillage when additionally applied to primary tillage. Generally, it seems that a reduction of tillage depth or in the mode of tillage (inversion tillage vs. non-inversion tillage) should be accompanied by increased frequency of shallow tillage in organic farming. In addition, adaption of rotations to reduced tillage may further increase yield levels as such measures decrease weed pressure. The humus budget calculations as used in our study do not seem to be a suitable tool to describe the carbon dynamics in the soil. For the implementation of tillage practices it is important to define the targets of agricultural activities: Food production and/or C sequestration. If the latter also becomes a target of agricultural measures and is remunerated accordingly, reduced tillage may become more widely adopted both under conventional and organic farming.

Acknowledgements

We thank Rainer Funk and Oliver Hübner, Thomas Ruopp and Ilona Weikert for organization for their on-site support and post-harvest work.

Conflicts of Interest

The authors declare no conflict of interest.

References

  1. Aziz, I.; Mahmood, T.; Islam, K.R. Effect of long term no-till and conventional tillage practices on soil quality. Soil Tillage Res. 2013, 131, 28–35. [Google Scholar] [CrossRef]
  2. Lal, R. Enhancing ecosystem services with no-till. Renew. Agric. Food Syst. 2013, 28, 102–114. [Google Scholar] [CrossRef]
  3. Triplett, G.B.; Dick, W.A. No-tillage crop production: A revolution in agriculture! Agron. J. 2008, 100, S153–S165. [Google Scholar]
  4. Derpsch, R.; Friedrich, T.; Kassam, A.; Hongwen, L. Current status of adoption of no-till farming in the world and some of its main benefits. Int. J. Agric. Biol. Eng. 2010, 3, 1–25. [Google Scholar] [CrossRef]
  5. Freibauer, A.; Rounsevell, M.D.A.; Smith, P.; Verhagen, J. Carbon sequestration in the agricultural soils of Europe. Geoderma 2004, 122, 1–23. [Google Scholar] [CrossRef]
  6. Soane, B.D.; Ball, B.C.; Arvidsson, J.; Basch, G.; Moreno, F.; Roger-Estrade, J. No-till in northern, western and south-western Europe: A review of problems and opportunities for crop production and the environment. Soil Tillage Res. 2012, 118, 66–87. [Google Scholar] [CrossRef]
  7. Dimassi, B.; Cohanb, P.; Labreuchb, J.; Marya, B. Changes in soil carbon and nitrogen following tillage conversion in along-term experiment in Northern France. Agric. Ecosyst. Environ. 2013, 169, 12–20. [Google Scholar] [CrossRef]
  8. Amado, T.J.C.; Bayer, C.; Conceição, P.C.; Spagnollo, E.; Costa de Campos, B.-H.; da Veiga, M. Potential of carbon accumulation in no-till soils with intensive use and cover crops in southern Brazil. J. Environ. Qual. 2006, 35, 1599–1607. [Google Scholar] [CrossRef]
  9. Govaerts, B.; Verhulst, N.; Castellanos-Navarrete, A.; Sayre, K.D.; Dixon, J.; Dendooven, L. Conservation agriculture and soil carbon sequestration: Between myth and famer reality. Crit. Rev. Plant Sci. 2009, 28, 97–122. [Google Scholar] [CrossRef]
  10. West, T.O.; Post, W.M. Soil organic carbon sequestration rates by tillage and crop rotation: A global analysis. Soil Sci. Soc. Am. J. 2002, 66, 1930–1946. [Google Scholar] [CrossRef]
  11. Baker, J.M.; Ochsner, T.E.; Venterea, R.T.; Griffis, T.J. Tillage and soil carbon sequestration—What do we really know? Agric. Ecosyst. Environ. 2007, 118, 1–5. [Google Scholar] [CrossRef]
  12. Watson, C.A.; Atkinson, D.; Gosling, P.; Jackson, L.R.; Rayns, F.W. Managing soil fertility in organic farming systems. Soil Use Manag. 2002, 18, 239–247. [Google Scholar] [CrossRef]
  13. Gattinger, A.; Muller, A.; Haeni, M.; Skinner, C.; Fließbach, A.; Buchmann, N.; Mäder, P.; Stolze, M.; Smith, P.; El-Hage Scialabba, N.; et al. Enhanced top-soil carbon stocks under organic farming. PNAS 2012, 109, 18226–18231. [Google Scholar] [CrossRef]
  14. Tuomisto, H.L.; Hodge, I.D.; Riordan, P.; Macdonald, D.W. Does organic farming reduce environmental impacts?–A meta-analysis of European research. J. Environ. Manag. 2012, 112, 309–320. [Google Scholar] [CrossRef]
  15. Gomiero, T.; Pimentel, D.; Paoletti, M.G. Environmental impacts of different agricultural management practices: Conventional vs. organic agriculture. Crit. Rev. Plant Sci. 2011, 30, 95–124. [Google Scholar] [CrossRef]
  16. Gomiero, T.; Paoletti, M.G.; Pimentel, D. Energy and environmental issues in organic and conventional agriculture. Crit. Rev. Plant Sci. 2008, 27, 239–254. [Google Scholar] [CrossRef]
  17. Mondelaers, K.; Aertsens, J.; van Huylenbroeck, G. A meta-analysis of the differences in environmental impacts between organic and conventional farming. Br. Food J. 2009, 10, 1098–1119. [Google Scholar]
  18. Hülsbergen, K.-J. Kohlenstoffspeicherung in Böden durch Humusaufbau. In Klimawandel und Ökolandbau; KTBL, E.V., Ed.; KTBL-Tagung: Göttingen, Germany, 2008; pp. 7–22. [Google Scholar]
  19. Peigné, J.; Ball, B.C.; Roger-Estrade, J.; David, C. Is conservation tillage suitable for organic farming? A review. Soil Use Manag. 2007, 23, 129–144. [Google Scholar] [CrossRef]
  20. Légère, A.; Vanasse, A.; Stevenson, F.C. Low-input management and mature conservation tillage: Agronomic potential in a cool humid climate. Agron. J. 2013, 105, 745–754. [Google Scholar] [CrossRef]
  21. Pekrun, C.; Claupein, W. The effect of stubble tillage and primary tillage on population-dynamics of Canada thistle (Cirsium arvense) in organic farming. J. Plant Dis. Prot. 2004, XIX, 483–490. [Google Scholar]
  22. Gruber, S.; Claupein, W. Effect of tillage intensity on weed infestation in organic farming. Soil Tillage Res. 2009, 105, 104–111. [Google Scholar] [CrossRef]
  23. Mirsky, S.B.; Ryan, M.R.; Curran, W.S.; Teasdale, J.R.; Maul, J.; Spargo, J.T.; Moyer, J.; Grantham, A.M.; Weber, D.; Way, T.R.; et al. Conservation tillage issues: Cover crop-based organic rotational no-till grain production in the mid-Atlantic region, USA. Renew. Agric. Food Syst. 2012, 27, 31–40. [Google Scholar] [CrossRef]
  24. Krauss, M.; Berner, A.; Burger, D.; Wiemken, A.; Niggli, U.; Mäder, P. Reduced tillage in temperate organic farming: Implication for crop management and forage production. Soil Use Manag. 2010, 26, 12–20. [Google Scholar] [CrossRef]
  25. VDLUFA, Methodenbuch. Band 1. Die Untersuchung von Böden; (in German). VDLUFA-Verlag: Darmstadt, Germany, 1991.
  26. SMUL. BEFU–Teil Ökologischer Landbau. Schriftenreihe des Landesamtes für Umwelt, Landwirtschaft und Geologie 2008, 36, 163–216. (in German).
  27. EC. Council Regulation (EC) No 73/2009 of 19 January 2009. Establishing common rules for direct support schemes for farmers under the common agricultural policy and establishing certain support schemes for farmers, amending Regulations (EC) No 1290/2005, (EC) No 247/2006, (EC) No 378/2007 and repealing Regulation (EC) No 1782/2003. Off. J. Eur. Union 2009, L30, 16–99.
  28. EC. Commission regulation (EC) No 1122/2009 of 30 November 2009 laying down detailed rules for the implementation of Council Regulation (EC) No 73/2009 as regards cross-compliance, modulation and the integrated administration and control system, under the direct support schemes for farmers provided for that Regulation, as well as for the implementation of Council Regulation (EC) No 1234/2007 as regards cross-compliance under the support scheme provided for the wine sector. Off. J. Eur. Union 2009, L316, 65–112.
  29. MLR. Humusbilanzierung–Beurteilung und Bemessung der Humusversorgung auf Ackerland. Merkblätter für die umweltgerechte Landbewirtschaftung 2010, 26. (in German).
  30. Patterson, H.D.; Thompson, R. Recovery of inter-block information when block sizes are unequal. Biometrika 1971, 58, 545–554. [Google Scholar] [CrossRef]
  31. Gosling, P.; Shepherd, M. Long-term changes in soil fertility in organic arable farming systems in England, with particular reference to phosphorus and potassium. Agric. Ecosyst. Environ. 2005, 105, 425–432. [Google Scholar] [CrossRef]
  32. Bell, L.W.; Sparling, B.; Tenuta, M.; Entz, M.H. Soil profile carbon and nutrient stocks under long-term conventional and organic crop and alfalfa-crop rotations and re-establishes grassland. Agric. Ecosyst. Environ. 2012, 158, 156–163. [Google Scholar] [CrossRef]
  33. Carpenter-Boggs, L.; Kennedy, A.C.; Reganold, J.P. Organic and biodynamic management: Effects on soil biology. Soil Sci. Soc. Am. J. 2000, 64, 1651–1659. [Google Scholar] [CrossRef]
  34. Gadermeier, F.; Berner, A.; Fließbach, A.; Friedel, J.K.; Mäder, P. Impact of reduced tillage on soil organic carbon and nutrient budgets under organic farming. Renew. Agric. Food Syst. 2011, 17, 68–80. [Google Scholar]
  35. Salvo, L.; Hernández, J.; Ernst, O. Distribution of soil organic carbon in different size fractions, under pasture and crop rotations with conventional tillage and no-till systems. Soil Tillage Res. 2010, 109, 116–122. [Google Scholar] [CrossRef]
  36. Berner, A.; Hildermann, I.; Fließbach, A.; Pfiffner, L.; Niggli, U.; Mäder, P. Crop yield and soil fertility response to reduced tillage under organic management. Soil Tillage Res. 2008, 101, 89–96. [Google Scholar] [CrossRef]
  37. Powlson, D.S.; Bhogal, A.; Chambers, B.J.; Coleman, K.; Macdonald, A.J. The potential to increase soil carbon stocks through reduced tillage or organic material additions on England and Wales: A case study. Agric. Ecosyst. Environ. 2012, 146, 23–33. [Google Scholar] [CrossRef]
  38. Piegholdt, C.; Geisseler, D.; Koch, H.-J.; Ludwig, B. Long-term tillage effects on the distribution of phosphorus fractions of loess soils in Germany. J. Plant Nutr. Soil Sci. 2013, 176, 217–226. [Google Scholar] [CrossRef]
  39. Lewis, D.B.; Kaye, J.P.; Jabbour, R.; Barbercheck, M.E. Labile carbon and other soil quality indicators in two tillage systems during transition to organic agriculture. Renew. Agric. Food Syst. 2011, 26, 342–353. [Google Scholar] [CrossRef]
  40. Wendt, J.W.; Hauser, S. An equivalent soil mass procedure for monitoring soil organic carbon in multiple soil layers. Eur. J. Soil Sci. 2013, 64, 58–65. [Google Scholar] [CrossRef]
  41. Emmerling, C. Reduced and conservation tillage effects on soil ecological properties in an organic farming system. Biol. Agric. Hortic. 2007, 24, 363–377. [Google Scholar] [CrossRef]
  42. Schmidt, M.W.I.; Torn, M.S.; Abiven, A.; Dittmar, T.; Guggenberger, G.; Janssens, I.A.; Kleber, M.; Kögel-Knaber, M.; Lehmann, J.; Manning, D.A.C.; et al. Persistence of soil organic matter as an ecosystem property. Nature 2011, 478, 49–56. [Google Scholar] [CrossRef]
  43. Lal, R. Sequestering carbon in soils of agro-ecosystems. Food Policy 2011, 36, S33–S39. [Google Scholar] [CrossRef]
  44. Gruber, S.; Pekrun, C.; Möhring, J.; Claupein, C. Long-term yield and weed response to conservation and stubble tillage in SW Germany. Soil Tillage Res. 2012, 121, 49–56. [Google Scholar] [CrossRef]
  45. Pekrun, C.; Claupein, W. The implication of stubble tillage for weed population dynamics in organic farming. Weed Res. 2006, 46, 414–423. [Google Scholar] [CrossRef]
  46. Wander, M.M.; Yun, W.; Goldstein, W.A.; Aref, A.; Khan, S.A. Organic N and particulate organic matter fractions in organic and conventional farming systems with a history of manure application. Plant Soil 2007, 291, 311–321. [Google Scholar] [CrossRef]
  47. D’Hose, T.; Cougnon, M.; de Vliegher, A.; van Bockstaele, E.; Reheul, D. Influence of farm compost on soil quality and crop yields. Arch. Agron. Soil Sci. 2012, 58 (Suppl. 1), S71–S75. [Google Scholar] [CrossRef]

