Article

Global Aquaculture Performance Index (GAPI): The First Global Environmental Assessment of Marine Fish Farming

Seafood Ecology Research Group, School of Environmental Studies, University of Victoria, PO Box 1700 STN CSC, Victoria, BC V8W 2Y2, Canada
*
Author to whom correspondence should be addressed.
Sustainability 2013, 5(9), 3976-3991; https://doi.org/10.3390/su5093976
Submission received: 16 July 2013 / Revised: 23 August 2013 / Accepted: 23 August 2013 / Published: 17 September 2013

Abstract

:
“Sustainable” is among the most sought after of all seafood product adjectives. Ironically it is also one of the most poorly defined and understood. The Global Aquaculture Performance Index (GAPI) is the first tool to assess environmental performance of global marine aquaculture production, permitting direct comparison of disparate species, production methods and jurisdictions. Clear patterns emerge from this analysis; significant variation of environmental performance is driven by the species being farmed, significant room for improvement exists across the entire sector, the worst performing players are also the fastest growing, particularly within Asia, and perhaps most importantly, this work highlights the potential trap awaiting policy makers who focus too narrowly on farm production efficiency alone as a solution to diminishing seafood availability.

1. Introduction

With over 87% of global capture fisheries currently fully- or over-exploited [1] aquaculture is looked upon with increasing urgency to fill the growing global demand for seafood. Over the past three decades the growth of aquaculture production has exceeded all other agricultural sectors worldwide (8.8% annual compounded growth since 1980) [1]. Such rapid growth does not come without challenges and production related environmental impacts are diverse and well documented [2,3,4]. To further complicate matters, while overall production grows rapidly so too does the diversity of species being brought into culture [1] thus amplifying the breadth of potential aquaculture × environment interactions.
Seafood is among the most global of commodities with international imports dominating seafood consumption in most developed nations [1]. Environmentally conscious buyers of aquaculture products face a complex calculus in determining how differing species, production regions and production systems all affect “sustainability” of the product. In response, a de facto sustainable seafood industry has arisen, aiding buyers, both wholesale and retail, in making informed conservation choices. A review of 63 market-based initiatives concluded the lack of coherence across the plethora of guides, standards and certifications is confusing buyers and the lack of demonstrably improved performance on the water undermines the potential efficacy of the entire approach [5].
In order to bring clarity to the myriad species, locales and production methods characterizing modern aquaculture we adopted the analytical foundation of the Environmental Performance Index (EPI) [6]. The EPI is a globally recognized statistical framework which scores environmental performance of all recognized countries against 10 core environmental issue areas. Each issue area yields a performance score that is the weighted aggregate of multiple independent metrics. EPI country rankings are presented biennially at the World Economic Forum meeting in Davos, Switzerland, and have had a transformative effect on the way global environmental performance is measured and compared. Our tool, retrofitted specifically for assessment of marine finfish aquaculture products is the Global Aquaculture Performance Index (GAPI). Like the EPI, GAPI indicates which products perform best across an array of environmental criteria allowing users to drill down to assess performance within each species, producing country, or individual issue areas. In so doing, clear environmental leaders and laggards (both species and countries) are made apparent. Perhaps most importantly, best performing combinations of species, countries and production systems are identified, and provide clear templates of improvement for those lagging behind.
Quantifying environmental performance of aquaculture production has historically proven difficult, reflecting scarcity of data, inconsistent reporting, incomplete science, and a wide range of potential environmental impacts across a global distribution of production. As significant as these challenges may be, they are insufficient to excuse inaction. However, prerequisite to addressing the challenge is creation of a baseline “state of the industry” performance snapshot designed for clear policy relevance.

2. Experimental Section

2.1. Which Metrics Should Be Included and How to Measure Each?

Literally hundreds of metrics could conceivably be employed in the assessment of aquaculture environmental performance, but which should be and how should inclusion/omission be decided? A pilot survey of current seafood sustainability initiatives was undertaken to determine what suite of performance criteria should be included in the GAPI assessment tool. Issues addressed repeatedly across initiatives are, by consensus, considered to be significant and strong candidates for inclusion here. We assessed 30 aquaculture sustainability schemes active in North America and Western Europe (Appendix A). Ten issue areas were consistently addressed across initiatives. These 10 markers of environmental performance (Table 1) were deemed the minimum necessary suite of indicators required for comprehensive assessment of global marine aquaculture and are in fact the product of a de facto peer review by the sustainable seafood community. To determine performance on a 0 to 100 scale as we have done, absolute best (100) and worst (0) performance must first be defined. A perfect score of 100 equates to absolutely no measurable environmental impact. Perfection (absolutely no impact in each of the 10 criteria) is clearly unattainable but the closer a player comes, the higher the score. Determining the worst performance (a score of 0) is more complicated. Theoretically, a given product could perform infinitely poorly within one or all indicators. For instance, what would be the worst possible performance for antibiotic or parasiticide use? The scope is, at least theoretically, infinite. To solve this dilemma, GAPI reviews the pool of performances for that indictor and sets “0” as the worst observed actual performance. Thus, like a classroom grading system, GAPI grades on a curve, where a performer’s GAPI score is partially dependent on the performance of the pool of players among which it is being assessed. This is consistent with the objective of the tool, which is to generate performance profiles that are informative for making comparisons of two or more products. A further implication is that a GAPI score is only informative relative to another score. GAPI is not a standard with a threshold above which a product is considered “sustainable”. Rather GAPI scores reveal strengths and weaknesses in environmental performances relative to other players, and thus avoids the false simplicity of a single absolute sustainability threshold.
Table 1. The 10 Global Aquaculture Performance Index (GAPI) indicators with a brief description and formula for each.
CriteriaCriteria DescriptionCriteria Equation
AntibioticAmount of antibiotics used, weighted by a measure of human and animal health risk.Σ (Amount Active Ingredient (kg) × WHO-OIE Score)
mT Fish Produced
Antifoulants (Copper)Estimated proportion of production using copper-based antifoulants.(BOD (mg O2) * Area of Impact (km2))
mT Fish Produced
Biochemical Oxygen Demand (BOD)Relative oxygen-depletion effect of waste contaminants (uneaten feed and feces).∑(Amount (kg) × [(1/LC50) + 1] * Persistence (Days))
mT Fish Produced
Capture-Based AquacultureThe extent to which a system relies on the capture of wild fish for production, taking into account the sustainability of these wild fish inputs.(∑Proportion Fish/Livestock/Plant * Knife Coefficient
(Megajoules/mT) * Total Feed Consumed (mT))
mT Fish Produced
Ecological EnergyAmount of energy, or net primary productivity (NPP), that farmed fish divert from the marine ecosystem through consumption of wild fish ingredients of feed∑ Net Primary Production of Feed Inputs (g carbon/kg)
mT Fish Produced
EscapesNumber of escaped fish, weighted by an estimate of the per capita risk associated with escapes.∑Pathogen-specific Wild Losses (mT)
mT Fish Produced
Industrial EnergyEnergy consumed in the acquisition and processing of feed ingredients, which serves as a proxy for the total industrial energy used in production.∑(Amount from Wild Capture (kg) * Sustainability Score)
mT Fish Produced
ParasiticideAmount of parasiticides used, weighted by measures of environmental toxicity and persistence.(Production (mT) * % Production
Using Copper-based Antifoulants)
mT Fish Produced
PathogensNumber of on-farm mortalities, weighted by an estimate of wild species in the ecosystem that are susceptible to farm-derived pathogens.∑(Amount (kg) × [1/LC50 + 1 × Persistence (days)]
mT Fish Produced
Sustainability of FeedAmount, efficiency, and sustainability of wild fish ingredients of feed.∑((Proportion of Feed by Species *
Sustainability Score of Each Species) * Fish In: Fish Out Ratio * Production (mT))
mT Fish Produced
* GAPI takes the square root of each indicator formula to make the range of performance values more manageable and disperse the final scores so that differences are more apparent.
Following the identification of the 10 issues which were to become the focus of GAPI, the next step was developing the analytical framework to measure on-the-water performance. Deriving metrics capable of capturing all marine finfish aquaculture production globally is a significant undertaking. Numerous expert workshops were convened, each focused on developing and refining specific ecological indicators. This ensued a multiyear process cumulatively involving substantial input from more than 30 experts, including biologists, producers, statisticians, seafood buyers, and individuals engaged in sustainability assessment. The consensus products of these workshops are presented in Table 1.
Since final GAPI scores are informed by the pool of country-species assessed, it is critical that the pool is representative of the entire peer group. In 2007, 82 marine finfish species or species groups were farmed in 62 countries (FAO 2008a). However, production was dominated by a relatively small number of species. The present assessment was restricted to the top 20 species by production (Table 2), which cumulatively constituted 98.5% of all marine finfish aquaculture production. The remaining 1.5% of global production is spread across an additional 39 species. Just as a small number of species comprise the majority of production, the same is true for producing countries. A species may be farmed in numerous countries but typically the great majority of production occurs in only a few. Thus only those countries that together comprised the top 90% of production of each of the 20 selected species were included. These two decision rules resulted in an assessment of 20 marine finfish species being produced in 22 producing countries which together comprise 94% of marine finfish production by weight (mT) and 91% by value (USD) [7].
Table 2. Species assessed by GAPI in descending order of 2007 production volume.
Species Rank (mT)Marine Finfish Species (in production in 2007)% of Global Marine Finfish Production by Weight% of Global Marine Finfish Production by ValueProducing Countries Included in GAPI Analysis (Representing 90% of Species Production)
1Atlantic salmon40.850Canada, Chile, Norway, UK
2Milkfish17.14.6Indonesia, Philippines
3Flathead grey mullet6.73.8Egypt
4Japanese amberjack4.99Japan
5Red seabream3.83.7China, Japan
6Gilthead seabream3.54.7Greece, Israel, Italy, Spain, Turkey
7Coho salmon3.33Chile, Japan
8Bastard halibut3.24.1China, Korea
9European seabass34.3Greece, Italy, Spain, Turkey
10Japanese seabass2.90.9China
11Groupers21.4China, Indonesia, Taiwan
12Large yellow croaker1.80.5China
13Red drum1.50.5China
14Korean rockfish11.4Korea, Australia, Indonesia, Malaysia
15Barramundi0.90.6Thailand
16Cobia0.80.4China, Taiwan
17Tiger pufferfish0.50.7China, Japan
18Atlantic cod0.30.3Iceland, Norway
19Chinook salmon0.30.5Chile, New Zealand
20Turbot0.20.4France, Spain
Total % of Global Marine Finfish production98.595
% of Global Marine Finfish production assessed by GAPI93.791

2.2. Deriving the GAPI Score

The derivation of the final GAPI score for each species-country pair assessed (e.g., Atlantic salmon–Norway) consists of eight steps (full methodology detailed in Appendices A and B as well at Global Aquaculture Performance Index).

2.2.1. Select Key Indicators of Environmental Performance

Emphasis has been placed on identifying a suite of indicators that sufficiently describes the major ecological impacts of marine finfish aquaculture while using the fewest indicators possible. Details of the pilot study and the resulting indicator selection process are presented in Appendix A.

2.2.2. Construct Indicator Metrics

In order to determine how to best measure actual performance we developed specific criteria to ensure that each is:
-
relevant and measures direct environmental impact;
-
performance oriented and tracks actual, on-the-water performance; (as opposed to aspirational or “best practice”)
-
transparent (both formulae and data); and
-
utilizes the highest quality data available
Details of the process are presented in Table 1 and Appendix B. The derivation of issue-specific metrics is detailed in Appendix C.

2.2.3. Set Targets for Each Indicator

By setting a zero-impact target for each indicator, GAPI permanently sets the environmental performance at the ecological ideal rather than continually recalibrating the goal as the performance of the industry improves or as viewpoints of what is an “acceptable” level of impact shift.

2.2.4. Collect Data

A wide range of data drawn from international organizations, regulatory bodies, conservation organizations, academia, seafood industry groups, and seafood industry trade press were used. All data used are publicly available and traceable. Details of the process are presented in Appendix A. This step represents significant effort not only in acquisition but quality assessment and standardization of data and explains the time lag between production date and scoring.

2.2.5. Winsorization

Winsorization is a common statistical approach [8] to dealing with extreme outliers so those values do not distort the distribution of the entire data set. This is important to maintain the legitimacy of the dataset. Details of the process are presented in Appendix B.

2.2.6. Proximity-to-Target Calculation

In order to directly compare performance among two or more disjunct indicators (i.e., escaping fish and the sustainability of feed sources) in a statistically meaningful way, it is necessary to standardize performance for each on the same 0-to-100 scale. Proximity-to-target calculations quantify how close a performer is to meeting zero-impact for each of the 10 indicators. Details of this process are presented in Appendix B.

2.2.7. Weighting Indicators

The 10 indicators included within GAPI have already been deemed by the conservation community to be important drivers of environmental performance (Appendix A). Principal component analysis (PCA) measures how much of the total variation in the data is explained by each indicator, thus providing a measure of each indicator’s relative importance or weight (Table 3). To be clear, PCA does not ascribe “importance”. Any user-defined combination of weights would ultimately be subjective. Likewise, assigning equal weights to each of the 10 indicators is itself a subjective weighting. Indeed, indicators used in sustainability assessments typically reflect subjective judgments without mentioning or systematically assessing critical assumptions [9]. The PCA approach ascribes weight according to that criteria’s capacity to separate leaders from laggards; an objective statistical technique absent any investigator influence. Details of the process are presented in Appendix B.
Table 3. Example calculation of the final normalized GAPI score for tiger puffer fish produced in China.
ABCDE
IndicatorIndicator PerformancePCA Derived Weight (%)Weighted Performance (PCA Weight (%) × Indicator Performance)GAPI Score (Sum of Weighted Performances)
ANTI37155.642
BOD728.33.7
CAP10055.1
COP2852.3
ECOE66159.8
ESC478.33.9
FEED118.31.6
INDE60155
PARA8454.3
PATH3150.5
Note: First, the performer’s environmental performance within each indicator (Columns A and B) is determined by calculating the proximity-to-target for each normalized indicator and standardized on a scale of 0 (worst) to 100 (no impact) (Column C). The weight that each of these indicators contributes to the final score is then calculated using Principal Component Analysis (PCA) (Column D). The product of indicator performance (Column C) and PCA-derived weight, expressed as a percentage (Column D) yield the weighted indicator performance (Column E). The final GAPI score (Column F), which describes China's normalized tiger puffer fish aquaculture performance, is the sum of the 10 weighted performance scores in Column E.

2.2.8. Calculating the Final Country Score

The final score is the sum of the 10 criteria scores post-PCA weighted. GAPI reports two scores for each product: a normalized score and a cumulative score.
Normalized scores are standardized to reflect environmental performance per mT of production (Table 3). Normalized scores reflect the inherent production profile of that species and are not influenced by scale of production (as are cumulative scores). Because impacts are standardized per mT of production, policy relevant questions may be asked directly; How does a species produced in one country compare to other countries producing the same species? Which species score consistently poorly and which consistently well and why? What specific dimensions of performance can most immediately and cost effectively be improved and which jurisdictions may provide a template for doing so (based on their superior score)?
For instance, China scores particularly poorly in biological oxygen demand (BOD), ecological energy consumption (ECOE) and feed use (FEED) relative to other countries (Table 4). Resources are more likely to yield substantive performance improvement if targeted at one or more of these areas rather than escapes (ESC) or parasiticides (PARA), where China scores relatively well and therefore the scope for improvement is more modest. Normalized scores encourage policymakers to think about regulations that can improve the relative performance of the industry. They provide an “apples to apples” comparison against other industries or countries, regardless of their size.
Table 4. Criteria scores contributing to the overall normalized scores. Cell shading indicates criteria group; Inputs (none), Outputs (light) and Biological (dark) criteria.
SpeciesCountryOverall ScoreCAPECOEFEEDINDEANTIBODCOPPARAESCPATH
Atlantic CodNorway6210064685898592845063
Atlantic CodIceland 6910064685898922888087
Atlantic SalmonChile66100727562688128773867
Atlantic SalmonCanada70100747557906628993972
Atlantic SalmonUK72100667560966149534086
Atlantic SalmonNorway72100757564995028844078
BarramundiThailand4110039444038028403546
BarramundiIndonesia4610039444042942853557
BarramundiAustralia4710070650586228303524
BarramundiMalaysia5010039444077752803557
Bastard HalibutChina4110059346137392869490
Bastard HalibutKorea, 611005142238244100410057
Chinook SalmonChile64100757555689828644253
Chinook SalmonNew Zealand731007052431001002810047100
CobiaTaiwan35100051524742864160
CobiaChina371000515374228354160
Coho SalmonJapan56100686261136828793477
Coho SalmonChile63100717559689028643752
European SeabassTurkey61100597443506628815375
European SeabassSpain63100606947579331784975
European SeabassGreece66100617550815828814775
European SeabassItaly69100617231649764817475
Flathead Grey MulletEgypt71686799573279100814191
Gilthead SeabreamTurkey5510075695550662881544
Gilthead SeabreamGreece5610069796050492857556
Gilthead SeabreamSpain5710069725750903156856
Gilthead SeabreamIsrael60100678041506949773256
Gilthead SeabreamItaly65100678137509864815356
GroupersIndonesia100000085286323
GroupersChina15000037212847353
GroupersTaiwan2804145392458280353
Japanese AmberjackJapan459960395636028844332
Japanese SeabassChina325424182531428443557
Korean RockfishKorea5410055524082452804957
Lg Yellow CroakerChina41100233327313728894857
MilkfishPhillippines599878905769372804639
MilkfishIndonesia6898809061976728454639
Red DrumChina26100045372128493737
Red SeabreamChina25100000371128654432
Red SeabreamJapan4710059605236928724432
Tiger pufferJapan3910069116036802821473
Tiger pufferChina4210066116037722884473
TurbotSpain63100688344238251656173
TurbotFrance681006881445210051676173
Note: The higher the final score, the better the overall environmental performance.
In contrast, cumulative scores are not expressed per unit production but instead are weighted by total production to reflect the total aggregate effect of that production along that country’s coastline. Cumulative scores look at the aggregate effect of an industry: i.e., what is the overall impact of a country’s aquaculture industry? Cumulative performance is rarely if ever reported however it is this perspective that confronts policymakers with important questions of industry scale and carrying capacity.
Both normalized and cumulative measures are important. To use an analogy from climate change, CO2 emissions have a minor impact on a normalized basis compared to methane (a mT of methane is orders of magnitude more damaging than a mT of CO2). However, the magnitude of CO2 emissions have an earth-changing cumulative impact. As a consequence, governments are attempting to address emissions of both gases. In simplest terms, normalized scores are most relevant for industry while cumulative scores are the only relevant metrics from an ecological perspective (ecological processes do not recognize performance per mT, only cumulative performance).

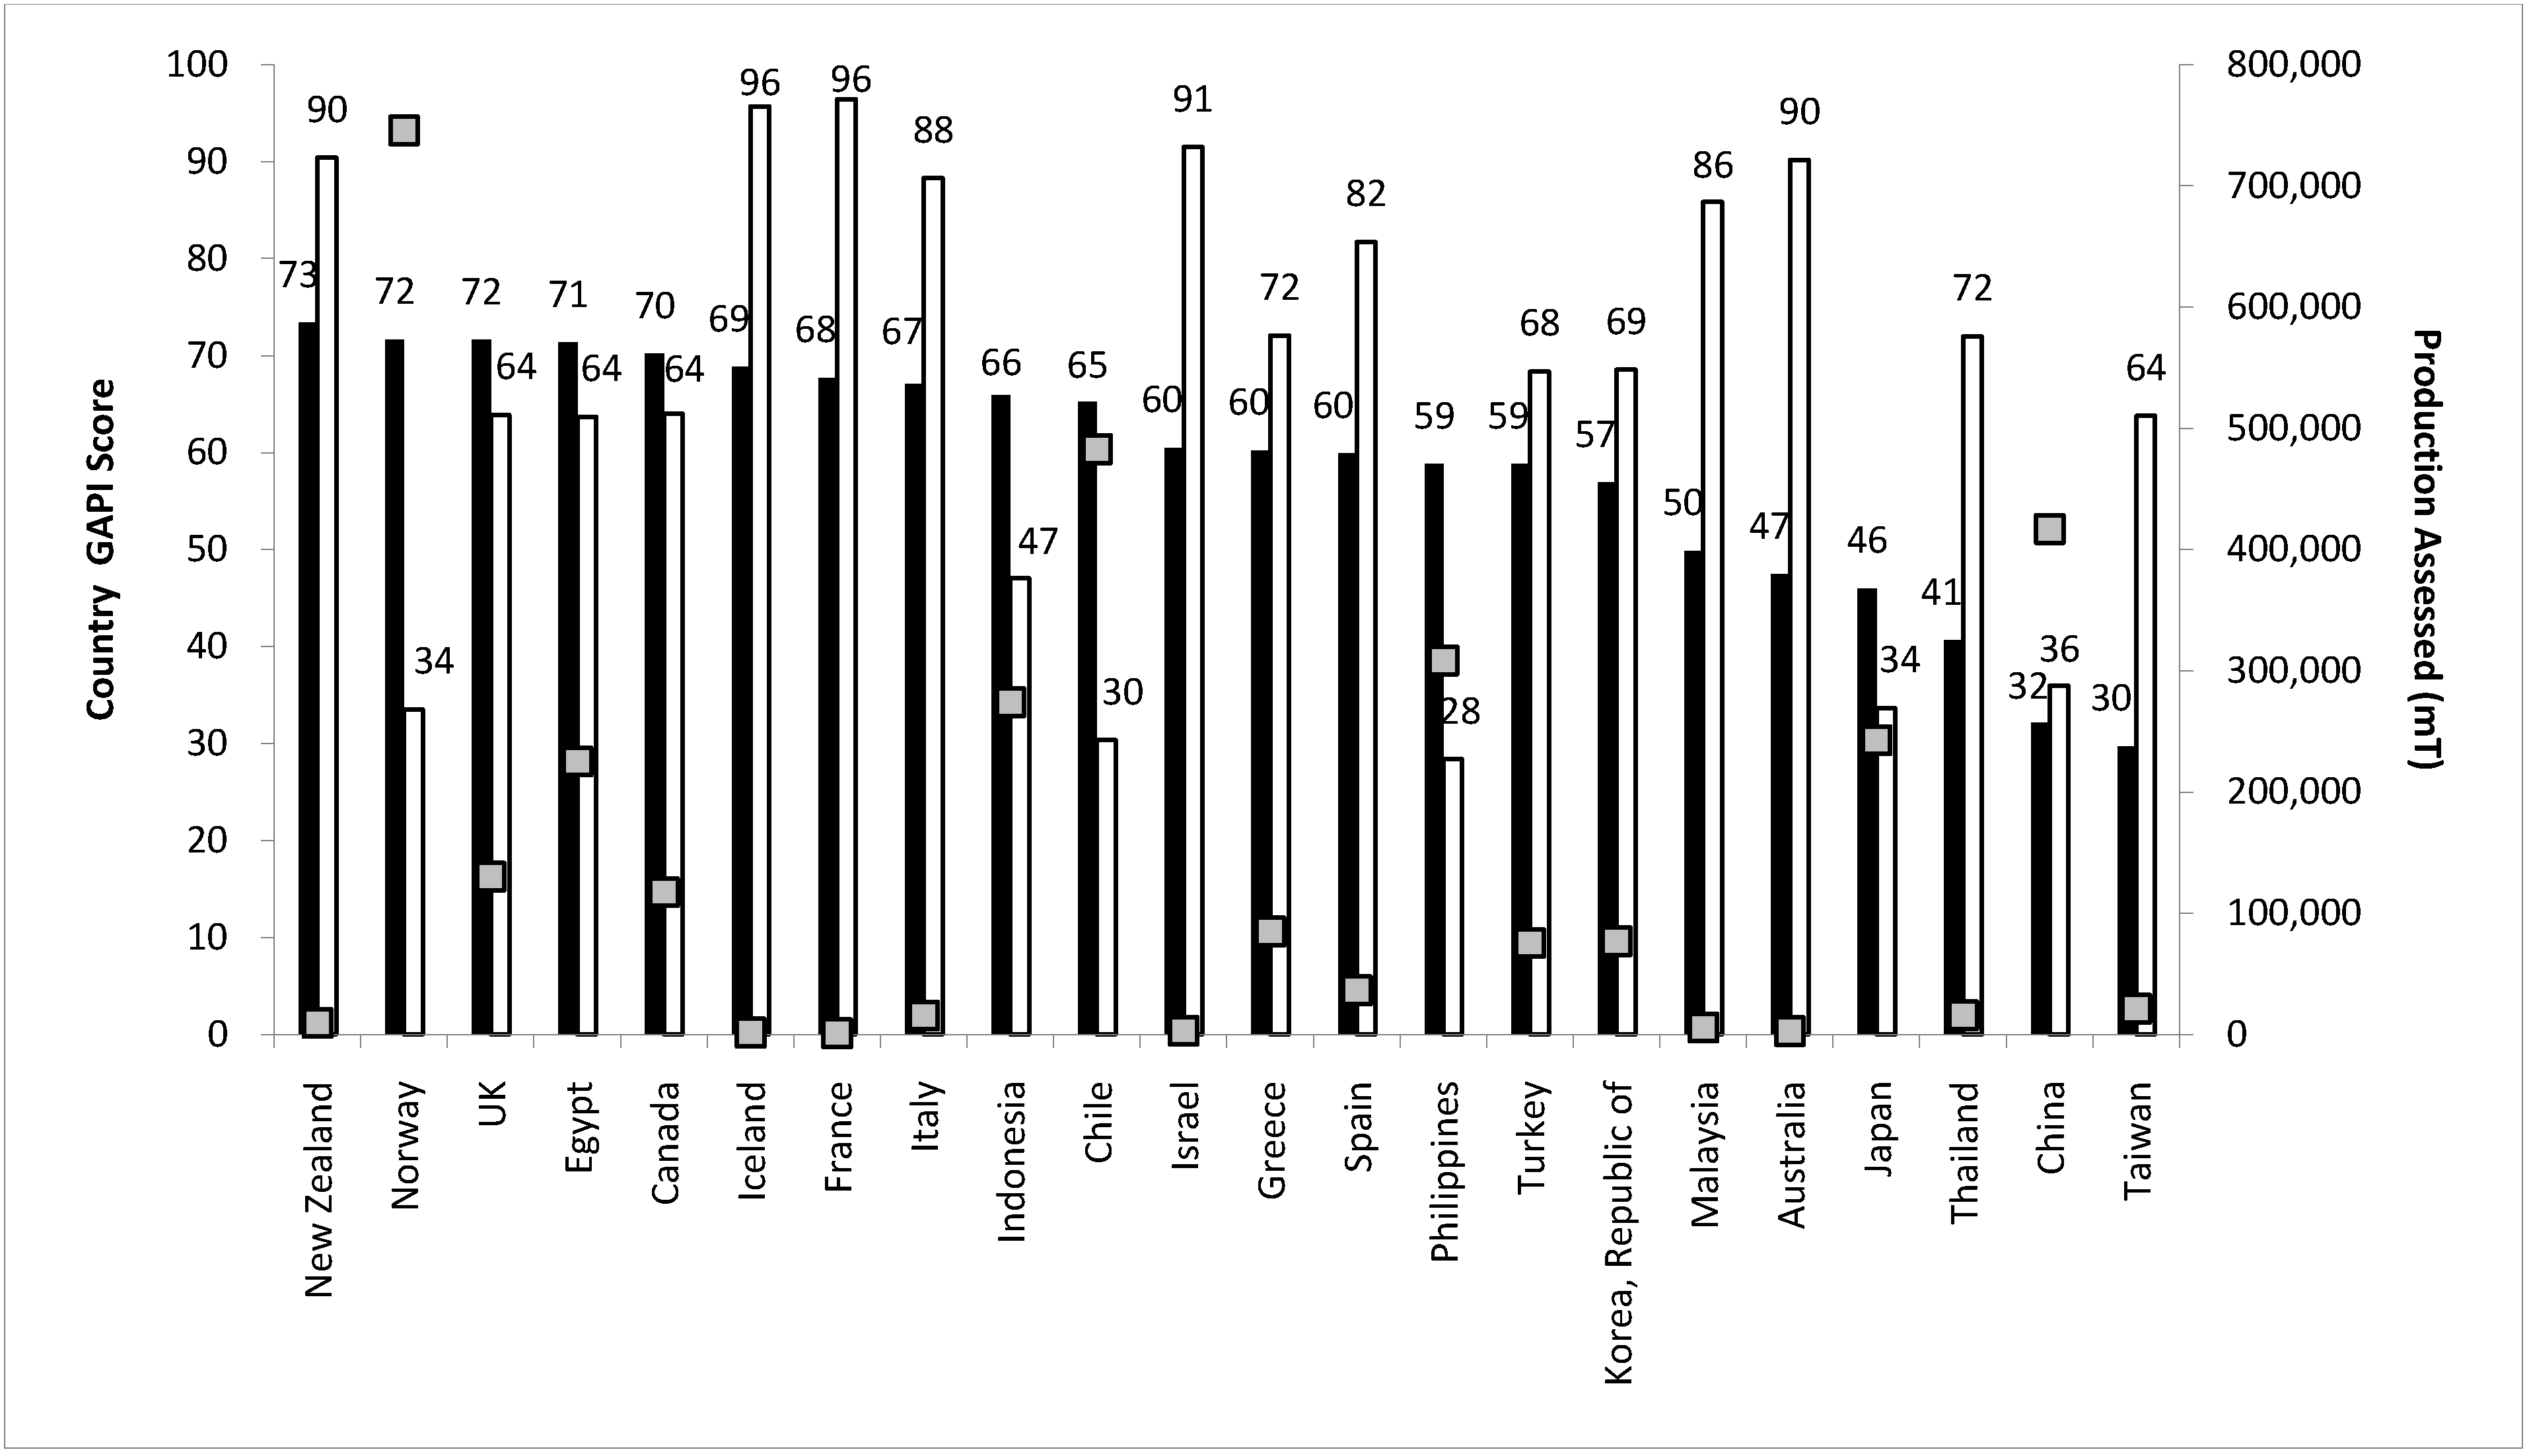
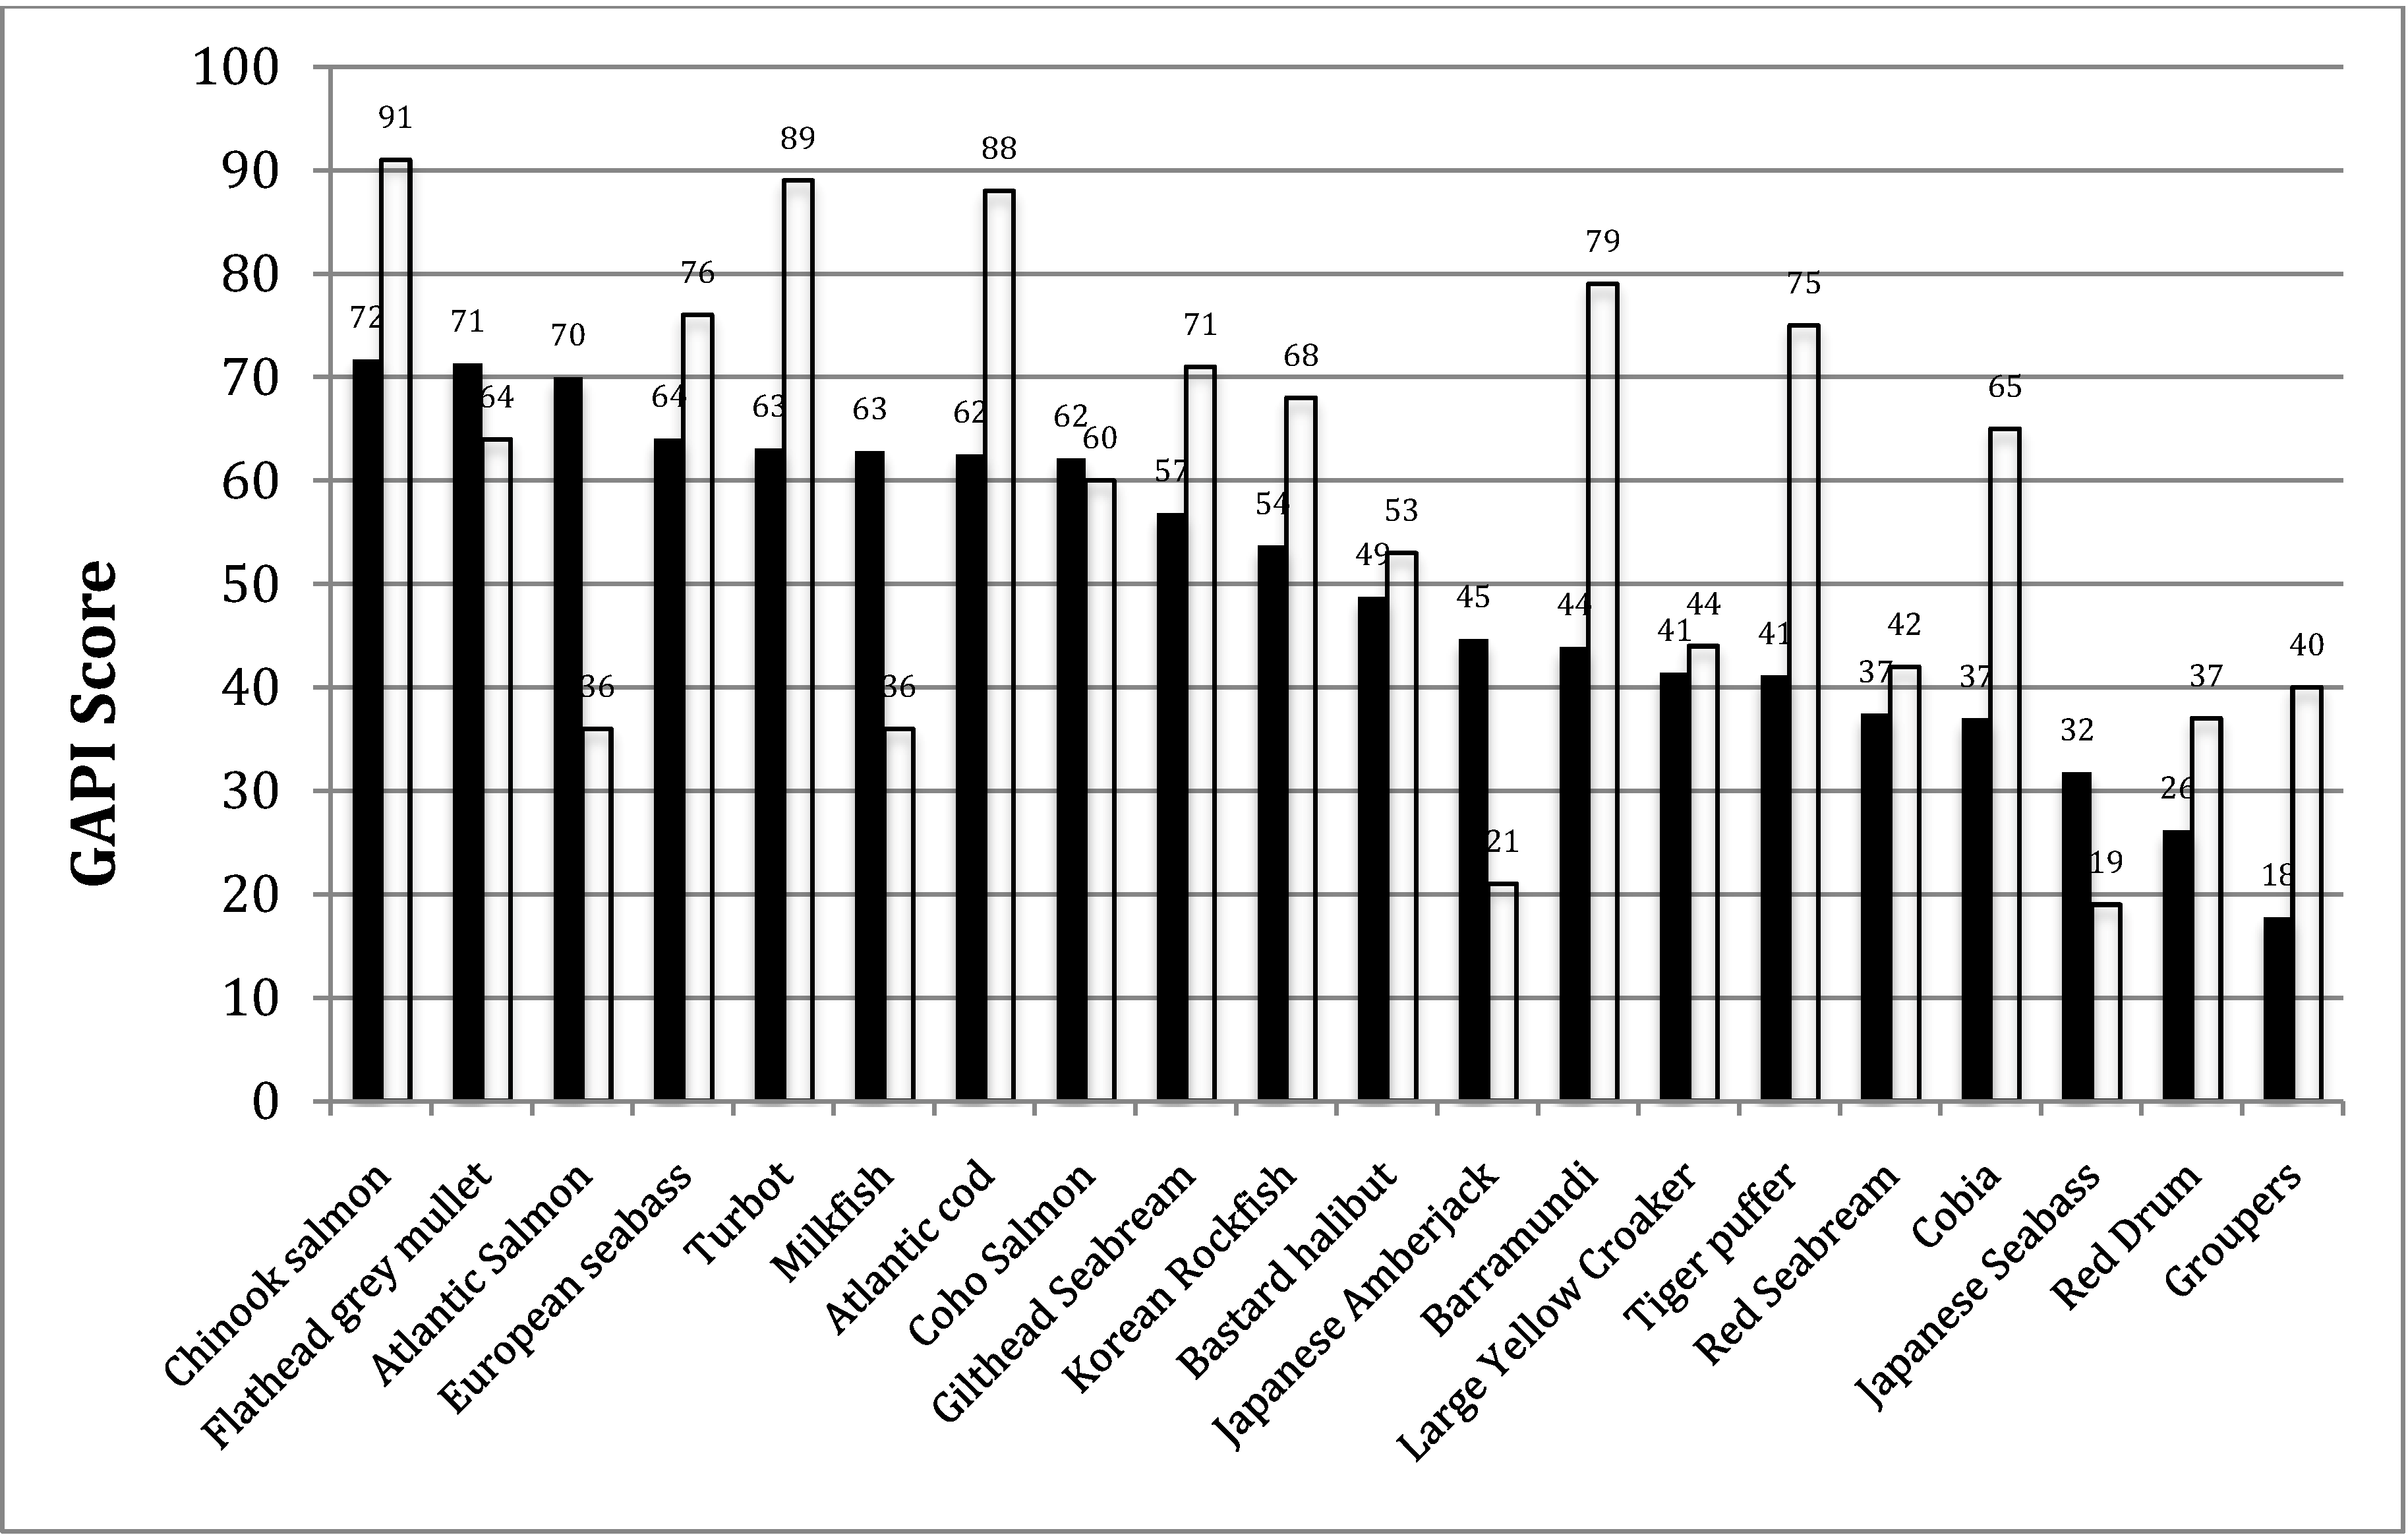
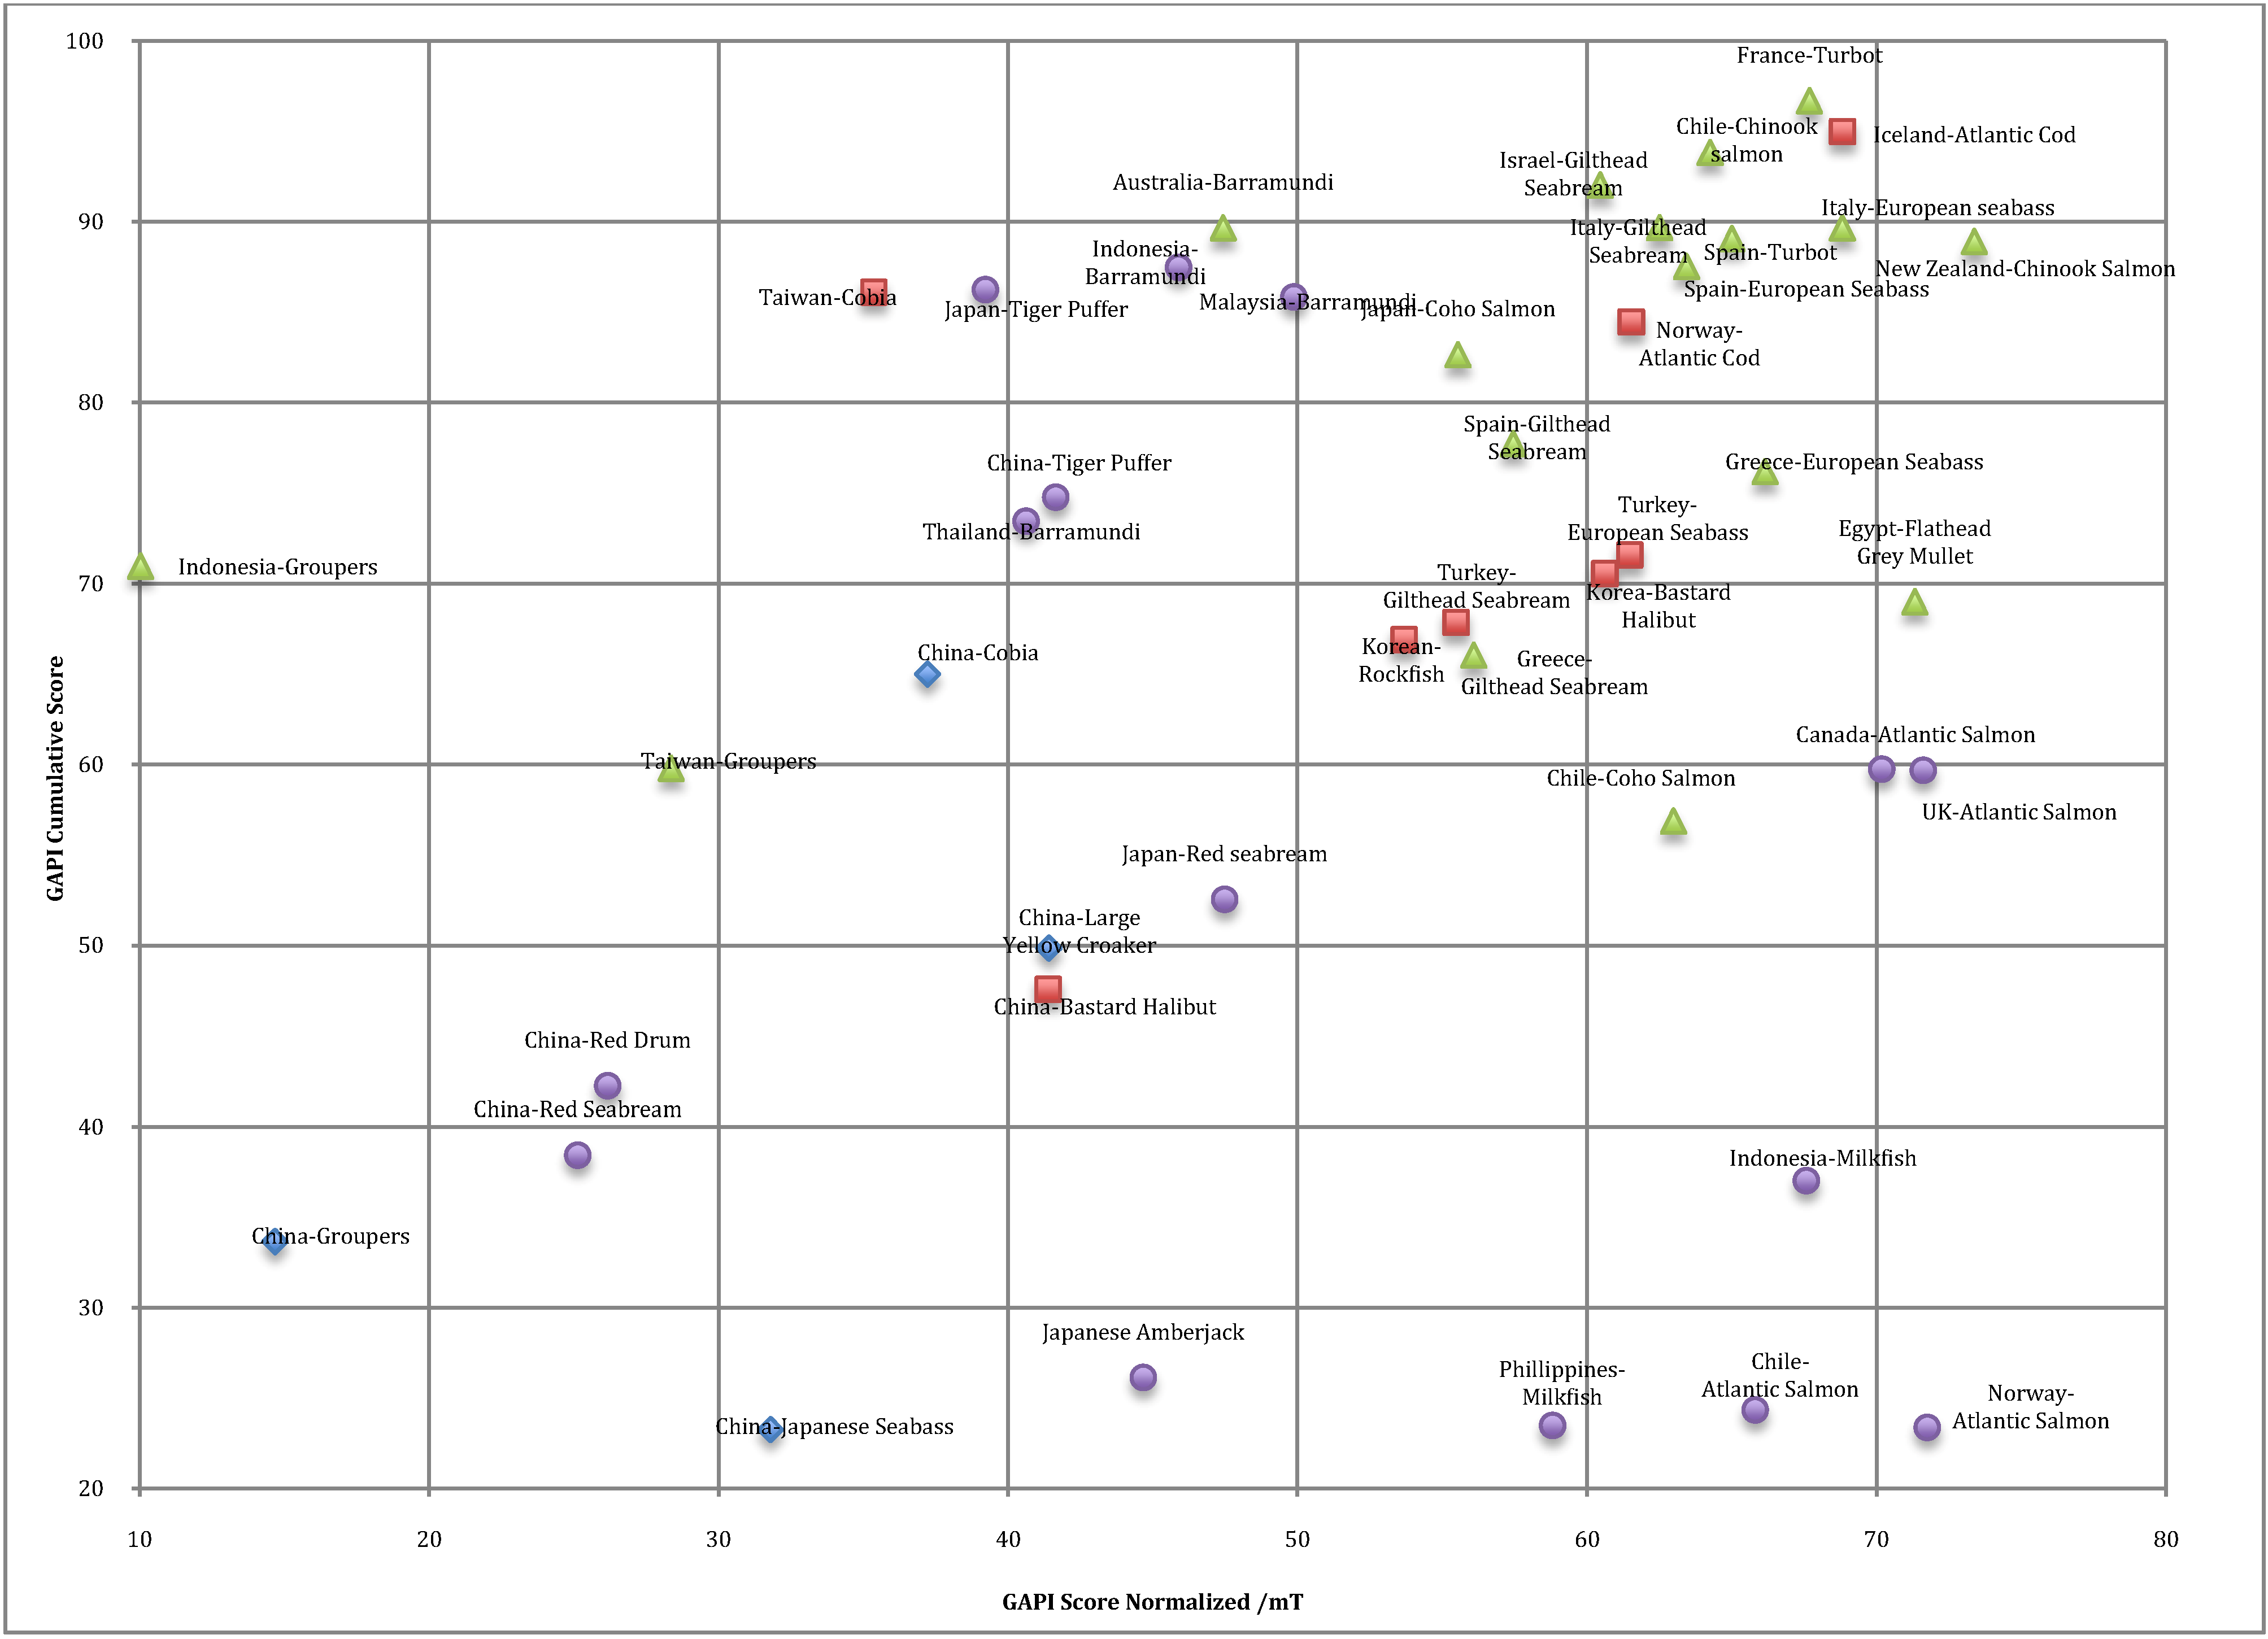
3. Results and Discussion

Sustainability must be demonstrated not assumed. Data availability and quality remain preeminent challenges to any assessment of seafood sustainability. However, verification of the sustainability of any production system requires that abundant, high-quality data are available for analysis. We found data deficiencies to be particularly challenging in the traceability of feedstocks, feed formulation, and the cumulative ecosystem effects of both chemical use and escapes. Currently, determinants of sustainability are typically informed by spotty qualitative data leading to questionable conclusions that may reflect vested interests more than actual performance. The long-term ecological and economic viability of the aquaculture industry depends on shifting policy and production decisions toward quantitatively rigorous, performance-based regulatory frameworks such as GAPI.
Not all marine finfish aquaculture is the same. While it might be reasonable to assume significant performance differences across drastically different types of aquaculture such as shellfish farming and marine finfish farming, GAPI scores reveal tremendous variation in environmental performance just within the marine finfish sector (Figure 1 and Figure 2). These variations are highlighted in species-country pair scores, country scores, and species scores. For instance, normalized species-country scores range from a low of 10 (groupers – Indonesia) to a high of 73 (Chinook salmon - New Zealand).
Figure 1. Weighted mean country performance expressed as normalized GAPI scores.
Sustainability 05 03976 g001
Note: GAPI score per mT production in solid bars; cumulative GAPI scores (score for total production, open bars). Boxes express total production (mT) assessed.
Figure 2. Weighted mean species performance expressed as normalized GAPI scores (performance per mT production; black bars) and cumulative GAPI scores (performance of total global production; open bars). Species arranged by decreasing normalized score.
Sustainability 05 03976 g002
There remains substantial room for improvement. While there is strong variation in GAPI scores across countries and species, and while GAPI does not define pass or failure scores, the findings strongly suggest there is room for improvement within the entire marine finfish sector. Even the best performers are approximately 30 points away from the aspirational target performance of 100. As aquaculture expands, attention should be paid to ensure that, at a minimum, the industry does not shift further towards the poor performers, at least until performance improve significantly. The worst performing sectors of the industry are also the fastest growing. Marine finfish farmed in tropical and subtropical water, such as groupers (normalized score, 18) red drum (normalized score, 26), and cobia (normalized score, 37), have some of the worst scores on both and normalized and cumulative scales (Figure 3), yet production of these species is currently growing at a rate that outpaces all other species worldwide. Low final scores reflect poor performance across indicators rather than isolated to a few problem areas. In particular, warm water species consume large quantities of feed and receive large amounts of antibiotics, often used prophylactically to mitigate questionable production conditions. We estimate that as much as 5.5 million Kg of antibiotic materials (bioactive ingredient only, excludes non-active components) may be used annually. This material, much of which is discharged directly to the marine environment, is comprised almost exclusively of compounds classified as “critical” for human and/or veterinary treatment. Indiscriminant and wide-spread use of antibiotics as described here has long been known to critically threaten efficacy of human theraputants. How such threats may be affected by release of active ingredients into the marine food web is unknown [10].
Performance scores only tell some of the story. While the overall GAPI scores are informative, of even greater interest are the differential performances within each indicator that comprise the final score (Table 4). While the overall GAPI scores reflect aggregated performance trends, individual indicators highlight areas where a particular production system may excel and where improvement may be possible. For instance, turbot from Spain and coho salmon from Chile have divergent performance profiles but both have a normalized score of 63. The turbot scores poorly for antibiotic use (23), only one third the score of coho (68). In contrast, the coho performs poorly with respect to escapes (37) compared to the turbot (61). Similarly, barramundi from Australia and red seabream from Japan both have a normalized species score of 47. Barramundi scores poorly for parasiticides use (30) compared to the red seabream (72). Conversely, the red seabream performs poorly for biological oxygen demand (9), while the barramundi scores reasonably well (62). A key contribution of GAPI (and similarly designed indices) is the capacity to expose root causes inferior performance. In so doing it makes clear that prescriptive solutions such as reduction of parasiticide use will yield far greater benefit for barramundi than red sea bream - where biological oxygen demand is the low hanging fruit in terms of return on investment.
Asia faces significant sustainability hurdles. Asian countries account for the 15 lowest species-country scores (Figure 3). The trend towards lower normalized scores in Asian countries largely results from the prevalence of poor Inputs performance such as ecological and industrial energies, feed sustainability, and biological oxygen demand. Asian countries also tend to score poorly in the antibiotics and parasiticide indicators as GAPI assumes that performers use the maximum allowable dose or quantity in the absence of actual performance data. Given that Asia is and will continue to be the epicenter of aquaculture growth, the observed performance trends should serve as clear warning.
Figure 3. Final normalized scores plotted against final cumulative scores where products are discriminated by age.
Sustainability 05 03976 g003
Note: Products in the lower left quadrant are the worst performers on both scales. Products here tend to youngest (0–5 years: blue triangles; 6–20 years: red squares) After 20 years a product is of intermediate age and shows improvement in both normalized and cumulative performance (green triangle). With greater age, gained efficiencies of production drive more production such that the eldest industries (<20 years) are found in the lower right quadrant characterized by the highest normalized scores but among the worst cumulative scores (purple circles).
Atlantic salmon performance illustrates that scale is everything. Comparison of cumulative and normalized scores demonstrates sheer scale of production can have drastic effects on environmental performance. Some of the best-performing species on a normalized basis are among the worst on a cumulative basis (Figure 3 and Table 5). For example, Atlantic salmon is the third-highest ranking species on a per mT basis (normalized score, 70), but when production volume is taken into account, Atlantic salmon score drops almost 50% to third worst of the 20 assessed species. In contrast, cobia has one of the biggest environmental footprints of any marine finfish (normalized score, 37) and among the worst performers on a per mT basis. However, because cobia farming is currently a modest sized industry it has a relatively small cumulative impact (cumulative score, 65) compared to production leaders Atlantic salmon and milkfish. In other words, there is a tipping point when production efficiencies no longer yield superior environmental performance and can indeed drive performance decline. This raises a question at the heart of seafood sustainability: How do we expand aquaculture to support the food and protein needs of 9 billion humans without overwhelming the carrying capacity of the marine environment? Clearly, part of the answer lies in selecting the right species, choosing the right environments in which to grow them, and utilizing responsible farming practices. At the same time, regulators need to consider the double-edged nature of production efficiency and how such efficiency, regarded as an industry objective, can lead to unanticipated problems. When normalized performance is plotted as a function of cumulative performance an inverted horseshoe pattern emerges (Figure 3). The left terminus of the horseshoe (poor normalized and cumulative scores) are the youngest products still in the “trial and error” phase of development. The right terminus is comprised of the oldest players, those products that enjoy high normalized performance and as a result have proliferated greatly resulting in large scale production and decline cumulative scores. The belly of the horseshoe (intermediate normalized and cumulative scores) are intermediate aged players that have found some production success but have yet to leverage that into large scale production. Policy decisions informed solely by normalized performances are likely to perpetuate this trend. However it is important to reiterate that normalized performance is irrelevant to the environment. The only environmentally relevant metric is cumulative performance.
Table 5. The ranking of country-species pairs by normalized and cumulative scores.
Country-SpeciesNormalizedCumulative% Global MarineDifference
RankGAPI scoreRankGAPI scoreFinfish ProductionCum-Norm
New Zealand-Chinook salmon1735900.2717
Norway-Atlantic Salmon272383321.00−39
UK-Atlantic Salmon37228643.70−8
Egypt-Flathead grey mullet47129646.41−8
Canada-Atlantic Salmon57027643.30−6
Iceland -Atlantic cod6692960.0427
Italy-European seabass7697890.2420
France-Turbot8681960.0229
Indonesia-Milkfish96834467.49−22
Greece-European seabass106617771.0011
Chile-Atlantic Salmon1166422310.80−43
Italy-Gilthead Seabream12659880.2023
Chile-Chinook salmon13643940.0630
Spain-European seabass146310870.2624
Chile-Coho Salmon156332572.90−6
Spain-Turbot16638880.1926
Norway-Atlantic cod176211870.2725
Turkey-European seabass186121701.199
Korea-Bastard halibut196122691.178
Israel-Gilthead Seabream20604910.0831
Phillippines-Milkfish215941288.78−30
Spain-Gilthead Seabream225718770.5820
Greece-Gilthead Seabream235623681.4212
Japan-Coho Salmon245616800.3825
Turkey-Gilthead Seabream255526660.9510
Korea-Korean Rockfish265424681.0115
Malaysia-Barramundi275013860.1636
Japan-Red seabream284733501.912
Australia-Barramundi29476900.0743
Indonesia-Barramundi304612860.1341
Japan-Japanese Amberjack314543214.49−23
China-Tiger puffer324219720.4331
China-Large Yellow Croaker334135441.762
China-Bastard halibut344136431.891
Thailand-Barramundi354120720.4531
Japan-Tiger puffer363914850.1246
China-Cobia373730620.7424
Taiwan-Cobia383515840.1149
China-Japanese Seabass393244192.86−13
Taiwan-Groupers402831590.4931
China-Red Drum412637371.4010
China-Red Seabream422539331.568
China-Groupers431540291.2214
Indonesia-Groupers441025680.1858
Note: The differential is most pronounced in those with the greatest or least production. The far right column highlights the importance of how assessments are carried out; some of the best-performing species on a normalized basis are among the worst on a cumulative basis.

4. Conclusions

The GAPI analysis allows us to identify why products score poorly, suggest how their peers have addressed the same challenges and provide insight in policy-relevant contexts ready for decision makers to take action. These initial results beg the question: how does aquaculture grow in a way that both supports the global food industry and mitigates local environmental damage? Part of the answer lies in carefully selecting which species we will farm and in choosing the right environments in which to grow them (i.e., reducing normalized scores). At the same time, regulators need to consider the carrying capacity of local waters, and begin to design and reward operations that demonstrably minimize environmental footprint. Time is of the essence, however. The most current production data available (2011) reveal global marine aquaculture grew 22% [11] during the brief life of this project which began in 2009. The qualitative profile of production has remained constant over this period; both relative ranking of species and production countries have remained stable however the overall scale of production continues to rise rapidly. Therefore, while many of the revelations revealed by the GAPI project are sobering, this current analysis should be interpreted as a conservative snapshot of current industry performance.
GAPI is a work in progress and is intended to both inform and stimulate discussion of the appropriate metrics for evaluating performance and to drive the gathering and sharing of data. We are hopeful that GAPI will transform the way environmental performance is assessed and will aid decision makers—policymakers, producers, buyers, or standard setters—as they continue to address the promise and challenges of marine aquaculture.

Acknowledgments

This work was financially supported by the Lenfest Oceans Program and Pew Environmental Trusts and came to fruition through the dedication and leadership of Chris Mann and Rachel Hopkins. We recognize the EPI research group for initial inspiration of this work. We thank Katherine Bostick, Peter Bridson, Carrie Brownstein, Alice Chiu, Matthew Elliot, Rebecca Goldburg, George Leonard, Corey Peet, and Helene York for their many contributions to the development of the GAPI approach and resultant tool. We thank Vicki Blazer, Claude Boyd, Alejandro Bushmann, Alex de Sherbinin, Daniel Esty, Jennifer Ford, Christine Kim, Kevin Lafferty, Astrid Sholtz, Tanja Srebotnjak, Peter Tyedmers, and Judith Weis for their thoughtful contributions and advice in building criteria-specific assessment modules.

Supplementary Materials

Appendices can be accessed at: https://www.mdpi.com/2071-1050/5/9/3976/s1.
Raw data and additional analyses can be accessed at: Global Aquaculture Performance Index (http://web.uvic.ca/~gapi/).

Conflicts of Interest

The authors declare no conflict of interest.

References

  1. Food and Agriculture Organization (FAO), The State of World Fisheries and Aquaculture 2002; FAO Fisheries Department: Rome, Italy, 2003.
  2. Hall, S.J.; Delaporte, A.; Phillips, M.J.; Beveridge, M.; O’Keefe, M. Blue Frontiers: Managing the Environmental Costs of Aquaculture; The WorldFish Center: Penang, Malaysia, 2011. [Google Scholar]
  3. Scottish Executive Research Unit, Review and Synthesis of the Environmental Impacts of Aquaculture; Government of Scotland: Edinburgh, Scotland, 2002.
  4. Phillips, S. Environmental Impacts of Marine Aquaculture Issue Paper; Pacific States Marine Fisheries Commission: Portland, OR, USA, 2005. [Google Scholar]
  5. Jacquet, J.; Hocevar, J.; Lai, S.; Majluf, P.; Pelletier, N.; Pitcher, T.; Sala, E.; Sumaila, R.; Pauly, D. Conserving wild fish in a sea of market-based efforts. Orynx 2009, 44, 45–56. [Google Scholar]
  6. Emerson, J.W.; Hsu, A.; Levy, M.A.; de Sherbinin, A.; Mara, V.; Esty, D.C.; Jaiteh, M. Environmental Performance Index and Pilot Trend Environmental Performance Index; Yale Center for Environmental Law and Policy: New Haven, CT, USA, 2012. [Google Scholar]
  7. Food and Agriculture Organization (FAO). FishStat Plus: Universal Software for Fishery Statistical Time Series; FAO: Rome, Italy. Available online: http://www.fao.org/fishery/statistics/software/fishstat/en (accessed on 15 November 2010).
  8. Emerson, J.; Esty, D.; Levy, M.; Kim, C.; Mara, V.; de Sherbinin, A.; Srebotnjak, T. Environmental Performance Index; Yale Center for Environmental Law and Policy: New Haven, CT, USA, 2010. [Google Scholar]
  9. Singh, R.; Murty, H.; Gupta, S.; Dikshit, A. An overview of sustainability assessment methodologies. Ecol. Indicat. 2009, 9, 189–212. [Google Scholar]
  10. Cabello, F. Heavy use of prophylactic antibiotics in aquaculture: A growing problem for human and animal health and for the environment. Environ. Microbiol. 2006, 8, 1137–1144. [Google Scholar] [CrossRef]
  11. Food and Agriculture Organization (FAO)-FIGIS. Available online: http://www.fao.org/fishery/figis/en (accessed on 2 May 2010).

