Scenario-Based Analysis on Water Resources Implication of Coal Power in Western China

Abstract
:1. Introduction
2. Literature Review and Research Background
2.1. Energy-Water Nexus
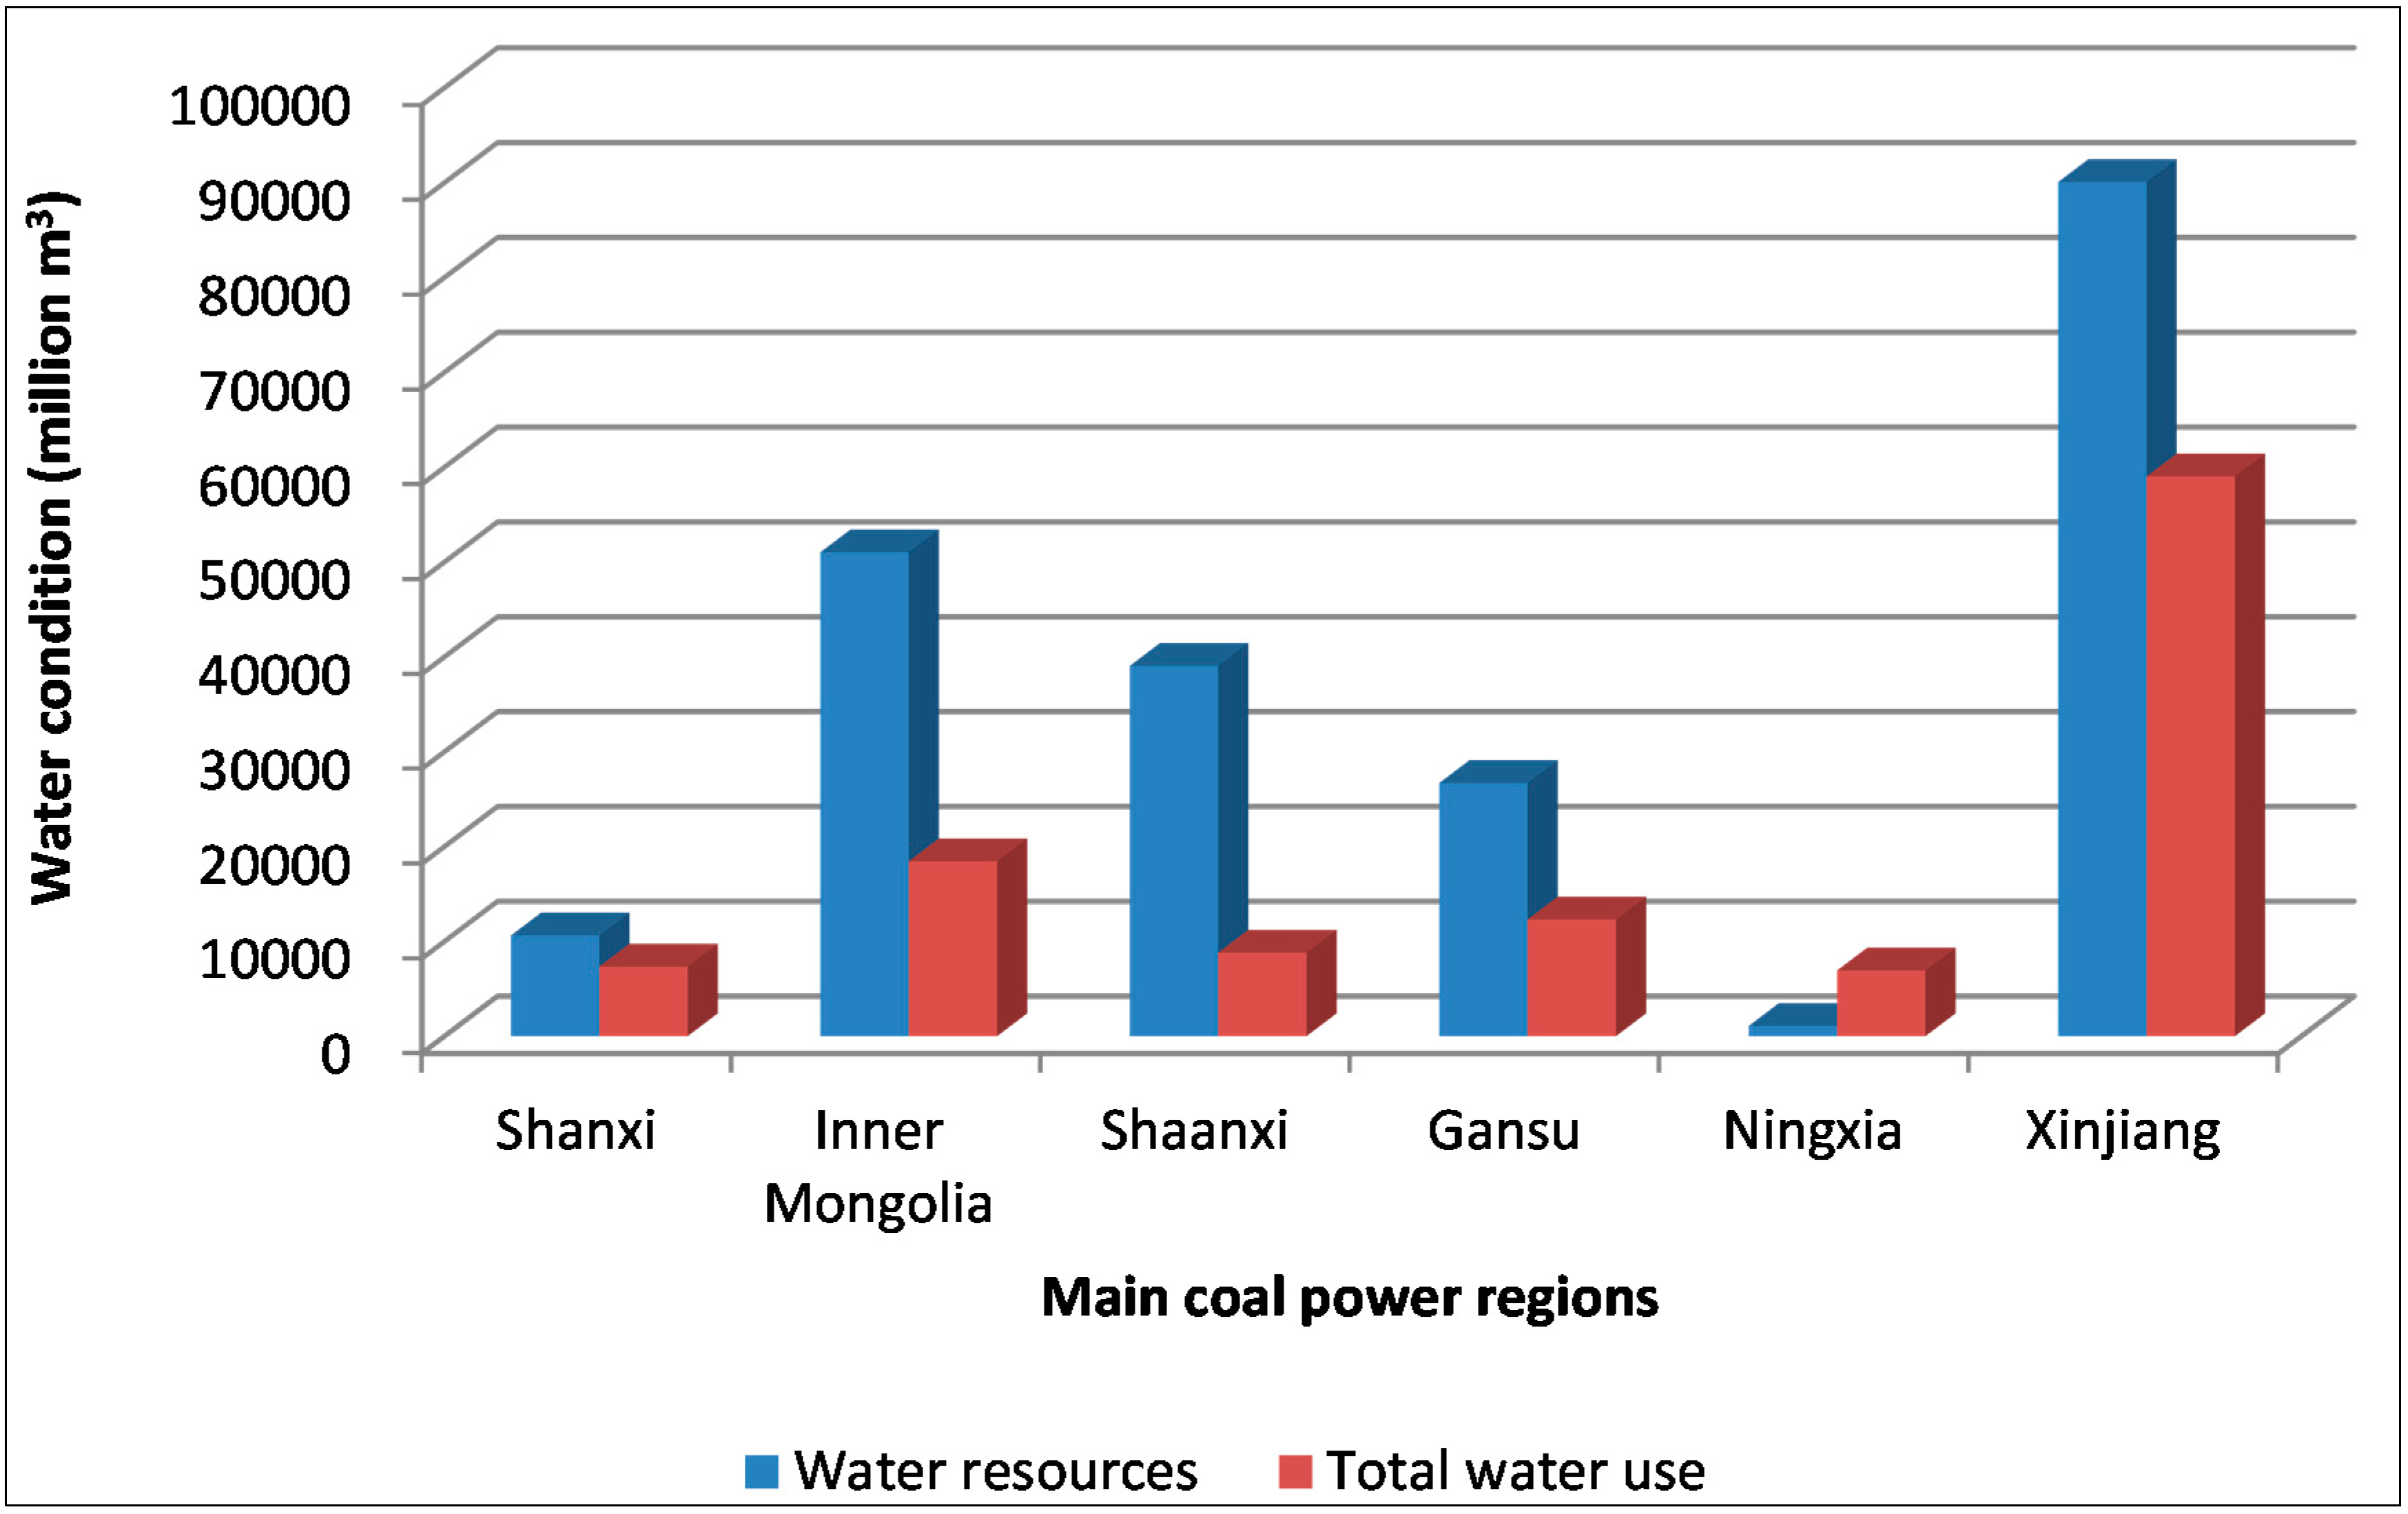
2.2. Water Resources in China’s Western Coal Power Base Provinces

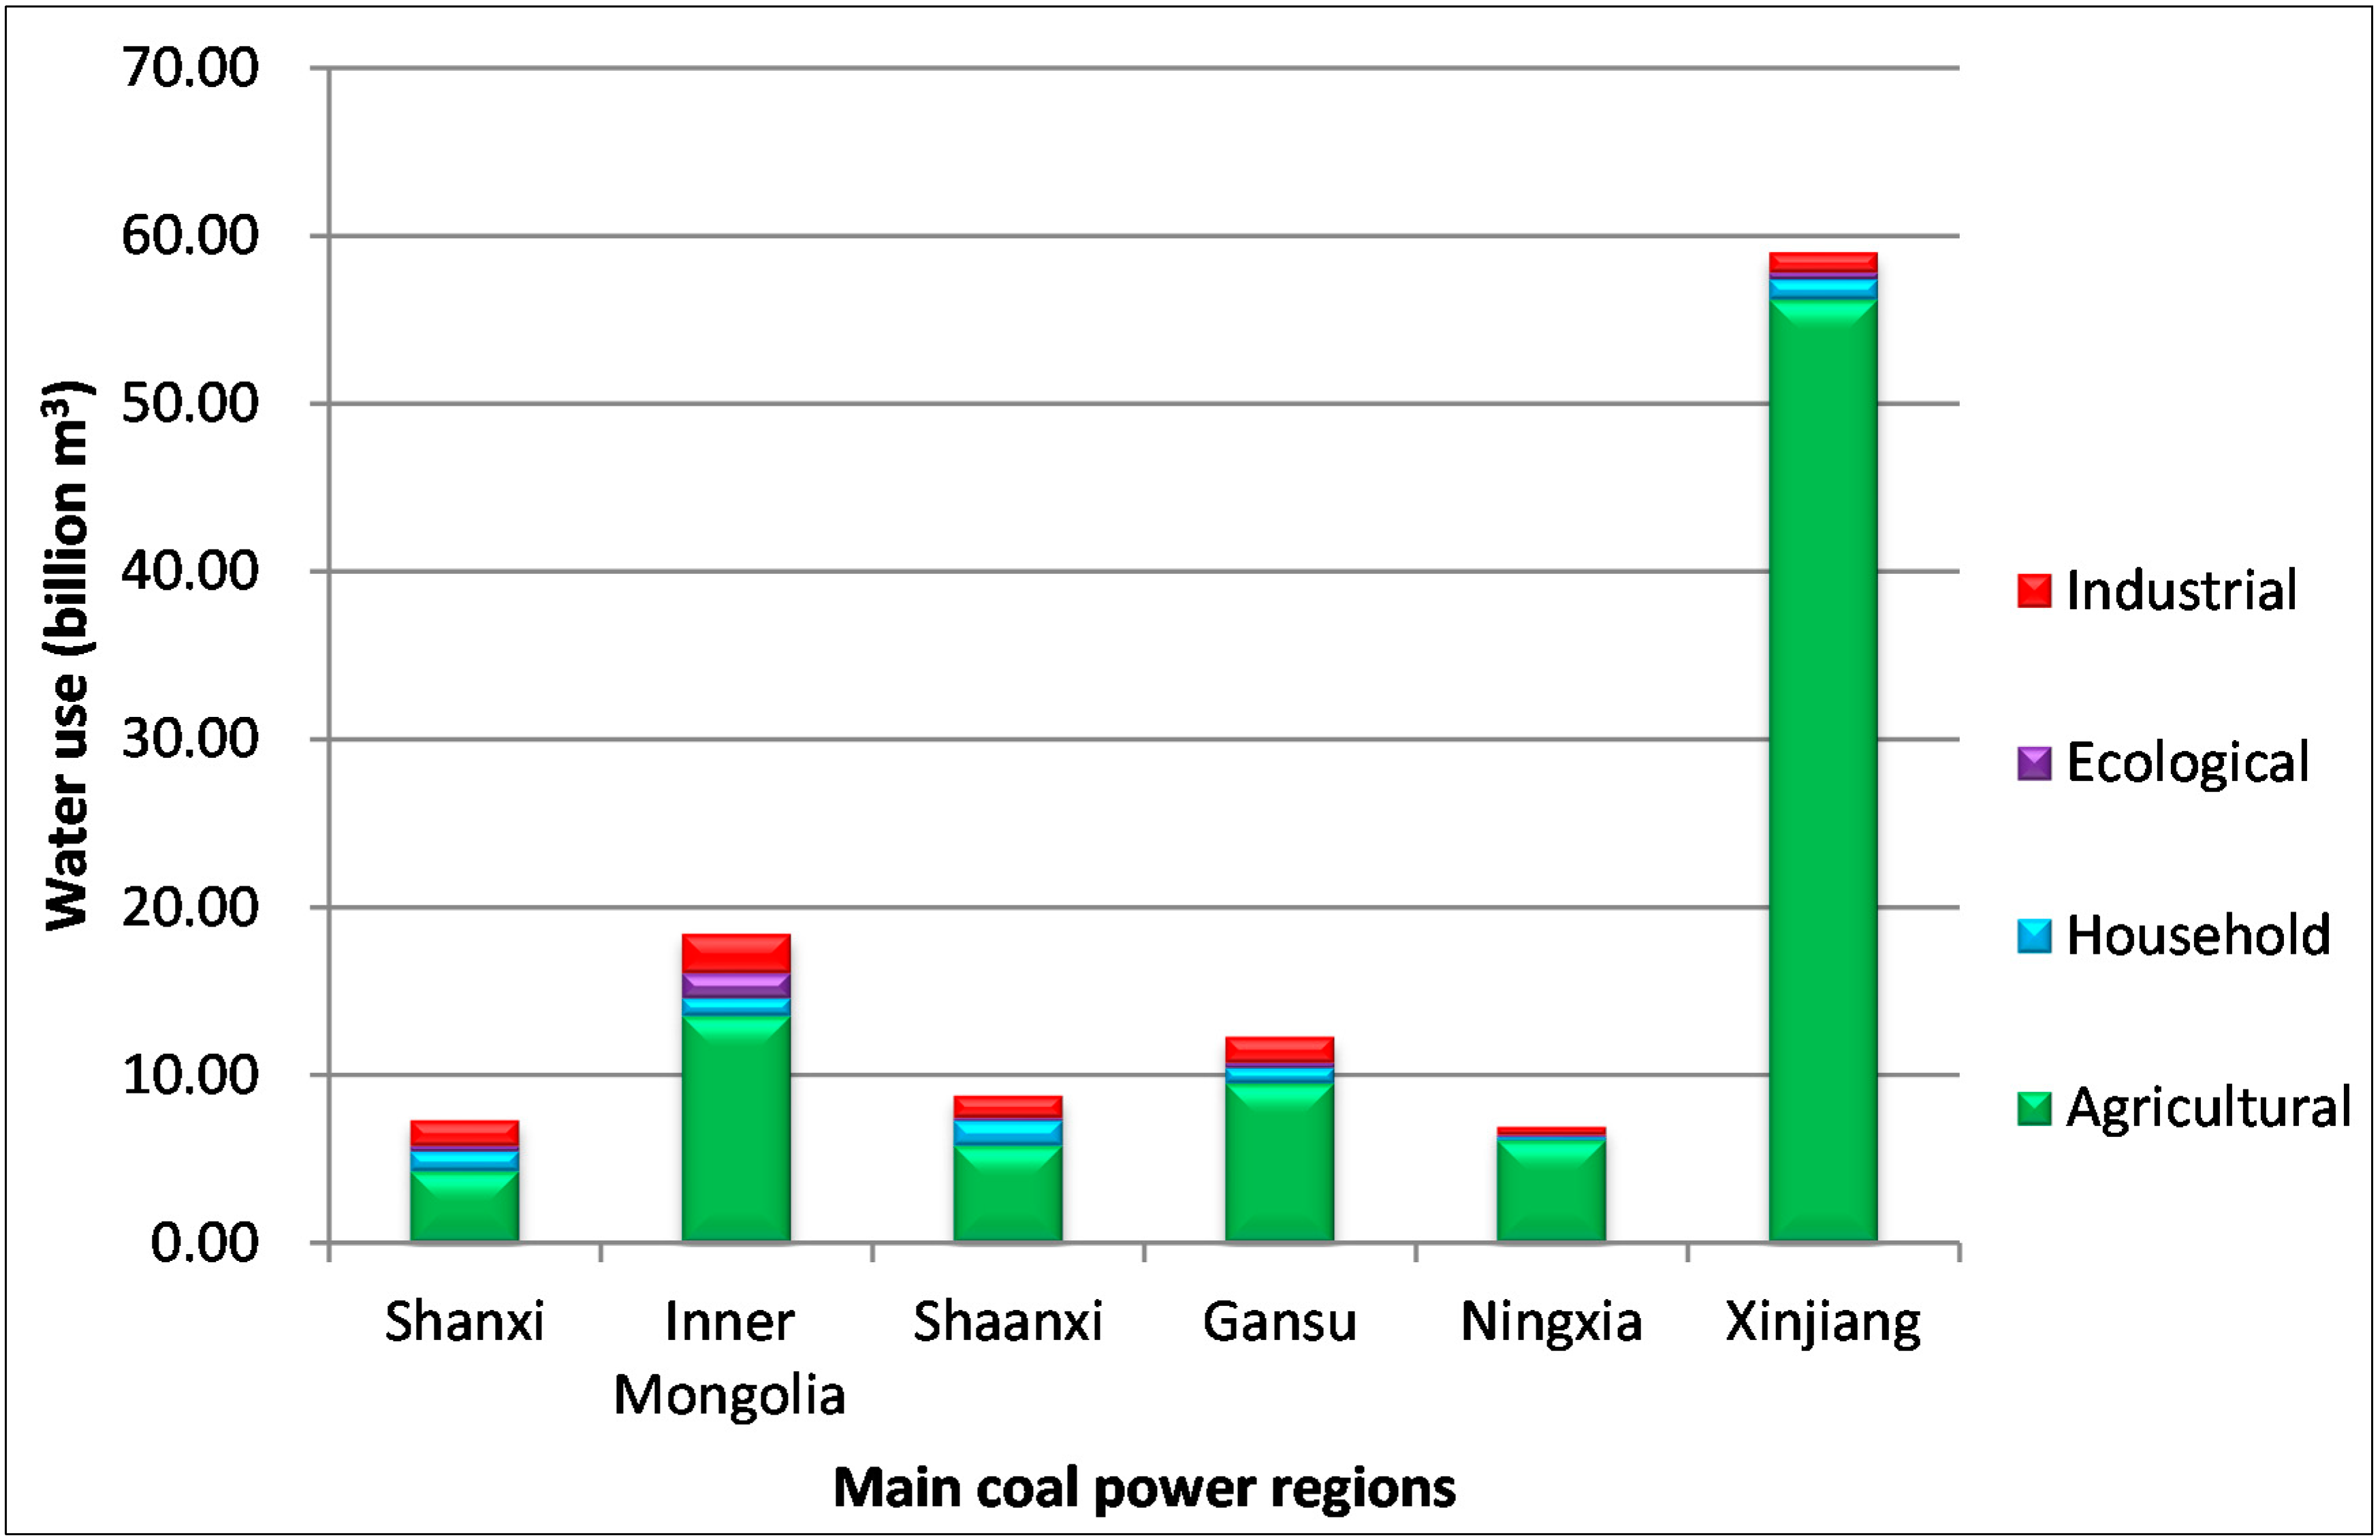
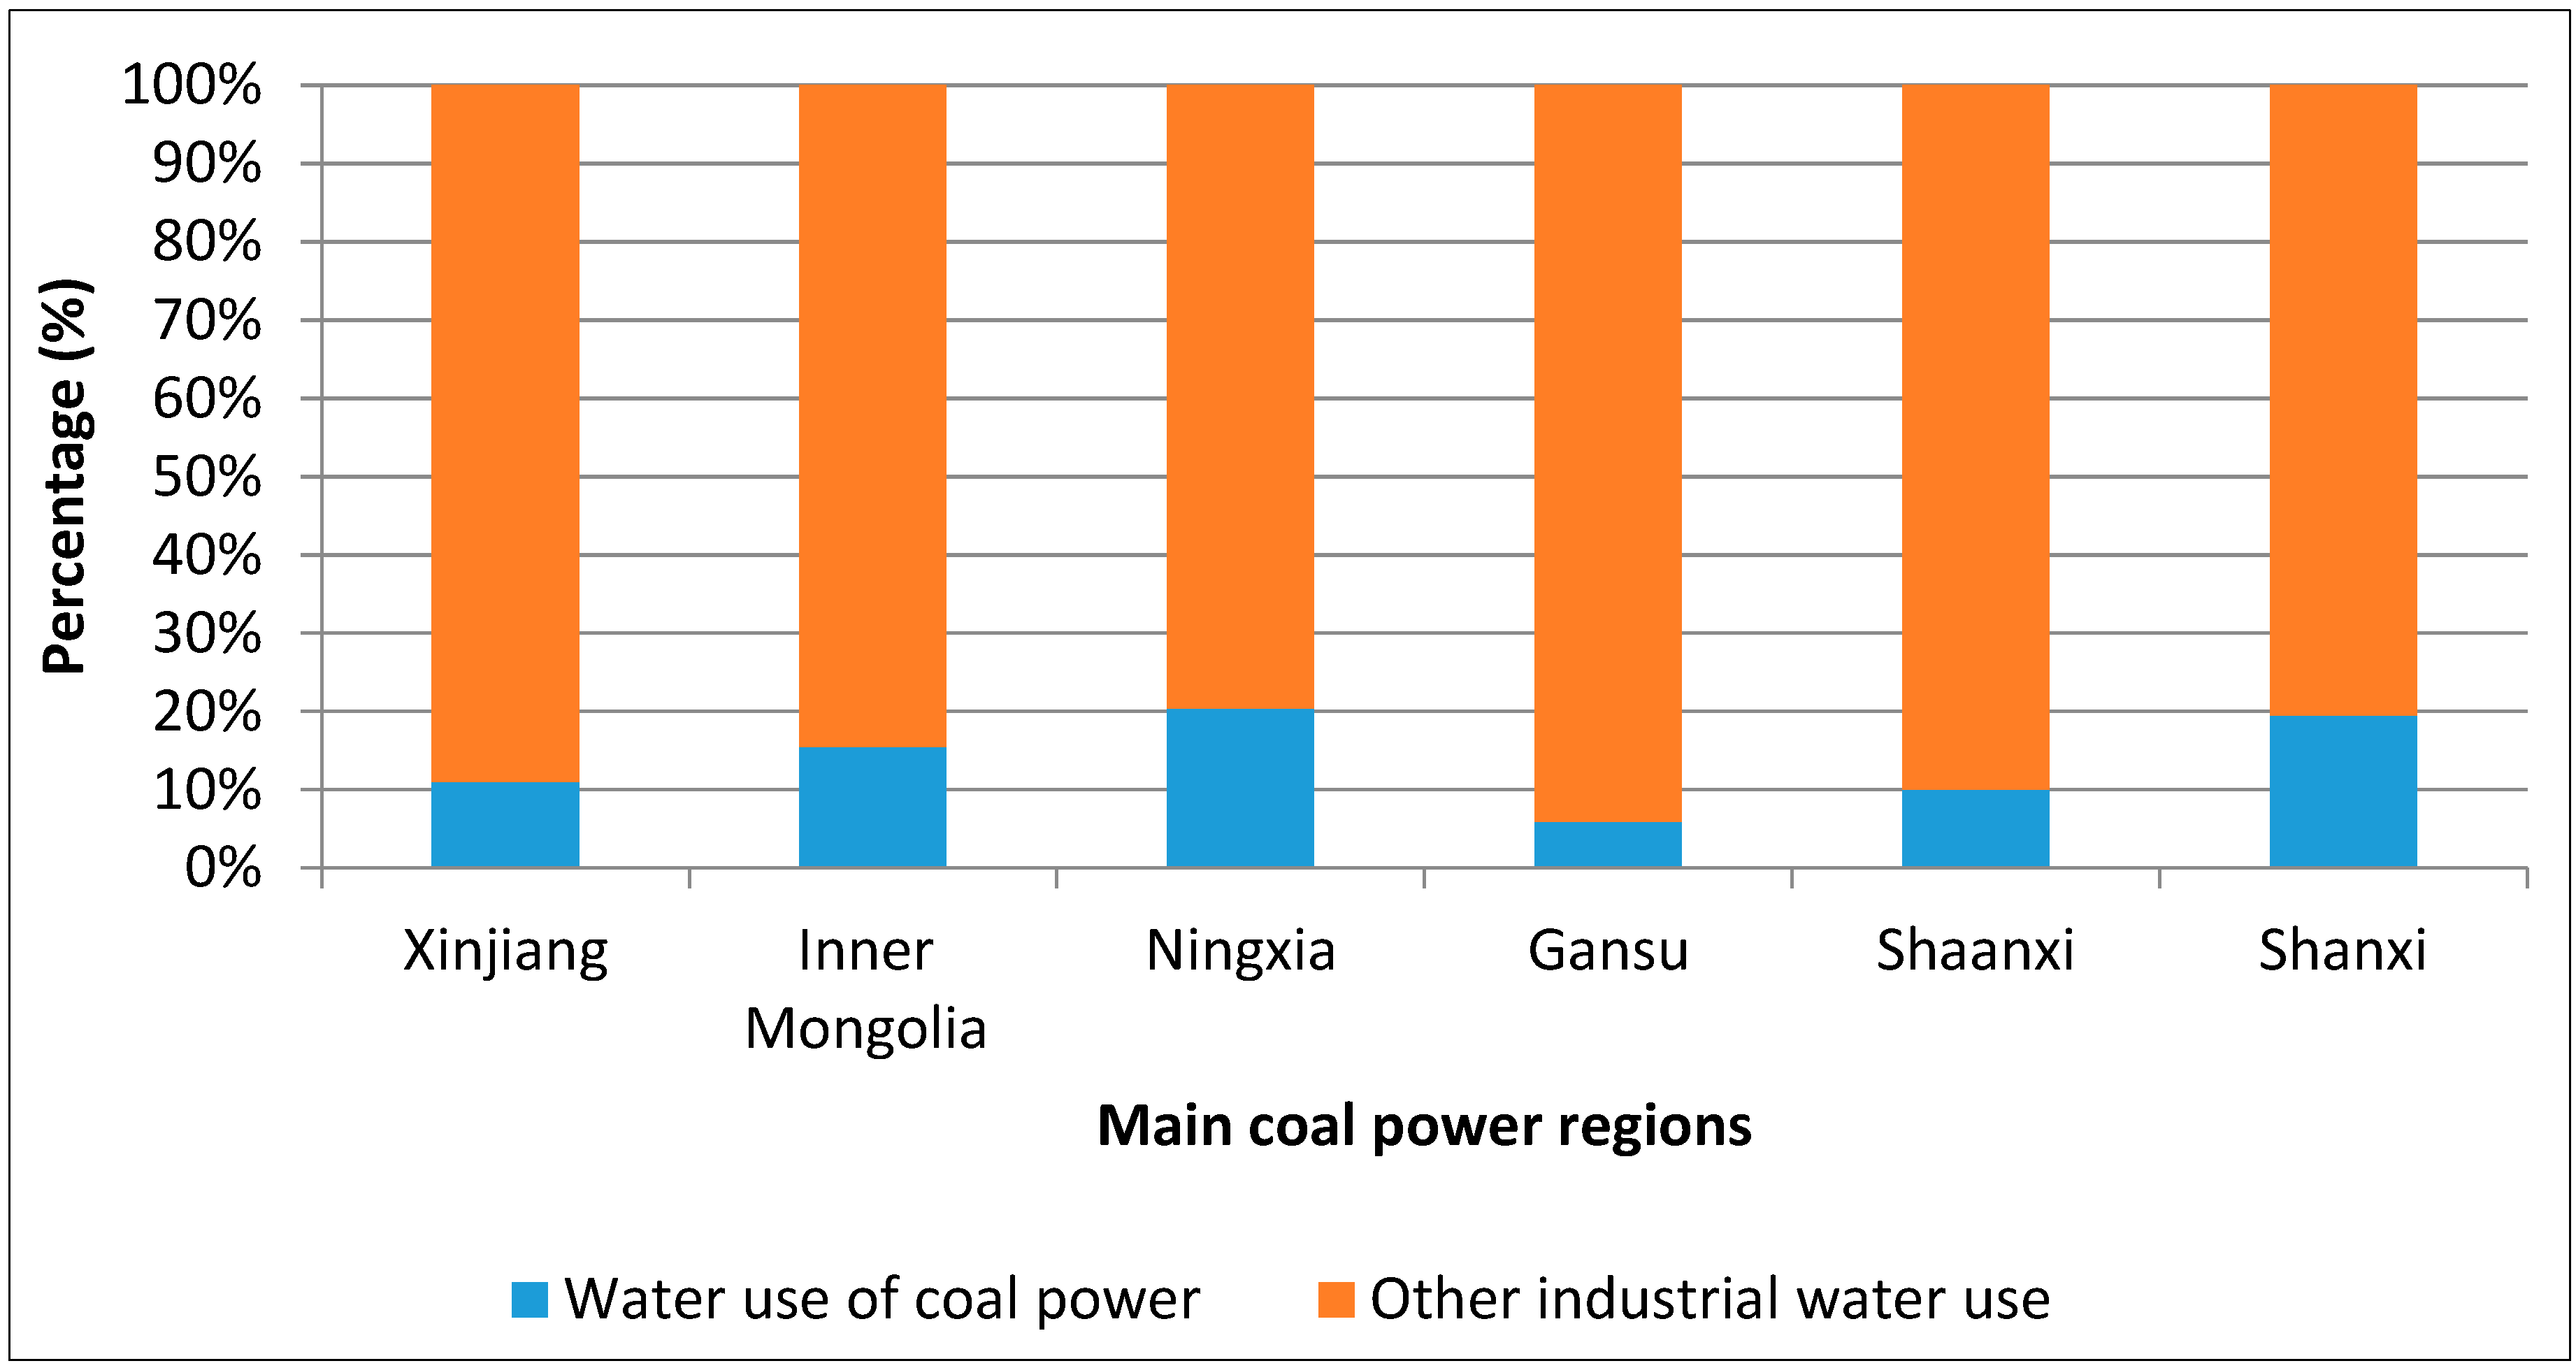
2.3. Water Use in the Coal Power Base Provinces of Western China

2.4. Originality and Novelty of the Study
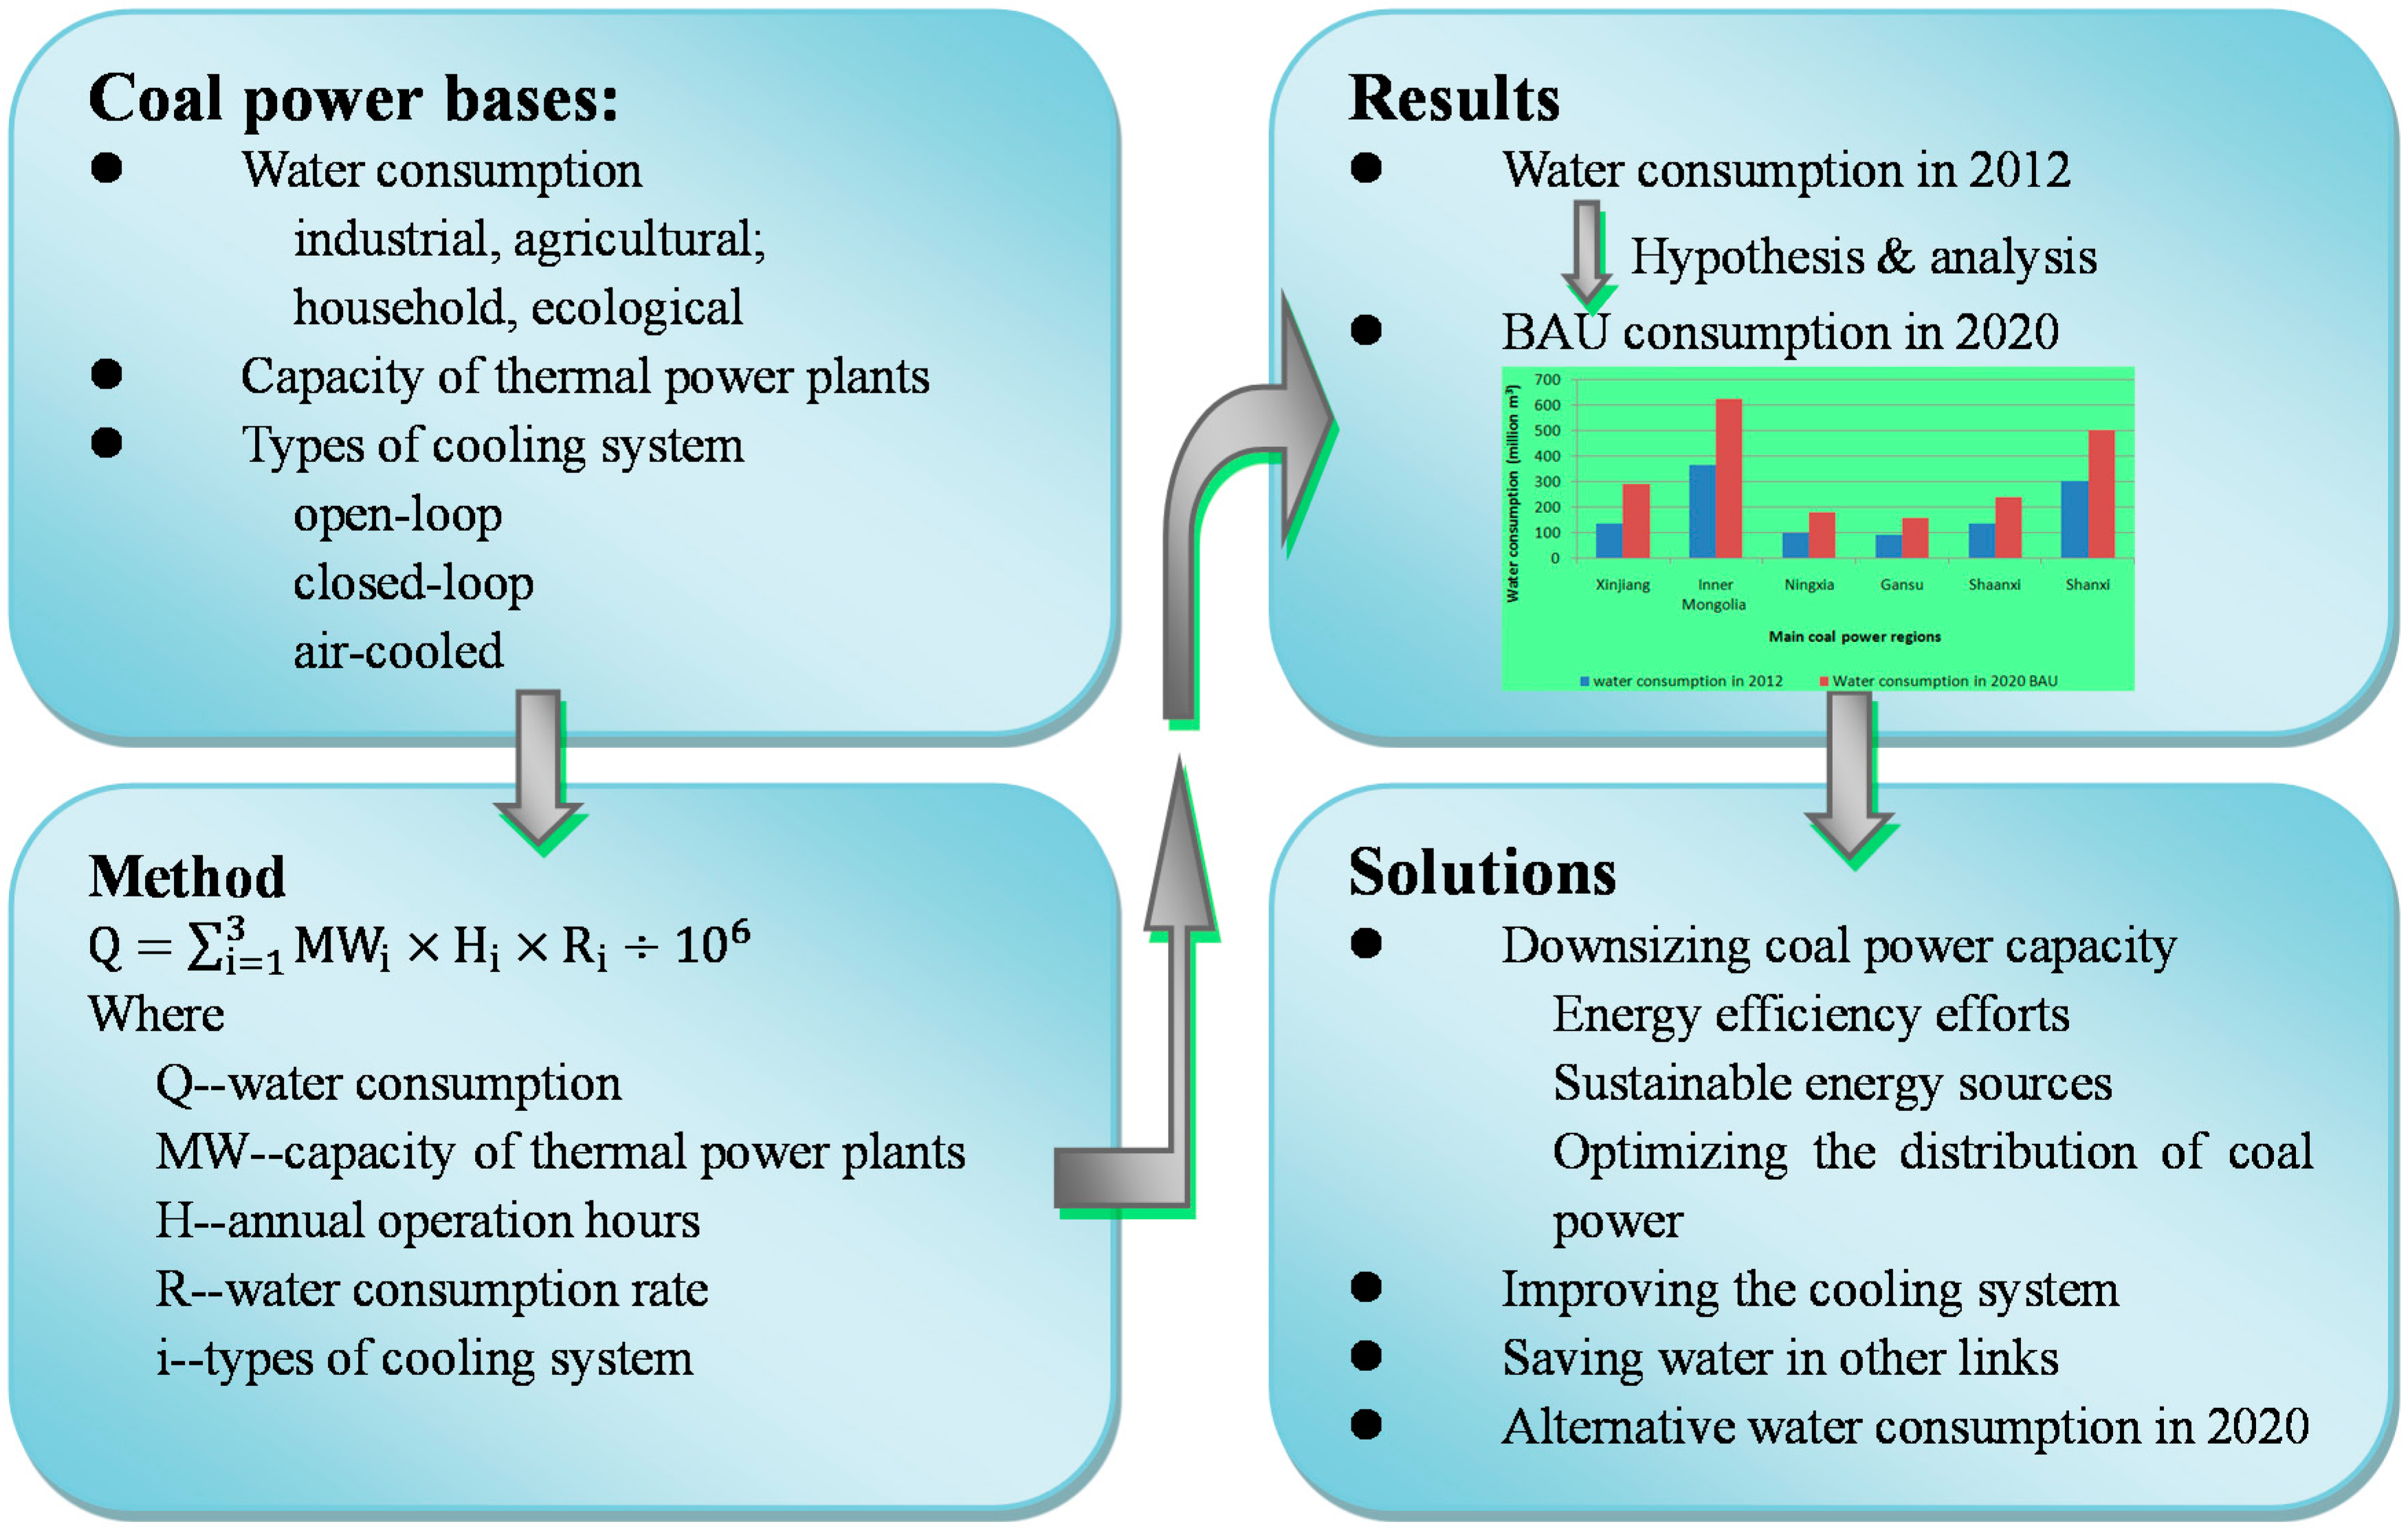
3. Methods and Data
3.1. The Water Link of Thermal Power Plant
3.2. Water Consumption Rate in Coal Power Plants

| Types of cooling system | Counted units | Proportion (%) | Comprehensive water consumption rate (m3/MWh) | ||
|---|---|---|---|---|---|
| Optimal value | The top 30% average | Average | |||
| Closed-loop | 128 | 39.26% | 0.23 | 1.27 | 1.83 |
| Open-loop | 134 | 41.10% | 0.02 | 0.18 | 0.29 |
| Air-cooled | 64 | 19.63% | 0.18 | 0.23 | 0.31 |
| Types of cooling system | Counted units | Heat rates (gce/kWh) | ||
|---|---|---|---|---|
| Optimal value | The top 30% average | Average | ||
| Closed-loop | 128 | 285.00 | 296.41 | 307.80 |
| Open-loop | 134 | 275.85 | 290.28 | 303.89 |
| Air-cooled | 64 | 306.90 | 320.86 | 331.18 |
3.3. Method

| Q | water consumption [106 m3/a] |
| MW | installed capacity of thermal power plants [MW] |
| H | Annual operation hours of the thermal power plants |
| R | comprehensive water consumption rate [m3/MWh] |
| i = 1 | closed-loop cooling system |
| i = 2 | open-loop cooling system |
| i = 3 | air-cooled cooling system |

4. Results
4.1. Current Water Consumption Status
| Region | Count of different cooling system | ||
|---|---|---|---|
| Open-loop | Closed-loop | Air-cooled | |
| Shanxi | 0 | 4 | 18 |
| Inner Mongolia | 2 | 12 | 20 |
| Shaanxi | 0 | 2 | 13 |
| Gansu | 0 | 0 | 2 |
| Ningxia | 0 | 0 | 8 |
| Total | 2 | 18 | 61 |
| Province | Coal power capacity/MW | Types of cooling system | Water consumption rate (m3/MWh) | Installed capacity /MW | Water consumption (106 m3/a) | Total water consumption (106 m3/a) |
|---|---|---|---|---|---|---|
| Xinjiang | 22,570 | Closed-loop | 1.83 | 5640 | 90.414 | 136.389 |
| Air-cooled | 0.31 | 16,930 | 45.975 | |||
| Inner Mongolia | 60,190 | Closed-loop | 1.83 | 15,050 | 241.264 | 363.846 |
| Air-cooled | 0.31 | 45,140 | 122.582 | |||
| Ningxia | 16,400 | Closed-loop | 1.83 | 4100 | 65.726 | 99.128 |
| Air-cooled | 0.31 | 12,300 | 33.402 | |||
| Gansu | 15,510 | Closed-loop | 1.83 | 3870 | 62.039 | 93.649 |
| Air-cooled | 0.31 | 11,640 | 31.610 | |||
| Shaanxi | 22,270 | Closed-loop | 1.83 | 5570 | 89.292 | 134.642 |
| Air-cooled | 0.31 | 16,700 | 45.351 | |||
| Shanxi | 50,110 | Closed-loop | 1.83 | 12,530 | 200.866 | 302.918 |
| Air-cooled | 0.31 | 37,580 | 102.052 | |||
| Aggregate | 187,050 | 1130.572 | 1130.572 |

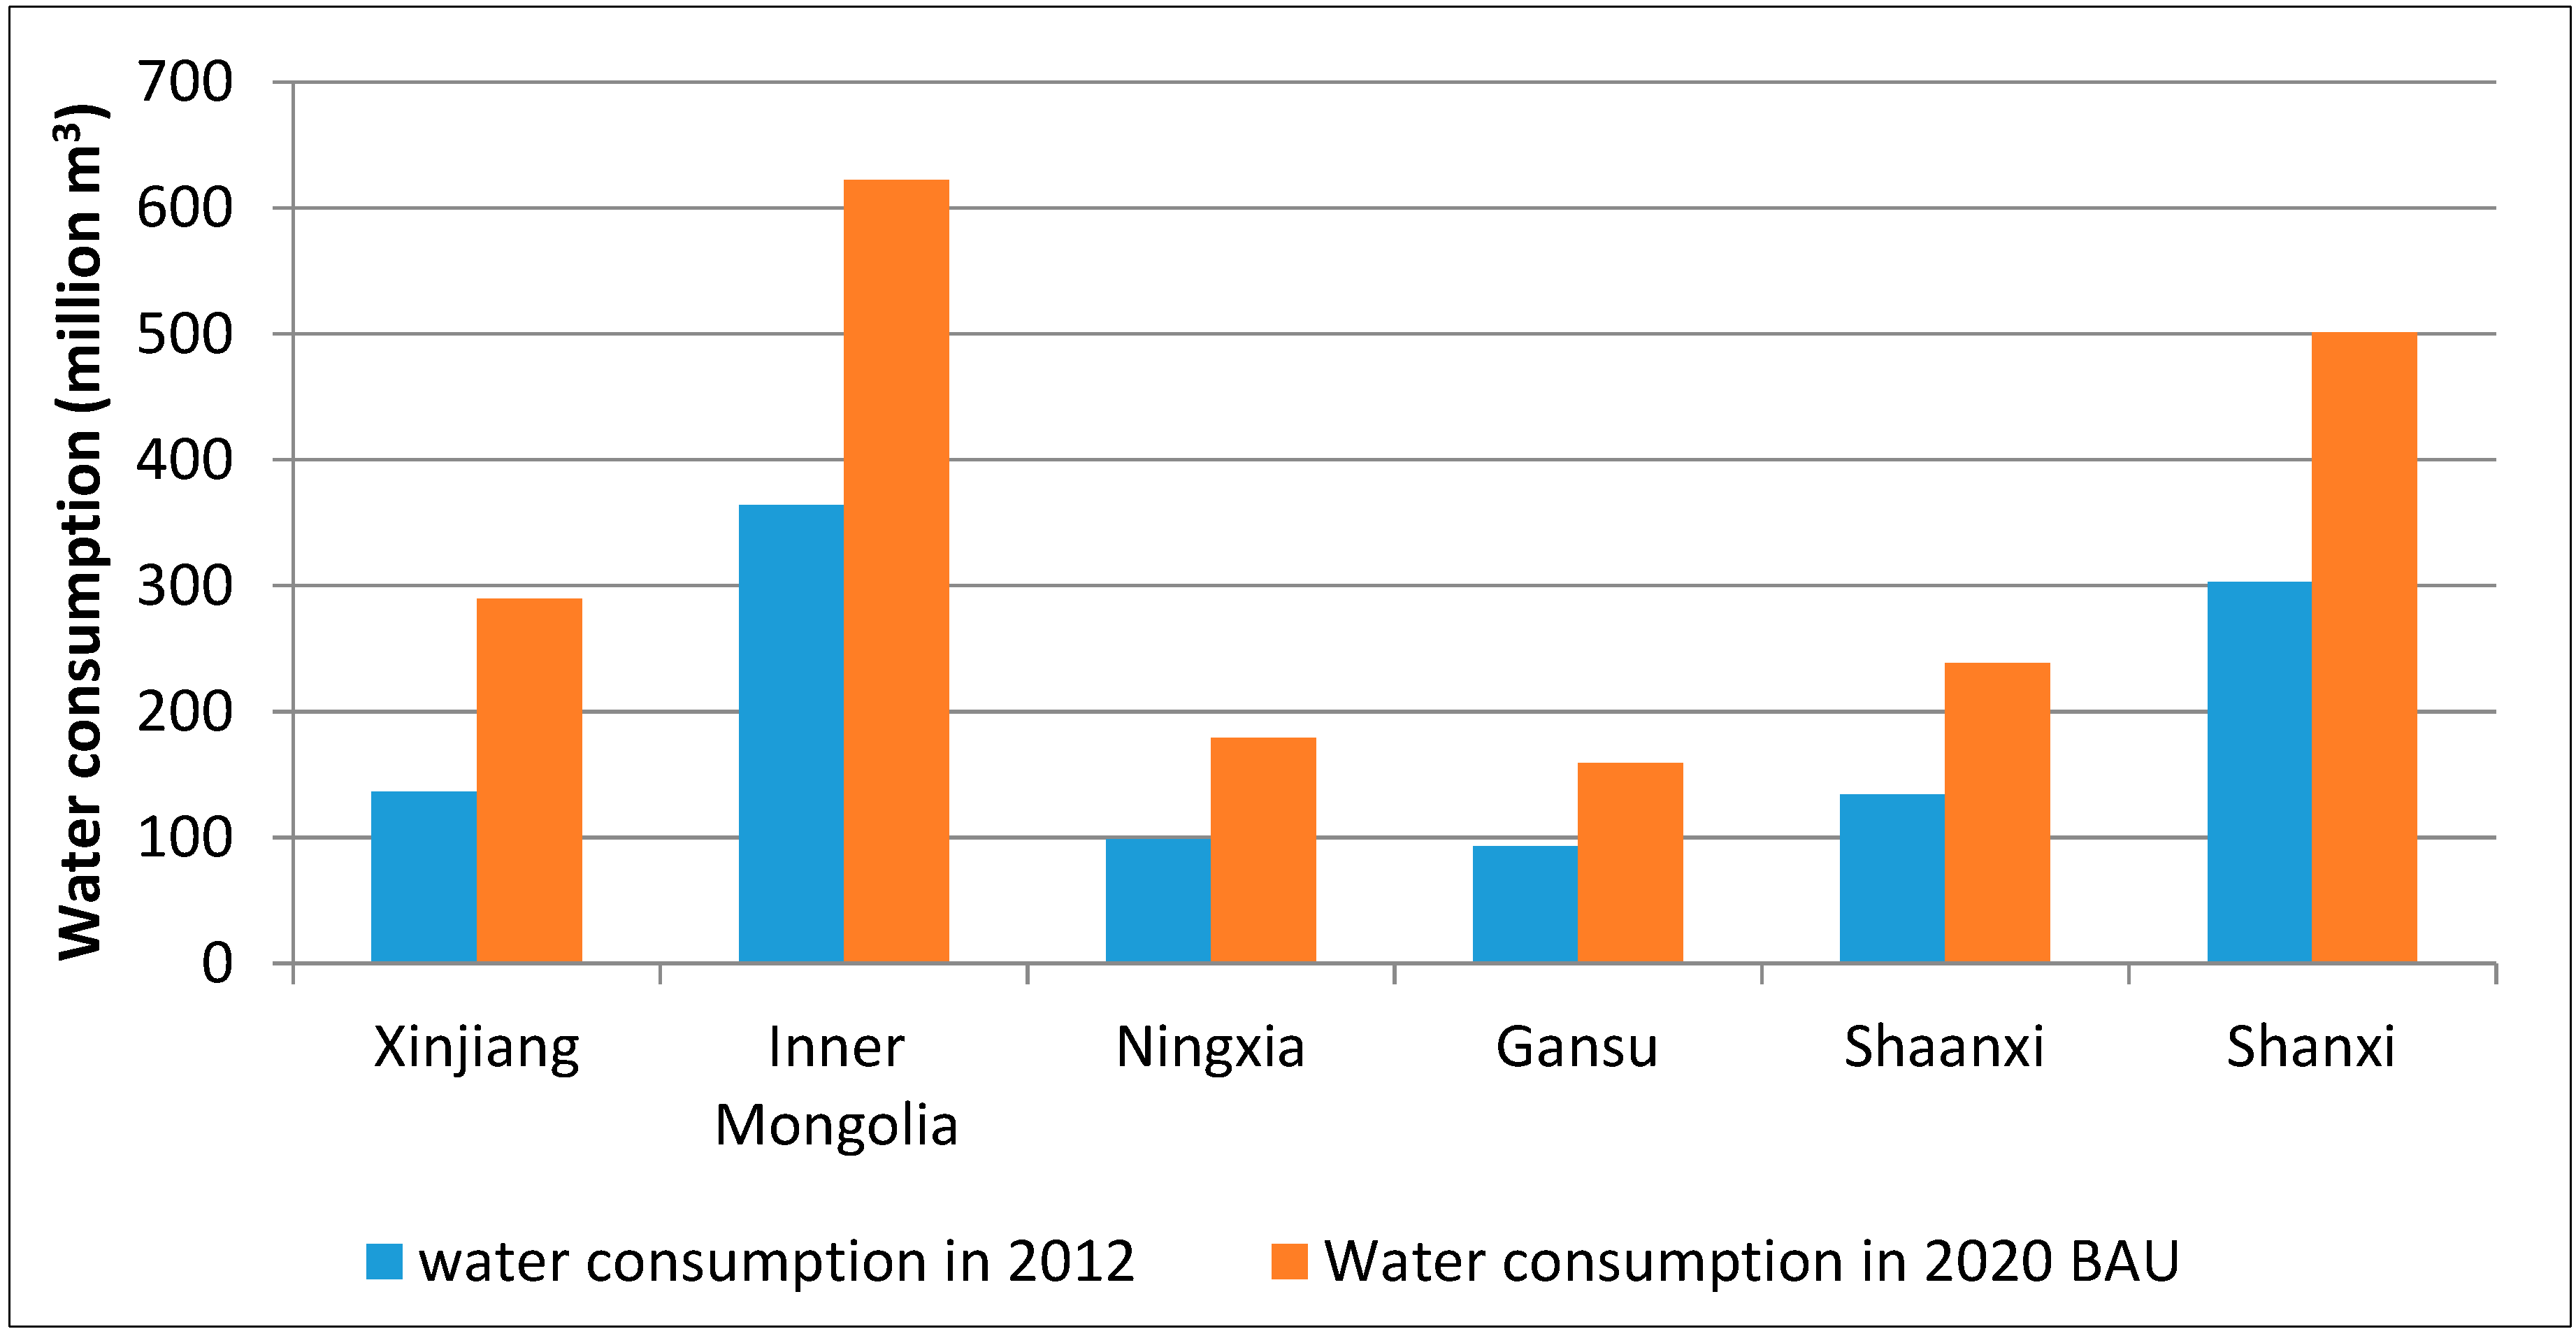
4.2. BAU Water Consumption Scenario in 2020
| Capacity (GW) | Electricity production (TWh) | |
|---|---|---|
| Hydropower | 360 | 1260 |
| Pumped storage | 60 | 48 |
| Coal power | 1050 | 5250 |
| Gas power | 100 | 300 |
| Nuclear power | 58 | 406 |
| Wind power | 200 | 400 |
| Solar power | 70 | 112 |
| Biomass energy | 15 | 67.5 |
| Total | 1913 | 7795.5 |
| Balancing loss | - | 90.5 |
| Electricity demand | - | 7705 |
| Province | Total capacity /MW | Types of cooling system | Water consumption rate (m3/MWh) | Installed capacity /MW | Water consumption (106 m3/a) | Total water consumption (106 m3/a) |
|---|---|---|---|---|---|---|
| Xinjiang | 47,970 | Closed-loop | 1.83 | 11,990 | 192.209 | 289.917 |
| Air-cooled | 0.31 | 35,980 | 97.707 | |||
| Inner Mongolia | 102,900 | Closed-loop | 1.83 | 25,730 | 412.472 | 622.035 |
| Air-cooled | 0.31 | 77,170 | 209.563 | |||
| Ningxia | 29,670 | Closed-loop | 1.83 | 7420 | 118.949 | 179.371 |
| Air-cooled | 0.31 | 22,250 | 60.422 | |||
| Gansu | 26,300 | Closed-loop | 1.83 | 6580 | 105.483 | 159.034 |
| Air-cooled | 0.31 | 19,720 | 53.552 | |||
| Shaanxi | 39,520 | Closed-loop | 1.83 | 9880 | 158.384 | 238.875 |
| Air-cooled | 0.31 | 29,640 | 80.490 | |||
| Shanxi | 82,950 | Closed-loop | 1.83 | 20,740 | 332.479 | 501.416 |
| Air-cooled | 0.31 | 62,210 | 168.937 | |||
| Total | 329,310 | 329,310 | 1990.648 | 1990.648 |


5. Water Conservation Measures and Alternative Scenario
5.1. Water Conservation Measures
5.1.1. Downsizing Coal Power Capacity
- Reducing electric power demand by active energy efficiency efforts. Energy efficiency has been regarded as the fifth energy source besides coal, oil, gas and hydropower. Worldwide experience has also clearly demonstrated the efficacy of energy efficiency in optimizing energy system. We estimate that with active energy efficiency efforts, the demand growth for electric power can be slowed down by 2%–3% and results in energy conservation at 200–300 TWh annually. The energy efficiency potential into 2020 by various active efforts is shown in Table 7.
| Technology/sector | Energy efficiency potential (TWh) |
|---|---|
| Green lighting | 108.51 |
| High efficiency motor | 130.00 |
| Energy-saving transformer | 8.87 |
| Frequency converter | 97.70 |
| High efficiency appliance | 442.00 |
| Ground source heat pump technology | 18.00 |
| Total | 805.08 |
- Optimizing generation mix by deploying clean and sustainable energy sources. On one hand, in China the hydropower development is yet to reach its economically developable resource limit. On the other hand, China is endowed with abundant renewable energy sources like wind power and solar power, and active support of renewable energy development can make a big difference.
- Optimizing the regional distribution of coal power. With the development of zero emission technology, coal power can generate electricity at emission levels (SO2, NOx and dust) closer to or even lower than gas power [40]. Hence, the government can lift the ban on the new construction of coal power plants in east regions and plan to build some coal power plants with cutting-edge pollutant control technologies in the load centers. The benefits are twofold. First, China’s potential water resource crisis in western can be partly relieved. Second, the demand on long-distance electric power transmission—another important concern of decision-makers—can also be reduced.
5.1.2. Saving Water by Improving the Cooling System
5.1.3. Saving Water in Other Links
- Ash and slag removal system: Dry-type ash and slag removal system, which consumes no water at all, is a mature option. On the other hand, with this process, the produced ash and slag can be reclaimed as building material [41].
- Cooling system of auxiliary systems: The cooling water for the auxiliary systems can be processed in a centralized way. Similarly, a small-scale wet recirculating or dry recirculating cooling system can be employed for the cooling of the pooled water.
- Desulfurization system: Dry desulfurization process consumes much less water than wet process. For the wet desulfurization process, the cyclic utilization of processing water is a feasible option. Other option is to use the reclaimed water in the cooling system for the auxiliary systems in desulfurization process.
- Water use of coal yard: The water quality demand in the coal yard is much lower. Retreated industrial wastewater or domestic wastewater can be collected for this purpose. Besides, the wastewater produced in coal yard can also be reutilized to further cut down water consumption.
5.2. An Alternative Water Consumption Scenario
| Capacity (GW) | Power production (TWh) | |
|---|---|---|
| Hydropower | 360 | 1260 |
| Pumped storage | 70 | 56 |
| Coal power | 959.91 | 4799.6 |
| Gas power-centralized | 70 | 350 |
| Gas power-distributed | 50 | 125 |
| Nuclear power | 60 | 420 |
| Wind power | 230 | 460 |
| Solar power-centralized | 40 | 64 |
| Solar power-distributed | 60 | 72 |
| Biomass energy | 14 | 63 |
| Total | 1913.91 | 7594.9 |
| Balancing loss | - | 34.9 |
| Electricity demand | - | 7560 |
| Province | Total capacity/MW | Types of cooling system | Water consumption rate (m3/MWh) | Installed capacity /MW | Water consumption (106 m3/a) | Total water consumption (106 m3/a) |
|---|---|---|---|---|---|---|
| Xinjiang | 45,050 | Closed-loop | 1.27 | 9010 | 100.238 | 172.851 |
| Air-cooled | 0.23 | 36,040 | 72.613 | |||
| Inner Mongolia | 100,000 | Closed-loop | 1.27 | 20,000 | 222.504 | 383.688 |
| Air-cooled | 0.23 | 80,000 | 161.184 | |||
| Ningxia | 27,580 | Closed-loop | 1.27 | 5520 | 61.411 | 105.858 |
| Air-cooled | 0.23 | 22,060 | 44.446 | |||
| Gansu | 24,390 | Closed-loop | 1.27 | 4880 | 54.291 | 93.600 |
| Air-cooled | 0.23 | 19,510 | 39.309 | |||
| Shaanxi | 38,140 | Closed-loop | 1.27 | 7630 | 84.885 | 146.357 |
| Air-cooled | 0.23 | 30,510 | 61.472 | |||
| Shanxi | 80,950 | Closed-loop | 1.27 | 16,190 | 180.117 | 310.595 |
| Air-cooled | 0.23 | 64,760 | 130.478 | |||
| Aggregate | 316,110 | 316,110 | 1212.949 | 1212.949 |
6. Concluding Remarks
Acknowledgments
Author Contributions
Appendix
| Plant No. | Capacity (MW) | Comprehensive water consumption rate (m3/MWh) | Types of cooling system | Heat rates (gce/kWh) |
|---|---|---|---|---|
| 1 | 640 | 1.91 | Closed-loop | 298.29 |
| 2 | 640 | 2.10 | Closed-loop | 297.71 |
| 3 | 1000 | 0.30 | Open-loop | 275.85 |
| 4 | 630 | 1.31 | Closed-loop | 296.2 |
| 5 | 640 | 1.98 | Closed-loop | 297.85 |
| 6 | 630 | 0.35 | Open-loop | 296.77 |
| 7 | 640 | 1.99 | Closed-loop | 298.36 |
| 8 | 600 | 0.23 | Open-loop | 306.28 |
| 9 | 630 | 1.31 | Closed-loop | 297.33 |
| 10 | 640 | 1.92 | Closed-loop | 298.15 |
| 11 | 1000 | 0.30 | Open-loop | 276.44 |
| 12 | 630 | 2.20 | Closed-loop | 296.78 |
| 13 | 600 | 0.23 | Open-loop | 308.21 |
| 14 | 500 | 1.83 | Closed-loop | 306.05 |
| 15 | 600 | 2.00 | Closed-loop | 307.3 |
| 16 | 660 | 0.25 | Air-cooled | 310.21 |
| 17 | 600 | 0.29 | Open-loop | 298.97 |
| 18 | 500 | 1.60 | Closed-loop | 324.06 |
| 19 | 700 | 2.10 | Closed-loop | 307.61 |
| 20 | 600 | 2.00 | Closed-loop | 309.35 |
| 21 | 600 | 0.24 | Air-cooled | 326.41 |
| 22 | 600 | 1.72 | Closed-loop | 302.35 |
| 23 | 600 | 2.00 | Closed-loop | 298.51 |
| 24 | 600 | 1.70 | Closed-loop | 302.12 |
| 25 | 600 | 0.24 | Air-cooled | 326.7 |
| 26 | 600 | 1.57 | Closed-loop | 310.03 |
| 27 | 1000 | 0.23 | Closed-loop | 287.18 |
| 28 | 1000 | 0.10 | Open-loop | 282. |
| 29 | 600 | 0.23 | Air-cooled | 330.13 |
| 30 | 600 | 0.47 | Air-cooled | 318.14 |
| 31 | 600 | 0.25 | Open-loop | 310.5 |
| 32 | 600 | 0.23 | Air-cooled | 330.05 |
| 33 | 900 | 0.43 | Open-loop | 299.82 |
| 34 | 500 | 1.83 | Closed-loop | 306.28 |
| 35 | 630 | 1.47 | Closed-loop | 300.58 |
| 36 | 630 | 0.35 | Open-loop | 298.53 |
| 37 | 600 | 0.24 | Air-cooled | 327.53 |
| 38 | 630 | 0.35 | Open-loop | 300.3 |
| 39 | 600 | 0.33 | Air-cooled | 329.62 |
| 40 | 660 | 0.32 | Open-loop | 288.2 |
| 41 | 660 | 1.73 | Closed-loop | 298.01 |
| 42 | 630 | 1.99 | Closed-loop | 305.3 |
| 43 | 700 | 2.10 | Closed-loop | 311.39 |
| 44 | 600 | 2.83 | Closed-loop | 310.97 |
| 45 | 660 | 0.19 | Air-cooled | 323.55 |
| 46 | 660 | 0.43 | Open-loop | 291.51 |
| 47 | 670 | 2.07 | Closed-loop | 301.11 |
| 48 | 640 | 1.88 | Closed-loop | 305.12 |
| 49 | 670 | 2.07 | Closed-loop | 302.07 |
| 50 | 600 | 0.26 | Air-cooled | 328.14 |
| 51 | 680 | 0.19 | Open-loop | 298.6 |
| 52 | 600 | 0.26 | Air-cooled | 327.11 |
| 53 | 660 | 1.31 | Closed-loop | 291.34 |
| 54 | 600 | 1.90 | Closed-loop | 307.57 |
| 55 | 600 | 1.87 | Closed-loop | 302.45 |
| 56 | 680 | 0.11 | Open-loop | 289.98 |
| 57 | 600 | 0.24 | Air-cooled | 331.9 |
| 58 | 630 | 1.85 | Closed-loop | 301.08 |
| 59 | 1000 | 2.01 | Closed-loop | 285.71 |
| 60 | 600 | 2.10 | Closed-loop | 315.48 |
| 61 | 1000 | 2.01 | Closed-loop | 286.11 |
| 62 | 660 | 0.41 | Open-loop | 311.3 |
| 63 | 600 | 2.03 | Closed-loop | 301.49 |
| 64 | 630 | 0.42 | Air-cooled | 323.42 |
| 65 | 600 | 0.24 | Open-loop | 311.66 |
| 66 | 630 | 0.42 | Air-cooled | 323.39 |
| 67 | 600 | 2.81 | Closed-loop | 319.58 |
| 68 | 600 | 1.85 | Closed-loop | 300.86 |
| 69 | 1000 | 0.26 | Open-loop | 285.58 |
| 70 | 630 | 2.26 | Closed-loop | 304.13 |
| 71 | 600 | 0.34 | Open-loop | 300.71 |
| 72 | 660 | 0.43 | Open-loop | 291.51 |
| 73 | 600 | 0.29 | Open-loop | 312.11 |
| 74 | 600 | 0.24 | Open-loop | 299.99 |
| 75 | 600 | 0.20 | Open-loop | 310.03 |
| 76 | 900 | 0.43 | Open-loop | 301.01 |
| 77 | 1000 | 0.27 | Open-loop | 285.55 |
| 78 | 600 | 0.24 | Air-cooled | 330.73 |
| 79 | 650 | 0.33 | Closed-loop | 303.07 |
| 80 | 660 | 0.17 | Open-loop | 294.85 |
| 81 | 600 | 2.46 | Closed-loop | 304.26 |
| 82 | 630 | 1.99 | Closed-loop | 306.8 |
| 83 | 600 | 0.41 | Air-cooled | 330.38 |
| 84 | 600 | 2.83 | Closed-loop | 311.91 |
| 85 | 600 | 0.29 | Open-loop | 313.48 |
| 86 | 600 | 0.24 | Open-loop | 301.48 |
| 87 | 600 | 0.24 | Air-cooled | 331.15 |
| 88 | 600 | 2.46 | Closed-loop | 304.87 |
| 89 | 600 | 1.78 | Closed-loop | 302.49 |
| 90 | 600 | 1.57 | Closed-loop | 314.35 |
| 91 | 660 | 1.62 | Closed-loop | 297.16 |
| 92 | 600 | 1.85 | Closed-loop | 308.1 |
| 93 | 1000 | 1.65 | Closed-loop | 288.77 |
| 94 | 630 | 2.20 | Closed-loop | 301.75 |
| 95 | 600 | 1.75 | Closed-loop | 315.73 |
| 96 | 660 | 0.19 | Air-cooled | 323.41 |
| 97 | 630 | 0.41 | Open-loop | 302.36 |
| 98 | 600 | 0.49 | Air-cooled | 320.25 |
| 99 | 650 | 0.28 | Open-loop | 302.93 |
| 100 | 600 | 0.24 | Open-loop | 300.39 |
| 101 | 600 | 1.76 | Closed-loop | 306.17 |
| 102 | 600 | 0.20 | Open-loop | 313.97 |
| 103 | 600 | 2.01 | Closed-loop | 305.2 |
| 104 | 600 | 1.95 | Closed-loop | 320.04 |
| 105 | 1000 | 0.31 | Air-cooled | 306.9 |
| 106 | 600 | 1.57 | Closed-loop | 314.62 |
| 107 | 600 | 0.29 | Open-loop | 302.52 |
| 108 | 630 | 1.97 | Closed-loop | 303.66 |
| 109 | 600 | 2.90 | Closed-loop | 319.42 |
| 110 | 600 | 1.57 | Closed-loop | 314.97 |
| 111 | 1000 | 0.32 | Open-loop | 283.93 |
| 112 | 660 | 0.41 | Open-loop | 315.05 |
| 113 | 1000 | 0.81 | Closed-loop | 285. |
| 114 | 600 | 1.75 | Closed-loop | 316.69 |
| 115 | 600 | 0.19 | Open-loop | 313.92 |
| 116 | 600 | 1.76 | Closed-loop | 306.39 |
| 117 | 600 | 0.24 | Open-loop | 301.66 |
| 118 | 600 | 2.05 | Closed-loop | 318. |
| 119 | 660 | 0.32 | Open-loop | 293.12 |
| 120 | 640 | 2.10 | Closed-loop | 302.07 |
| 121 | 600 | 2.03 | Closed-loop | 303.19 |
| 122 | 660 | 0.36 | Air-cooled | 314.82 |
| 123 | 600 | 1.76 | Closed-loop | 305.96 |
| 124 | 1000 | 0.19 | Open-loop | 289.61 |
| 125 | 600 | 1.83 | Closed-loop | 306.03 |
| 126 | 660 | 0.26 | Open-loop | 298.98 |
| 127 | 660 | 0.31 | Open-loop | 292.89 |
| 128 | 600 | 0.36 | Open-loop | 305.13 |
| 129 | 1000 | 0.23 | Closed-loop | 291.46 |
| 130 | 600 | 0.41 | Air-cooled | 332.7 |
| 131 | 600 | 2.46 | Closed-loop | 305.95 |
| 132 | 600 | 0.27 | Air-cooled | 331.91 |
| 133 | 630 | 0.35 | Open-loop | 303.38 |
| 134 | 600 | 0.24 | Open-loop | 304.19 |
| 135 | 600 | 1.75 | Closed-loop | 319.14 |
| 136 | 630 | 0.14 | Open-loop | 306.29 |
| 137 | 630 | 1.67 | Closed-loop | 305.48 |
| 138 | 600 | 0.23 | Air-cooled | 337.29 |
| 139 | 600 | 0.34 | Open-loop | 303.17 |
| 140 | 600 | 2.46 | Closed-loop | 305.71 |
| 141 | 680 | 0.19 | Open-loop | 303.58 |
| 142 | 600 | 0.24 | Open-loop | 311.64 |
| 143 | 660 | 0.18 | Open-loop | 298.47 |
| 144 | 600 | 0.41 | Air-cooled | 333.87 |
| 145 | 1000 | 0.16 | Open-loop | 286.6 |
| 146 | 680 | 0.11 | Open-loop | 294.31 |
| 147 | 600 | 2.00 | Closed-loop | 318.28 |
| 148 | 600 | 1.80 | Closed-loop | 307.34 |
| 149 | 600 | 0.29 | Closed-loop | 313.94 |
| 150 | 650 | 0.33 | Closed-loop | 306.63 |
| 151 | 600 | 0.24 | Open-loop | 304.92 |
| 152 | 600 | 2.16 | Closed-loop | 311.51 |
| 153 | 600 | 1.83 | Closed-loop | 305.74 |
| 154 | 600 | 0.29 | Open-loop | 303.69 |
| 155 | 1000 | 0.29 | Closed-loop | 290.67 |
| 157 | 650 | 0.30 | Open-loop | 305.25 |
| 158 | 660 | 1.03 | Closed-loop | 324. |
| 159 | 660 | 0.28 | Open-loop | 292.09 |
| 160 | 660 | 1.73 | Closed-loop | 302.49 |
| 161 | 1000 | 0.16 | Open-loop | 288.99 |
| 162 | 1000 | 1.65 | Closed-loop | 289.5 |
| 163 | 1000 | 0.28 | Open-loop | 289.07 |
| 164 | 600 | 1.60 | Closed-loop | 309.03 |
| 165 | 600 | 2.03 | Closed-loop | 310.84 |
| 166 | 660 | 2.05 | Closed-loop | 309.78 |
| 167 | 630 | 0.34 | Open-loop | 308.04 |
| 168 | 600 | 1.84 | Closed-loop | 307.46 |
| 169 | 600 | 0.29 | Open-loop | 303.06 |
| 170 | 600 | 1.76 | Closed-loop | 306.29 |
| 171 | 660 | 0.24 | Open-loop | 299.56 |
| 172 | 1000 | 0.28 | Open-loop | 285.09 |
| 173 | 600 | 2.49 | Closed-loop | 309.85 |
| 174 | 660 | 0.24 | Open-loop | 296.98 |
| 175 | 600 | 0.39 | Air-cooled | 338.06 |
| 176 | 660 | 0.02 | Open-loop | 294.52 |
| 177 | 600 | 0.41 | Air-cooled | 334.8 |
| 178 | 1000 | 0.28 | Open-loop | 289.2 |
| 179 | 1000 | 0.89 | Closed-loop | 285.05 |
| 180 | 660 | 2.05 | Closed-loop | 309.78 |
| 181 | 630 | 0.34 | Open-loop | 316.79 |
| 182 | 1000 | 0.31 | Air-cooled | 308.01 |
| 183 | 1000 | 0.28 | Open-loop | 289.02 |
| 184 | 600 | 0.36 | Open-loop | 309.38 |
| 185 | 660 | 0.31 | Air-cooled | 320.86 |
| 186 | 660 | 0.18 | Open-loop | 299.94 |
| 187 | 600 | 2.00 | Closed-loop | 306.58 |
| 188 | 630 | 0.43 | Open-loop | 312.91 |
| 189 | 1000 | 0.40 | Open-loop | 289.51 |
| 190 | 630 | 0.39 | Open-loop | 309.73 |
| 191 | 500 | 1.60 | Closed-loop | 327.8 |
| 192 | 600 | 0.23 | Air-cooled | 335.44 |
| 193 | 600 | 0.24 | Open-loop | 304.24 |
| 194 | 1000 | 0.19 | Open-loop | 291.34 |
| 195 | 660 | 0.02 | Open-loop | 295.42 |
| 196 | 600 | 0.31 | Air-cooled | 337.53 |
| 197 | 600 | 0.27 | Open-loop | 309.85 |
| 198 | 600 | 2.13 | Closed-loop | 321.41 |
| 199 | 660 | 0.18 | Open-loop | 301.81 |
| 200 | 1000 | 0.39 | Open-loop | 292.2 |
| 201 | 660 | 1.03 | Closed-loop | 324.7 |
| 202 | 600 | 1.75 | Closed-loop | 309.03 |
| 204 | 660 | 1.65 | Closed-loop | 300.1 |
| 205 | 600 | 2.13 | Closed-loop | 321.41 |
| 206 | 600 | 1.84 | Closed-loop | 308.99 |
| 207 | 660 | 0.17 | Open-loop | 306.56 |
| 208 | 630 | 0.34 | Open-loop | 308.87 |
| 209 | 600 | 2.20 | Closed-loop | 318.28 |
| 210 | 1000 | 0.40 | Open-loop | 288.15 |
| 211 | 660 | 0.41 | Open-loop | 314.32 |
| 212 | 1000 | 0.21 | Open-loop | 284.56 |
| 213 | 600 | 1.75 | Closed-loop | 320.92 |
| 214 | 600 | 0.40 | Air-cooled | 330.38 |
| 215 | 660 | 0.28 | Open-loop | 292.8 |
| 216 | 660 | 0.31 | Air-cooled | 321.15 |
| 217 | 650 | 0.32 | Open-loop | 307.82 |
| 218 | 600 | 1.71 | Closed-loop | 320.74 |
| 219 | 600 | 0.33 | Air-cooled | 338.41 |
| 220 | 600 | 1.78 | Closed-loop | 307.04 |
| 221 | 660 | 1.74 | Closed-loop | 305.11 |
| 222 | 1000 | 0.32 | Open-loop | 293.25 |
| 223 | 600 | 0.39 | Air-cooled | 338.4 |
| 224 | 680 | 0.39 | Open-loop | 302.96 |
| 225 | 660 | 0.28 | Open-loop | 302.73 |
| 226 | 660 | 0.36 | Air-cooled | 328.9 |
| 227 | 660 | 0.35 | Air-cooled | 333.58 |
| 228 | 600 | 0.18 | Open-loop | 297.56 |
| 229 | 660 | 0.31 | Air-cooled | 325.03 |
| 230 | 600 | 2.07 | Closed-loop | 320.33 |
| 231 | 630 | 2.26 | Closed-loop | 308.05 |
| 232 | 600 | 2.07 | Closed-loop | 313.43 |
| 233 | 660 | 0.31 | Air-cooled | 328.35 |
| 234 | 630 | 0.63 | Open-loop | 306.7 |
| 235 | 660 | 0.34 | Air-cooled | 329.91 |
| 236 | 660 | 1.30 | Closed-loop | 291.34 |
| 237 | 660 | 1.71 | Closed-loop | 305.72 |
| 238 | 630 | 0.14 | Open-loop | 306.36 |
| 239 | 600 | 1.96 | Closed-loop | 320.28 |
| 240 | 600 | 0.31 | Air-cooled | 338.79 |
| 241 | 600 | 2.02 | Closed-loop | 308.06 |
| 242 | 630 | 0.41 | Open-loop | 303.68 |
| 243 | 600 | 1.81 | Closed-loop | 313.89 |
| 244 | 660 | 0.24 | Open-loop | 310.58 |
| 245 | 600 | 3.83 | Closed-loop | 327.47 |
| 246 | 600 | 0.27 | Air-cooled | 339.18 |
| 247 | 600 | 0.25 | Open-loop | 322.2 |
| 248 | 600 | 0.28 | Open-loop | 306.39 |
| 249 | 600 | 0.22 | Air-cooled | 337.27 |
| 250 | 660 | 0.17 | Open-loop | 308.22 |
| 251 | 600 | 0.26 | Open-loop | 322.76 |
| 252 | 600 | 0.22 | Air-cooled | 338.28 |
| 253 | 630 | 0.39 | Open-loop | 319.89 |
| 254 | 630 | 0.63 | Open-loop | 307.89 |
| 255 | 600 | 0.28 | Open-loop | 313.82 |
| 256 | 600 | 0.19 | Open-loop | 306.97 |
| 257 | 660 | 1.55 | Closed-loop | 308.27 |
| 258 | 660 | 0.24 | Open-loop | 311.67 |
| 259 | 600 | 1.86 | Closed-loop | 315.92 |
| 260 | 660 | 0.31 | Air-cooled | 328.35 |
| 261 | 1000 | 0.31 | Open-loop | 284.56 |
| 262 | 1000 | 0.19 | Open-loop | 295.69 |
| 263 | 600 | 0.40 | Open-loop | 322.3 |
| 264 | 600 | 2.03 | Closed-loop | 310.84 |
| 265 | 600 | 0.40 | Air-cooled | 330.15 |
| 266 | 600 | 2.05 | Closed-loop | 317.36 |
| 267 | 600 | 0.44 | Air-cooled | 344.06 |
| 268 | 660 | 0.50 | Open-loop | 305.45 |
| 269 | 1000 | 0.39 | Open-loop | 294.82 |
| 270 | 660 | 0.30 | Open-loop | 291.2 |
| 271 | 660 | 0.31 | Air-cooled | 324.62 |
| 272 | 600 | 0.31 | Air-cooled | 326.92 |
| 273 | 600 | 0.27 | Air-cooled | 338.92 |
| 274 | 600 | 0.40 | Open-loop | 318.71 |
| 275 | 600 | 0.10 | Open-loop | 313.33 |
| 276 | 600 | 0.20 | Open-loop | 310.75 |
| 277 | 600 | 0.44 | Air-cooled | 344.06 |
| 278 | 600 | 2.10 | Closed-loop | 316.79 |
| 279 | 700 | 0.41 | Open-loop | 321.73 |
| 280 | 700 | 0.49 | Open-loop | 310.74 |
| 281 | 660 | 0.38 | Air-cooled | 328.51 |
| 282 | 600 | 2.08 | Closed-loop | 323.87 |
| 283 | 600 | 1.86 | Closed-loop | 316.44 |
| 284 | 660 | 0.55 | Air-cooled | 325.81 |
| 285 | 600 | 0.40 | Open-loop | 318.23 |
| 286 | 600 | 0.20 | Open-loop | 310.77 |
| 287 | 660 | 0.45 | Open-loop | 303.24 |
| 288 | 600 | 2.07 | Closed-loop | 318. |
| 289 | 600 | 0.27 | Air-cooled | 338.82 |
| 290 | 600 | 2.16 | Closed-loop | 311.67 |
| 291 | 600 | 0.40 | Open-loop | 324.25 |
| 292 | 600 | 3.83 | Closed-loop | 326.53 |
| 293 | 600 | 0.19 | Open-loop | 306.98 |
| 294 | 600 | 0.26 | Open-loop | 317.15 |
| 295 | 600 | 0.26 | Open-loop | 318.05 |
| 296 | 600 | 0.31 | Air-cooled | 339.33 |
| 297 | 600 | 0.38 | Open-loop | 313.76 |
| 298 | 600 | 0.24 | Open-loop | 303.91 |
| 299 | 1000 | 1.87 | Closed-loop | 291.08 |
| 300 | 1000 | 0.32 | Open-loop | 298.1 |
| 301 | 600 | 1.71 | Closed-loop | 322.59 |
| 302 | 600 | 0.25 | Open-loop | 322.2 |
| 303 | 600 | 1.61 | Closed-loop | 332.22 |
| 304 | 600 | 0.31 | Air-cooled | 326.75 |
| 305 | 630 | 0.39 | Open-loop | 309.04 |
| 306 | 600 | 0.25 | Open-loop | 322.2 |
| 307 | 600 | 0.28 | Open-loop | 308.48 |
| 308 | 630 | 0.42 | Open-loop | 317.64 |
| 309 | 600 | 0.23 | Open-loop | 309.43 |
| 310 | 600 | 1.79 | Closed-loop | 331.2 |
| 311 | 700 | 0.41 | Open-loop | 322.14 |
| 313 | 600 | 0.76 | Closed-loop | 303.75 |
| 314 | 600 | 0.26 | Open-loop | 320.52 |
| 315 | 660 | 1.71 | Closed-loop | 304.94 |
| 316 | 600 | 0.27 | Air-cooled | 339.58 |
| 317 | 600 | 0.76 | Closed-loop | 305.18 |
| 318 | 600 | 0.18 | Air-cooled | 346.8 |
| 319 | 600 | 1.78 | Closed-loop | 316.43 |
| 320 | 600 | 0.23 | Open-loop | 314.1 |
| 321 | 600 | 0.35 | Air-cooled | 349.18 |
| 323 | 800 | 0.51 | Open-loop | 355.23 |
| 324 | 600 | 0.28 | Air-cooled | 341.09 |
| 327 | 600 | 0.25 | Open-loop | 325.51 |
| 328 | 700 | 0.50 | Open-loop | 312.49 |
| 330 | 600 | 0.35 | Air-cooled | 351.6 |
| 331 | 600 | 0.28 | Air-cooled | 339.29 |
| 333 | 600 | 0.27 | Air-cooled | 333.16 |
| 334 | 600 | 0.18 | Air-cooled | 346.8 |
Conflicts of Interest
References
- Li Keqiang: Industry in the East has to Move to the West, and a Ban on New Thermal Power in Beijing, Tianjin and Other Regions. Available online: http://news.bjx.com.cn/html/20140626/521911.shtml (accessed on 26 June 2014).
- China Electricity Council (CEC). Annual Development Report on China’s Power Industry; China Market Press: China, Beijing, 2013. [Google Scholar]
- China Electricity Council (CEC). Power Development Strategic Research Report. 2013. Available online: http://www.doc88.com/p-8015468257297.html (accessed on 20 August 2014).
- The Fifth Session of the Seventeenth CPC Central Committee. Economic and Social Development 12th FYP. 2011. Available online: http://www.gov.cn/2011lh/content_1825838.htm (accessed on 20 August 2014).
- The State Council. The 12th Energy Development plan. 2013. Available online: http://wenku.baidu.com/link?url=cVcFR_cw1iXEDQ4XkOiRSlb23mSeZ12d6GpRzNF7QkDhzFpW8w6Rq0ikPcOSofYj-0v-V6IH2a9zj8g1H4nVba6Wp_FKpo8n3KGxp188fbK (accessed on 20 August 2014).
- National Energy Administration. The 12th Coal Industry Development plan. 2012. Available online: http://finance.qq.com/a/20120322/005082.htm (accessed on 20 August 2014).
- International Energy Agency. IEA Energy Statistics—Electricity for World. Available online: http://www.iea.org/stats/electricity-data.asp?COUNTRY_CODE=29 (accessed on 20 August 2014).
- Rebetez, M.; Dupont, O.; Girond, M. An Analysis if the July 2006 Heatwave Extent in Europe Compared to the Record Year of 2003. Available online: http://china.springerlink.com/content/y5rk72801647k547/?p=a484fa0be21d4cad8d361b2b6c22eaca&pi=0 (accessed on 20 August 2014).
- UN-Water. Coping with Water Scarcity: An Action Framework for Agriculture and Food Security; Food and Agriculture Organization of the United Nations: Rome, Italy, 2012. [Google Scholar]
- Carter, N.T. Energy’s Water Demand: Trends, Vulnerabilities, and Management; Diane Publishing Company: Collingdale, PA, USA, 2010. [Google Scholar]
- Kajenthira, A.; Siddiqi, A.; Anadon, L.D. A new case for promoting wastewater reuse in Saudi Arabia: Bringing energy into the water equation. J. Environ. Manag. 2012, 102, 184–192. [Google Scholar]
- Siddiqi, A.; Kajenthira, A.; Anadón, L.D. Bridging decision networks for integrated water and energy planning. Energy Strategy Rev. 2013, 2, 46–58. [Google Scholar]
- Gleick, P.H. Water and energy. Annu. Rev. Energy Environ. 1994, 19, 267–299. [Google Scholar]
- Bazilian, M.; Rogner, H.; Howells, M.; Hermann, S.; Arent, D.; Gielen, D.; Steduto, P.; Mueller, A.; Komor, P.; Tol, R.S.J.; et al. Considering the energy, water and food nexus: Towards an integrated modelling approach. Energy Policy 2011, 39, 7896–7906. [Google Scholar]
- Koch, H.; Vögele, S. Dynamic modelling of water demand, water availability and adaptation strategies for power plants to global change. Ecol. Econ. 2009, 68, 2031–2039. [Google Scholar]
- Alexander, T.D.; Melissa, M.B. The Regional Energy & Water Supply Scenarios (REWSS) model. Part I: Framework, procedure, and validation. Sustain. Energy Technol. Assess. 2014, 7, 227–236. [Google Scholar]
- Benjamin, K.S.; Kelly, E.S. Identifying future electricity—Water tradeoffs in the United States. Energy Policy 2009, 37, 2763–2773. [Google Scholar]
- Edward, A.B.; Jim, W.H.; Jaime, M.A. Electricity generation and cooling water use: UK pathways to 2050. Global Environ. Chang. 2014, 25, 16–30. [Google Scholar]
- Aurelie, D.; Edi, A.; Stephanie, B.; Sandrine, S.; Nadia, M. Water modeling in an energy optimization framework—The water-scarce middle east context. Appl. Energy 2013, 101, 268–279. [Google Scholar]
- Kuishuang, F.; Klaus, H.; Yim, L.S.; Xin, L. The energy and water nexus in Chinese electricity production—A hybrid life cycle analysis. Renew. Sustain. Energy Rev. 2014, 39, 342–355. [Google Scholar]
- Huang, X. On the Status of Water in China. Dossier 2013, 3, 185. [Google Scholar]
- Alun, G.; Fei, T.; Yu, W. China energy-water nexus: Assessing the water-saving synergy effects of energy-saving policies during the eleventh Five-year Plan. Energy Convers. Manag. 2014, 85, 630–637. [Google Scholar]
- Zhang, Z.; Bai, J.; Zhen, H. Distributing water resources optimumly and promoting the development of coal power bases. Electric Power 2007, 40, 20–24. [Google Scholar]
- Institute of Geographical Sciences and Natural Resource Research, Chinese Academy of Sciences, Land Key Laboratory of Water Cycle and Surface Process. Thirsty Coal; China Environmental Science Press: Beijing, China, 2012. [Google Scholar]
- Wei, X; Liu, F. A brief analysis of protection and sustainable use of water resources in Inner Mongolia Jungar Banner. Shanxi Architect. 2010, 36, 362–363. [Google Scholar]
- Tuo, Y. Saving water and promoting sustainable use of water resources in Inner Mongolia. Inner Mongolia Water 2009, 3, 87–88. [Google Scholar]
- Water Resources in Holingola. Available online: http://www.hlgls.gov.cn/userlist/admin/newshow-7304.html (accessed on 06 June 2013).
- National Bureau of Statistics of China. China Economic Census Yearbook 2008; China Statistics Press: Beijing, China, 2008.
- Jiang, Y. China’s water scarcity. J. Environ. Manag. 2009, 90, 3185–3196. [Google Scholar]
- National Bureau of Statistics of China. China Statistical Yearbook 2013; China Statistics Press: Beijing, China, 2013.
- Department of Energy. Energy Demands on Water Resources—Report to Congress on the Interdependency of Energy and Water. Available online: http://climateknowledge.org/figures/Rood_Climate_Change_AOSS480_Documents/DoE_Energy_Water_Resources_2006.pdf (accessed on 20 August 2014).
- Cammerman, N. Integrated Water Resource Management and the Water, Energy, Climate Change Nexus. Available online: http://www.watercentre.org/resources/publications/attachments/ncammerman (accessed on 20 August 2014).
- Rio Carillo, A.M.; Frei, C. Water: A key resource in energy production. Energy Policy 2009, 37, 4303–4312. [Google Scholar]
- US Geological Survey (USGS). Estimated Use of Water in the United States in 2000. Available online: http://pubs.usgs.gov/circ/2004/circ1268/index.html (accessed on 20 August 2014).
- Cheng, Z.; Wen, Z. Water resources utilization of thermal power plant. Manag. J. 2011, 17, 375. [Google Scholar]
- Electric Power Research Institute (EPRI). US Water Consumption for Power Production—The Next Half Century. Available online: http://www.circleofblue.org/waternews/wp-content/uploads/2010/08/EPRI-Volume-3.pdf (accessed on 20 August 2014).
- Meldrum, J.; Nettles-Anderson, S.; Heath, G.; Macknick, J. Life cycle water use for electricity generation: A review and harmonization of literature estimates. Environ. Res. Lett. 2013. [Google Scholar] [CrossRef]
- Thomas, J.F., III; Timothy, J.S.; Gary, J.S., Jr.; Andrea, M.; Michael, N.; Brian, S.; James, T.M.; Lynn, M. Water: A critical resource in the thermoelectric power industry. Energy 2008, 33, 1–11. [Google Scholar]
- China Electricity Council (CEC). Notification of energy efficiency benchmarking and competition data of 2012 national 600MW thermal power units. Available online: http://kjfw.cec.org.cn/kejifuwu/2013-04-07/99877.html (accessed on 20 August 2014).
- Wang, H.; Nakata, T. Analysis of the market penetration of clean coal technologies and its impacts in China’s electricity sector. Energy Policy 2009, 37, 338–351. [Google Scholar]
- Li, H.; Chien, S.H.; Hsieh, M.K.; Dzombak, D.A.; Vidic, R.D. Escalating water demands for energy production and the potential for use of treated municipal wastewater. Environ. Sci. Technol. 2011, 45, 195–200. [Google Scholar]
© 2014 by the authors; licensee MDPI, Basel, Switzerland. This article is an open access article distributed under the terms and conditions of the Creative Commons Attribution license (http://creativecommons.org/licenses/by/4.0/).
Share and Cite
Yuan, J.; Lei, Q.; Xiong, M.; Guo, J.; Zhao, C. Scenario-Based Analysis on Water Resources Implication of Coal Power in Western China. Sustainability 2014, 6, 7155-7180. https://doi.org/10.3390/su6107155
Yuan J, Lei Q, Xiong M, Guo J, Zhao C. Scenario-Based Analysis on Water Resources Implication of Coal Power in Western China. Sustainability. 2014; 6(10):7155-7180. https://doi.org/10.3390/su6107155
Chicago/Turabian StyleYuan, Jiahai, Qi Lei, Minpeng Xiong, Jingsheng Guo, and Changhong Zhao. 2014. "Scenario-Based Analysis on Water Resources Implication of Coal Power in Western China" Sustainability 6, no. 10: 7155-7180. https://doi.org/10.3390/su6107155