1. Introduction
The conflict between increasing water demand with population growth, economic development and limited water resources has become the most serious threat to oasis regions in China. Competition for water between upstream and downstream regions often results in a decrease in river flows to downstream regions. Farmers in downstream regions have to increase mining extraction of groundwater to fill the gap between water demand and supply. Groundwater over-exploitation and decline in groundwater tables have caused severe ecological degradation and desertification in downstream regions [
1,
2]. In order to alleviate water scarcity in downstream regions, water reallocation from upstream to downstream regions has been implemented in some river basins in oasis regions, notably the Heihe River Basin and the Shiyang River Basin in northwest China. However, the reallocation of water resources has not solved the water scarcity problem in these river basins. The total water demand is still increasing, particularly with industrialization and urbanization, which tends to heighten water scarcity. The solution to water scarcity and ecological degradation in oasis regions is to stop the growth in water demands, especially reducing agricultural water use. The experiences of some river basins in oasis regions indicate that the extension of water saving irrigation techniques can improve water use efficiency, but not necessarily lead to an automatic decrease in water use, as the saved water is often used to expand irrigation [
3]. To cap the total water demand on the river basin scale while meeting the rising water demands for industrialization and urbanization, there is a need to reduce agricultural water use through water demand management and reallocating the saved water to the industrial and domestic sectors.
Among various policies in reducing agricultural water use, the two most commonly applied are water price control and quantitative control, corresponding to a market mechanism and administrative management, respectively. There is a large literature on the theoretic basis and the effects of these two policy instruments for water demand management. Theoretically, the choice of policy instrument depends critically on the curvature of cost and benefit functions around the optimal output level. However, in practice, many “non-economic” factors can play decisive roles in determining the effectiveness of different policy instruments for water demand management [
4].
For agriculture, the low price of irrigation water has been commonly considered as a primary cause of excessive water use [
5]. With this view being prevalent, it comes as no surprise that raising water prices is widely promoted as a key measure for dealing with water shortage. In general, the reasons for supporting a price instrument include: (1) the stimulus to obtain a profit maximizing output is built right in if producers are rewarded in proportion to profits; and (2) raising prices to bring about water conservation is less costly than implementing a command-and-control approach, because it is easier to set a uniform price than imposing personalized quantities [
4]. Therefore, getting prices right is seen as an essential prerequisite for allocating water resources through the price mechanism.
In practice, the effects of the price mechanism are mixed. Some studies found that water pricing is an effective way to improve water allocation and to encourage water conservation [
6,
7,
8]. However, many other studies found that the price mechanism has failed to generate a force for water conservation [
9,
10,
11,
12,
13]. One of the reasons is because water demand becomes elastic only beyond the marginal value or opportunity cost of water [
14,
15,
16]. When water is considered a public good, it is generally priced low. Hence, the price elasticity of water demand is generally low, especially in developing countries [
14,
15,
16]. Many researchers have derived the price elasticity of water demand in irrigation based on econometric and mathematical programming models and verified the low price elasticity of irrigation water demand [
17,
18,
19,
20].
In contrast to price control, quantitative control is another common approach to alleviate water shortage. When water is scarce, the surest and most direct way to make customers use less water is to limit supply [
21]. Other reasons for advocating a water quota include equality, transparency, administrative simplicity and relatively low transaction costs [
22]. In practice, water quotas are often adopted as a mechanism to curtail demand [
23,
24,
25]. If water quotas are tradable, it is possible to reallocate water rights among users according to the criterion of economic efficiency. However, quantitative control has its drawbacks. A commonly mentioned one is that measuring and monitoring water use is very difficult and costly [
26]. Especially in developing countries, irrigation facilities are in poor condition, and agriculture consists of many small farmer households. Moreover, quantitative control lacks flexibility in response to changing circumstances. Once water quotas have been defined, it is difficult to readjust when water supply mismatches the water use [
12].
In China, reducing agricultural water use is one of major objectives of water policies. However, pricing irrigation water remains a controversial issue. It has been widely recognized that irrigation water charges have been very low for a long time and are insufficient to recover water supply costs [
2,
27]. The thrust of increasing the irrigation water price comes from the consideration of fully recovering water supply costs, as well as reducing water use [
16]. Huang
et al. (2010) revealed that demand for irrigation water is price elastic when incorporating resource constraints. When water price was increased to the level of the value of marginal product (VMP), farmers will respond to increases in water prices [
16]. On the other hand, many studies have also warned of the negative effects of a higher water price on crop production, farm income, food security and social inequality [
16,
27,
28,
29]. A higher water price often forces farmers to switch to low water consuming crops, which often have lower net profit [
9,
11,
13]. For example, Liao
et al. (2008) conducted an empirical analysis of the impacts of irrigation pricing reforms in the three irrigation districts in northern and southwestern China. They found that water price increases have perverse impacts on agricultural output and farm income. This is because under the current institutional setting and socio-economic conditions in the studied areas, farmers’ crop choices were not significantly responsive to water prices. The decrease in output and increase in production costs result in a decrease in net benefits to farmers and overall farmer income [
27]. The study by Shen
et al. (2010) in Xinjiang found that water management is deeply tied to the political, social and economic conditions of the state. Increasing water price has not contributed to a fairer and more efficient use of scarce water resources, but rather, it has been applied to achieve other political and economic goals, as well as to strengthen a powerful and rapidly growing bureaucracy [
30]. Webber
et al. (2008) pointed out that the inefficiency of farmers’ water use arises in large part from the manner in which water is delivered to them. The system offers no rewards for care in the use of water and, instead, rewards greed. Raising the water price without reforming the management system will affect farmers’ income and enlarge inter-sectoral inequity, with farmers becoming worse off in comparison to urban dwellers [
29].
In the literature, thus far, studies have focused mainly on water pricing and paid much less attention to the effect of quantitative control. Furthermore, assessment of the effectiveness of the correct price signal has not clearly distinguished groundwater and surface water. In rural China, the current irrigation charge for surface water is about 0.05–0.10 Yuan per m
3 (USD 1 ≈ Yuan 6.3 as of 2012), while the irrigation cost of groundwater is about 0.2–0.3 Yuan per m
3 [
16,
27]. Raising the surface water price to the level of VMP would cause several negative impacts on crop production and farm income compared to raising the groundwater price. Hence, the assessment of the effects of pricing control should distinguish between groundwater and surface water.
This study aims to assess the impacts of the price control and quota mechanisms on agricultural water use and associated changes in farm income. It compares the effectiveness of these two policy instruments in water scarce regions based on a case study of the Heihe River Basin in northwest China. The key focus is on the shadow price, which is estimated as the marginal product value based on the production function approach in the literature [
19,
20,
31]. The basic hypothesis is that the current water price is far below the shadow price. Farmers will not respond to water price change until it is raised to the level of the shadow price. However, raising the water price to the level of the shadow price will cause severe negative impacts on farm income and crop production. In the case of a water price far below the shadow price, a water quota mechanism might be more realistic and cost effective. A bio-economic model (BEM) is used to examine the shadow price of irrigation water and to simulate farmers’ behaviors in response to price control and quantitative control. The levels of compensation under the two policy measures are also examined. Compared with the production function approach in examining the shadow price, the advantage of the bio-economic model approach is to provide dynamic insight into water scarcity when the resource constraint changes.
Using the case study of Heihe River Basin, this study will specifically contribute to the relevant literature on the effectiveness of water pricing and water quota concerning water scarce oasis regions where reducing total water consumption in irrigation is the key. Meanwhile, our BEM model is constructed at the irrigation district level. The spatial variations of the impacts of the two policy measures on farm income and crop production in different irrigation districts will be examined explicitly. By quantitatively determining the shadow price and the effects of the two policy measures with consideration of spatial variations, this study will shed light on agricultural water management in water scarce regions and provide a reference for implementing compensation schemes to alleviate the negative impacts on farm income and food security.
2. Description of the Heihe River Basin
The Heihe River Basin is located in the central part of the Hexi Corridor. It is an inland river basin in northwest China and covers an area of approximately 128,000 km
2. The mean annual precipitation decreases from 250 mm to 100 mm from south to north. The middle stream and part of the upstream of the Heihe River Basin are located in Zhangye City of Gansu Province, and the downstream is located in the Ejin Banner of Inner Mongolia (
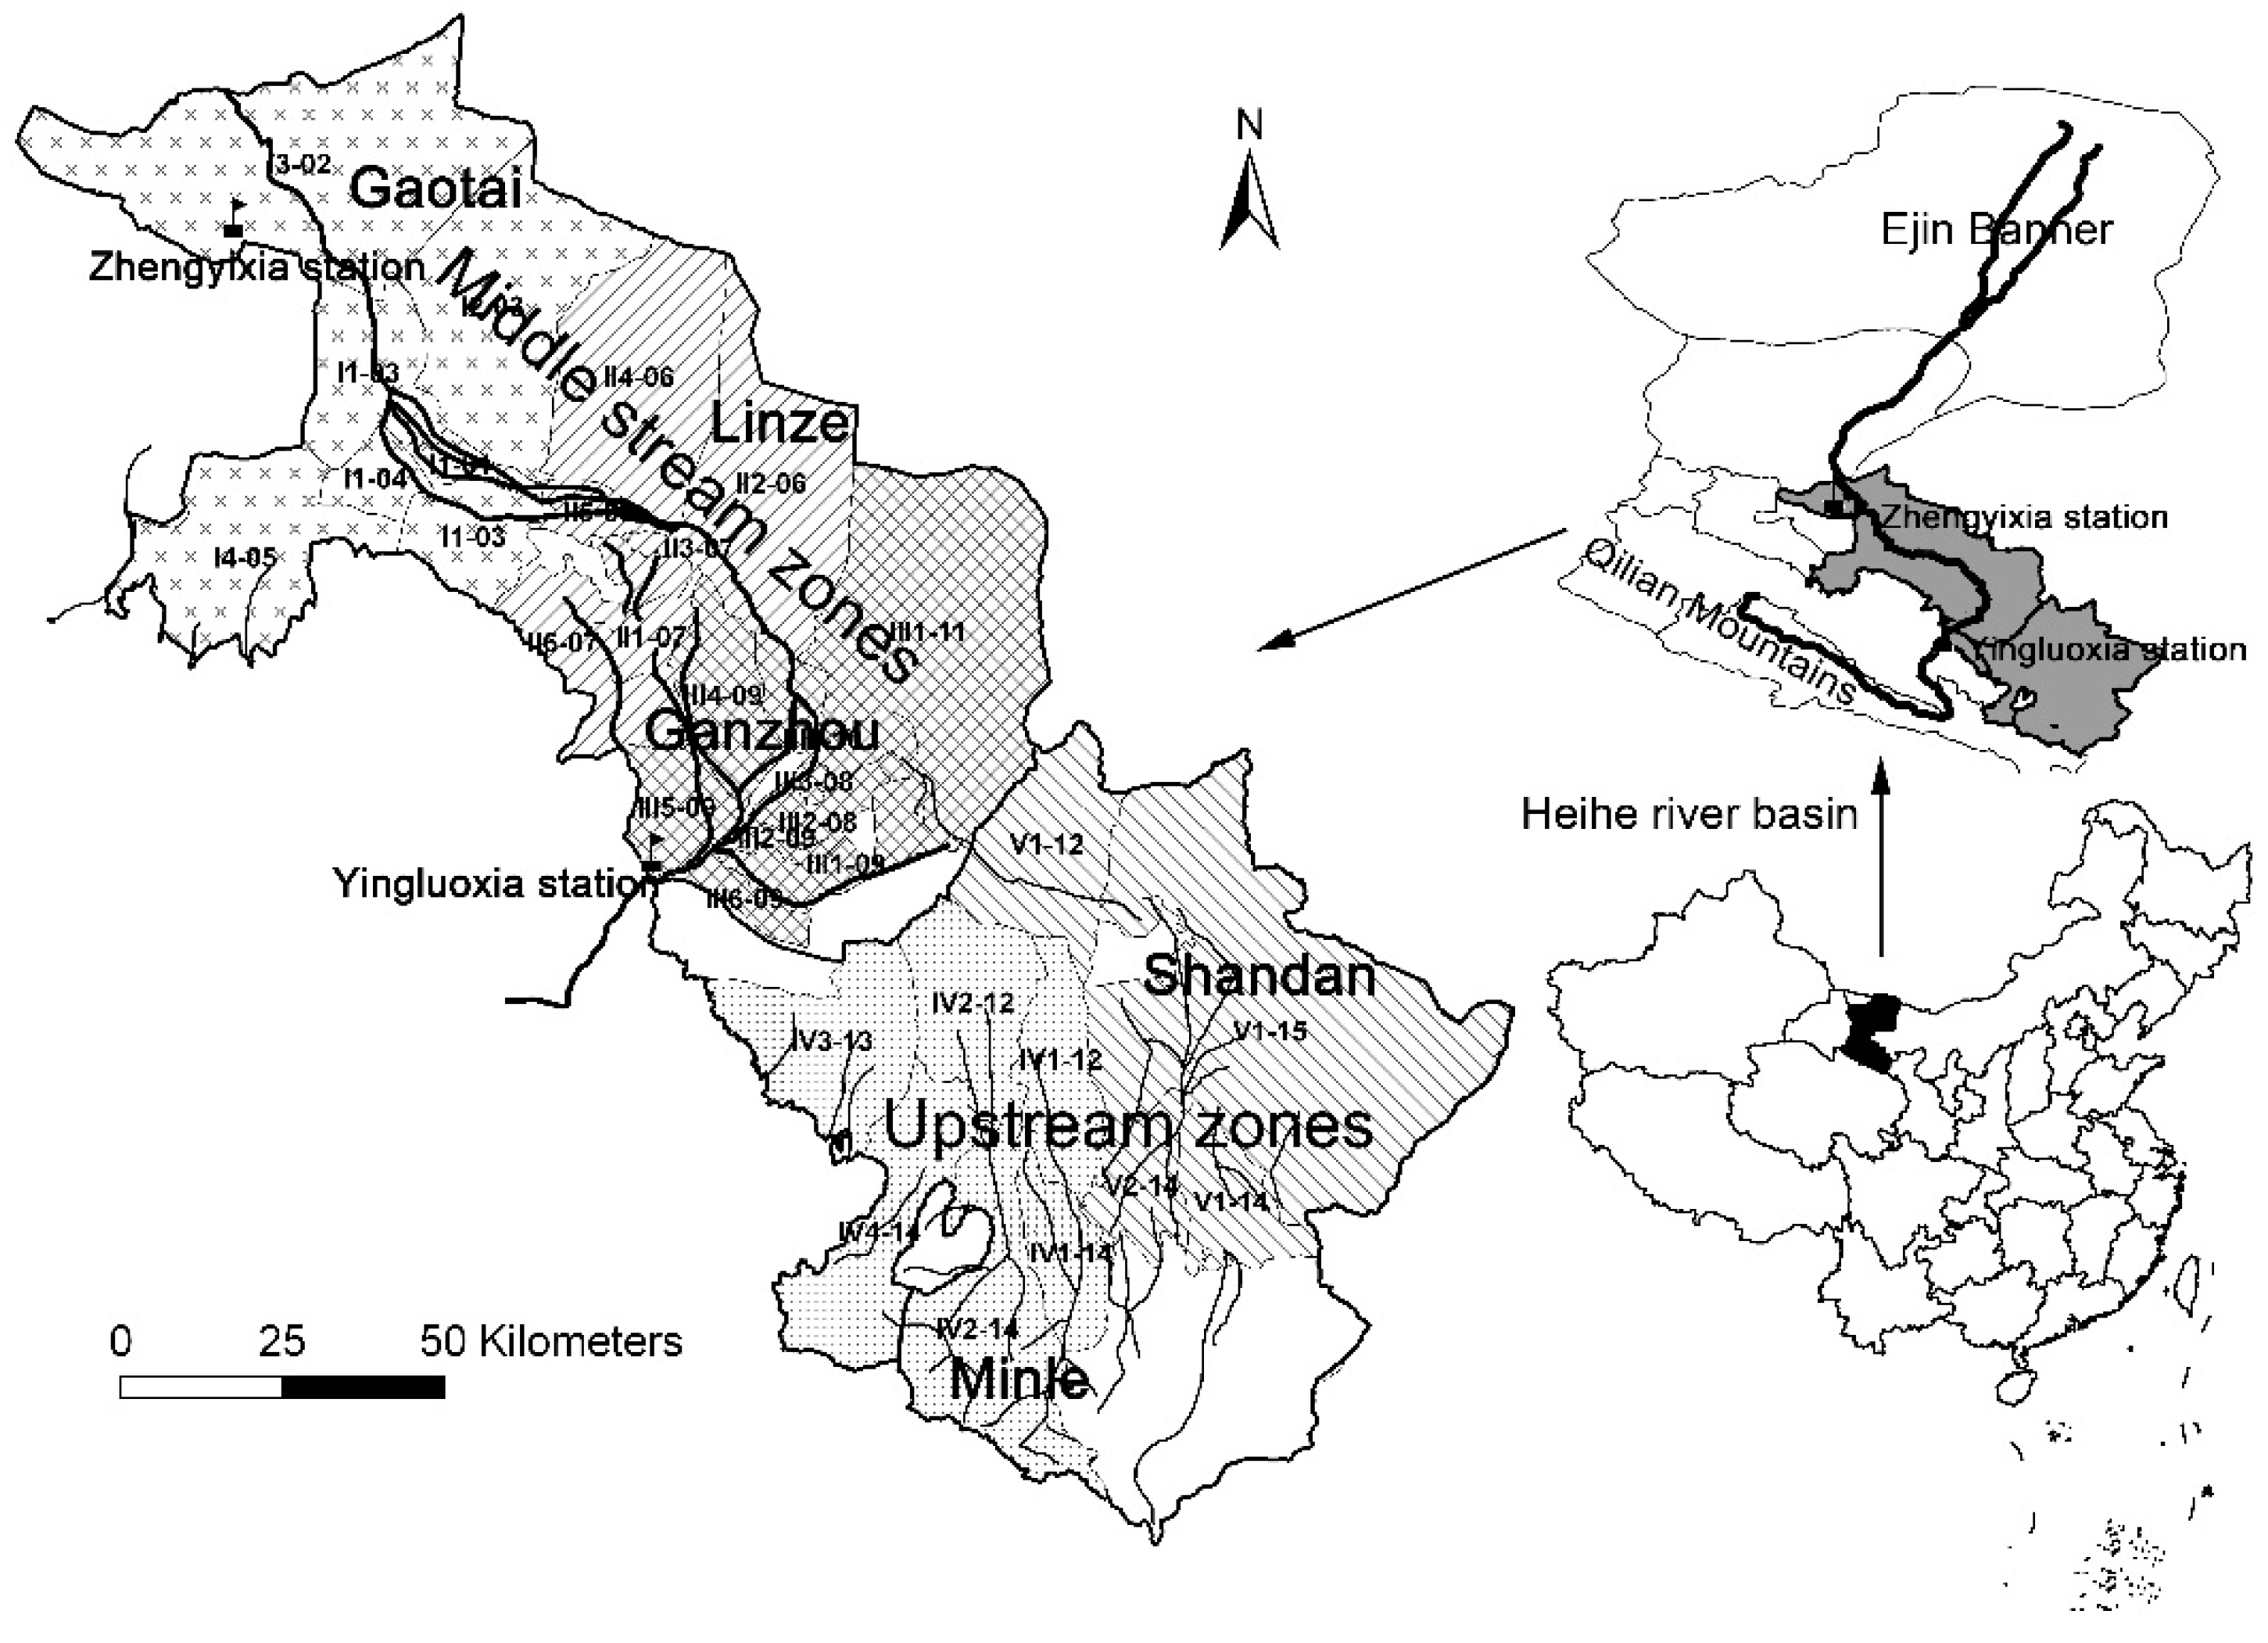
Figure 1). Zhangye City consists of six counties: Ganzhou, Linze and Gaotai in the middle stream of the Heihe River Basin and Minle, Shandan and Sunan Yugur autonomous county in the upstream. The upstream tributaries of the Heihe River Basin are independent and do not flow into the mainstream of the Heihe River.
Figure 1.
Location of the study site and 31 irrigation zones.
Figure 1.
Location of the study site and 31 irrigation zones.
Economic growth in Zhangye caused a rapid increase in water consumption of the middle stream, especially since 1980, and a decrease in river flows to the downstream regions. For example, the runoff at the Zhengyixia station has decreased from 1160 million m
3 per year in 1949 to 770 million m
3 per year in the 1990s, resulting in ecological degradation and desertification in the downstream regions of the Heihe River Basin. In order to increase runoff to the downstream regions, a water reallocation plan has been implemented in the Heihe River Basin since 2000. Water allocated to downstream regions is determined according to the runoff at Yingluoxia station in the middle stream. If the runoff at Yingluoxia station reaches 1580 million m
3, the runoff to the downstream regions should be 950 million m
3. This means a water allocation of 630 million m
3 to the middle stream. However, water consumption in the middle stream in 2000 was about 1150 million m
3, including 310 million m
3 from groundwater. Therefore, the middle stream needs to reduce water use to comply with the allocation plan. To reduce the water consumption, a “water-saving society plan” has been implemented since 2002. The concrete measure includes adjusting cropping system, extending water-saving irrigation, reducing irrigation quota, introducing water use permit and water use rights transactions and reducing water loss in irrigation [
1,
32].
During the past decade, there were significant changes in the cropping system in the Heihe River Basin. Breeding of seed corn and vegetables increased, while the corn-wheat intercrop area decreased. The total sowing area increased steadily, even after 2002. Because of relatively higher water productivity and net profit of seed corn, the substitution for the corn-wheat intercrop has led to an increase in farm income. However, the total irrigation water consumption of Zhangye did not decrease during the past decade, because the saved irrigation water was used for growing vegetables and other crops. One of the reasons is that irrigation water allocation was not strictly implemented. The actual water consumption of Zhangye was 1383 million m3 in 2008, much higher than the allocated water of 1054 million m3. As a result, the runoff to the downstream is less than the entitled amount in the water allocation plan.
The experience of the Heihe River Basin indicates that improvement of water productivity does not necessarily lead to a decrease in water use. Farmers’ behavior to pursue the maximization of profit drives them to use saved irrigation water for growing vegetables and other crops. The loose enforcement in irrigation water allocation also offset the effects of water-saving efforts [
3,
33].
On the other hand, continuous industrialization and urbanization have generated persistent increasing demand of water. According to the Zhangye five-year economic development plan, the industrial water use at the middle stream regions is projected to increase by about 77 million m3 by 2015 and 273 million m3 by 2020. The total industrial water use will reach 106 million m3 in 2015 and 302 million m3 in 2020. To meet the increasing industrial water demand, agricultural water use has to be reduced. A more strict regulation on water demand is needed in the Heihe River Basin. The Zhangye Water Bureau is considering doubling the irrigation water charge in order to cut irrigation water use.
3. Analytical Framework
3.1. Characterization of Quantitative Control and Price Control
Quantitative control and price control have different characteristics in regards to their effectiveness in reducing water use and impacts on farm income and food production. The shadow price plays a key role in determining the effects of price control on water demand. The shadow price is defined as the rate of change of the optimal value function with respect to the change of the amount of a resource. It can be calculated by means of the duality theory of linear programming. The shadow price reflects the scarcity of resources and the marginal benefit of resource use [
34].
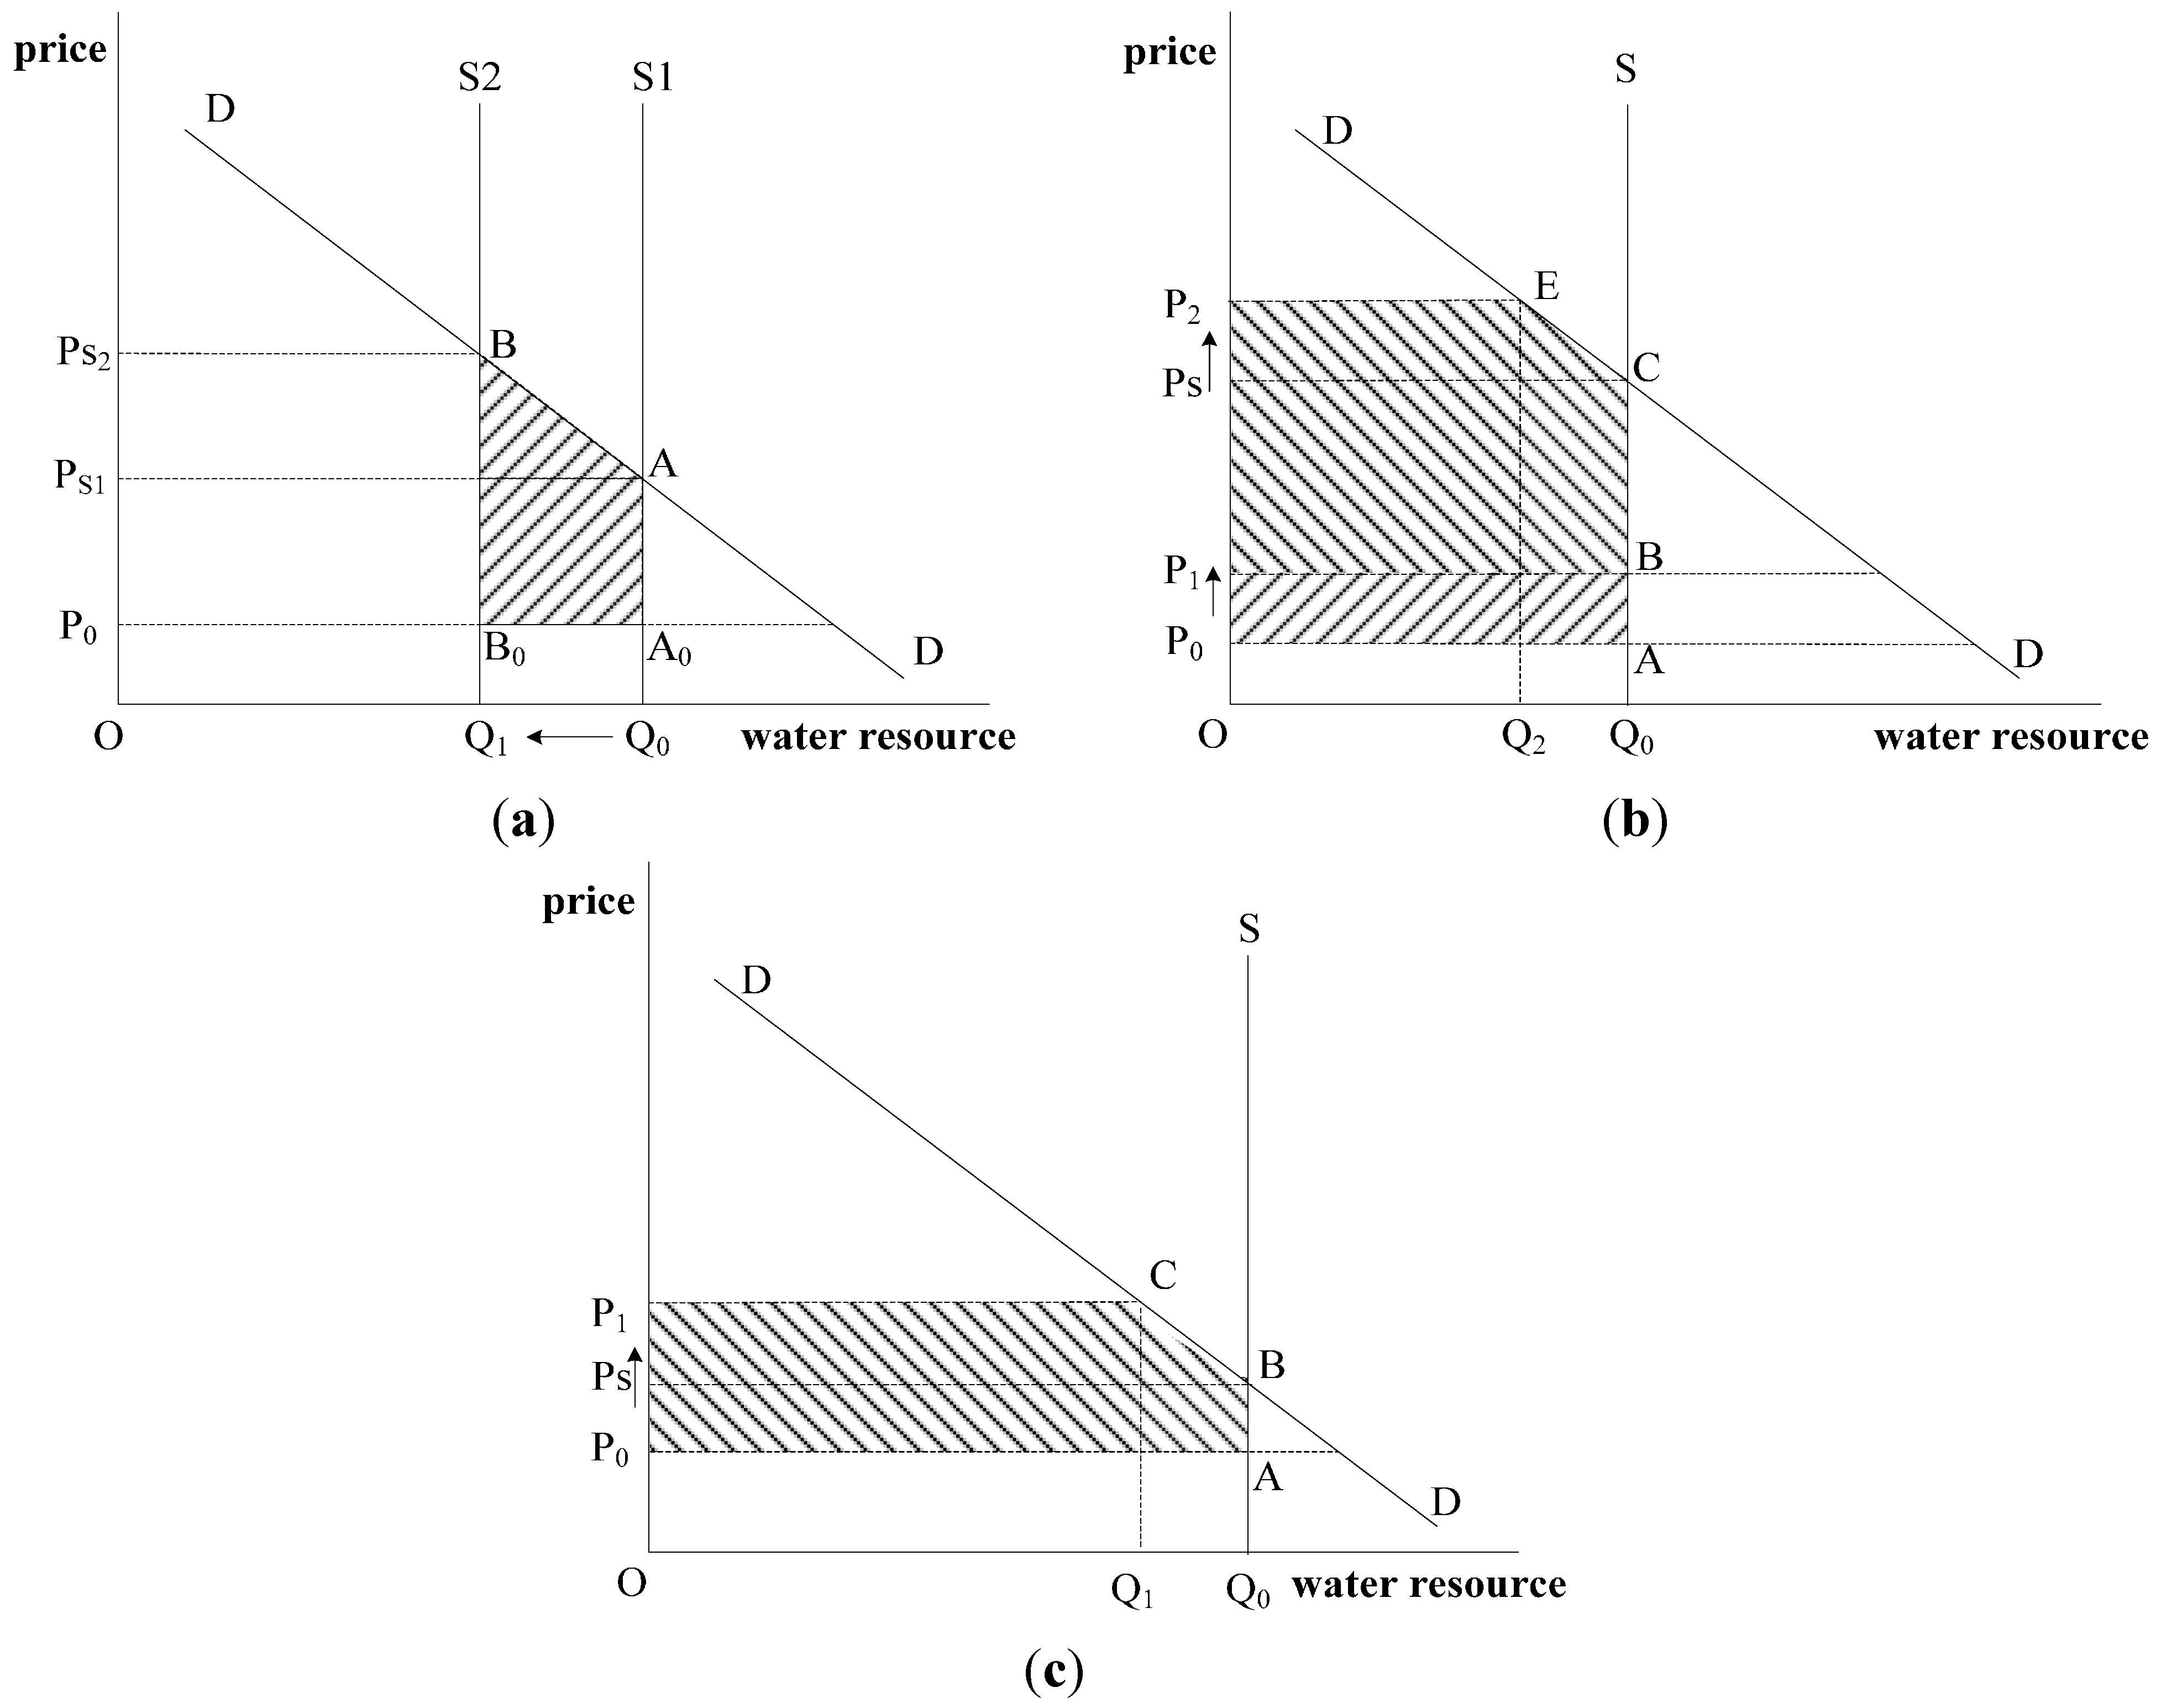
Figure 2 illustrates the effects of quantitative control and price control. Reducing the water quota may directly bring a decrease in water use. If water allocation was reduced from Q
0 to Q
1, it will lead to a benefit loss ABB
0A
0 (the shadow part in
Figure 2a), when water price is kept as P
0. Meanwhile, the shadow price of water resources will rise from P
s1 to P
s2.
Figure 2.
The effects of quantitative and price controls. (a) Quantitative control (reduction of water quota); (b) price control-high shadow price; (c) price control-low shadow price.
Figure 2.
The effects of quantitative and price controls. (a) Quantitative control (reduction of water quota); (b) price control-high shadow price; (c) price control-low shadow price.
The effects of the price control vary in two cases, according to the relationship between the existing water price and the shadow price. When water price P
0 is far below the original shadow price P
s (
Figure 2b), raising water price P
0 to level P
1 has no effect on water use (keeping Q
0 constant), but the benefit will decrease by P
0ABP
1. Only when the water price is raised from P
0 to P
2, which is higher than the shadow price, water use will decrease from Q
0 to Q
2. In this case, the concomitant benefit loss of P
0ACEP
2 (the shadow part in
Figure 2b) will be quite large. In the case of water price P
0 close to the shadow price P
s (
Figure 2c), a water price rise from P
0 to P
1, which is higher than the shadow price, water use will decrease from Q
0 to Q
1. This will cause a benefit loss of P
0ABCP
1 (the shadow part in
Figure 2c).
3.2. The Bio-Economic Model
In this study, a bio-economic model (BEM) is developed to link household economic activities with crop production activities. The BEM model can simulate household behaviors to pursue profit maximization under certain resource constraints [
35,
36]. The definition of variables in the BEM model is given in
Table 1.
The objective function consists of the production decision and marketing decision. In the case study areas, most farmers earn their livelihood through household businesses by using family labor. Meanwhile, they consume a portion of the products produced on the farm. Consequently, households make a combined decision on production and consumption under the constraints of their resource endowment. Hence, the production decision and consumption decision are incorporated simultaneously into the overall objective function. Usually, crop production and livestock production are combined in farm households, as crops provides feed to livestock and livestock provide organic fertilizer for crop production. Therefore, in the BEM model, the decision variables include the crop mix distribution, livestock structure and consumption structure. Farmers determine the crop mix distribution, e.g., the area (Acg) devoted to each activity (crop c) and the number of each domestic animal (livestock V). Furthermore, farmers determine their purchases of consumption goods combined with self-sufficient food production.
In this study, the BEM model uses the Leontief production function of crop and livestock, which is constructed based on the Leontief input-output coefficients. The Leontief production function deals with productive technology as a nexus of varied inputs. The input-output coefficients of crop production include seeds, irrigation, fertilizer, pesticide, labor force, capital, and so on. The livestock inputs include feed, fodder, labor, capital, and so on.
Table 1.
Variable definitions.
Table 1.
Variable definitions.
| Variables | Explanation | Variables | Explanation |
|---|
| M | Net income | N | Amount of available loan |
| M0 | Cash income in the base year | D | Subsidy to farmers |
| x | A vector of inputs used in production of crop c or livestock v | i | Type of vectors of input x |
| g | Land type of cultivated land | c | Crop |
| A | Land endowment | P | Price of crop output, livestock output or purchased food |
| Ar | Area of rangeland | Acg | Area of crop c produced on land type g |
| v | Livestock | ycg | Yield function for production of crop c on land type g |
| Lv | Stock level of livestock v | yv | Yield function for livestock v and livestock product |
| ei | Per unit input cost for input xi | yr | Grass yield of rangeland |
| j | Type of purchased food | f | Purchased food |
| zf | Family labor used on-farm | Zh | Total family labor |
| Zf | Total farm labor input | wk | Wage for hired labor |
| w0 | Wage for off-farm labor | hk | Hired labor used on-farm |
| z0 | Family labor used off-farm | α | Daily fodder requirement of livestock v |
| γ | Daily subsistent nutrition requirement of human | β | Nutrition content of food |
| H | Human population | T | Supplementary fodder from crop residue |
| b | Crop or livestock output y used for self-consumption | S | Crop or livestock output y used for self-supply, such as seed, feed, draft animal |
| W total | Total available water resources | Ws | Allocated surface water based on quota |
| Wg | Available groundwater resources | inf | Infiltration of mainstream |
| et | Evaporation of runoff | cf | Canal use efficiency coefficient |
| Qcg | Water quota of crop c on land type g | Qv | Water quota of livestock v |
In the BEM model of the Heihe River Basin, three types of cultivated land are considered: rice field, plain land and hilly land. Twenty kinds of crops are included. The yield of crops depends on land type, the input level of labor, fertilizer (including manure), irrigation, seeds and pesticides. Irrigation water is dealt with as the input of production activities and is very important for determining crop yield in the region. The irrigation water charge per unit hectare is given exogenously. Water input can be derived endogenously according to irrigation water cost and output prices. The shadow price of water resource derived from the BEM model implies the marginal product value of irrigation water under the constraint of the available water resource. Livestock activities include five kinds of animals: sheep, cattle for breeding, cattle for producing beef, pig and poultry. The purpose of crop and livestock products includes sale, self-consumption and self-supply activities. The model also contains the purchase of staple food, vegetable and meat for household consumption and seeds, fertilizers, irrigation water and feed for crop and livestock production.
The mathematic forms of the objective function with maximizing net income and constraints are provided below:
The constraints of resource endowment include land area (Equation (2)), family labor (Equations (3) and (4)), livestock feed requirement (Equation (5)), nutritional requirement (Equation (6)), capital (Equation (7)), water resources (Equations (8) and (9)) and crop rotation. Under the capital constraint, the aggregation of cash, loans and subsidies for greenhouse production provides capital for all production activities. Under the constraint of the nutritional requirement, the minimum nutrition needs for a family member should be met by self-sufficient and purchased foods. Under the constraint of irrigation water, surface water and groundwater are allocated between water-intensive crops, such as vegetables, wheat-maize intercropping and water-efficient crops, such as seed corn and cotton.
The BEM model is usually constructed at the household level or village level. This study constructed a GIS-based BEM to illustrate the spatial variations of farmers’ response to the water demand control measures and to examine their impacts on farm income and crop production at the irrigation zone level. Of the total of 31 irrigation zones in the Heihe River Basin, 20 irrigation zones are in the middle stream region and 11 irrigation zones in the upstream region (
Figure 1). A spot model is built at the irrigation zone level, and each irrigation zone consists of several villages that have a similar cropping system. The model assumes that all famers act rationally in the same manner within an irrigation zone. They will maximize their profits, assuming perfect knowledge and foresight. In the short run, production technologies are assumed to be fixed, and the mix of activities on the farm cannot be changed, so that the Leontief production function is adoptable. Resources endowment and production activities vary among different irrigation zones. The 31 spot BEM models were integrated into a distributed BEM model at the river basin level through a GIS platform. A tradeoff of water resource allocation exists across irrigation zones. The GIS-based BEM model simulates farmers’ decisions according to the spatial and geographic diversity of the water supply and the crop structure across 31 different irrigation zones.
It should be noted that irrigation water reallocation has taken place only in the middle stream regions, because the upstream regions are independent of the mainstream of the Heihe River.
3.3. Data Source and Data Description
In this study, two kinds of parameters are used in the BEM model: resources endowment and input-output coefficients of crops and livestock. The data for the land resource in each irrigation zone are from the statistics data of the research site in 2008, and the data for the water resource and water reallocation plan of the Heihe River Basin are from the Water Resource Official Reports, published every year by the Water Affair Bureau of Zhangye. The dataset for input-output coefficients are obtained by a field survey, which was conducted in August, 2009. It covered 570 households in 45 villages of the five counties in the river basin. The households are chosen by a stratified-random sampling method across 31 irrigation zones. The survey data include crop yield, crop price, fertilizer, pesticide, labor input, subsidies, and so on. Among them, irrigation water input is one of the most important items. Farmers are asked to recount the average length of irrigation time, irrigation times for each crop and the water fee per hectare. Hence, the volume of water applied for each crop can be estimated accurately. The data description of the sampled households is shown in
Table 2.
Table 2.
Data description of the sampled households.
Table 2.
Data description of the sampled households.
| | Middle Stream Region | Upstream Regions |
|---|
| Ganzhou | Linze | Gaotai | Minle | Shandan |
|---|
| Sampled villages | 14 | 6 | 9 | 10 | 6 |
| Householder | 138 | 108 | 113 | 63 | 90 |
| Population (person) | 581 | 425 | 449 | 265 | 439 |
| Cultivated land (ha) | 79 | 89 | 68 | 73 | 110 |
| Labor (person) | 281 | 208 | 209 | 117 | 201 |
| Proportion of farm labor (%) | 46 | 54 | 67 | 39 | 35 |
| Proportion of Off-farm labor (%) | 54 | 46 | 33 | 61 | 65 |
| Income per capita (Yuan/person) | 9913 | 10,867 | 10,917 | 10,799 | 9663 |
| Proportion of agriculture income (%) | 35 | 50 | 38 | 48 | 35 |
| Proportion of off-farm income (%) | 65 | 50 | 62 | 52 | 65 |
| Crop structure | | | | | |
| Grain crops (%) | 18 | 11 | 24 | 36 | 37 |
| Cash crop (%) (including seed corn) | 57 | 75 | 51 | 36 | 41 |
| Other crops (%) | 25 | 14 | 25 | 29 | 22 |
3.4. Model Calibration
In order to calibrate the BEM model, the “present situation” is set as the baseline to compare with the actual situation in 2008. The simulation results of the calibrated model under “present situation” situation are quite consistent with the actual situation in 2008. The overall bias between the simulation results and actual situation for the sewing area is 17%, and the bias for the crop area in 70% of the irrigation zones is below 20%. It is found that the model results are sensitive to the constraints of crop rotation, farm-gate prices, capital input for cattle and subsidies for greenhouse vegetables. The deviation between the simulation results and actual situation may be partially from risk attitude. The model assumed that farmers are economically rational and pursue the maximization of net return. While in the actual world, farmers often avoid risk. For example, our field survey showed that households tend to be reluctant to adopt new agricultural technologies, even when the expected net return is high. Furthermore, households prefer to plant disease-resistant, but low-yielding crops or to plant more drought- and cold-resistant varieties of crops in preparation for an adverse weather event, as they are more sensitive to potential losses than to potential gains.
5. Main Findings and Conclusions
This study examined farmers’ response to policy instruments for water demand management and compared the effects of quantitative control and price control on farm income and crop production in the Heihe River Basin. The main findings are summarized below:
Firstly, in water scarce regions, where the current price of irrigation water is far below the shadow price of water resources, farmers are generally not responsive to a relatively small water price increase. Reducing water demand requires a large price rise for irrigation water, which will lead to a big loss of farm income and high negative impacts on crop production. As the total income loss due to the increasing water charge cannot be compensated fully by only returning the additional water charge to the farmers (
Table 5), the government would have to bear with the difference, which can be a significant fiscal burden to the local government.
Secondly, compared with price control, the quantitative control measure can save an equal volume of water with a lower cost. This indicates that quantitative control is more cost-effective for the purpose of reducing water use in agriculture. The amount of compensation to cover the total income loss is lower for the quantitative control than for price control measure. As the transferred water volume is known under the quantitative control measure, the farmers’ income losses (including opportunity cost) can be compensated for by the industries that receive the transferred water. The local government needs just to recover the losses from irrigation water fee for the water supply bureaus. Under the price control measure, the reduction of irrigation water use is unknown in advance. The local government needs to pay income compensation to farmers in advance and then impose a water fee on the industries that use the transferred water. The transaction cost could be high.
Thirdly, in relatively water-rich regions, where the current price of irrigation water is close to the shadow price of water resources, farmers will be responsive to a price change when the water price is raised to the level of the shadow price. In this case, the price control measure may be a realistic choice to induce water saving. The price increase of irrigation water will cause a relatively small negative impact on farm income and crop production.
Finally, although the simulation results support the quantitative control measure, decision makers need to examine the tradeoffs by taking into account feedback from stakeholders, including farmers, agricultural technicians and local governmental officials.


