Article

Factor Analysis of Residential Energy Consumption at the Provincial Level in China

1
School of Economics and Resource Management, Beijing Normal University, Beijing 100875, China
2
China Energy Research Society, Beijing 100045, China
3
School of Environment, Beijing Normal University, Beijing 100875, China
*
Author to whom correspondence should be addressed.
Sustainability 2014, 6(11), 7710-7724; https://doi.org/10.3390/su6117710
Submission received: 30 August 2014 / Revised: 15 October 2014 / Accepted: 20 October 2014 / Published: 3 November 2014
(This article belongs to the Special Issue Sustainability in China: Bridging Global Knowledge with Local Action)

Abstract

:
This paper analyzes the differences in the amount and the structure of residential energy consumption at the provincial level in China and identifies the hidden factors behind such differences. The econometrical analysis reveals that population, economic development level, energy resource endowment and climatic conditions are the main factors driving residential energy consumption; while the regional differences in energy consumption per capita and the consumption structure can be mainly illustrated by various economic development levels, energy resource endowments and climatic conditions. Economic development level has a significant positive impact on the proportion of gasoline consumption, whereas its impact on the proportion of electricity consumption is not notable; energy resource endowment and climatic condition indirectly affect both the proportion of electricity consumption and that of gasoline consumption, primarily through their impacts on the proportions of coal consumption and heat consumption.

1. Introduction

The residential energy consumption of China in 2012 was about 400 million tons of coal equivalent, which approximately equals the total amount of energy consumption of Brazil in the same year and comprises 11% of the year’s total energy consumption. China is a fast developing country with a vast size, and there are great differences in both the amount and structure of residential energy consumption at the provincial level. However, few studies focus on China’s residential energy consumption, especially at the provincial level. Thus, there is a need for the identification of critical factors resulting in the regional differences in residential energy consumption.
From a macro point of view, national and regional energy consumptions are often handled considering the impact of income, climate, energy prices, population and other factors on residential energy consumption [1]. Nesbakken [2] studied the impact of energy prices on residential heating equipment and energy consumption during the period 1993–1995 in Norway and points out that price has a significant impact and that high-income households are more sensitive to energy prices than low-income families. Using the panel data of 50 U.S. metropolitan areas from 1997 to 2007, Alberini [3] identified the factors that affect resident’s demand for electricity and natural gas and holds that, in either the long or short term, energy price is a major factor, and there is a strong correlation between demand and price, as well. Lenzen et al. [4] depicted the residential energy consumption changes in Australia, Denmark, Brazil, India and Japan and find that such changes do not match what is supported by the Kuznets hypothesis, concluding that there is no consistent relationship between energy demand and residential income. Results from Sarak et al., Isaac et al. and Zhu et al. revealed that fuel consumption is affected by heating degree days, and climate warming in the future would lead to less residential fuel, but more electricity consumption [5,6,7]. Zhang examined the relationship between the unit energy consumption and heating degree-days for China, Japan, Canada and the United States [8]. Pachauri and Jiang [9] compared the household energy transitions in China and India and find that residential energy consumption both in aggregate and per capita terms in China is twice that in India, while Indians derive a slightly larger fraction of their total household energy needs from liquid fuels and grids than Chinese with comparable incomes. Besides, Nakagami et al. [10] surveyed the residential energy consumption and its indicators in 18 countries and demonstrate that household energy consumption per capita shows a trend toward saturation in Western countries, but it will continue to rise in Asian countries [10].
Residential energy consumption has also been studied primarily through questionnaire surveys. Brounen [11] studied residential energy consumption behavior from the perspective of resource conservation. The sample data of more than 300,000 households in the Netherlands reveal that residential natural gas consumption is mainly determined by residence features, such as construction year, building type, etc.; while electricity consumption is determined by residential factors, such as income, age structure of family members, etc. Using the U.S. 2009 residential energy consumption survey (RECS) micro-data, Tsoand and Guan [12] confirmed the statistically significant impacts of division groups, single-family detached housing, house size, usage of space heating equipment, household size and usage of air-conditioners on residential energy consumption [12]. Heinonen and Junnila [13] employed the household budget survey data of Finland and demonstrate that behavioral differences seem significant between different housing modes and that each housing mode appears to be less energy-intensive in rural areas.
Regarding the residential energy consumption issues of China, Chen [14] conducted a co-integration analysis and argued that actual expenditure is a dominant factor among the factors the affecting residential energy demand and that urbanization and changes in energy consumption structure have little effect on residential energy consumption. Nie et al. [15] undertook a decomposition analysis of changes in energy consumption by Chinese households and argued that the increase in energy-using appliances is the biggest contributor followed by floor space per capita, while population is the most stable factor and energy mix is the least important factor. Zhao et al. [16] and Qin [17] decomposed the factors that have an impact on residential energy consumption by using the logarithmic mean Divisia index and conclude that population, household income, energy efficiency and structure directly affect residential energy consumption, and especially, the factor of income contributes the most. Particularly, Zhao et al. [16] also pointed out that the current energy structure is undergoing an intensive change promoting the usage of high-quality and cleaner energy, such as electricity and natural gas. Chen et al. [18] analyzed the data of residential energy consumption in Hangzhou and find that the resident age structure has more influence than income. Fu et al. [19] conducted a micro-demographic analysis on residential energy consumption in China and indicated that population change, urbanization and aging are sensitive, while population age is not, except for the 60+ age group. Golley [20] extended the notion of household energy consumption by including indirect energy requirements, then examined the extent of variation in total energy requirements and emissions across households with different income levels in China and, finally, identified that, while richer households do indeed emit more per capita, poorer households tend to be more emissions-intensive.
With regards to rural areas of China, Xu [21] analyzed the residential energy consumption and its structural changes and suggested that income level, merchantability, energy quality and renewability determine the residential energy consumption level of rural households and the consumption structure in China. Lou [22] and Zhang et al. [23] studied rural residents’ selection behavior in energy consumption, and the results reveal that household wealth, resources availability and the level of education and other household characteristics are the principal factors that determine the level and the structural change of China’s energy consumption. Li et al. [24] discussed the current status and the regional differences of residential energy consumption in rural China and indicated that significant regional differences exist in the level of residential energy consumption of rural areas, with a gradually decreasing trend along the north-southwest axis of China. Lun et al. [25] reported the findings of field surveys in forest villages in Weichang County as a case study of rural energy consumption in northern China and find that local climate, family size and household income have strong influences on rural residential energy consumption. Suo [26] analyzed the residential energy consumption of rural Beijing, implying that the population is a major influence factor and that the energy-saving transformation can effectively reduce the energy consumption quantity.
As mentioned above, there is still a lack of research on regional differences of the residential energy consumption structure and on the factors causing such differences. This paper thereby uses provincial-sectional data of China to explore the regional differences in residential energy consumption and adds climate condition as an explanatory and supplementary factor to the other factors mentioned in previous studies. Meanwhile, it examines the impacts on energy consumption structure brought by the economic development level, energy resource endowments and climatic condition. Therefore, this paper would fill the gap of the lack of a database and help with understanding Chinese residents’ energy consumption status.
This paper is organized as follows: Section 2 describes the data and methodology; Section 3 shows the empirical results and some discussions; and Section 4 summarizes the main findings.

2. Data and Methodology

2.1. Data

This study uses panel data of residential energy consumption of China’s 28 provinces in 2011. The data of energy consumption are from the China Energy Statistical Yearbook 2012. The electricity and gasoline consumptions are derived from the regional energy balance table of the China Energy Statistical Yearbook 2012. The data of population, GDP, urbanization rate, average temperature and energy resource endowment are obtained from the China Statistical Yearbook 2011 and China Statistical Yearbook 2012. The mid-year population, the average of year-end population, is treated as population in this paper. GDP per capita is the ratio of gross domestic product in the 2011 price to the mid-year population. Given that this paper is only concerned with the case in year 2011, the GDP figure is taken directly without price adjustment. The urbanization rate is the percentage of residents living in urban areas for more than 6 months in a year. Since coal plays a primary role in China’s energy production and consumption, regional coal reserves are used to represent the region’s energy resource endowment. Due to the failure of finding an indicator of average temperature in a province, the average temperatures of the province in January and in August are approximated by the average temperatures of the provincial capital city in these two months, respectively.

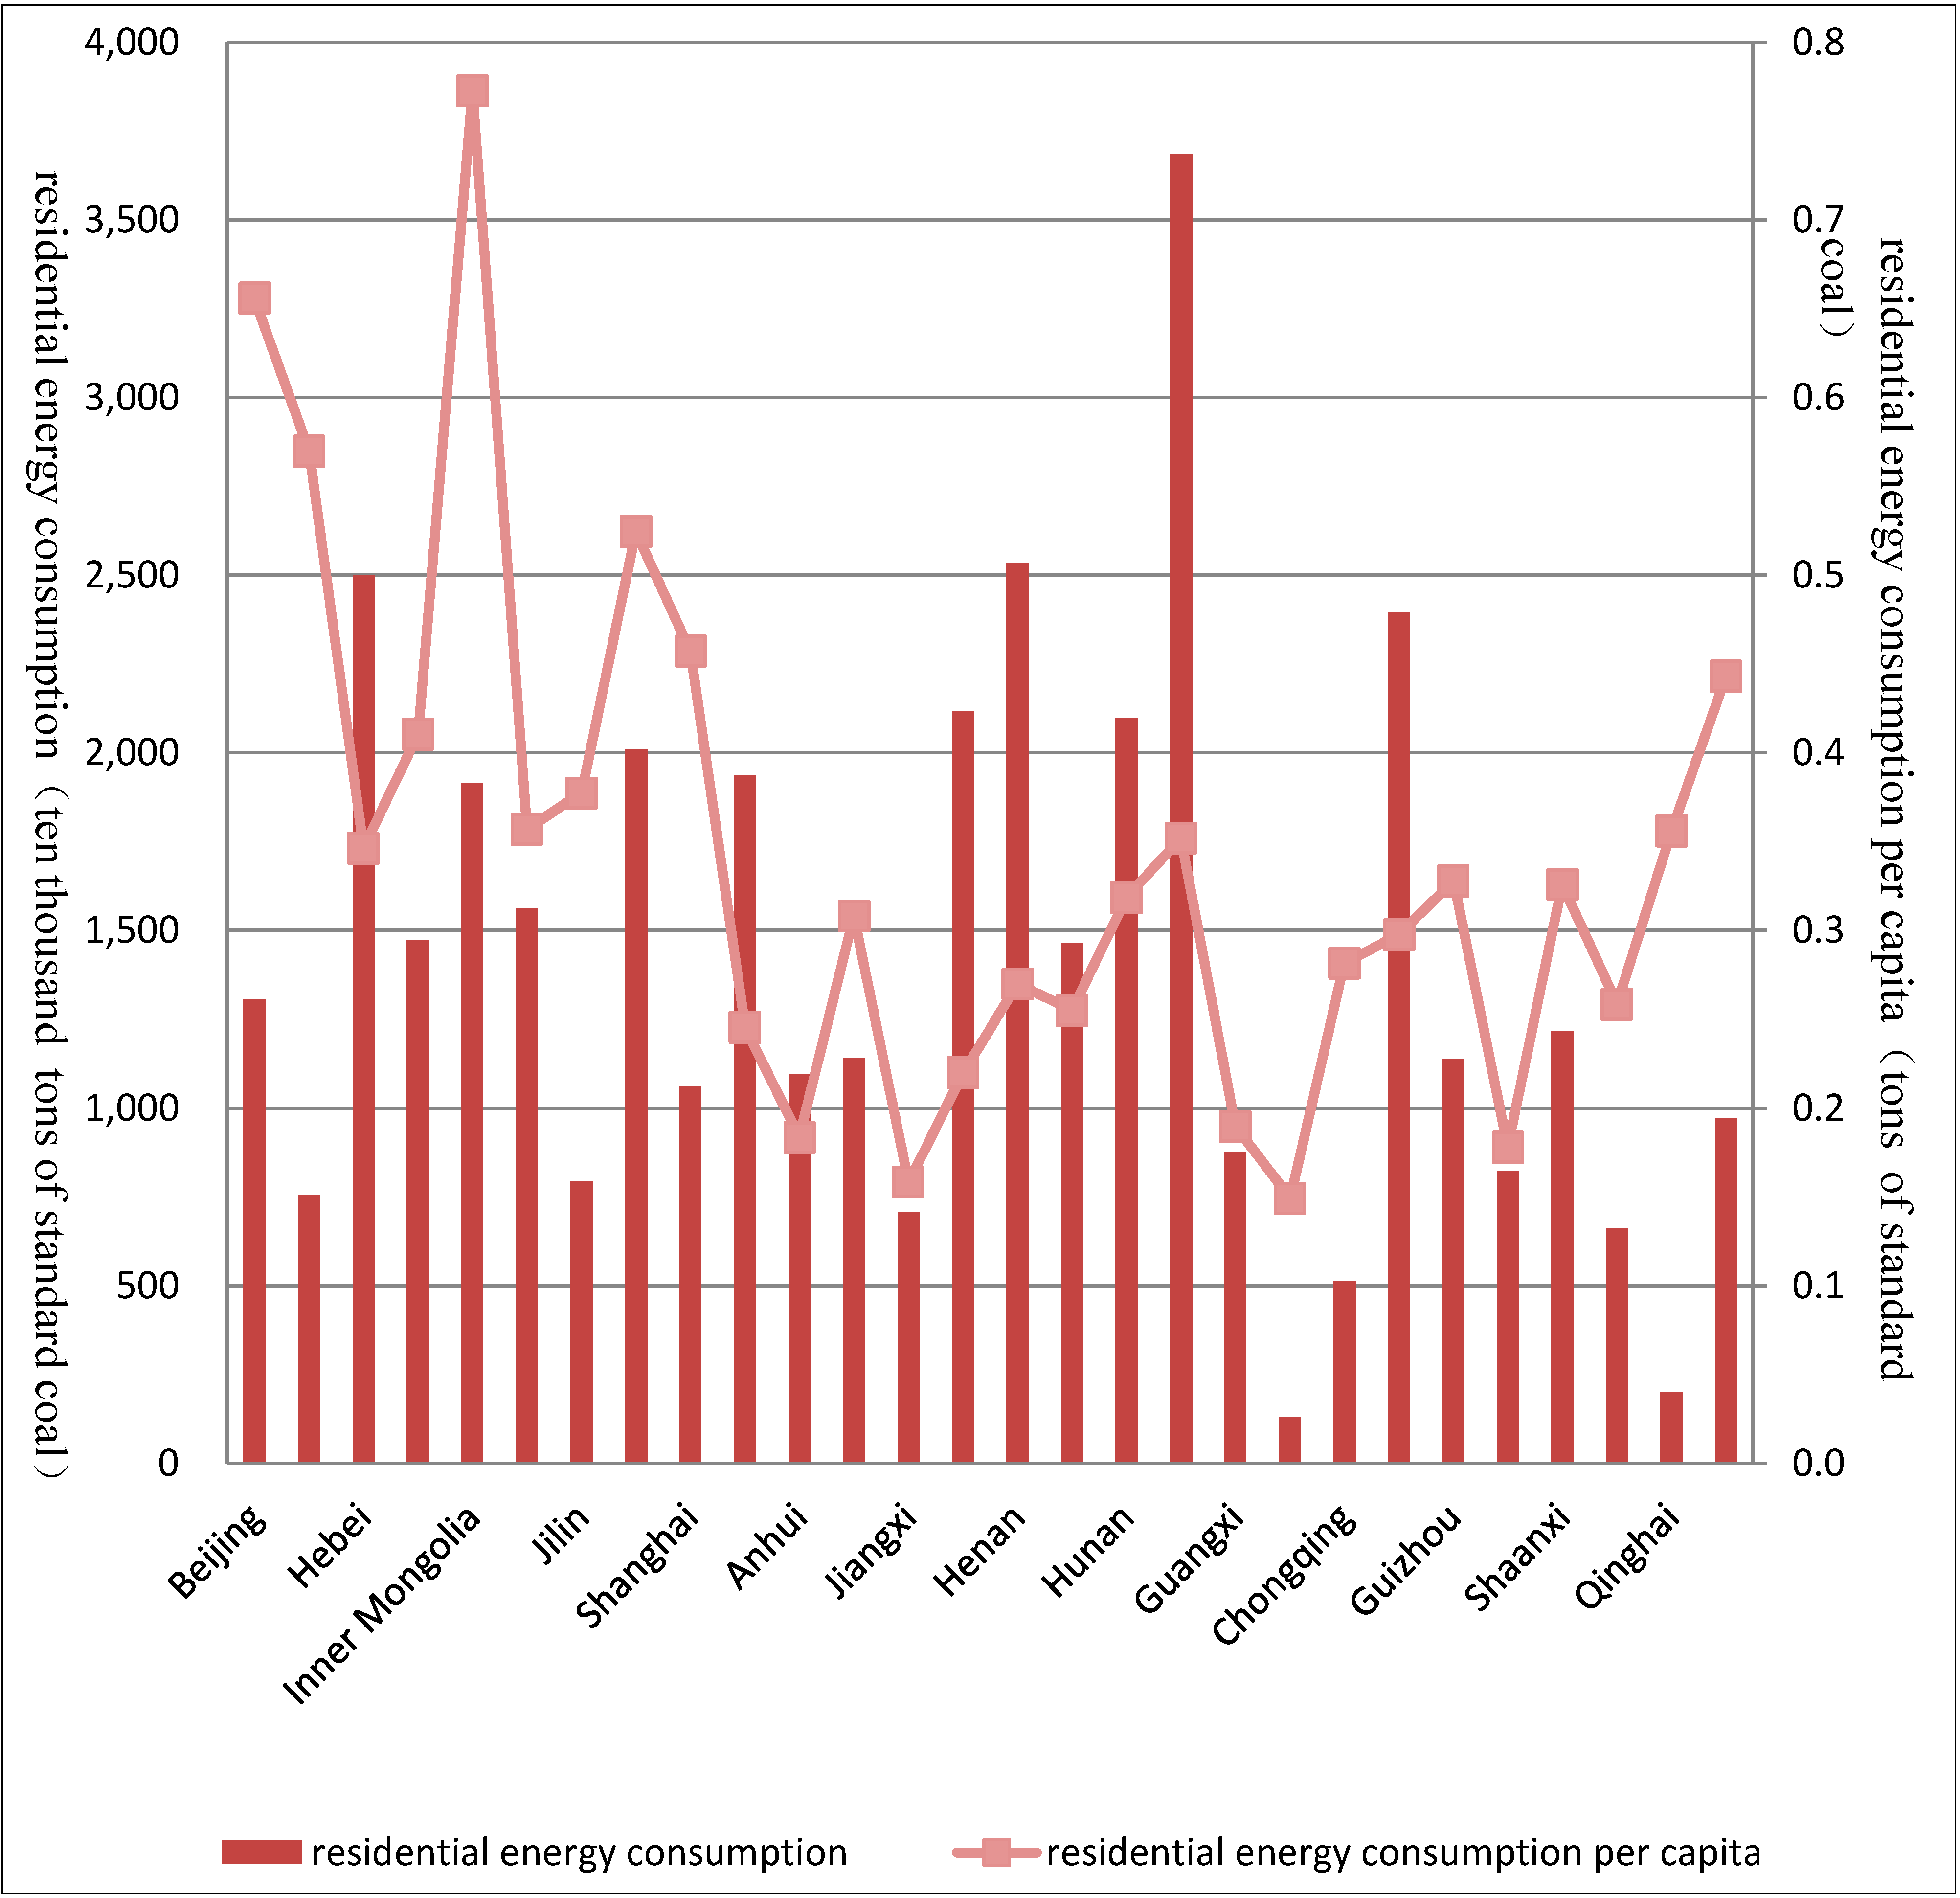
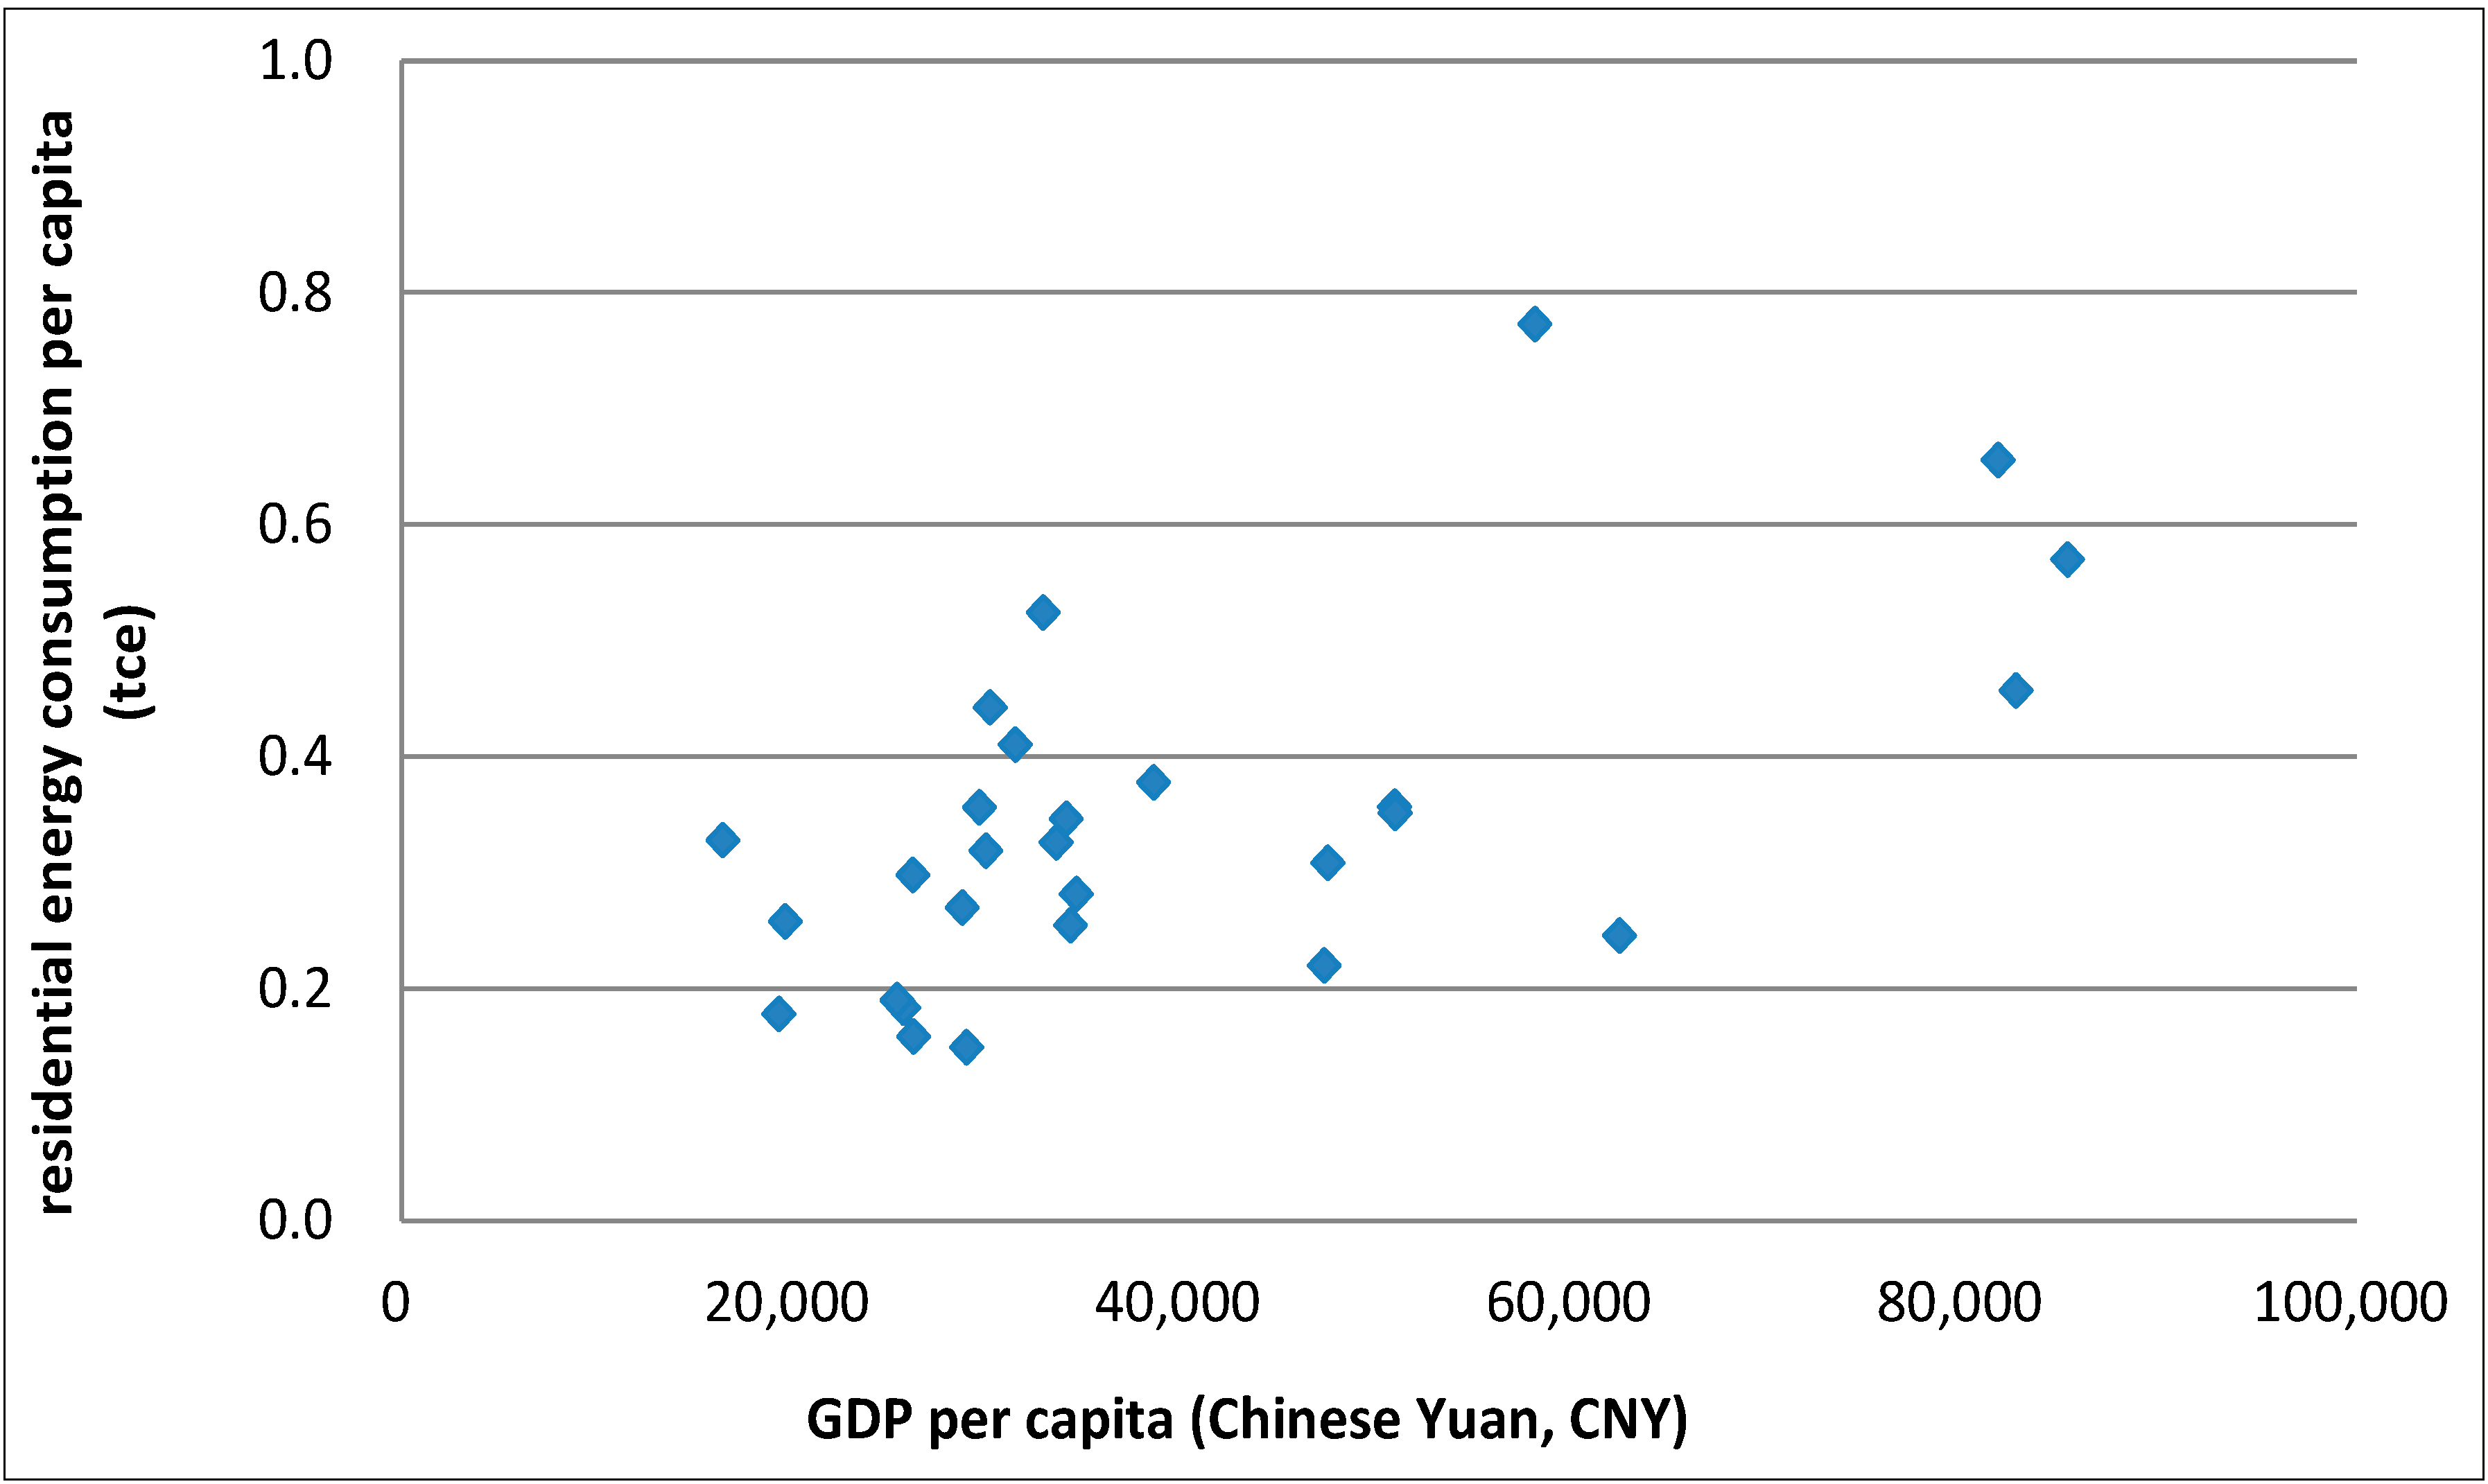
2.2. Differences in the Amount of Residential Energy Consumption

In 2011, (given that most provincial data of residential energy consumption in 2012 were missing, the inter-provincial cross-section data in 2011 were used instead in the analysis of regional differences in residential energy consumption and its influencing factors), the national (referring to mainland China, excluding Hong Kong, Macao and Taiwan) average of residential energy consumption in 28 provinces (including municipalities and autonomous regions), except Zhejiang, Tibet and Ningxia, is 13.96 million tons of standard coal equivalent (tce, hereafter). The residential energy consumptions of the following seven provinces are more than 20 million tce: Guangdong (36.85 million tons), Henan (25.36 million tons), Hebei (24.99 million tons), Sichuan (23.95 million tons), Shandong (21.17 million tons), Hunan (20.98 million tons) and Heilongjiang (2011 million tons). The residential energy consumption of the nine provinces, namely Hainan (1.3 million tons), Qinghai (2.01 million tons), Chongqing (5.13 million tons), Gansu (6.62 million tons), Jiangxi (7.1 million tons), Tianjin (7.56 million tons), Jilin (7.96 million tons), Guangxi (8.79 million tons) and Xinjiang (9.73 million tons), however, are less than 10 million tons. As shown in Figure 1, there are huge differences in residential energy consumption in different provinces.
According to the description above, there are indeed huge differences in residential energy consumption in different provinces. Then, which factors lead to such differences?
Figure 1. Provincial data of residential energy consumption (2011).
Sustainability 06 07710 g001
Population is one of the factors resulting in such differences. Those provinces with residential energy consumptions over 20 million tce, except Heilongjiang, are the most populated provinces in China; while the provinces with residential energy consumptions less than 500 tons, such as Hainan and Qinghai etc., have a population of less than 10 million. The correlation coefficient between the provincial data of residential energy consumption and that of population is 0.83, showing that regional difference in residential energy consumption is highly correlated with population.
Besides population, residential energy consumption per capita is another influencing factor. Figure 1 illustrates that there are huge differences in residential energy consumption per capita in different regions and that large differences also exist in the rank of areas according to both per capita and total residential energy consumption. For instance, the residential energy consumption of Guangdong ranks the first, but the level of residential energy consumption per capita is just slightly above the national average level, which is 343 kg tce. Values for Inner Mongolia (773 kg), Beijing (656 kg), Tianjin (570 kg) and Heilongjiang (525 kg) are all higher than 500 kg tce, while those of Hainan (149 kg), Jiangxi (159 kg), Yunnan (178 kg), Anhui (184 kg) and Guangxi (190 kg) are less than 200 kg tce.
Economic development level may contribute to such differences. The higher the economic development level of a region is, the higher the income and living standards are. Therefore, more electricity, gasoline and other energy commodities would be consumed. For example, Beijing, Tianjin and Shanghai have higher residential energy consumption per capita, because of strong economies, while Hainan, Jiangxi, Yunnan, Anhui and Guangxi have much lower ones, due to relatively weak economies. Using GDP per capita, an indicator of the economic development level, the correlation coefficient between GDP per capita and residential energy consumption per capita is calculated to be 0.62, implying that there is a strong connection between them (see Figure 2).
Figure 2. Residential energy consumption per capita and GDP per capita (2011).
Sustainability 06 07710 g002
Urbanization also contributes to the differences, because urban and rural residents differ greatly in many ways regarding energy consumption. The energy supply systems in urban areas are relatively perfect, with electricity supply, heat supply and natural gas supply providing easy access to clean, convenient and comprehensive energy services for local residents. In contrast, rural residents still primarily rely on traditional ways to access and consume energy. With rapid urbanization and rural residents moving to cities and towns, coal, wood and other traditional energy sources would be replaced by cleaner energies, such as electricity, natural gas, etc. In 2011, residential energy consumption per capita in China’s rural areas was 0.23 tce per capita, which is 43.5% lower than that of 0.33 tce per capita in urban areas. Statistical tests conducted on both the residential energy consumption per capita and urbanization rate in various regions in 2011 demonstrate that there is a significantly positive correlation between these two factors, with the correlation coefficient being 0.57.
Moreover, the price or cost of the energy can be an explanatory factor that affects residential energy demand. Increases in price lead to decreases in demand, with other conditions unchanged. If the price of energy rises, the economic burden of residential energy consumption will increase, and consequently, the consumption will decrease.
China is a vast country with resources varying significantly in different areas, which results in the differences in the costs of energy. Normally, in a region where energy resources are abundant, such as Shanxi, Inner Mongolia, Xinjiang, etc., the cost of energy will be lower, which leads to higher energy consumption per capita. In this paper, coal reserves are used to represent the differences in the costs of energy among various regions.
Furthermore, climatic condition is another important factor that has an impact on residential energy consumption via the energy demand for heating and cooling. In summer, the areas with hot weather have great demand for air conditioning, while in winter, the regions with cold weather have heavy demand for space heating. Take Heilongjiang for example: its energy consumption per capita ranks the fourth in China, which is largely determined by its cold weather.
A residential energy demand equation can be established based on the analysis above:
REC = β0 + β1POP + β2GDPP + β3URB + β4RES + β5TEMP1 + β6TEMP8 + ε
where REC is the residential energy consumption; POP denotes population; GDPP represents GDP per capita, a measure of the economic development level of a region; URB is the urbanization rate; RES is the coal reserves, a measure of the energy resources endowment and the cost of energy in a region; TEMP1 is the average temperature in January and TEMP8 is the average temperature in August, two measures of the climatic conditions of a region; ɛ is the error term.

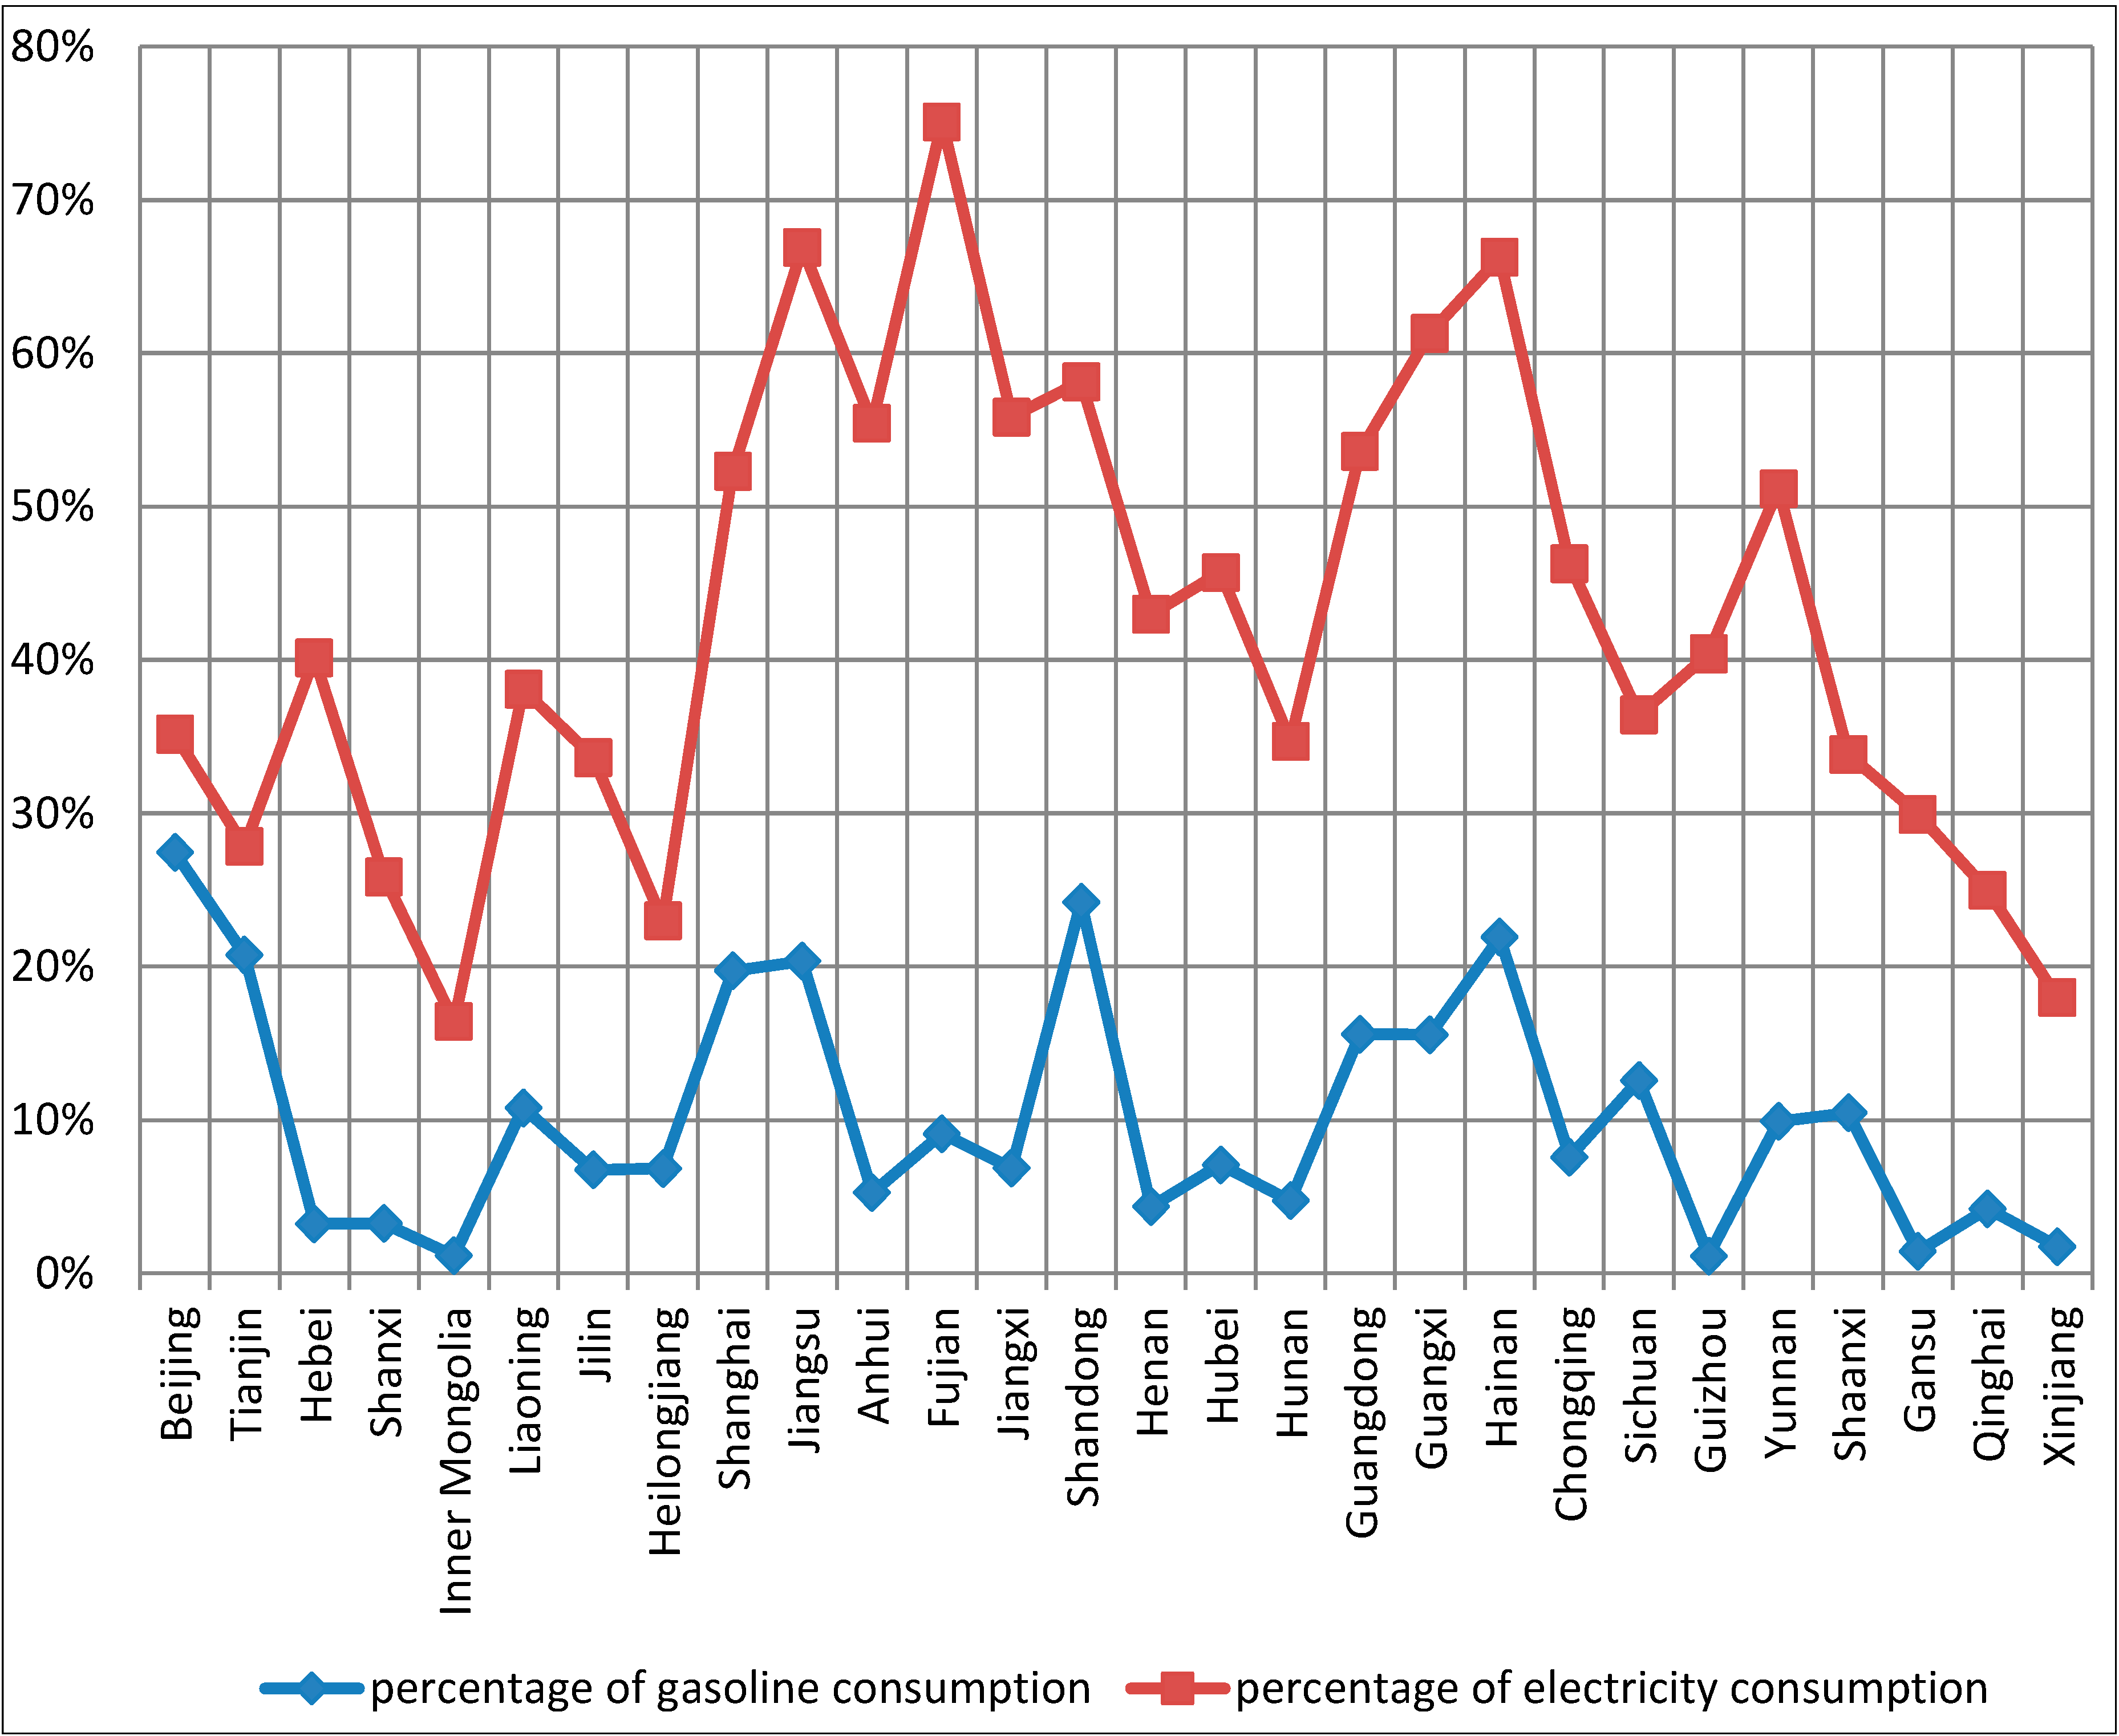
2.3. Differences in the Structure of Residential Energy Consumption

There are a wide variety of residential energy commodities, such as coal, coke, gasoline, diesel, natural gas, liquefied petroleum gas, coal gas, electricity, heat, etc. Regional residential energy consumptions not only differ in quantity, but also vary in consumption structure. In this paper, the proportion of electricity consumption and that of gasoline consumption in residential energy consumption are used as indicators to represent the diversity of the residential energy consumption structure in various regions of China (see Figure 2).
Figure 3 illustrates that there are comparatively large differences in residential energy consumption structure among various regions. In terms of the percentage of electricity consumption in residential energy consumption, the average proportion of the electricity consumption of 28 provinces in 2011 is 42%. The proportions of electricity consumption in Fujian (75%), Jiangsu (67%), Hainan (66%) and Guangxi (61%) are more than 60%, while the proportions of electricity consumptions in Inner Mongolia (16%), Xinjiang (18%), Heilongjiang (23%), Qinghai (25%), Shanxi (26%) and Tianjin (28%) are less than 30%. In terms of the proportion of gasoline consumption in residential energy consumption, the average level of 28 provinces in 2011 is 10%. The proportions of gasoline consumptions in Beijing (27%), Shandong (24%), Hainan (22%) and Jiangsu (20%) are above 20%, while the proportions of gasoline consumptions in Guizhou (1%), Inner Mongolia (1%), Gansu (1%) and Xinjiang (2%) are below 2%.
Figure 3. The percentages of electricity and gasoline consumption in different provinces (2011).
Sustainability 06 07710 g003
In order to analyze the factors that affect the regional differences in residential energy consumption structure, this paper selects and compares five provinces with similar consumption: Beijing, Anhui, Fujian, Guizhou and Shaanxi (see Table 1).
Table 1. Residential energy consumption in five provinces. tce, tons of standard coal equivalent.
BeijingAnhuiFujianGuizhouShaanxi
The total residential energy consumption (Ten thousand tce)1305.81095.91142.11138.91218.2
Includes:
 Coal (ten thousand tons)279.6226.094.2685.3254.5
 Gasoline (ten thousand tons)243.539.270.68.786.5
 Liquefied petroleum gas (ten thousand tons)21.241.742.19.622.0
 Natural gas (one hundred million cubic meters)10.58.05.30.113.8
 Heat (ten thousand tce)99.371.00.00.092.1
 Electricity (one hundred million kWh)144.7191.6270.4145.1130.0
GDP per capita (yuan/person)81,64725,66147,37716,41333,464
Average temperature in January (Celsius)−4.50.38.0−1.5−2.8
Coal reserves per capita (tons/person)18.9134.011.6169.1287.8
Data Sources: “China Energy Statistical Yearbook 2012” and Provincial Statistical Yearbooks.
As listed in Table 1, the areas with similar overall levels of residential energy consumption differ greatly in the consumption of coal, gasoline, gas, heat and electricity and other end-use energy products, resulting in the structural differences of residential energy consumption. The reasons can be decomposed as follows:
(1)
Economic development level. Take Beijing and Shaanxi for example: their consumptions of coal, gas, heat and electricity are more or less similar. However, their gasoline consumptions are quite different, lying in the different levels of economic development in both regions: Beijing’s GDP per capita is approximately 2.5-times that of Shaanxi. Generally speaking, family cars become more and more popular with the increase of economic development level, and gasoline consumptions increase correspondingly. Thus, the difference in economic development level affects gasoline consumption and, thereby, influences the residential energy consumption structure of a region.
(2)
Climatic condition. China spreads from Sanya city at 18° north latitude to the northern most county, Mohe, at 53° north latitude, covering tropical monsoon climate, subtropical monsoon climate, temperate monsoon climate, temperate continental climate and alpine climate. In summer, the temperature difference between northern and southern China is relatively small. In winter, however, the difference is obvious and exceeds 50 °C. Thus, climatic condition may bring about the differences in residential energy consumption. In order to solve the space heating problem in winter, the cities that are located to the north of China’s Qinling Mountain-Huaihe River (e.g., northern Shaanxi, northern Henan, Shandong, Hebei, Beijing, Tianjin, Shanxi, Gansu, Qinghai, Ningxia, Inner Mongolia, Xinjiang, the majority of Heilongjiang, Jilin, Liaoning, etc.) have built a heating pipeline network covering the whole of the urban areas. Heating services are provided centrally in winter by government-designated companies. Climatic condition, undoubtedly, is a crucial factor that has an important impact on the residential energy consumption structure, which can be demonstrated by the examples of Beijing and Fujian. Fujian is situated in the southeast coast, while Beijing lies in the northeast of the North China Plain. The temperature difference between these two areas in winter is significant: the average temperatures in January are eight degrees Celsius and −4.5 degrees Celsius, respectively. This leads to the fact that the space heating consumption in Beijing is equivalent to 100 million tce, while in Fujian, it is nearly zero.
(3)
Energy resources endowment. In the areas with abundant coal reserves, people have easy access to coal at a relatively low price for the purposes of heating, cooking, lighting, etc., which reduces the demand for other energy commodities. For instance, the residential energy consumptions in Fujian and Guizhou are very similar. However, the differences in their coal consumptions are significant, which can be largely attributed to the differences in the coal resources of these two areas.
In summary, the main factors that lead to the regional differences in residential energy consumption structure include economic development level, climate condition and energy resources endowment. In order to further verify the impact of these factors, equations with respect to the proportion of electricity consumption and that of gasoline consumption in the residential energy consumption are established respectively as follows:
ELERATIO = β0 + β1GDPP + β2COALP + β3TEMP1 + ε
OILRATIO = β0 + β1GDPP + β2COALP + β3TEMP1 + ε
where ELERATIO is the proportion of electricity consumption; OILRATIO is the proportion of gasoline consumption in the residential energy consumption; COALP is coal reserves per capita.

3. Results and Discussions

3.1. Different Amount of Residential Energy Consumption

The residential energy demand equation is validated by using sectional data in 2011, and the results are shown in Table 2.
Table 2. Coefficients of influencing factors of residential energy demand. REC is the residential energy consumption; POP denotes population; GDPP represents GDP per capita, a measure of the economic development level of a region; URB is the urbanization rate; RES is the coal reserves, a measure of the energy resources endowment and the cost of energy in a region; TEMP1 is the average temperature in January and TEMP8 is the average temperature in August.
Model 1Model 2Model 3Model 4Model 5Model 6Model 7
Constant−104.10−475.61−484.64−225.03−232.03−592.59−792.43
(245.82)(588.56)(372.38)(243.54)(232.13)(800.4)(793.35)
POP0.250.260.260.260.270.270.27
(0.03) ***(0.03) ***(0.03) ***(0.03) ***(0.03) ***(0.03) ***(0.03) ***
GDPP0.010.00 0.010.010.010.01
(0.00) **(0.01) (0.00) **(0.00) **(0.00) *(0.00 ) *
URB 13.5613.93
(19.47)(5.85) **
RES 0.87 0.68
(0.47) * (0.47)
TEMP1 −19.73−22.91−20.93
(8.31) **(10.81) **(10.64) *
TEMP8 15.7221.19
(33.35)(32.78)
R20.740.740.740.770.790.790.81
Adjusted R20.710.710.720.740.760.750.76
Notes: Standard errors are in brackets. Significance at the 0.10, 0.05 and 0.01 levels are indicated by *, ** and ***, respectively.
According to the results above, population highly correlates with residential energy consumption. Meanwhile, the higher the level of economic development of a region, the larger amount of energy it consumes. Therefore, in the basic regression model (Model 1), two variables are considered, i.e., population and GDP per capita. Regression results demonstrate that the coefficients of POP and GDPP are positive and significant, respectively, at the 1% and 5% significance levels with an adjusted R2 of 0.71, which suggests that the basic model can well explain the regional differences in residential energy consumption.
Building on Model 1, Model 2 incorporates the urbanization rate as an explanatory factor. The results clarify that neither GDPP nor URB is significant. This is because multicollinearity exists between GDPP and URB, and these two variables are highly correlated, with the correlation coefficient being 0.95 (see Table 3). Both the urbanization rate and GDP per capita are measures of the economic development level for a region (like two sides of a coin, both the urbanization rate and GDP per capita can represent the economic development level of a region. In other words, neither the progress of urbanization brings about the increase in GDP per capita, nor is urbanization driven by the increase in GDP per capita. These two variables are different indicators of the economic development level of one region). Thus, they should not be incorporated into the model at the same time. In Model 3, population and urbanization rate are chosen as explanatory variables. The regression results show that URB is positive and significant at the 5% significance level, indicating that the urbanization rate has a positive effect on residential energy consumption. The higher the urbanization rate in a specific area, the greater is the energy consumed by local residents.
Table 3. Correlation coefficient between GDP per capita and urbanization rate.
GDPPURB
GDPP1
URB0.951
Again, based on Model 1, Model 4 involves coal reserves, denoted by RES, as the explanatory variable, and analyzes how the energy cost influences residential energy consumption. Since it is difficult to find a standard indicator to measure the energy cost, coal reserves are used here to represent the energy cost as an approximation. Regression results of Model 4 show that the coefficient of RES is positive and significant at the 10% significance level, which reveals that the areas with abundant energy resources have a high level of residential energy consumption per capita.
Models 5 and 6, respectively, incorporate the average temperature in January and the average temperatures of January and August in the basic Model 1. The coefficient of TEMP1 passes the hypothesis testing at the 5% significance level. This suggests that the regions with cold weather in winter have great demand for space heating and require more energy, which is consistent with the proposed hypothesis. The coefficient of TEMP8 is positive, but not significant. A possible explanation is that air-conditioning accounts for a large part of residential energy consumption in summer, and the number of air-conditioners used correlates with the income level of local residents. An obvious example is that in the southern region of the Yangtze River, despite the intolerable heat in summer, the majority of rural residents and even some urban residents, due to the lower income levels, still choose to use traditional cooling methods, like electric fan and cattail leaf fan, to save electricity consumption.
The regression results of Model 7, which integrates all variables, are basically the same as those of other models presented before. It can be seen that the coefficients of population, GDP per capita, coal resources and the average temperatures in January and August are all in line with the previous hypothesis. However, the coefficients of coal reserves and the average temperature in August do not pass hypothesis testing. The reason why the coefficient of the average temperature in August is not significant has been explained in Model 6, while the possible reason why the coefficient of coal reserves is not significant can be attributed to China’s energy price formation mechanism. In the energy sector, prices are heavily influenced by government intervention. Electricity prices are controlled by the Pricing Management Department of the State Council of the People’s Public of China or authorized administrative department, i.e., energy prices are set by the government. As a result, the energy price cannot objectively reflect the scarcity of energy resources in various regions, and the pricing effect on residential energy consumption is altered.

3.2. Different Structure of Residential Energy Consumption

Regression results derived by using cross-sectional data in 2011 are presented as follows:
ELERATIO = 0.46 − 0.00008COALP + 0.01TEMP1 + 0.0000005GDPP
(0.04) *** (0.00004) * (0.002) *** (0.000001) R2 = 0.65
OILRATIO = 0.01 + 0.000003GDPP − 0.00004COALP + 0.003TEMP1
(0.01) (0.000003) *** (0.00002) * (0.001) ** R2 = 0.64
According to the regression results, the main factors that have an impact on the percentage of electricity consumption in residential energy consumption include the average temperature in January and coal reserves per capita, while the impact brought by GDP per capita is not significant. In a region with abundant coal reserves, the lower cost of coal encourages people to consume more coal resources. Thus, the increase in the proportion of coal consumption lowers the percentage of electricity consumption indirectly. In terms of temperatures, space heating consumption plays an important part in residential energy consumption in the northern regions where the temperatures are normally low, which indirectly lowers the proportion of electricity consumption. In contrast, southern regions witness a higher proportion of electricity consumption overall.
The main factors that influence the proportion of gasoline consumption in residential energy consumption are GDP per capita, coal reserves per capita and the average temperature in January. The impact on gasoline consumption caused by GDP per capita is obvious. When it comes to the temperature, its influence on gasoline consumption is indirect. Heating services in the region where the average temperature in January is low are provided by coal, which makes the proportion of coal consumption higher and, in turn, decreases the proportion of the consumptions of other energy commodities, like the gasoline consumption. Coal resources also have a similar impact mechanism on gasoline consumption. In a region with abundant coal resources, the proportion of coal consumption is undoubtedly higher, which leads to a lower level of gasoline consumption, as it does to the proportion of electricity consumption.

4. Conclusions

This paper presents an analysis of the differences in residential energy consumption in various regions of China and the factors that lead to such differences. We consider both the total amount and the structure of residential energy consumption. Regarding the total amount of residential energy consumption, the main influencing factors include population, economic development, energy resources endowment and climatic condition. Generally speaking, the residential energy consumption amount is larger in provinces with more population, such as Guangdong, Henan, Hebei, Sichuan, Shandong and Hunan. Meanwhile, economic development level, energy resources endowment and climatic condition influence the energy consumption per capita. The higher the level of economic development of a region, such as Beijing, Tianjin and Shanghai, the larger its energy per capita. The more abundant the energy resources per capita in an area, e.g., Inner Mongolia, Shanxi and Xinjiang, the more residential energy consumption per capita. Considering the climatic condition, the average temperature in January has a significant impact on residential energy consumption per capita, especially in the regions where the heating demand in winter is strong, such as Jilin, Liaoning, Heilongjiang, etc., and energy consumption per capita is relatively large.
With regards to the residential energy consumption structure, the main influencing factors include economic development level, energy resources endowment and climatic condition. This paper uses the proportion of electricity consumption and that of gasoline consumption in residential energy consumption as indicators to represent the regional differences in residential energy consumption structure. The empirical analysis reveals that economic development level has a significantly positive impact on gasoline consumption. The higher the level of economic development of a region, the more family car ownership, the greater gasoline consumption and, consequently, the higher the proportion of gasoline consumption in residential energy consumption is. On the other hand, economic development level has no significant impact on the proportion of electricity consumption. The abundance of coal reserves negatively correlates with the proportion of electricity consumption and that of gasoline consumption. This is because the proportion of coal consumption is relatively higher in such regions, which indirectly lowers the proportion of electricity consumption and that of gasoline consumption. In addition, the average temperature In January, as an indicator of the climatic condition, has a significant impact on the residential energy consumption structure. The mechanism is that the colder a specific region, the higher the heating demand, which increases the percentage of heating consumption in residential energy consumption with a corresponding reduction in the proportion of electricity consumption and gasoline consumption.
The results of our study help understand Chinese residents’ energy consumption demands in the future. Among major factors affecting residential energy consumption, the growth of China’s total population is slow, and climate factors and resource endowments will not have significant changes in the short term, which indicates that the growth of residential energy consumption comes mainly from the increase in residential income and urbanization process. The current growth rate of income per capita of urban and rural residents is higher than the economic growth rate. In 2013, China’s urbanization rate had reached 53.7%, which will be on a rapid growth track according to the laws of urbanization proposed by Northam [27]. Thus, the increase in residential income and the acceleration of the urbanization process will inevitably be expected to bring about the rapid growth of residential energy consumption. In addition, during this process, people will gradually reduce the usage of coal for environmental protection purpose, which, in turn, indirectly increases the usage of clean energy and helps improve the quality of the environment.

Acknowledgments

This work was supported by the Major Research Plan of the National Natural Science Foundation of China (No. 91325302), the Fund for Creative Research Groups of the National Natural Science Foundation of China (No. 51121003), the National Natural Science Foundation of China (No. 41271543), the Fundamental Research Funds for the Central Universities (No. 2012WYB20) and the Specialized Research Fund for the Doctoral Program of Higher Education of China (No. 20130003110027).

Author Contributions

Weibin Lin contributed to the interpretation of the data and drafting the article; Bin Chen made contributions to the concept and design of the article; Shichao Luo collected and analyzed the data; Li Liang provided some useful advices and modified the draft.

Conflicts of Interest

The authors declare no conflict of interest.

References

  1. Krigger, J.; Dorsi, C. Residential Energy: Upper Saddle River; Prentice Hall: Upper Saddle River, NJ, USA, 2009. [Google Scholar]
  2. Nesbakken, R. Price sensitivity of residential energy consumption in Norway. Energy Econ. 1999, 21, 493–515. [Google Scholar]
  3. Alberini, A.; Gans, W.; Velez-Lopez, D. Residential consumption of gas and electricity in the U.S.: The role of prices and income. Energy Econ. 2011, 33, 870–881. [Google Scholar]
  4. Lenzen, M.; Wier, M.; Cohen, C.; Hayami, H.; Pachauri, S.; Schaeffer, R. A comparative multivariate analysis of residential energy requirements in Australia, Brazil, Denmark, India and Japan. Energy 2006, 31, 181–207. [Google Scholar]
  5. Sarak, H. The degree-day method to estimate the residential heating natural gas consumption in Turkey: A case study. Energy 2003, 28, 929–939. [Google Scholar]
  6. Isaac, M.; van Vuuren, D. Modeling global residential sector energy demand for heating and air conditioning in the context of climate change. Energy Policy 2009, 37, 507–521. [Google Scholar]
  7. Zhu, D.; Tao, S.; Wang, R.; Shen, H.; Huang, Y.; Shen, G.; Wang, B.; Li, W.; Zhang, Y.; Chen, H.; et al. Temporal and spatial trends of residential energy consumption and air pollutant emissions in China. Appl. Energy 2013, 106, 17–24. [Google Scholar]
  8. Zhang, Q. Residential energy consumption in China and its comparison with Japan, Canada, and USA. Energy Build. 2004, 36, 1217–1225. [Google Scholar]
  9. Pachauri, S.; Jiang, L. The household energy transition in India and China. Energy Policy 2008, 36, 4022–4035. [Google Scholar]
  10. Nakagami, H.; Murakoshi, C.; Iwafune, Y.; Jyukankyo Research Institute. International Comparison of Household Energy Consumption and Its Indicator. In Proceedings of the 2008 ACEEE Summer Study on Energy Efficiency in Buildings, Pacific Grove, CA, USA, 17–22 August 2008; Volume 8, pp. 214–224.
  11. Brounen, D.; Kok, N.; Quigley, J. Residential energy use and conservation: Economics and demographics. Eur. Econ. Rev. 2012, 56, 931–945. [Google Scholar]
  12. Tso, G.; Guan, J. A multilevel regression approach to understand effects of environment indicators and household features on residential energy consumption. Energy 2014, 66, 722–731. [Google Scholar]
  13. Heinonen, J.; Junnila, S. Residential energy consumption patterns and the overall housing energy requirements of urban and rural households in Finland. Energy Build. 2014, 76, 295–303. [Google Scholar]
  14. Chen, X.; Yuan, H. An empirical study on the factors affecting residential energy consumption behaviour in China. Consum. Econ. 2008, 5, 47–50. (In Chinese) [Google Scholar]
  15. Nie, H.; Kemp, R. Index decomposition analysis of residential energy consumption in China: 2002–2010. Appl. Energy 2014, 121, 10–19. [Google Scholar]
  16. Zhao, X.; Li, N.; Ma, C. Residential energy consumption in urban China: A decomposition analysis. Energy Policy 2011, 41, 644–653. [Google Scholar]
  17. Qin, Y. Study on Chinese Residential Energy Consumption. Master’s Thesis, Shanxi University of Finance & Economics, Taiyuan, China, 2013. [Google Scholar]
  18. Chen, J.; Wang, X.; Steemers, K. A statistical analysis of a residential energy consumption survey study in Hangzhou, China. Energy Build. 2013, 66, 193–202. [Google Scholar]
  19. Fu, C.; Wang, W.; Tang, J. Exploring the sensitivity of residential energy consumption in China: Implications from a micro-demographic analysis. Energy Res. Soc. Sci. 2014, 2, 1–11. [Google Scholar]
  20. Golley, J.; Meagher, D.; Xin, M. Chinese Household Consumption, Energy Requirements and Carbon Emissions. Available online: http://people.anu.edu.au/xin.meng/Draft%20May%2012.pdf (accessed on 20 October 2014).
  21. Xu, X. Analysis on Chinese Rural Residential Energy Consumption. Master’s Thesis, Chinese Academy of Agricultural Sciences, Beijing, China, 2008. [Google Scholar]
  22. Lou, B. Study on Rural Households’ Selection Behaviour in Residential Energy Consumption. Master’s Thesis, Chinese Academy of Agricultural Sciences, Beijing, China, 2008. [Google Scholar]
  23. Zhang, N.; Xu, W.; Cao, P. Analysis of the factors that influenced rural households’ residential energy consumption—Based on micro data of nine provinces. Chin. J. Popul. Sci. 2011, 3, 73–82. (In Chinese) [Google Scholar]
  24. Li, G.; Nie, H.; Yang, Y. Regional disparities and influencing factors of rural energy consumption in China. J. Shanxi Financ. Econ. Univ. 2010, 2, 68–73. [Google Scholar]
  25. Lun, F.; Canadell, J.; Xu, Z.; He, L.; Yuan, Z.; Zheng, D.; Li, W.; Liu, M. Residential energy consumption and associated carbon emission in forest rural area in China: A case study in Weichang County. J. Mount. Sci. 2014, 11, 792–804. [Google Scholar]
  26. Suo, C.; Yang, Y.; Solvang, W. Analysis of influence factors of rural residence transformation on residential energy consumption. Mod. Manag. 2014, 4, 493–515. [Google Scholar]
  27. Northam, R.M. Urban Geography; John Wiley: New York, NY, USA, 1979. [Google Scholar]

