1. Introduction
Cost-Benefit Analysis (CBA) is one of the most widely used methods to help in the decision stages of both investment projects and policies [
1]. The basis of the methodology is quite simple: measuring whether the benefits of impacts associated to a project or policy are bigger than the costs. One of the steps to carry out during a CBA implementation is to identify the project impacts and which of them are relevant to the analysis: an impact associated to a project is important if it affects at least one individual [
2]. Environmental impacts are under this perspective very likely to be relevant in carrying out a CBA [
3]. However, as important as proceeding with the identification is, the need to define which impacts are economically relevant, and the main problem is that there are no “hard and fast rules” for this [
4]. This problem leads to a desire for frameworks that allow the prioritization of which impacts should be considered.
A growing interest in the study and incorporation of resilience, vulnerability and risk within environmental applications of CBA has emerged (some examples can be found in Turner [
5], Warrick [
6], Hinkel [
7], Patt [
8] or the EU project MOVE [
9]). The inclusion of these terms in the CBA methodology, specifically in the selection of the most relevant impacts to study, is the aim of this paper.
The concepts of resilience, vulnerability and risk perception are related closely to each other, and so should be considered jointly within a CBA procedure. Some authors have tried to develop a methodology to work with resilience, vulnerability or risk alone in CBA [
5,
6,
7,
8,
9,
10,
11], but it is hard to find examples of the three being used together in more than a few specific case studies. In what follows, we set out a method for using each of these concepts jointly to produce a ranking of which impacts of a project should be prioritized for inclusion within a CBA, assuming a finite budget available to the analyst or government department. The assumption of a finite budget, in time and/or human and monetary resources, necessitates some prioritization of which impacts to bring within the CBA. Our approach does not show how these three concepts should be treated within the CBA itself, but rather how the concepts can be employed to decide what should be considered within the CBA.
This paper is organized in the following sections. We first review the concepts of resilience, vulnerability and risk, and in particular their application to environmental management. Next, we present a proposal to integrate these new concepts in CBA, developing our own methodology (
Section 3) and apply this to a hypothetical and a real case study as an example (
Section 4).
3. Proposed Methodology
We define resilience as the limit of a perturbation (the maximum in size and duration) a system can assimilate. Beyond this limit the system will change its status (multiple equilibria can exist, not necessarily a single one), and depending on the system features this change will be revealed as a continuous process or as a crossing of a threshold.
Secondly, we define vulnerability as the degree of susceptibility or ease a system has to suffer damages due to actions from outside the ecosystem. Trying to explain this in other way, vulnerability answers the following question “how easy is it to damage the ecosystem?”. Vulnerability must also be understood as a dynamic concept, because it varies across time due to three factors: stress, sensitivity and adaptive capacity.
Lastly, we understand risk as the personal perception that a possible damage can be suffered by a system due to any kind of impact or shock. In other words, risk is the subjective probability of an effect occurring that could cause damage in an ecosystem.
These concepts are made clearer by outlining an example, in this case a river system. For a specific characteristic of the river, for example dissolved oxygen levels, the ecosystem has specific resilience behavior. The European Commission [
46] has set a minimum concentration of 9 mg/L O
2 for salmonid waters because below that level salmon do not survive. According to this, at 9 mg/L O
2 the river has a resilience threshold that changes the ecosystem status, losing biodiversity, and not allowing salmonid life to exist in the river.
Continuing with this example, the vulnerability of the river will tell us how close we are to this threshold point, and how likely it is if an impact occurs the river would go through the resilience threshold and change it status. Lastly, the risk of the river to suffer damage due to an impact that will change it status is subjective probability that this can happen.
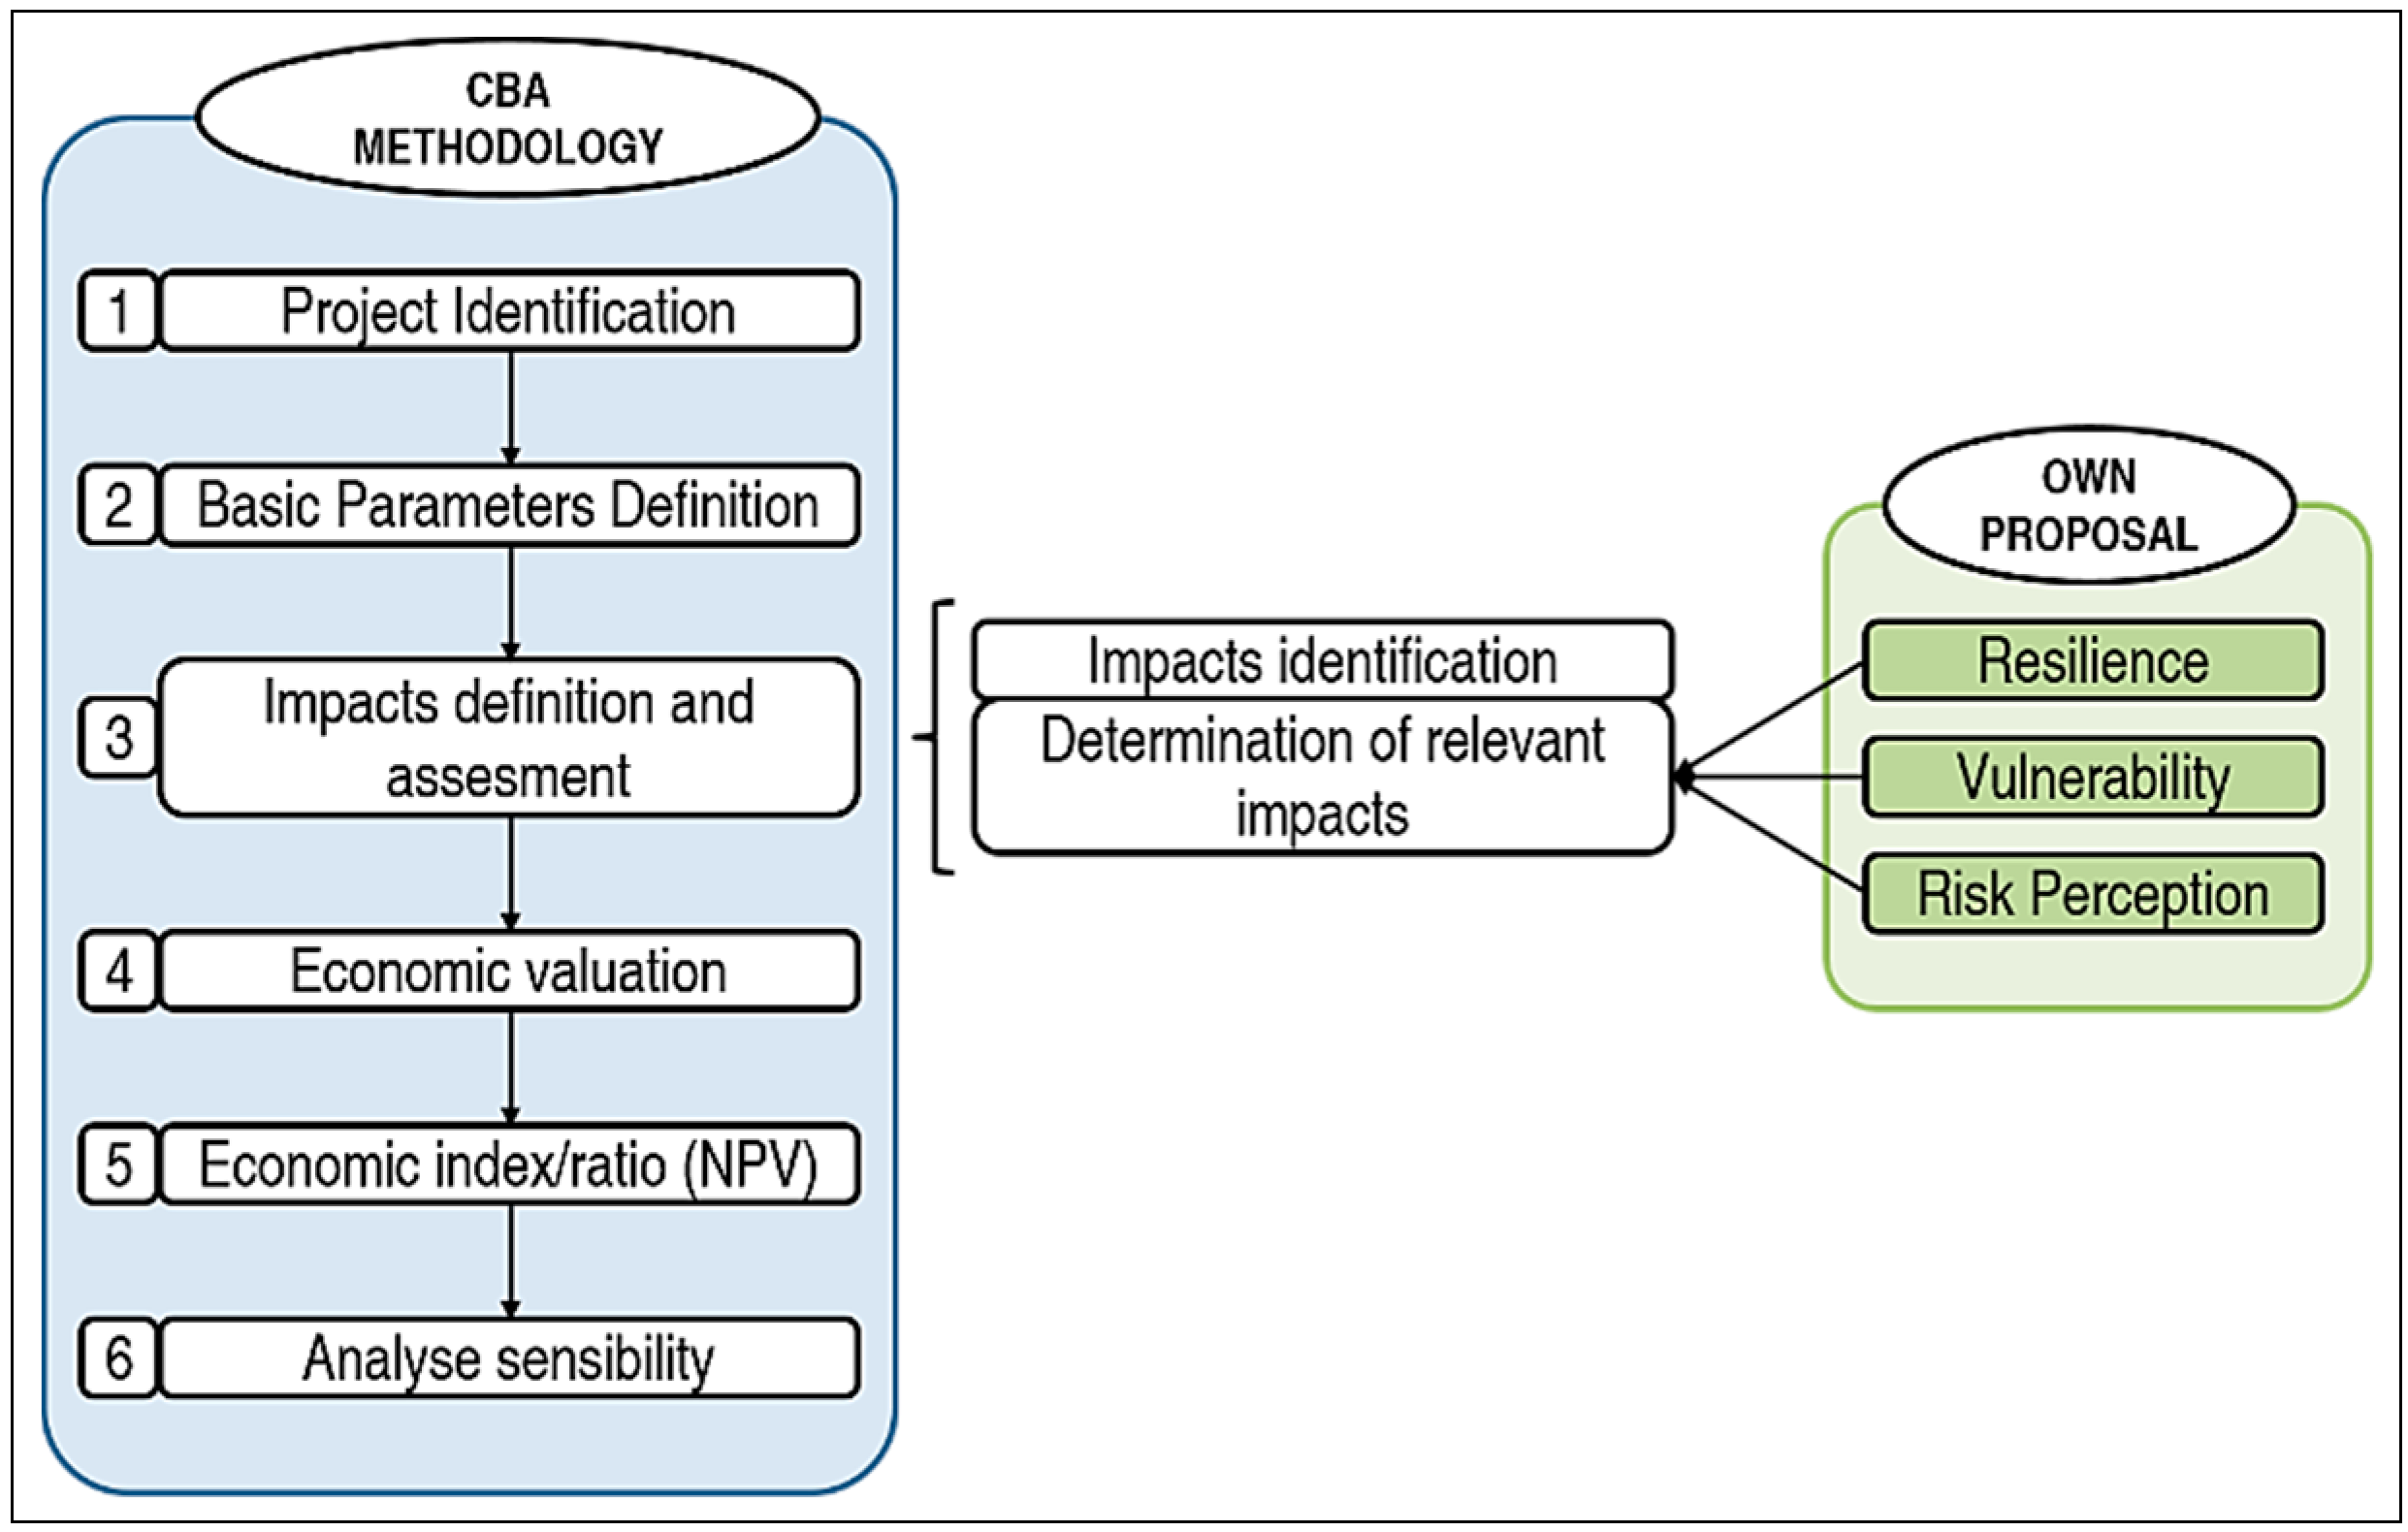
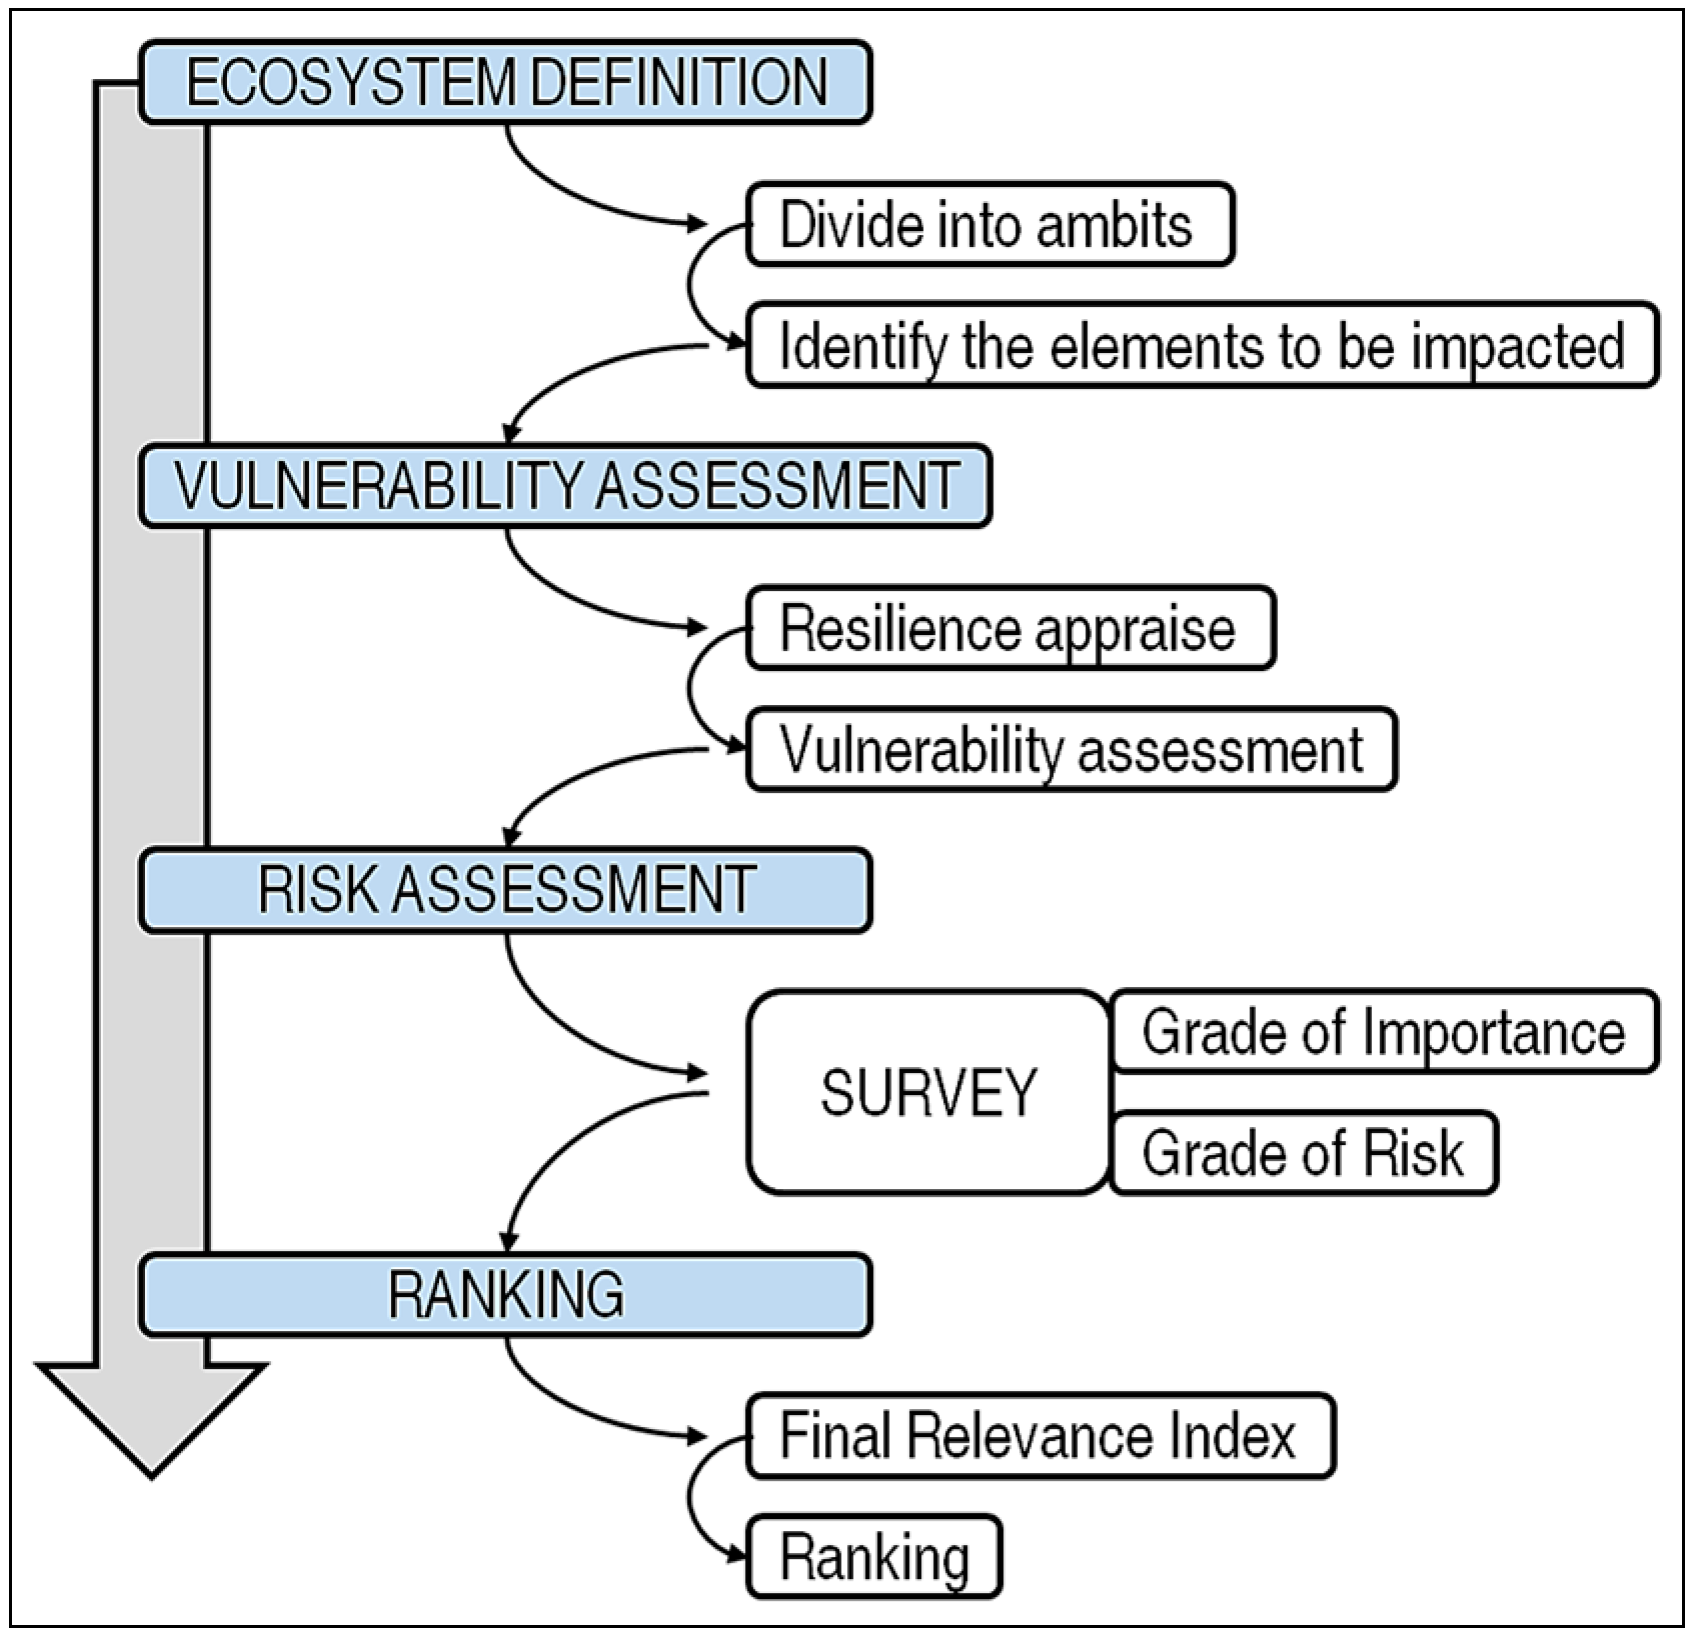
Now we have these concepts defined and exemplified, we can start integrating them into a common methodology to apply in environmental cost-benefit analysis. One of the major steps in cost-benefit analysis process is the definition of the relevant impacts to be included in the analysis (see
Figure 2). This step is necessary because of money, human resource and/or time limitations and to ensure the efficiency of the available resources. The methodology we present studies the resilience, vulnerability and risk of the ecosystem to determine which impacts are “most relevant” in terms of a CBA and so should be studied deeply.
To achieve this we must proceed with two basic steps: first, the definition phase, which must be carried out by experts, and has the objective of obtaining a good description of the ecosystem we are developing our analysis on; and a second phase which requires the collaboration of the population affected, and has the objective of the rating of the impacts produced in the ecosystem by the project or policy under study.
Figure 2.
Proposed methodology and its relationship in CBA.
Figure 2.
Proposed methodology and its relationship in CBA.
3.1. Ecosystem Definition
In this first phase, we propose a slightly modified and simplified version of the Costanza
et al. [
47] approach to an ecosystem framework, based on stocks, flows, attributes and controls. Ecosystem definition is a task for experts, who must be familiar with the relevant ecosystem. This definition phase is divided into two different steps:
- (1)
Divide the environment into “ambits”. This first step divides the affected environment into areas with similar characteristics, that is, into mutually exclusive spatial domains. According to Constanza a stock is “an element in the system that can potentially accumulate or decline”; flows are “the transactions or exchanges of material assets or information from one stock to another”; controls are the laws that control processes in the system; and attributes are “the characteristics of stocks, flows, controls and their relationships”. Ambits are thus internally-consistent spatial units with mostly the same stocks, flows, controls and attributes, as for example an estuary, a forest, a beach or lowland farmland.
- (2)
Identify the “elements” to be impacted. Once the environment affected has been divided into ambits, we can proceed to identify those elements from each of the ambits that we expect them to suffer impacts from a project or policy, which can be assimilated to the stocks of Constanza’s approach. As an example of these elements we suggest, “wildlife”, “vegetation” or in a more specifically way “beach dimension”, “forest air quality” or “average river volume”. The set of elements describing an ambit can be unique to that ambit, or may overlap with the set describing many ambits.
Once both the division of the environment and the identification of the elements are made, we can proceed to the next phase.
3.2. Vulnerability Assessment
The main aim of this second phase is to proceed with the assessment of impacts of the project in terms of resilience and vulnerability.
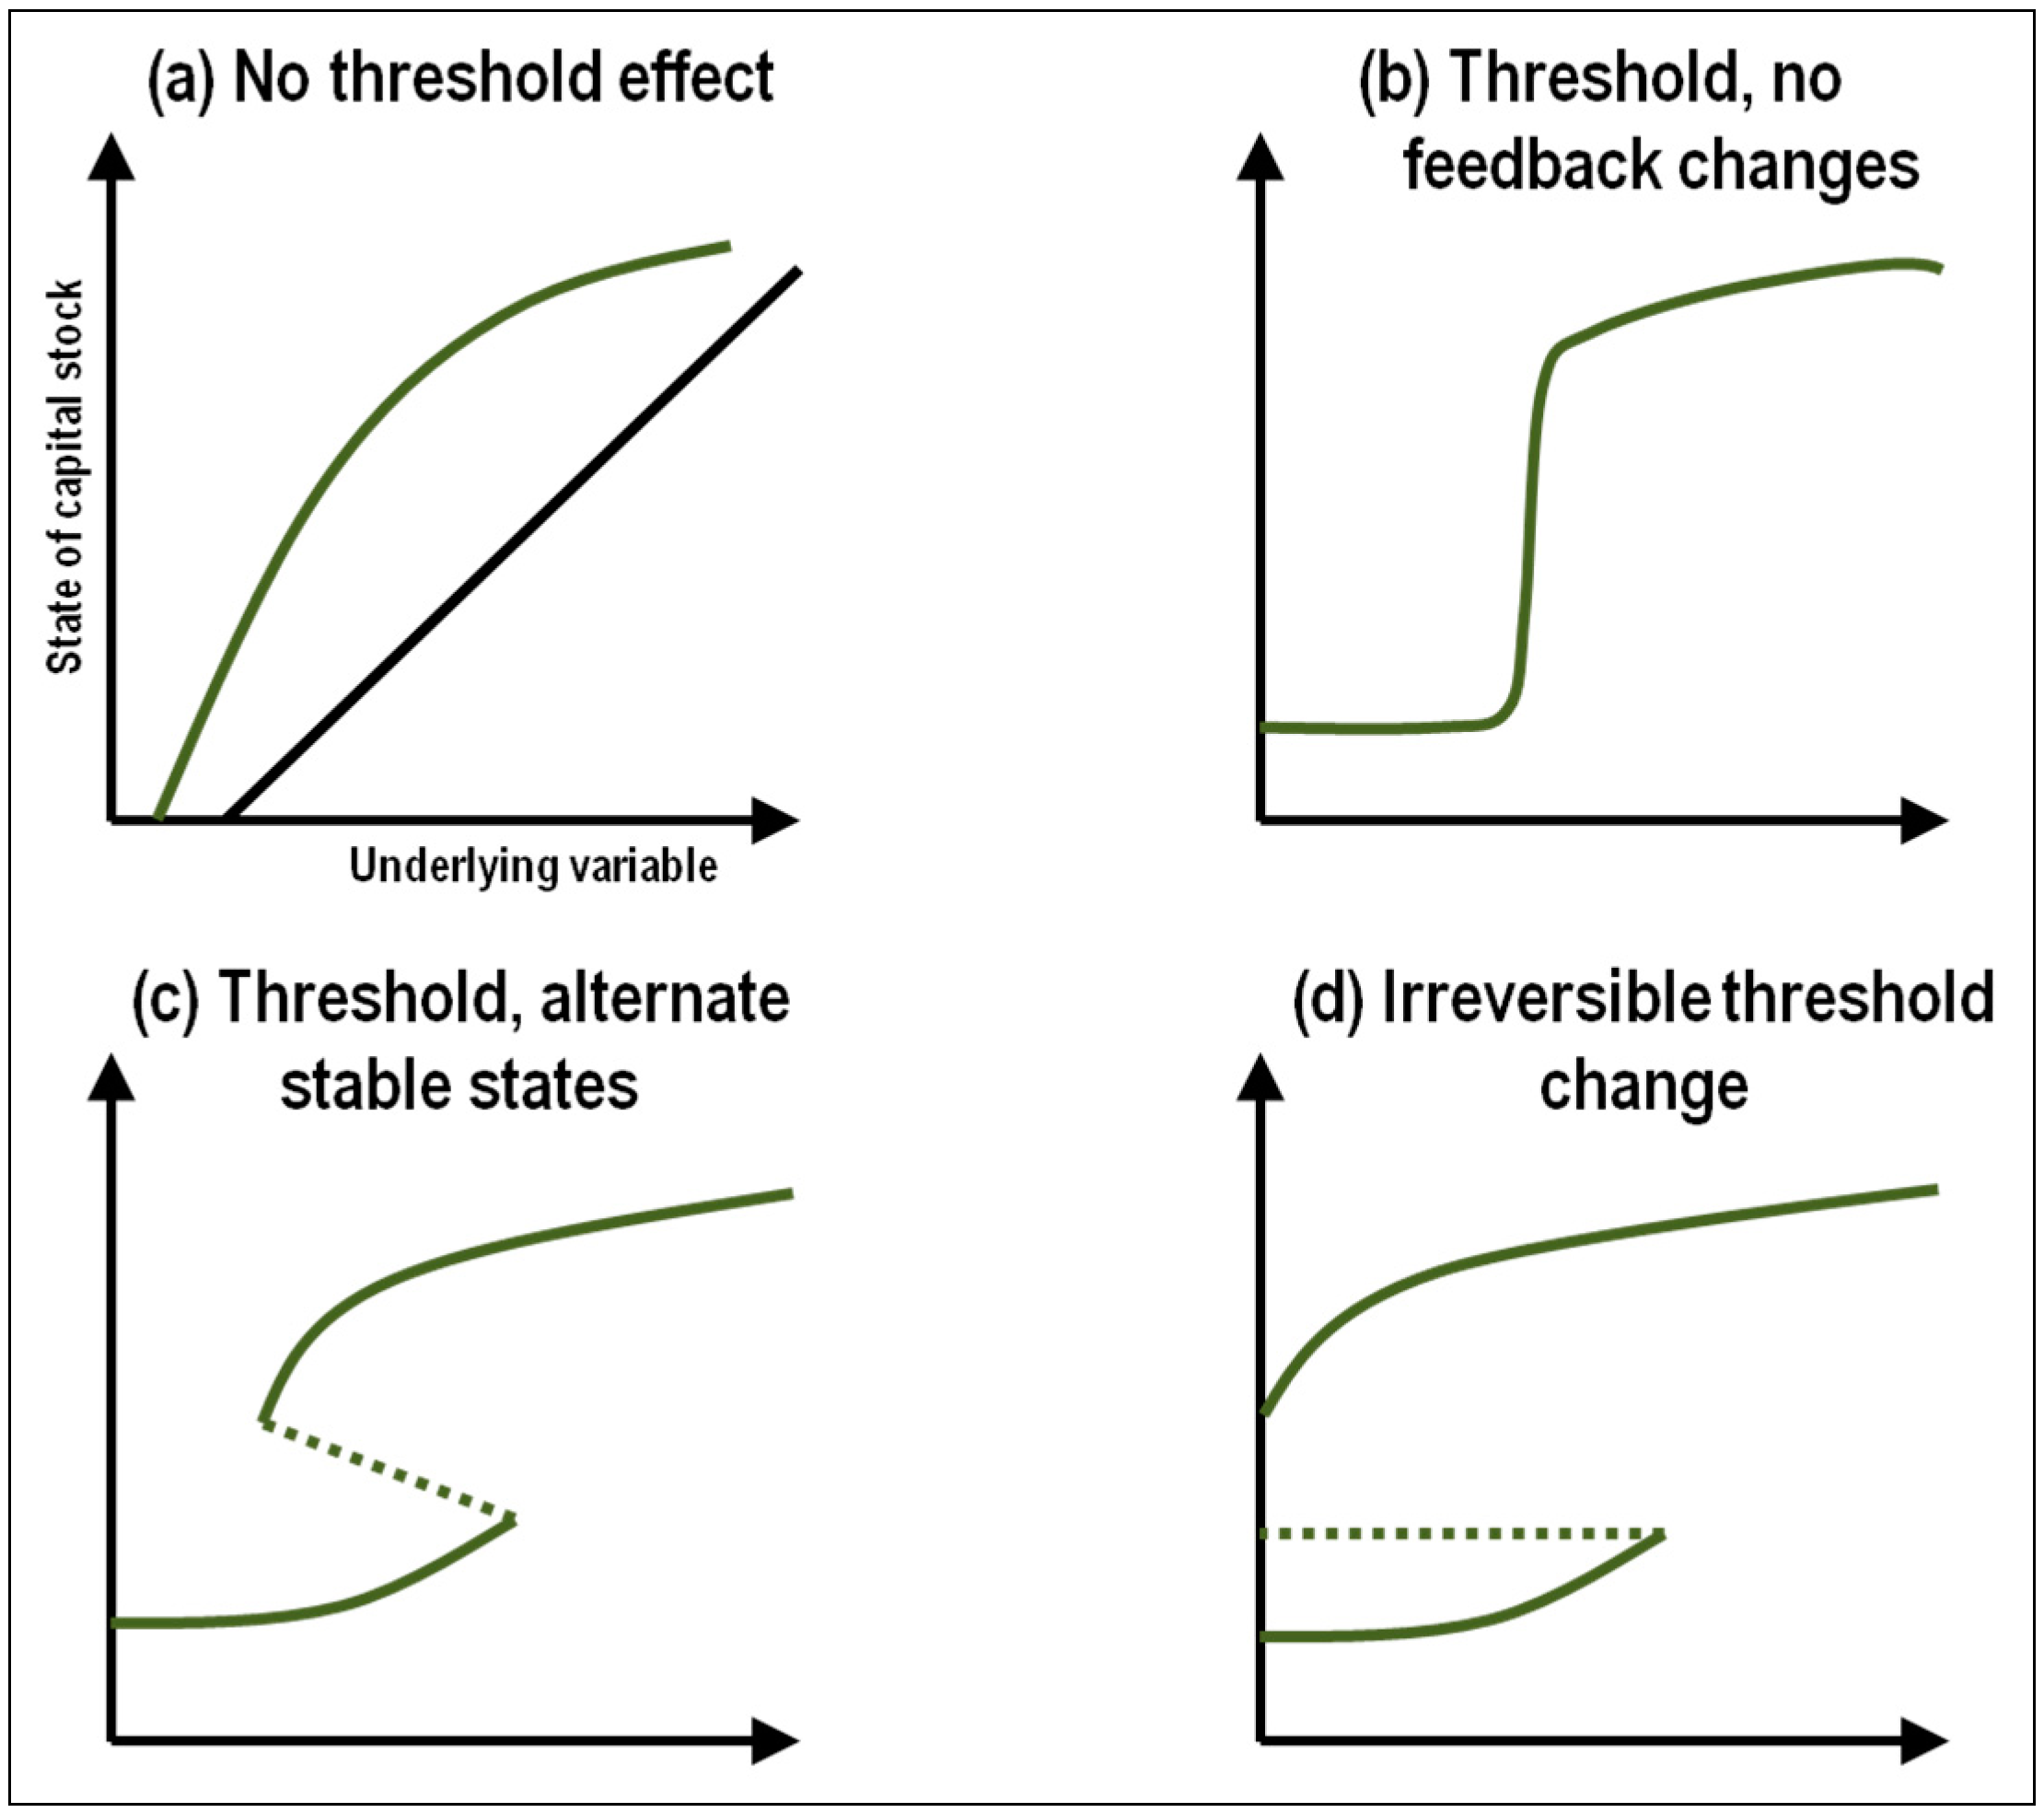
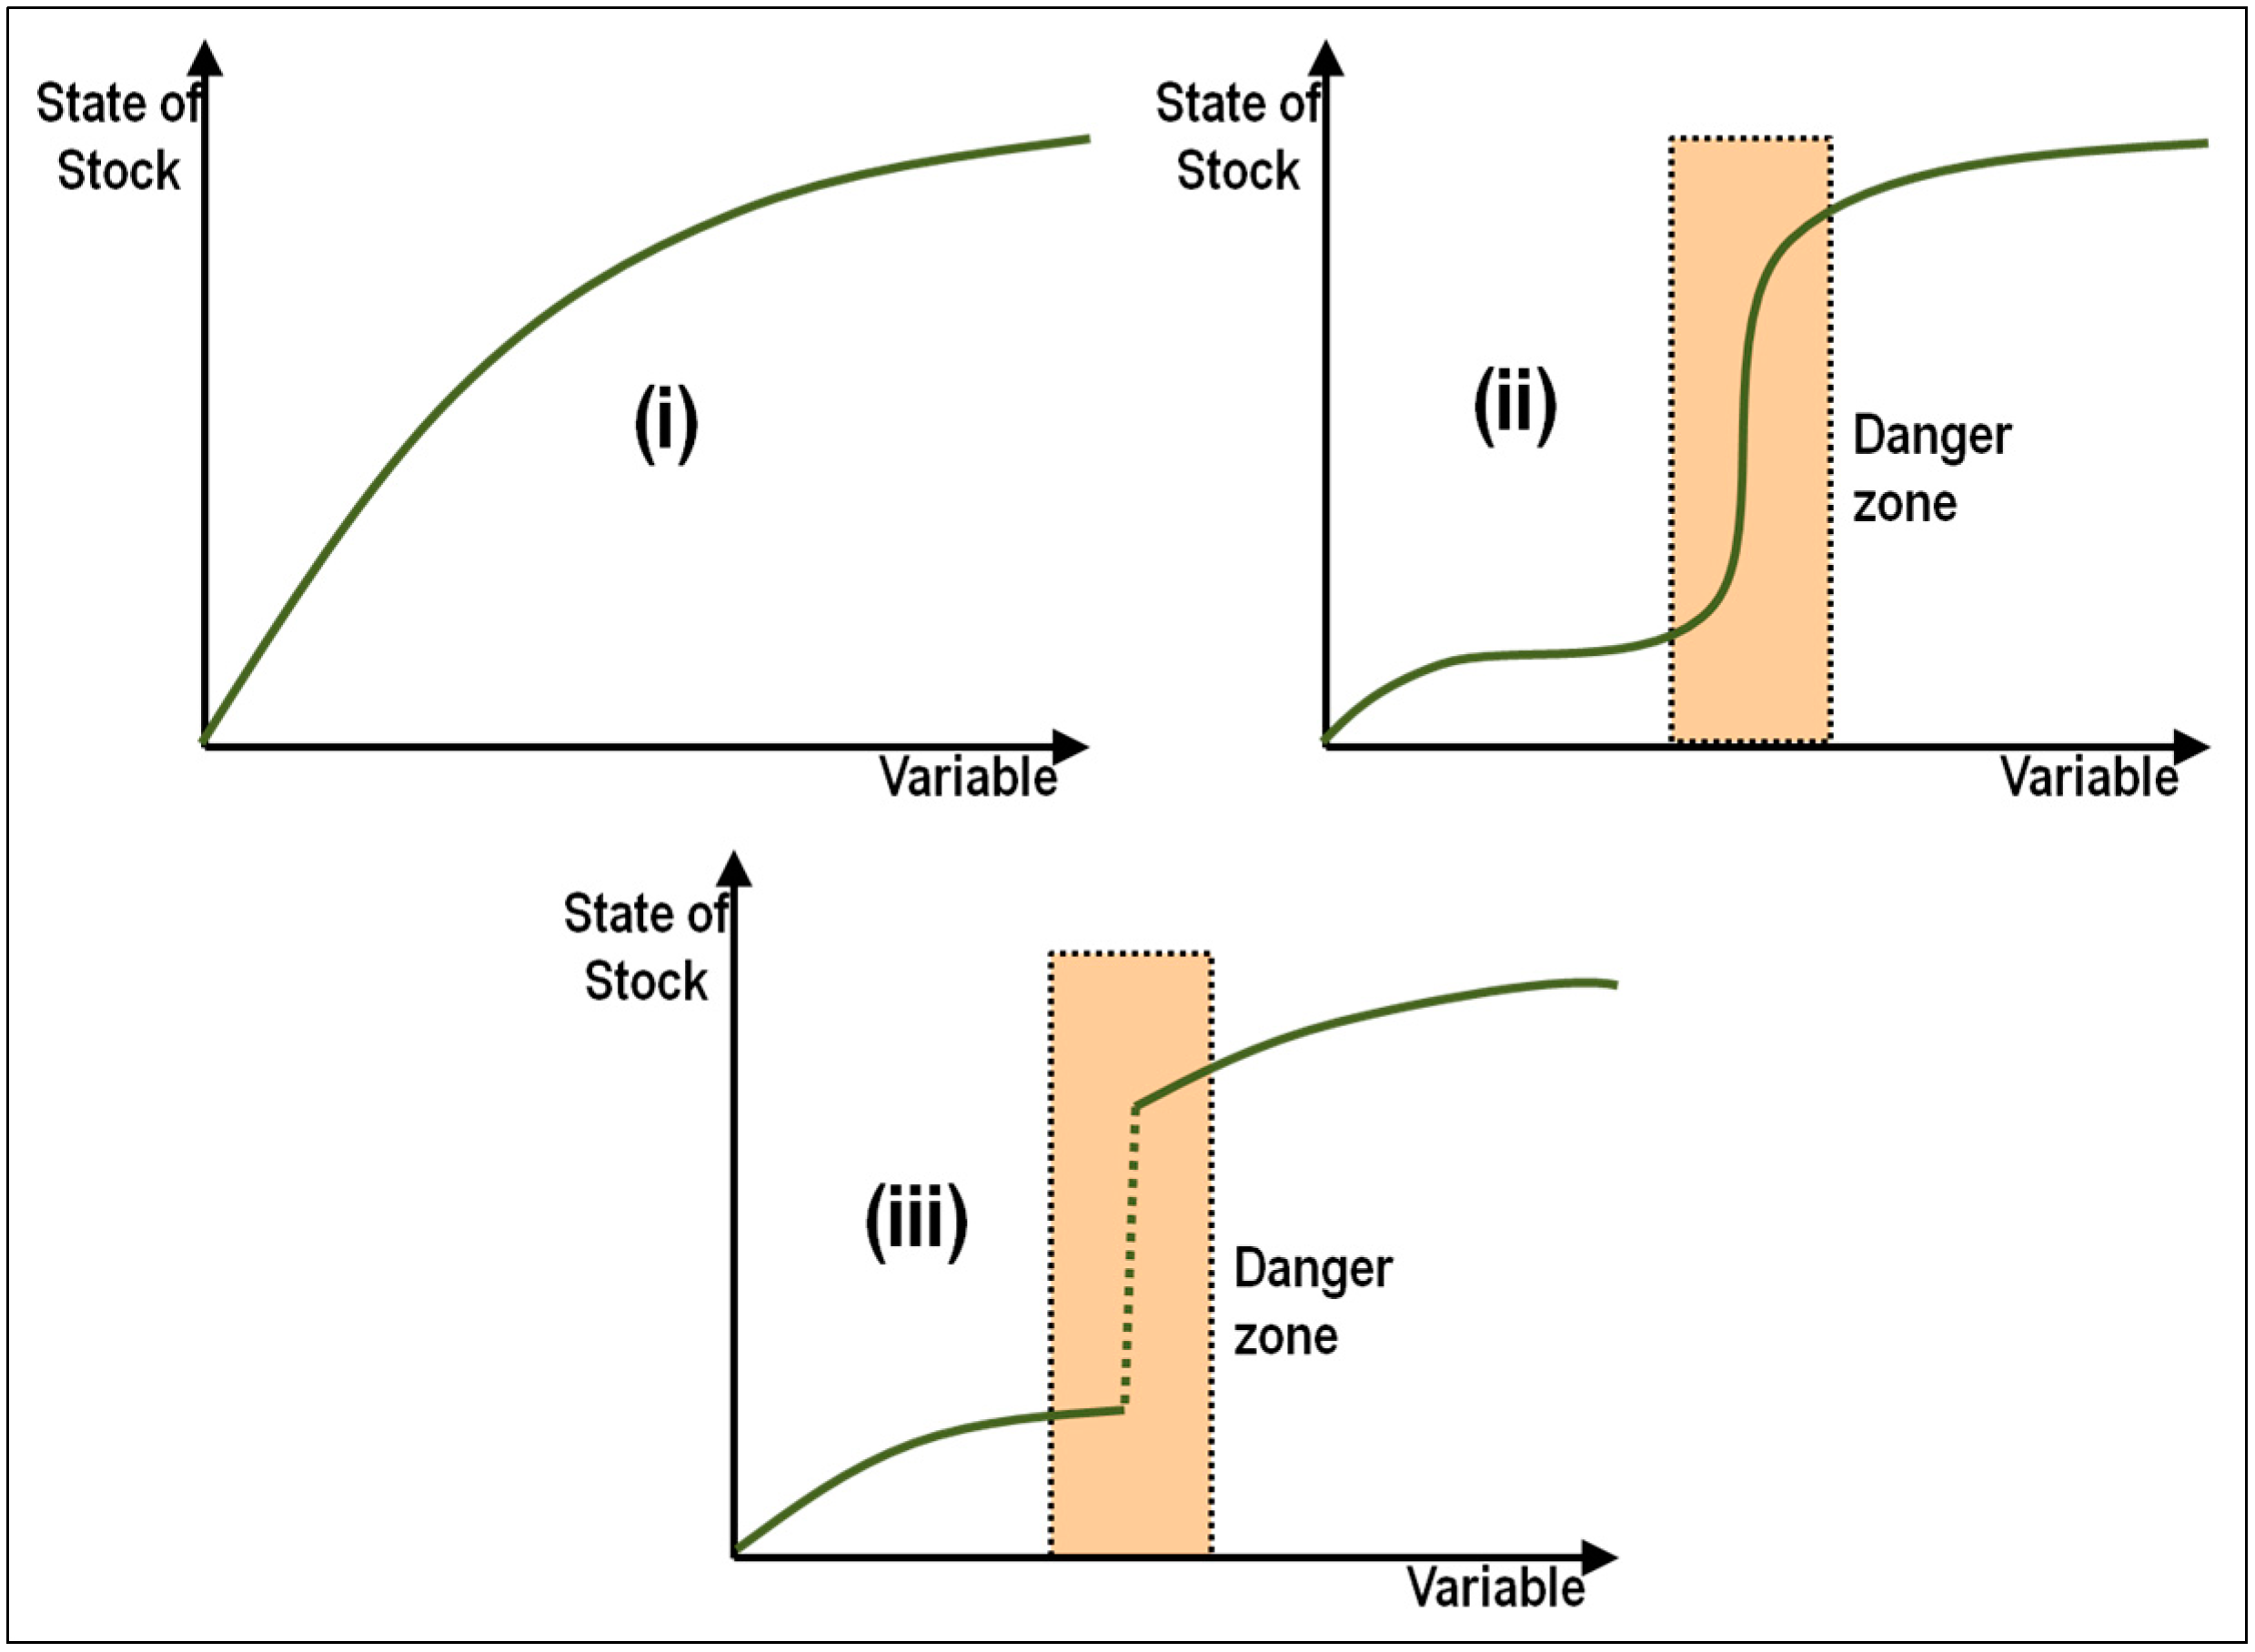
Based on Walker’s [
23] view of relationships between the state of a capital stock and the underlying variable that determines its dynamics, we propose three types of resilience that can be used to characterize each element (
Figure 3). The different resilience types are defined as follows. Type (i) represents a relationship in which there is no threshold and all the changes are reversible at any time. Type (ii) represents a relationship with a threshold in a determined moment of the underlying variable, but with total reversibility. And type (iii) represents the existence of a threshold with no possible return path.
Figure 3.
Resilience types and danger zone representation.
Figure 3.
Resilience types and danger zone representation.
Neither the threshold nor the stable states are unique, in the way that it is possible to be multiple thresholds and equilibria points. Also a danger zone is defined. This tries to represent the vulnerability of the element and can be defined as the zone next to the threshold in which the element is more likely to change state. According to this, the danger zone appears directly in Types (ii) and (iii) resilience, but this does not exclude it from appearing in Type (i) resilience situations.
We can now assign scores to resilience and vulnerability of the elements in all the different ambits, in order to construct a measure for prioritizing impacts. A maximum score of six is proposed, and these points are going to be obtained in function of the response to three different questions about the behavior of the elements to be analyzed (two points in each of the questions). Note that the absolute values of these scores are arbitrary, as only the relative values have meaning.
- (1)
Resilience appraisal. Resilience can be related to the behavior of the quality of an element confronted by changes in the environment. According to the categories defined before, we need to know the reversibility of responses to this pressure and about the existence or not of a threshold. These are the two questions that must be answered in this step and their answers will give us the score of the resilience measure for each element according to
Table 2.
Table 2.
Questions and scores in the resilience appraise of an environmental element.
Table 2.
Questions and scores in the resilience appraise of an environmental element.
| Is the Process Reversible? | Score |
| Yes | +0 |
| No | +2 |
| Is there any Threshold in the Behavior of the Element? | Score |
| Yes | +2 |
| No | +1 |
- (2)
Vulnerability assessment. Once the element resilience is defined, to assess the vulnerability it is necessary to determine if the studied variable of the element is in the so-called danger zone. To define the danger zone we suggest an area of the 5% above and below the threshold point (this 5% ensure us to delimit the surroundings of the threshold and so the zone in which the element is likely to change its status [
23]). Clearly, this assumes an ability to measure this zone. According to this distance to the threshold and the danger zone, new points are set (
Table 3).
Table 3.
Question and score in the vulnerability assessment of an environmental element.
Table 3.
Question and score in the vulnerability assessment of an environmental element.
| Is the Element in the Danger Zone? | Score |
|---|
| Yes | +0 |
| No | +2 |
At this point we define “Vulnerability Grade” as the sum of the different scores obtained in the previously questions. This value can reach a maximum of six points and a minimum of one. This minimum value, which otherwise could be zero, is set in one due to the Final Relevance Index used after in this methodology and it multiplier character: if the Vulnerability Grade could be zero, then the final index would be zero, too, independently of the importance and risk analysis of the element.
3.3. Impact Assessment
The previous phases comprise work undertaken by experts. In this third phase the participation of the population affected by the projects is going to be a key issue to help with the evaluation of two variables of the elements that define the environment. One way of collecting such information is through a stated preference survey of members of the public likely to be affected by the project. We propose to use this double point of view (both experts and affected population) in consideration to the possibility that the public importance and perception of risk of each element can differ from the vulnerability analysis made from experts. Even more, experts can assess vulnerability, but general population should not be considered with the necessary knowledge to do that.
Two variables are going to be analyzed in this phase, which are the importance and the risk perception of the element. We define importance as the relevance that an element has for each individual of the affected population. Risk is understood as the subjective probability that each one of the individuals has that an element can be affected by the project under evaluation.
So, according to this, the collected data should reveal the values held by the relevant population (Here we ignore the problem of defining what constitutes the “relevant population”, which is an awkward question when non-use values and transboundary public goods are concerned.) regarding to perceived risks and relative importance of impacts. We suggest using the scales proposed in
Table 4 and
Table 5, which are designed in a five-point-scale grade. Of course, it is likely to appear considerable heterogeneity across the relevant population both of importance values and risk perceptions. Here we simply work with mean sample values of these heterogeneous individual scores, but other approaches could be used which actually model and the incorporate both types of heterogeneity.
Table 4.
Importance scale for an environmental element.
Table 4.
Importance scale for an environmental element.
| Importance | Grade of Importance |
|---|
| Slight | 1 |
| Low | 2 |
| Medium | 3 |
| High | 4 |
| Extreme | 5 |
Table 5.
Risk scale for an environmental element.
Table 5.
Risk scale for an environmental element.
| Risk | Grade of Risk Occurrence |
|---|
| Remote occurrence | 1 |
| Low occurrence | 2 |
| Possible occurrence | 3 |
| High occurrence | 4 |
| Almost certainly occurrence | 5 |
With the results of such a survey, we can determine the “Grade of Importance” and the “Grade of Risk Occurrence” (GRO) for each one of the elements.
3.4. Ranking
In this final phase we must proceed to determine the index that is going to allow us to proceed with the ranking of the environmental impacts of the project and so decide which of these are more relevant to be included in our CBA. We remember here that this is the final objective of this methodology: to determine the impacts to be included within the CBA. This methodology tries to help to determine these relevant impacts using the perceptions of both experts and the population affected. Obviously this determination depends on the CBA limitations: if there are no time or money limits, all impacts can be studied deeply; but if there are time and money limitations to the analysis, the methodology described can be used to prioritize what gets included in the CBA.
This phase is divided into two steps:
- (1)
Compute the Final Relevance Index. In this final step, we will compute the Final Relevance Index (FRI), using the following formulation:
where
Vulnerability refers to “Vulnerability Grade” expressed in terms of one to five,
Importance refers to “Grade of Importance” expressed in terms of one to five, and
Risk refers to “Grade of Risk Occurrence” expressed in terms of one to five as obtained from the survey carried out. The 1/15 factor helps to obtain the FRI in a scale from one to 10.
This “1/15” factor derives from the maximum and minimum FRI values can obtain. The maximum can be (according to the formulation) six points for vulnerability, five points for impact and five points for risk grade, summing to a maximum of 150 points. Transforming this to a one–10 scale requires each element to be multiplied by 1/15.
- (2)
Ranking. Once we have obtained the FRI for all the elements affected by the project, we can use this value to rank them and select those more relevant to continue with the cost-benefit analysis.
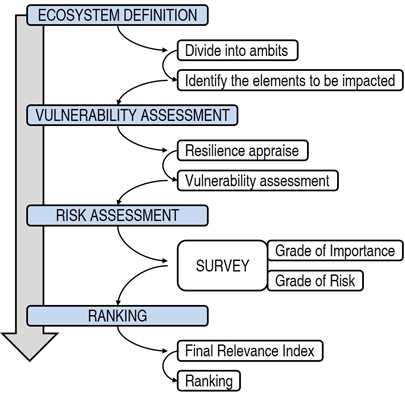
We can see summarized all the process described above in
Figure 4 and we suggest the use of a table similar to
Table 6 to proceed with the methodology.
Figure 4.
Methodology summary.
Figure 4.
Methodology summary.
Table 6.
Methodology summary.
Table 6.
Methodology summary.
| | Element | Reversible? | Threshold? | Danger Zone? | Gr. Vulnerability | Gr. Importance | GRO | FRI |
|---|
| AMBIT | | | | | | | | |
| … | … | … | … | … | … | … | … | … |
| … | … | … | … | … | … | … | … | … |
| … | … | … | … | … | … | … | … | … |
4. Application to an Actual Case Study
The Natural Park of the Dunes of Liencres is situated in the coast of Cantabria, in northern Spain. It was defined under a regional law in 1986 and its main feature is a dune system in the right margin of Pas river mouth. In 2004 the European Union declared it as a Site of Community Interest (SCI) and it was enlarged to a total extension of 54.42 hectares to include coastal areas and beaches around the river mouth. This SCI complains at least eleven interesting habitats, with special focus on the plant species living in the dunes area and all the ecosystems along the coastal cliffs.
Recently, the Government of Cantabria has started the procedure to design a Natural Resources Management Plan (NRMP) of the Dunes of Liencres, Pas forth and “Costa Quebrada” to establish the needed regulation to protect the natural park and its surrounding areas, defining the authorized, approvable and forbidden uses. This new plan has a total extension of 1753.14 hectares which implies a significant enlargement of the natural park and the SCI itself, including some more beaches and three different municipalities. The main objectives of this plan are:
- (1)
Ensure the maintenance of the ecological processes.
- (2)
Maintain the conservation of biodiversity and geodiversity.
- (3)
Develop the orderly use of the resources to ensure the sustainable exploitation of the natural ecosystem.
- (4)
Ensure the natural ecosystem preservation and conservation.
- (5)
Apply the precautionary principle in all the interventions that could affect the ecosystem, habitats and species.
In order to achieve these objectives, the plan studies different management alternatives that differ according to total area protected, but also the different uses allowed within the area. All of these alternatives have some effects on use within the area delimitated as natural park in the plan, and would affect in public use of natural areas, parking, a golf course and an industrial waste disposal emissary.
4.1. Ecosystem Definition
The first step in the methodology is to proceed with the ecosystem definition. In this case, we based our analysis on the NRMP in which a methodology based on primary land characteristics is used to define a group of environmental units [
48]. The first of the factors used to distinguish between these units is the “presence or influence of the marine ambient”. According to this, the NRMP makes a distinction between a “coastal ambient” (affected by marine dynamics) and a “terrestrial ambient” (with no relation to marine areas). In this case study we are going to focus on the first of these ambients.
Once the coastal ambient is defined, the NRMP makes two more divisions according to the existence of erosion processes, the importance of transport and sedimentation processes, high tide influence, river, coastal or wind processes. Based on the existence or not of these processes, and grouping those areas with same characteristics, the area affected by the plan for the coastal ambient is divided into five environmental units: islands, cliffs, estuary, beaches and dune system.
In the environmental assessment associated to the NRM plan we can find the enumeration of the impacts of the plan on the environment. These are listed in
Table 7.
Table 7.
Sensitive elements and their main characteristics to be affected by the plan (Government of Cantabria, 2013 [
47]).
Table 7.
Sensitive elements and their main characteristics to be affected by the plan (Government of Cantabria, 2013 [47]).
| Sensitive Elements of The Environment to Be Affected by the NRM Plan |
|---|
| Terrestrial elements | Soil |
| Forms |
| Geological heritage |
| Water quality | Surface water quality |
| Underground water quality |
| Hydric balance |
| Air quality | Quality (Light pollution) |
| Quality (Soil suspension particles) |
| Vegetation | Directive 93/42/CEE Annex I Habitats |
| Directive 93/42/CEE Annex II Species |
| Species included in the Regional Catalogue of Threatened Species |
| Wildlife | Directive 93/42/CEE Annex I Habitats |
| Directive 93/42/CEE Annex II Species |
| Species included in the Regional Catalogue of Threatened Species |
| Landscape | Landscape quality |
| Socioeconomics | Primary sector |
| Secondary sector |
| Tertiary sector |
| Heritage | Archaeological and architectonic |
With this information, we can go on to the next step of our methodology and start with the assessment of the different ecosystem attributes.
4.2. Vulnerability Assessment
To determine the values of resilience and vulnerability of each one of the elements in every ambit it is necessary to answer the questions defined in
Table 2 and
Table 3 of the methodology. This was done using a panel of experts with enough knowledge both of the area under assessment and in analyzing the different characteristics of the elements and the ambits stated before. The possible consequences of the NRMP were analyzed, especially those which affect to the actual socioeconomic uses of the natural park, which according to the text of the plan are going to be reduced and in some cases could disappear:
- (a)
Effects over the existing restaurants and food stalls near the beaches.
- (b)
Effects over the golf course near the river Pas mouth.
- (c)
Effects over the submarine waste disposal emissary from a chemical industry in the neighbor municipality.
- (d)
Effects over the existing parking sited near the beaches.
The results of this assessment are compiled in
Table A1 (can be found in the
Appendix).
4.3. Impact Assessment
In this third phase, and to evaluate the importance and the risk perception of the elements under assessment, a survey was necessary to incorporate the values and risk perceptions of the population of the area under study. A survey was undertaken to obtain these results. People surveyed were asked to rate in a one to five scale the importance and the risk perception of all of the elements of the ambits in which the area affected by the NRMP was divided. The survey was made by an online questionnaire and both people from Cantabria and the neighboring regions were asked to answer it. A total of 152 people responded but finally only 82 of those answers were completed and valid. Some more data about the survey are displayed in
Table 8.
Table 8.
Summary of the survey population classification.
Table 8.
Summary of the survey population classification.
| Total Answers | Total | 152 |
| Valid | 86 |
| Non valid | 66 |
| Gender | Male | 40 |
| Female | 45 |
| No answer | 1 |
| Knowlegdge of the Natural Park | Yes | 66 |
| No | 20 |
| No answer | - |
| Visited ever the Natural Park | Yes | 59 |
| No | 27 |
| No answer | - |
| Region | Cantabria | 50 |
| Other | 36 |
| No answer | - |
The results of the valuation of the Grade of Importance and the Grade of Risk Occurrence are shown in
Table A2 for each of the environmental elements.
4.4. Ranking
With the previous results of the vulnerability assessment and the results of the survey for the importance and the risk perception, we could then evaluate the Final Relevance Index according to the formulae proposed in the methodology. The results of this operation are summarized in
Table A3.
With these values we can now proceed to rank all the elements. In this case study we suppose that due to time and money restrictions, only ten elements can be analyzed in the CBA process. Ranking the 80 elements of the different environmental ambits in function of their FRI, the ten selected elements are the ones shown in
Table 9.
Table 9.
Ranking of the elements according to their FRI.
Table 9.
Ranking of the elements according to their FRI.
| Rank | Element |
|---|
| 1 | Beaches–Socioeconomics |
| 2 | Dune System–Landscape |
| 3 | Estuary–Socioeconomics |
| 4 | Beaches–Landscape |
| 5 | Estuary–Vegetation |
| 6 | Beaches–Terrestrial Elements |
| 7 | Estuary–Wildlife |
| 8 | Dune System–Vegetation |
| 9 | Dune System–Wildlife |
| 10 | Cliffs–Landscape |
Analyzing the results, we can observe that these elements can be grouped under two different situations: the ones with a low importance or risk valuation, but with a high resilience/vulnerability ranking according to the experts study, and the others with a low vulnerability but with a great importance or risk perception for the population affected.
Our proposed methodology plans in its third stage, during the assessment of the importance and impact, the need of a survey in the population affected by the project under evaluation. The act of taking this survey introduces in our analysis the different perceptions of a number of people, which are translated into the final index into two different ways: one by a subjective component (but we really look for this in order to take into consideration the population opinions) and other by heterogeneity in the answers given.
To obtain the “Grade of Importance” and the “Grade of Risk Occurrence” we use the average of the scores given in the survey, but the use of this doesn’t allow us to consider the dispersion of the answers. In the case study analyzed, the dispersions of the results were between 0.564 and 1.323. These values, by itself, can’t give any conclusion but allows us to calculate the coefficient of variation. This coefficient is used to be understood as “acceptable” if it is under 0.35.
There are some items (about 20%–25% of the total) which coefficient of variation exceeds this 0.35 limit (though no one of those items are above 0.40). Even that with these results we consider the methodology useful and fully usable, we decided to analyze the possibility of introducing in the FRI calculation any kind of parameter that could introduce any measure of the answers dispersion in the index.
Discarding the possibility of combining the average and the dispersion in a parameter, or the use of the interquartile range, we decided to suggest truncating the sample of answers deleting the 5% of the highest scores and the 5% of the lowest ones, reducing the total sample in a 10% (which we consider the maximum that can be deleted without affecting the final result). The conclusions we obtained doing this truncation are:
- -
The standard deviation is reduced in all the elements. Range of this reduction varies between 5.59% and 41.75%.
- -
As a consequence of the truncation, the average score is affected, with a reduction of a 1.50% on average.
- -
The truncation affects the Final Relevance Index (the average is reduced, so the FRI) but these changes mainly have not any effect on the ranking of the elements (some elements exchange its positions in pairs, but not really relevant changes).
So, the execution of the truncation allows us to reduce the heterogeneity and dispersion of the answers, but in the way that it does not affects the final index and the ranking we suggest this possibility as a technique to be used only in those cases where the coefficient of variation is really high and the answers obtained couldn’t ensure the representativeness of the sample obtained in the survey.
5. Conclusions
Traditional CBA analysis has been shown to be a very powerful instrument in the world of certainty, simple effects, short-term steps and linearity, but when irreversibility, uncertainty, complexity and the long-term are relevant issues, the method faces greater challenges. Moreover, the CBA process is time consuming and expensive, and analysts often need to decide which impacts to prioritize for consideration. In this paper, we have set out a framework for prioritizing which impacts should be considered first, based on the measures linked to concepts of resilience, risk and vulnerability.
We propose a methodology that takes into account both expert analysis on the relevant attributes of the affected areas and the views of the general public on the measure of the importance and perceived risk levels. This preserves within the prioritization process the methodological focus on benefits and costs as perceived by individuals that underlie the decision process inherent to any CBA. With a case study, our paper demonstrates how the proposed methodology can be implemented, and indicates which project impacts should be prioritized for inclusion in the CBA. Clearly, more resources and more time would allow analysts to proceed further down the ranking when undertaking the CBA. Finally, whilst our method shows how resilience, vulnerability and risk can be included in a prioritization exercise, it does not show how these three issues should best be included in the CBA itself. Coming up with a consistent treatment within the CBA exercise is clearly the next step.


