Emergy-Based Regional Socio-Economic Metabolism Analysis: An Application of Data Envelopment Analysis and Decomposition Analysis


Abstract
:1. Introduction
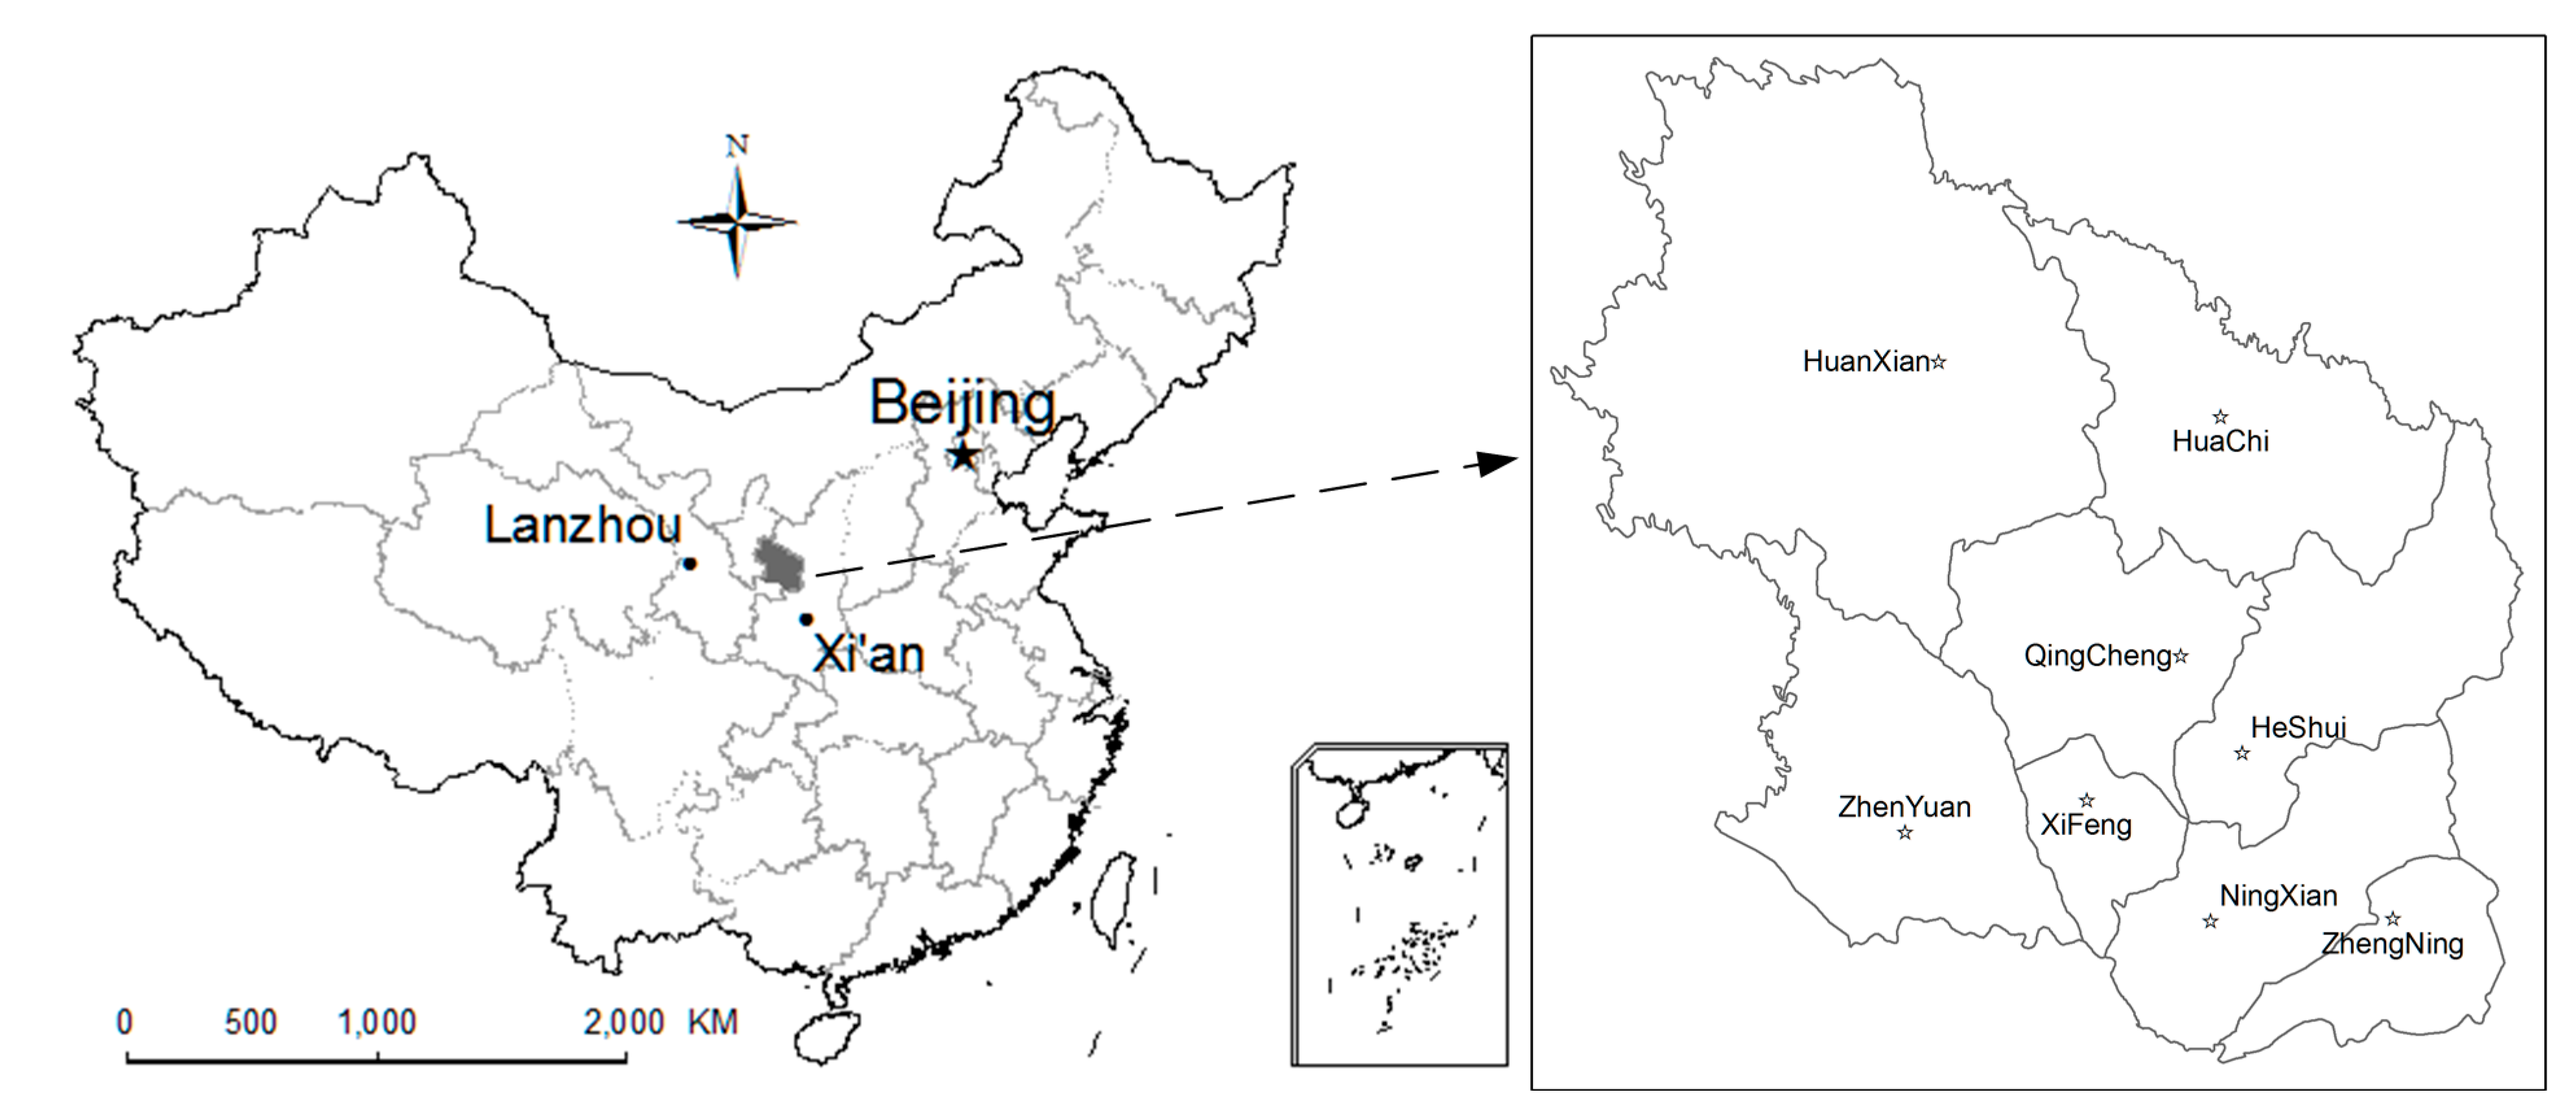
2. Research Area

3. Research Methods
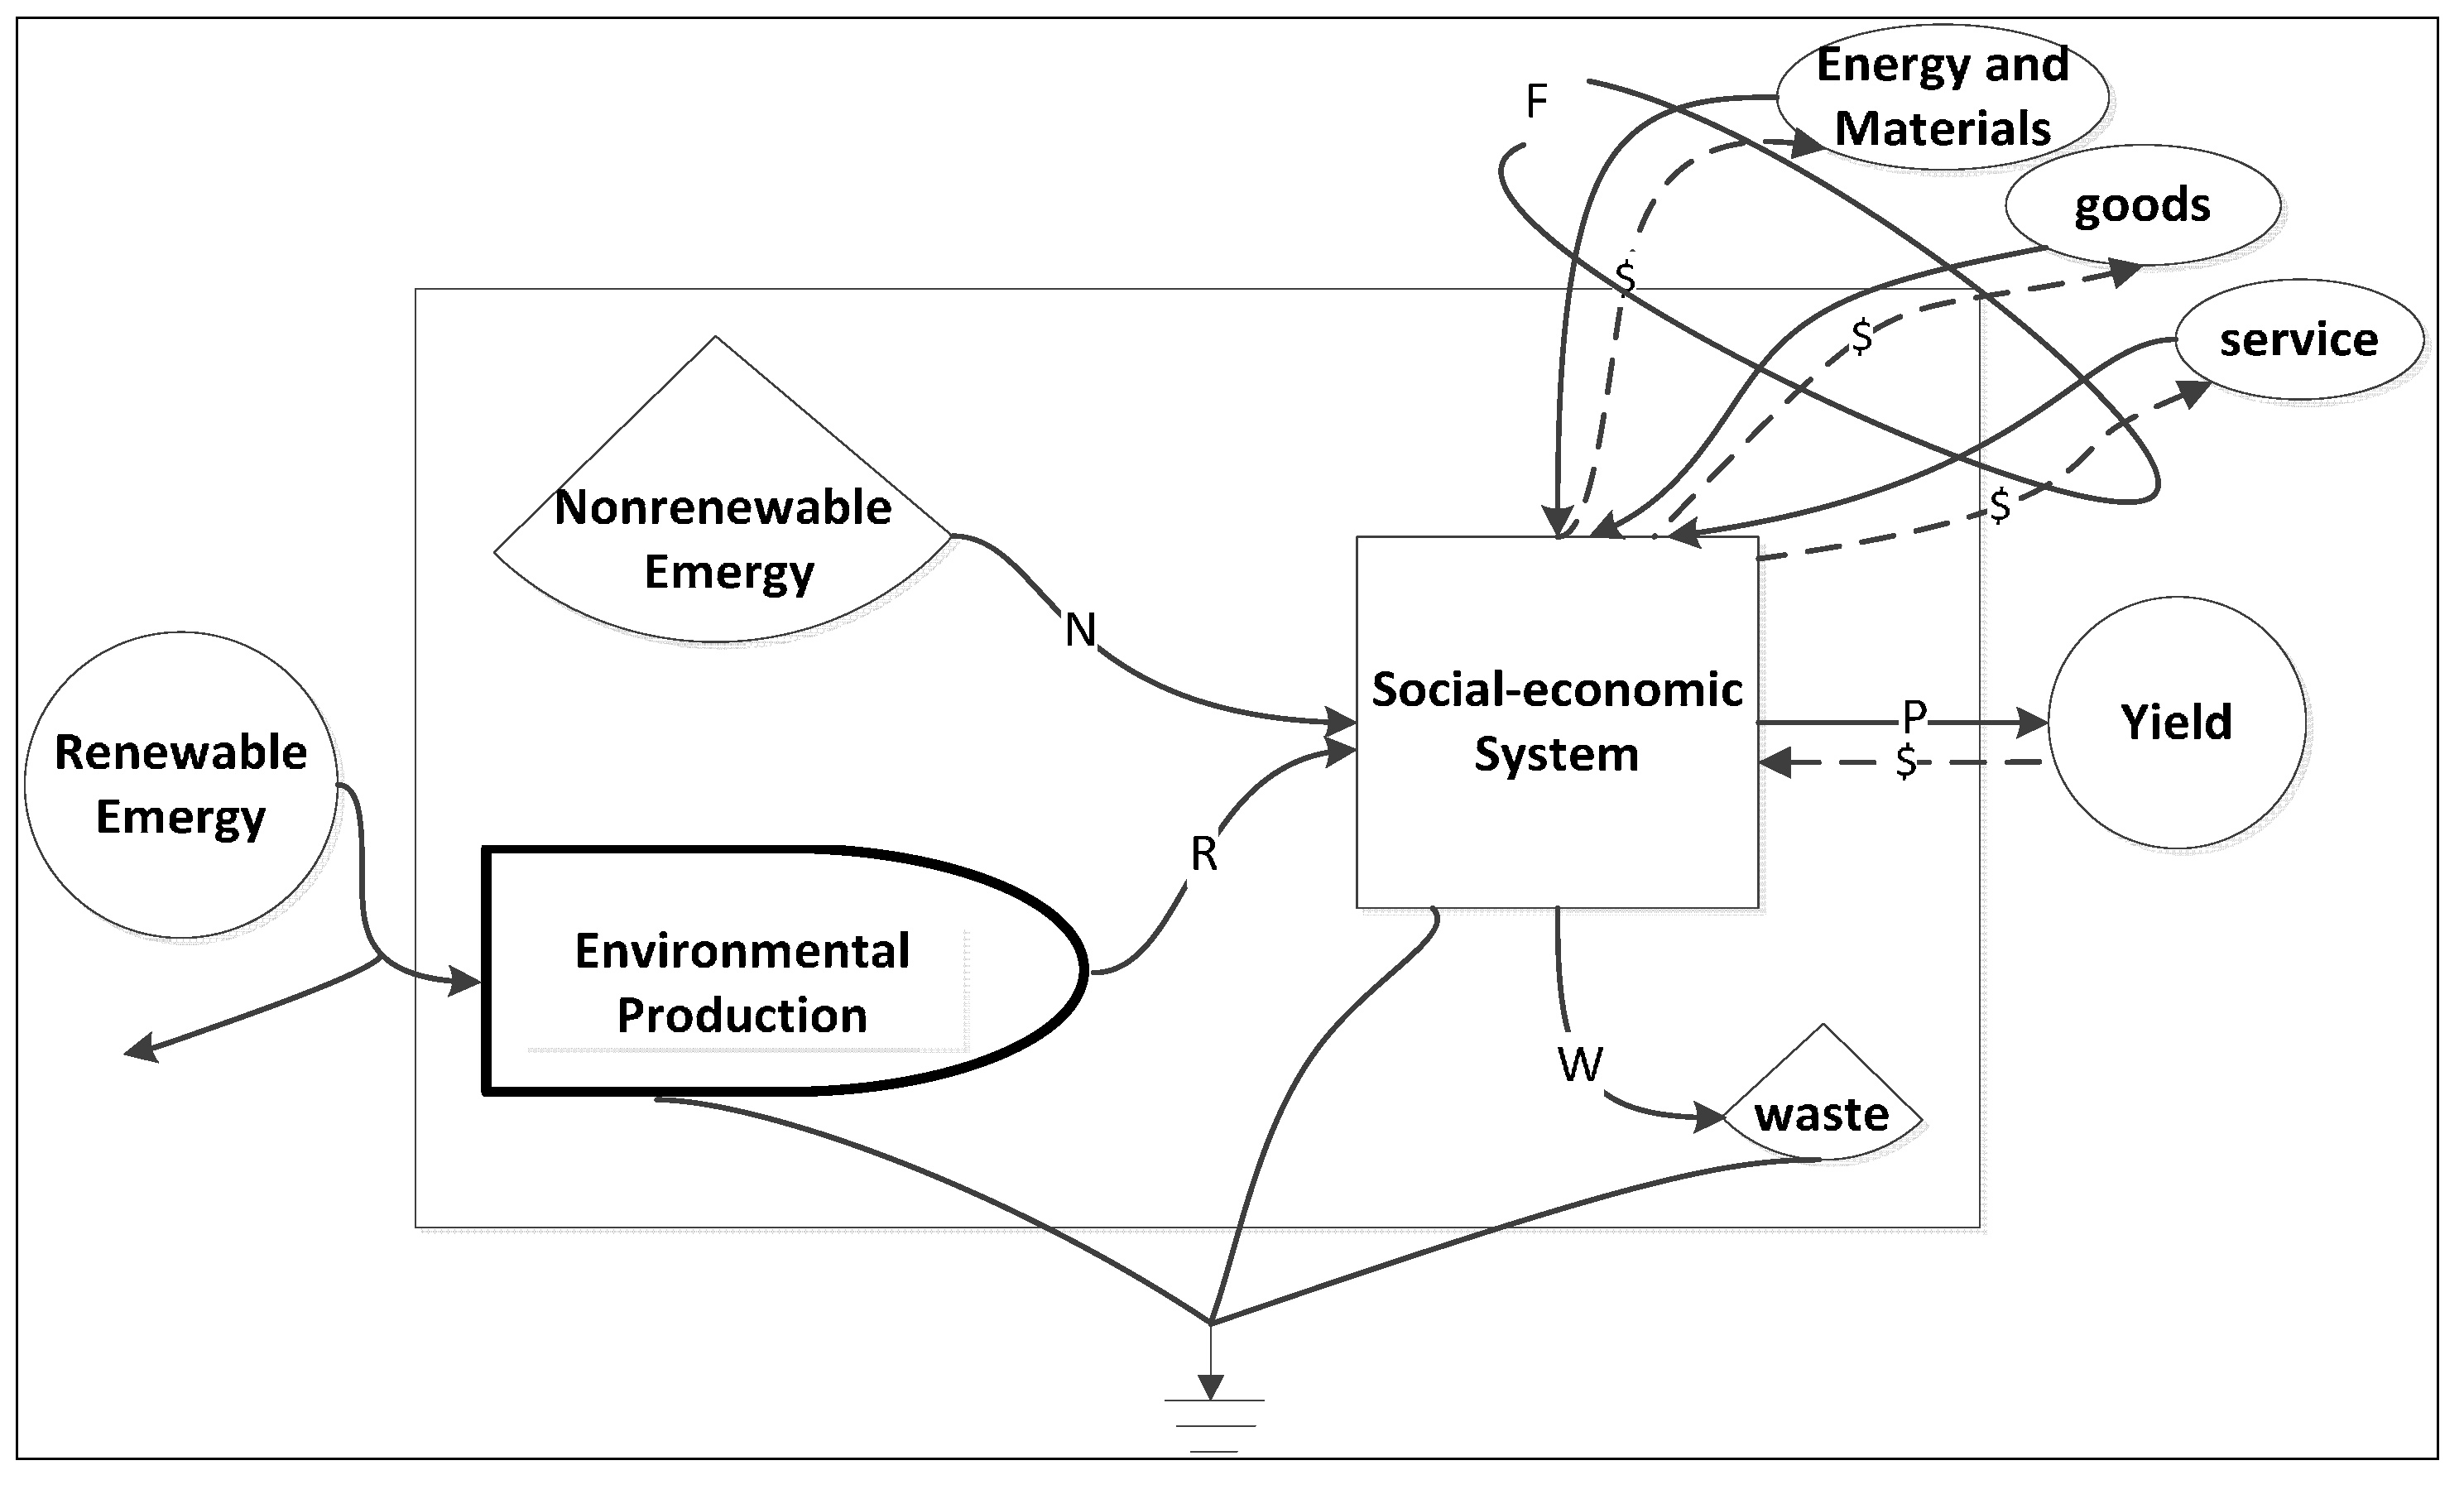
3.1. Emergy and Emergy Based Indicators


| QY | XF | QC | ZN | NX | ZY | HX | HS | HC | ||
|---|---|---|---|---|---|---|---|---|---|---|
| Area (km2) | 27,119 | 996 | 2693 | 1321 | 2654 | 3501 | 9236 | 2942 | 3776 | |
| Average altitude (m) | 1,310 | 1421 | 1310 | 1460 | 1310 | 1500 | 1612 | 1436 | 1440 | |
| Average rainfall (m/a) | 0.53 | 0.5271 | 0.498 | 0.63 | 0.56 | 0.39 | 0.646 | 0.56 | 0.46 | |
| Population (1000 person) | 2626.9 | 341 | 331.8 | 240.9 | 535.8 | 523.3 | 349.1 | 168.1 | 131.7 | |
| Population growth rate (‰) | 7.41 | 7.12 | 7.26 | 7.50 | 7.12 | 7.10 | 7.76 | 7.54 | 7.45 | |
| GDP (million $) | 2640.98 | 675.96 | 697.00 | 114.86 | 208.18 | 188.98 | 151.37 | 99.49 | 442.58 | |
| GDP per capita ($) | 1005 | 1605 | 2112 | 478 | 385 | 363 | 432 | 585 | 3404 | |
| Industrial Structures | Primary (%) | 16.15 | 11.55 | 7.17 | 40.30 | 36.58 | 42.17 | 20.30 | 40.84 | 5.80 |
| Secondary (%) | 59.22 | 51.9 | 81.66 | 12.90 | 24.50 | 20.67 | 46.60 | 24.32 | 84.80 | |
| Tertiary (%) | 24.63 | 36.6 | 11.17 | 46.80 | 38.91 | 37.16 | 33.10 | 34.84 | 9.30 | |
3.2. Data Envelopment Analysis
3.3. Decomposition Analysis


4. Results
4.1. Overview of the Emergy Results of Qingyang and the Eight Sub-Regions
| Category | Emergy Index | Meaning | Calculation |
|---|---|---|---|
| Emergy Flows | Renewable Input Emergy (R) | local renewable resource input | |
| Emergy Structure | The Ratio of R, N and F to U | The ratio reflects the contributions of renewable, nonrenewable and feedback emergy to the total emergy input of the regional system at the input side | R/U; N/U; F/U |
| Emergy-Efficiency | Net Emergy Yield Ratio (NEYR) | NEYR reflects the supporting capability of local resources to economic development; meanwhile, it accounts for whether the economic system has competitiveness in supplying primary energy and resource [33,68] | P/F |
| Emergy Investment Ratio (EIR) | EIR shows the efficiency of the usage of feedback emergy compared with local renewable and nonrenewable emergy. | F/(N + R) | |
| Emergy Money Ratio (EMR) | EMR shows the level of economic development. In general, a developed economic system has lower EMR as fast money circulation, while a rural area has higher EMR as a large percentage of unpaid local emergy input [33]. | U/GDP | |
| Emergy Per Capita (EPC) | EPC reflects the residents’ living standard from the emergy perspective. | U/population | |
| Emergy Density (ED) | ED shows spatial concentration of emergy flow within the regional system. Usually, a developed economic system has higher ED [33,68]. | U/Area | |
| Environment Pressure | Emergy Waste Ratio (EWR) | the waste discharge level in the input-side perspective | W/U |
| Waste Output Ratio (WOR) | the waste discharge level in the output-side perspective | W/P | |
| Environment Loading Ratio (ELR) | ELR shows the pressure of social-economic activities on the local ecosystem [67]. | (F + N)/R | |
| Integrated Indicator | Emergy Sustainability Index (ESI) | A sustainable system should have higher NEYR and lower ELR. Usually, when ESI < 1, it is a consumption system; when 1 < ESI < 10, it is an energetic system with enormous potentials for further development; while when ESI > 10, the system is economically lagging behind [69,70,71] | NEYR/ELR |
| QY | XF | QC | ZN | NX | ZY | HX | HS | HC | |
|---|---|---|---|---|---|---|---|---|---|
| Emergy Flows | |||||||||
| R (× 1020 sej) | 41.8 | 1.81 | 5.15 | 2.44 | 4.29 | 3.37 | 15.3 | 1.55 | 4.19 |
| N (× 1020 sej) | 108.6 | 0.34 | 25.1 | 4.85 | 3.76 | 0.25 | 1.27 | 2.71 | 0.44 |
| F (× 1020 sej) | 27.2 | 64.4 | 1.69 | 0.51 | 2.54 | 4.39 | 4.95 | 2.26 | 1.09 |
| P (× 1021 sej) | 2.22 | 1.41 | 6.07 | 0.72 | 3.22 | 1.76 | 5.63 | 0.79 | 0.63 |
| W (× 1019 sej) | 39.23 | 9.31 | 7.78 | 7.31 | 3.71 | 0.7 | 1.13 | 5.69 | 3.61 |
| Emergy Structure | |||||||||
| R/ U (%) | 23.54 | 2.73 | 16.12 | 31.33 | 40.49 | 42.19 | 71.08 | 23.79 | 73.24 |
| N/U (%) | 61.13 | 0.51 | 78.58 | 62.18 | 35.49 | 2.82 | 5.91 | 41.58 | 7.7 |
| F/ U (%) | 15.32 | 96.76 | 5.3 | 6.49 | 24.01 | 54.99 | 24.01 | 34.63 | 19.03 |
| Emergy Efficiency | |||||||||
| NYER | 8.15 | 0.22 | 35.9 | 14.24 | 12.66 | 4.01 | 11.37 | 3.52 | 5.75 |
| EIR | 0.18 | 29.87 | 0.06 | 0.07 | 0.31 | 1.22 | 0.3 | 0.53 | 0.24 |
| EMR (× 1012 sej/$) | 6.732 | 9.85 | 4.58 | 6.79 | 5.09 | 4.23 | 1.42 | 6.55 | 1.29 |
| EPC (× 1015) | 6.76 | 19.5 | 9.62 | 3.24 | 2.16 | 1.53 | 6.16 | 5.66 | 17.7 |
| ED (× 1011) | 6.5 | 66.8 | 11.9 | 5.91 | 4.37 | 2.28 | 2.33 | 3.23 | 6.18 |
| Environmental Pressure | |||||||||
| EWR | 0.022 | 0.014 | 0.02 | 0.09 | 0.035 | 0.009 | 0.005 | 0.087 | 0.063 |
| WOR | 0.018 | 0.07 | 0.01 | 0.1 | 0.01 | 0.003 | 0.002 | 0.07 | 0.06 |
| ELR | 3.25 | 35.68 | 5.2 | 2.19 | 1.47 | 1.37 | 0.41 | 3.2 | 0.37 |
| ESI | 2.51 | 0.006 | 6.9 | 6.5 | 8.61 | 2.92 | 27.94 | 1.1 | 15.74 |
4.2. Emergy-Based Data Envelopment Analysis
| 2000 | 2001 | 2002 | 2003 | 2004 | 2005 | 2006 | 2007 | |
|---|---|---|---|---|---|---|---|---|
| XF | 0.115 | 0.117 | 0.133 | 0.087 | 0.116 | 0.162 | 0.213 | 0.198 |
| QC | 0.423 | 0.951 | 1.000 | 1.000 | 1.000 | 1.000 | 1.000 | 1.000 |
| ZN | 0.697 | 1.000 | 0.827 | 0.810 | 0.802 | 0.808 | 0.807 | 0.805 |
| NX | 1.000 | 0.584 | 1.000 | 1.000 | 1.000 | 0.816 | 0.528 | 0.802 |
| ZY | 1.000 | 1.000 | 1.000 | 1.000 | 1.000 | 1.000 | 1.000 | 1.000 |
| HX | 1.000 | 1.000 | 1.000 | 1.000 | 1.000 | 1.000 | 1.000 | 1.000 |
| HS | 0.309 | 0.268 | 0.294 | 0.344 | 0.284 | 0.268 | 0.292 | 0.252 |
| HC | 0.805 | 0.764 | 0.873 | 0.762 | 0.738 | 0.759 | 0.770 | 0.766 |
| Average | 0.669 | 0.711 | 0.766 | 0.750 | 0.743 | 0.727 | 0.701 | 0.728 |
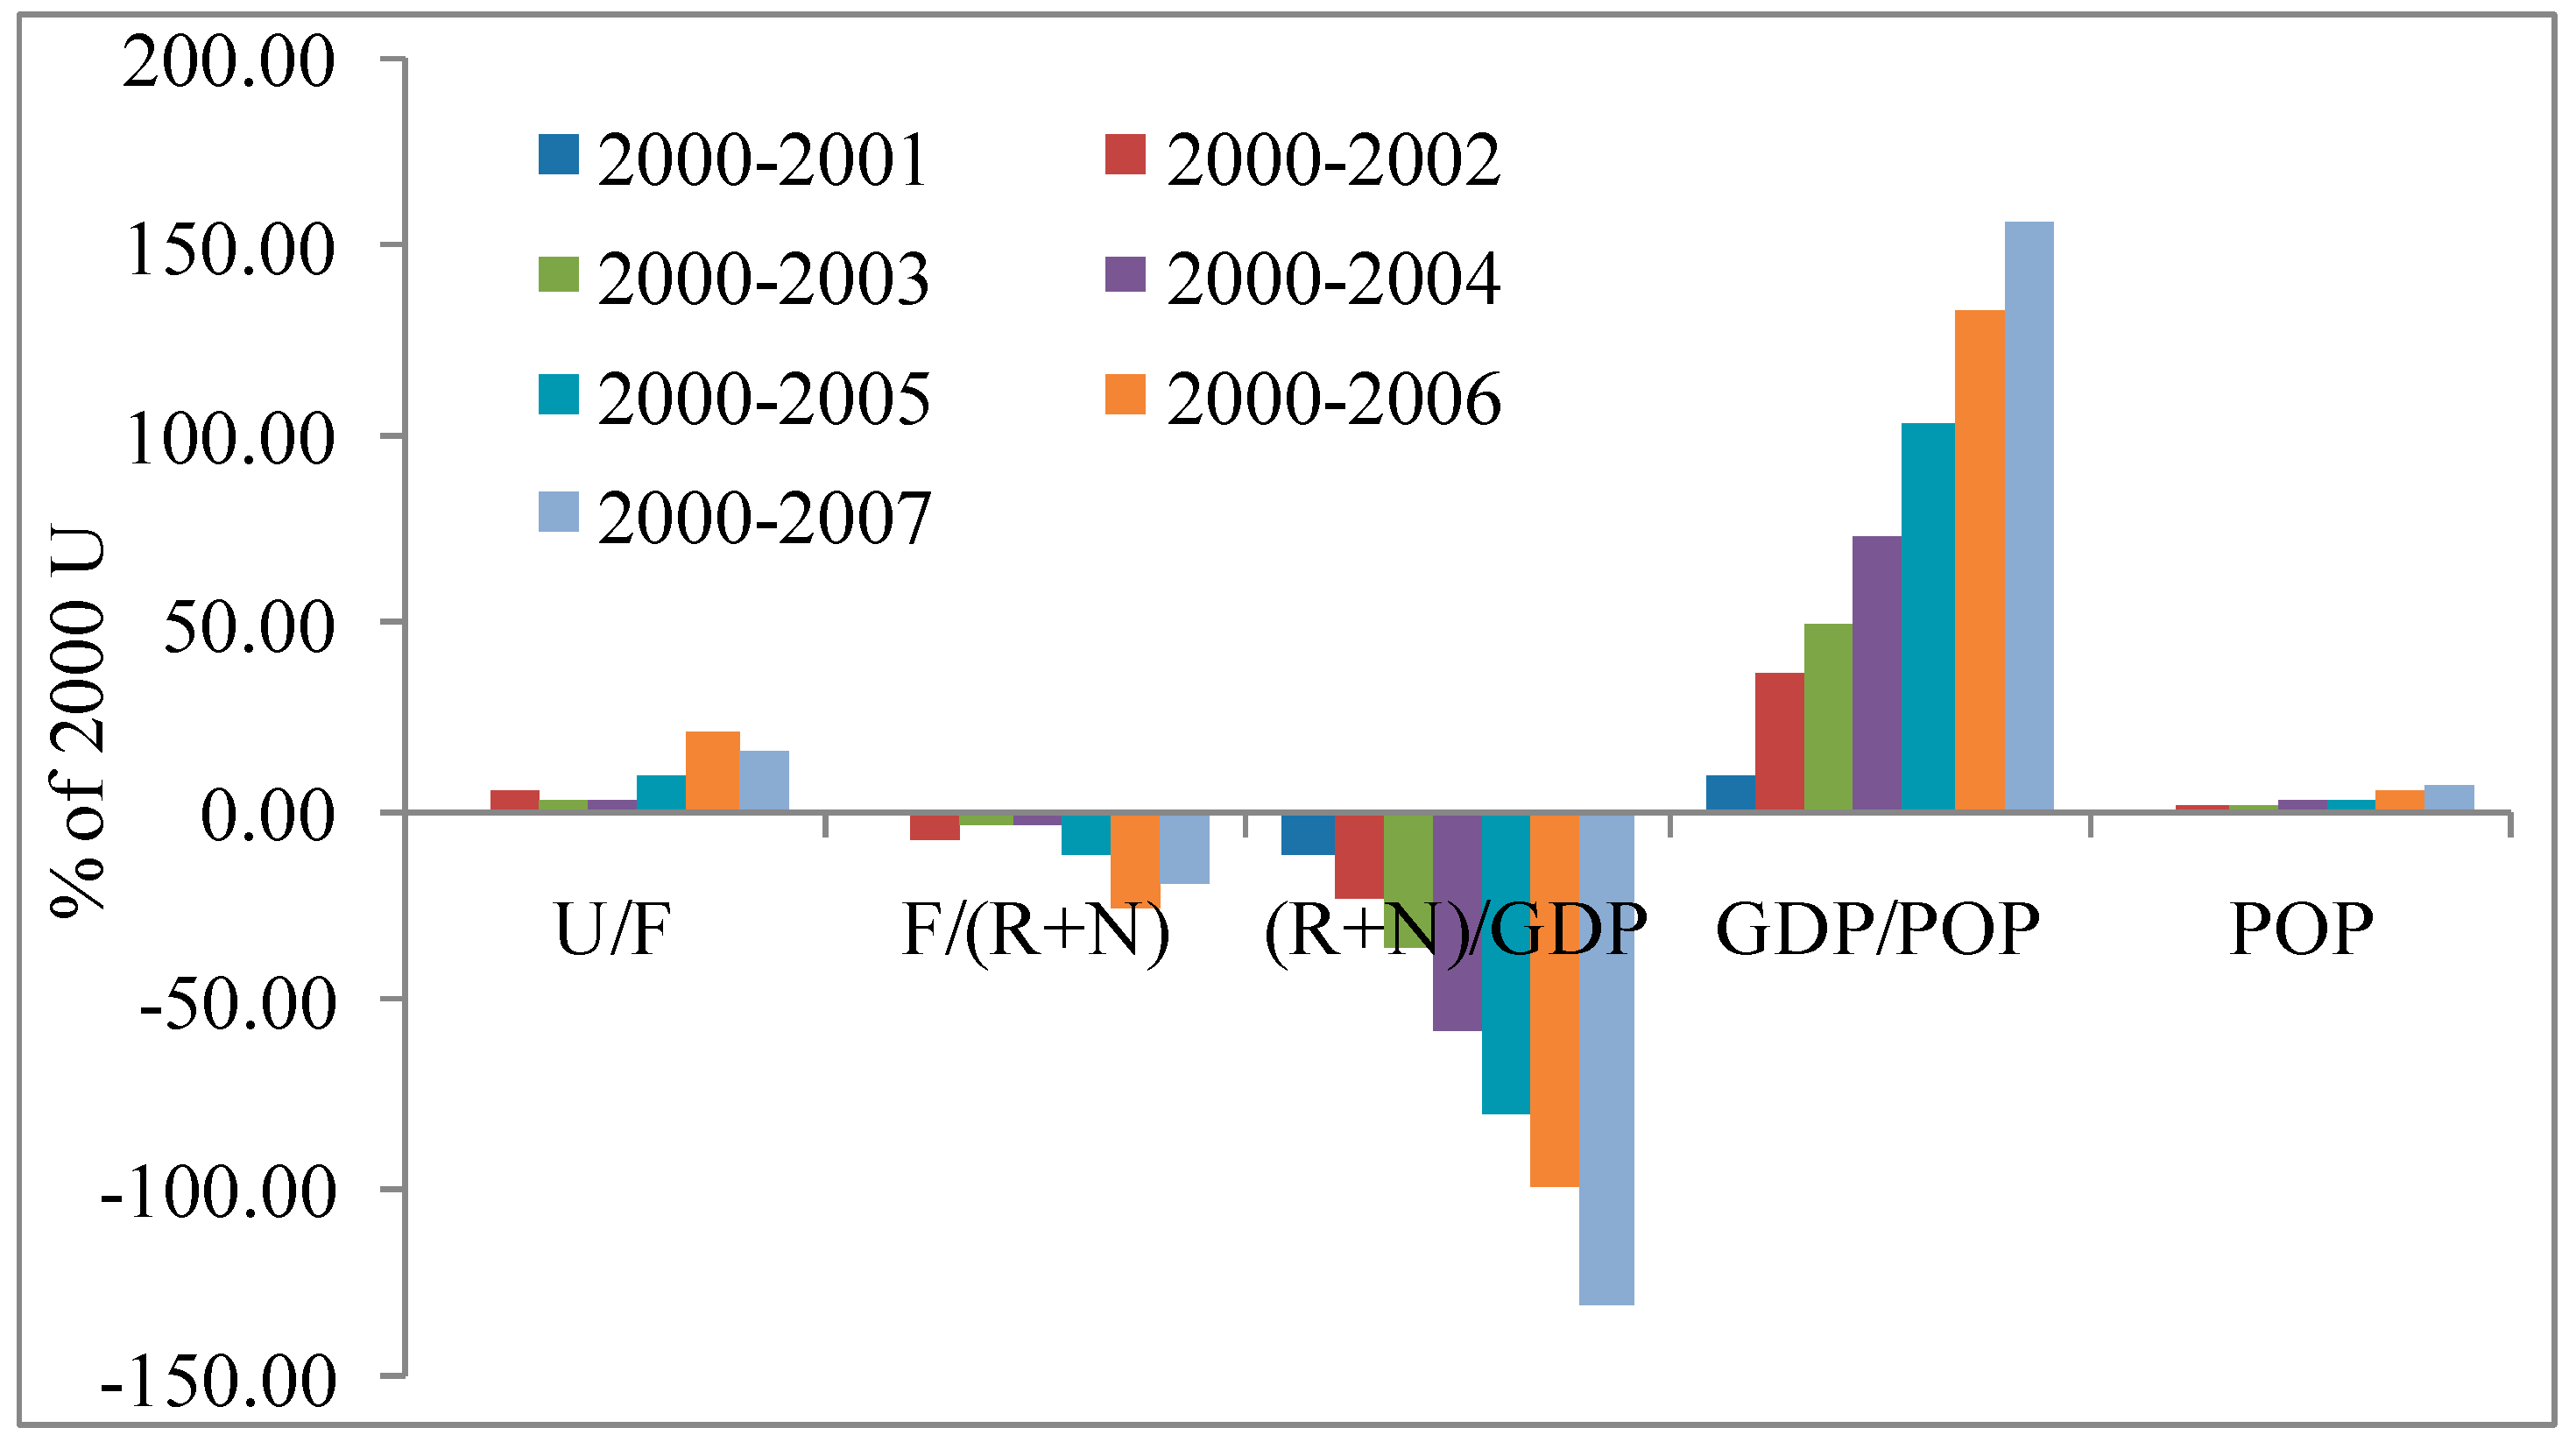
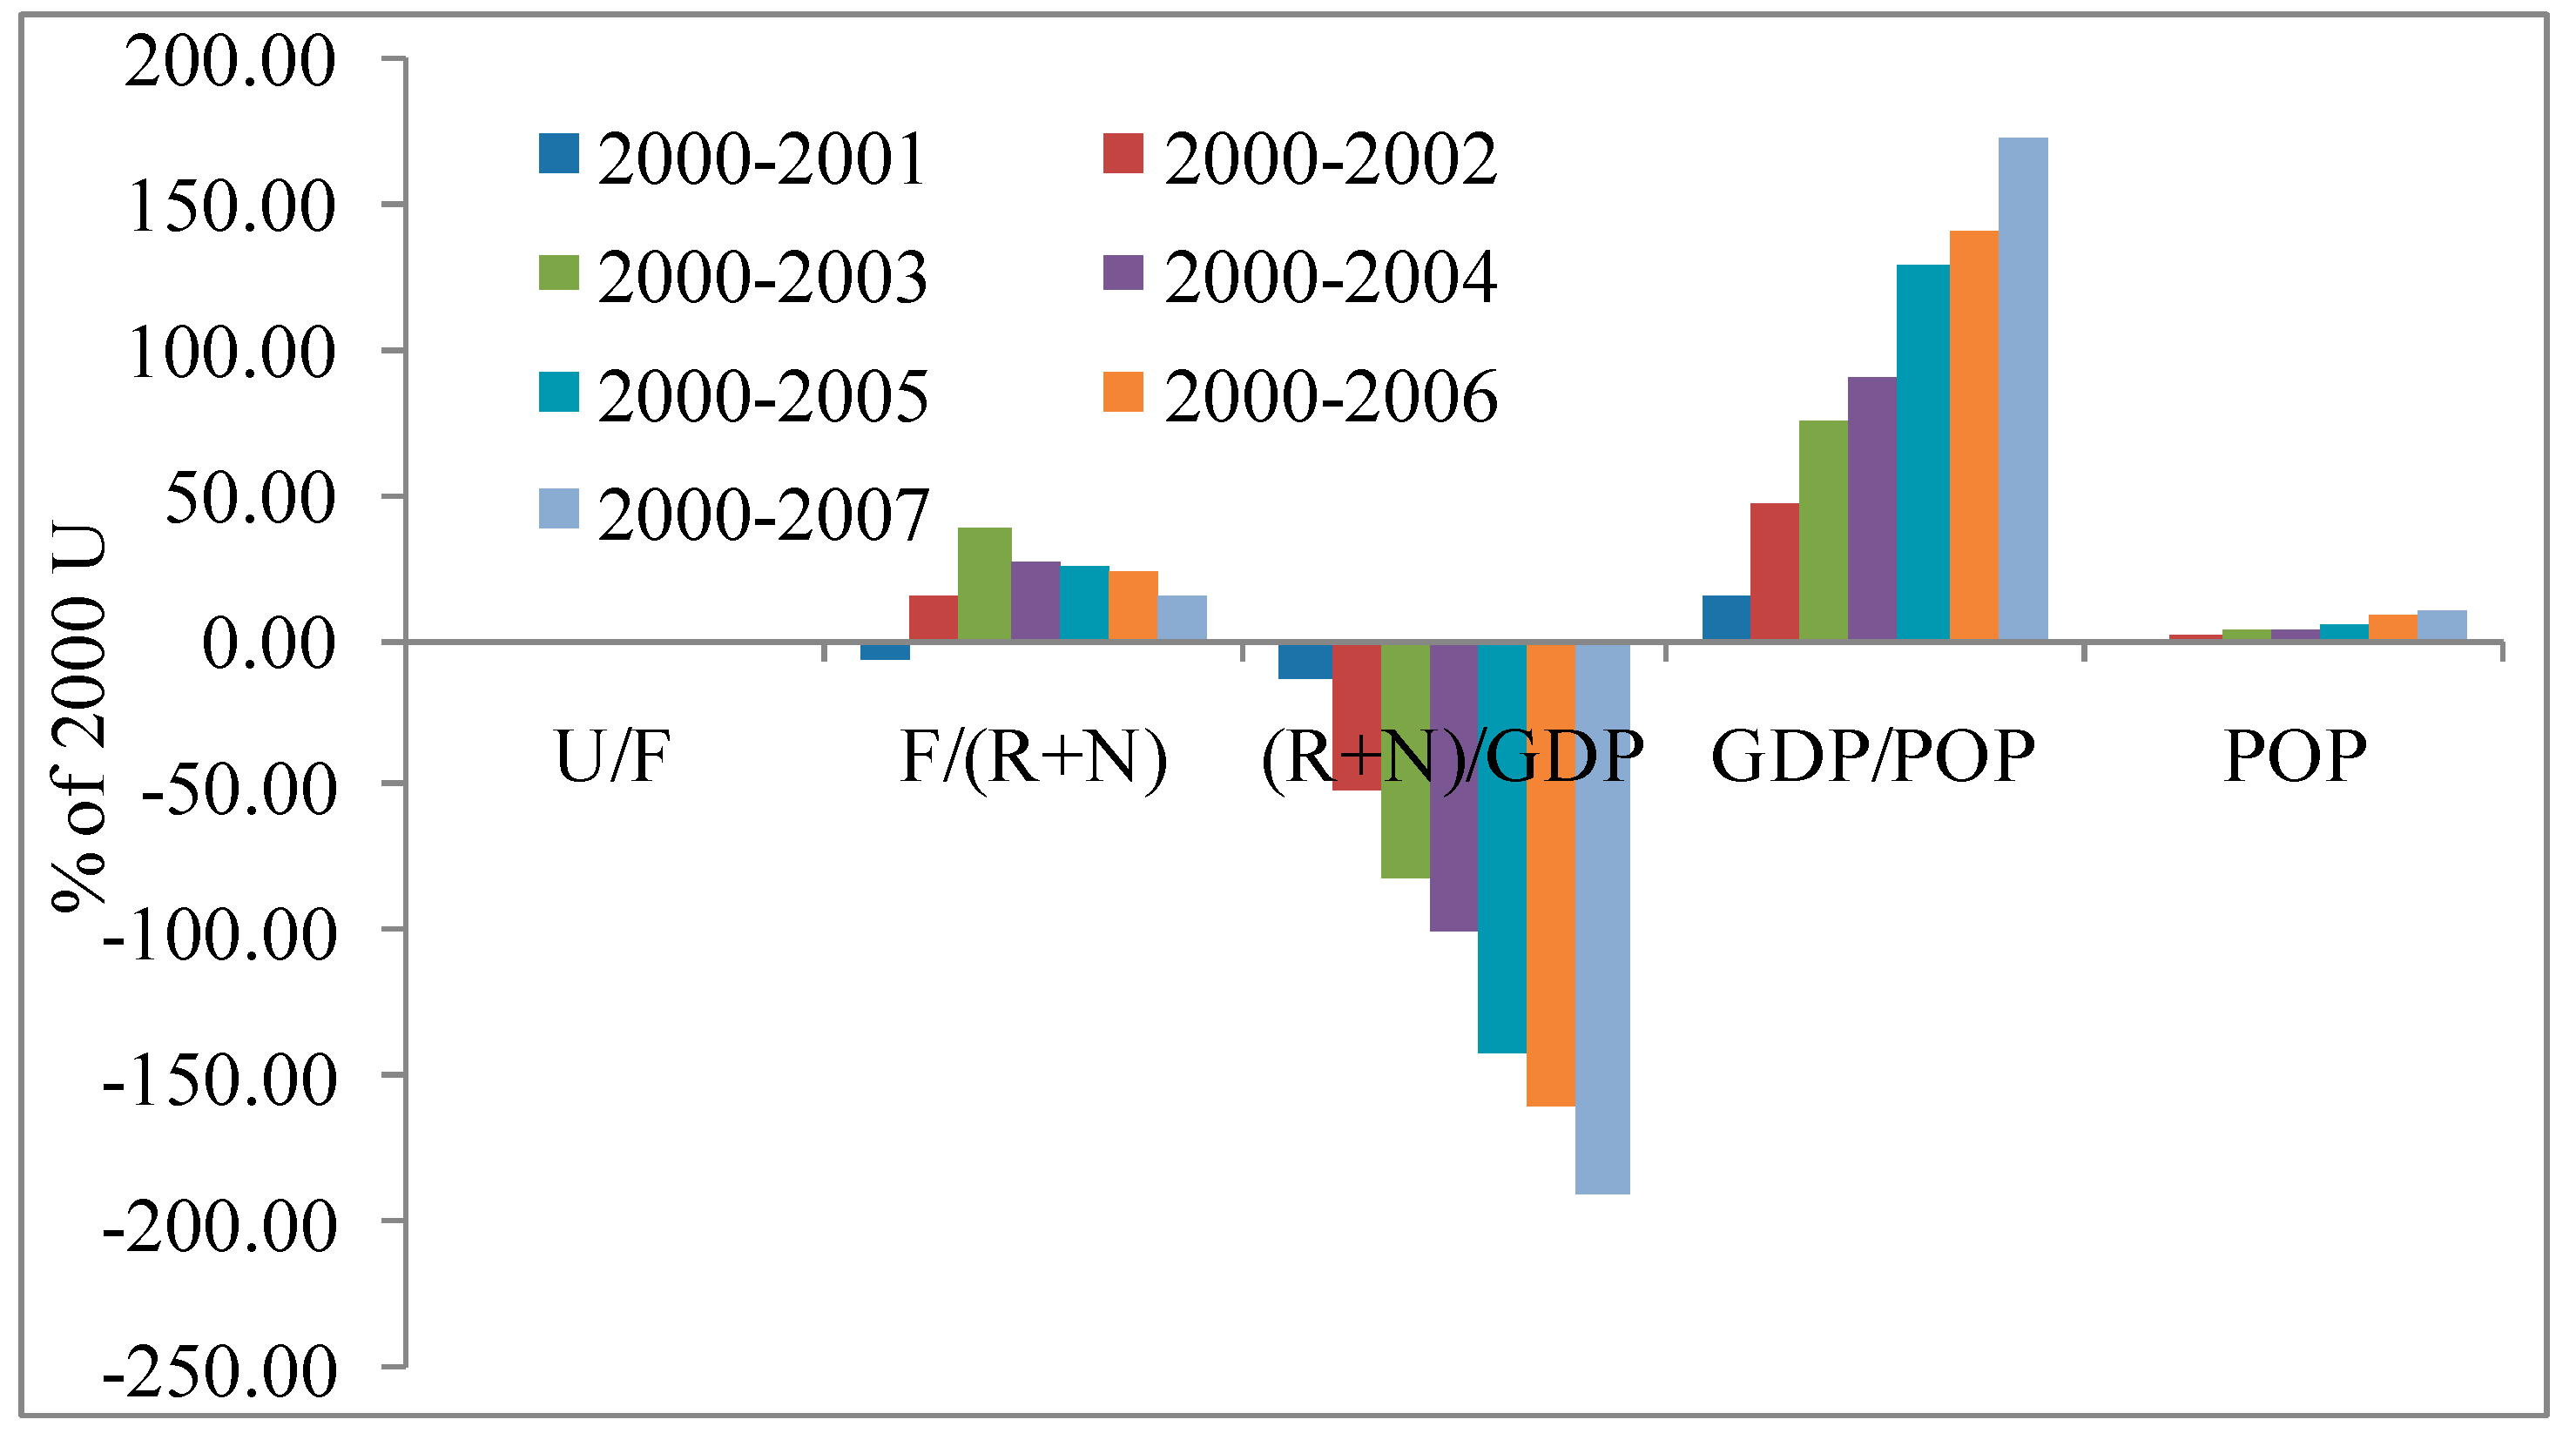
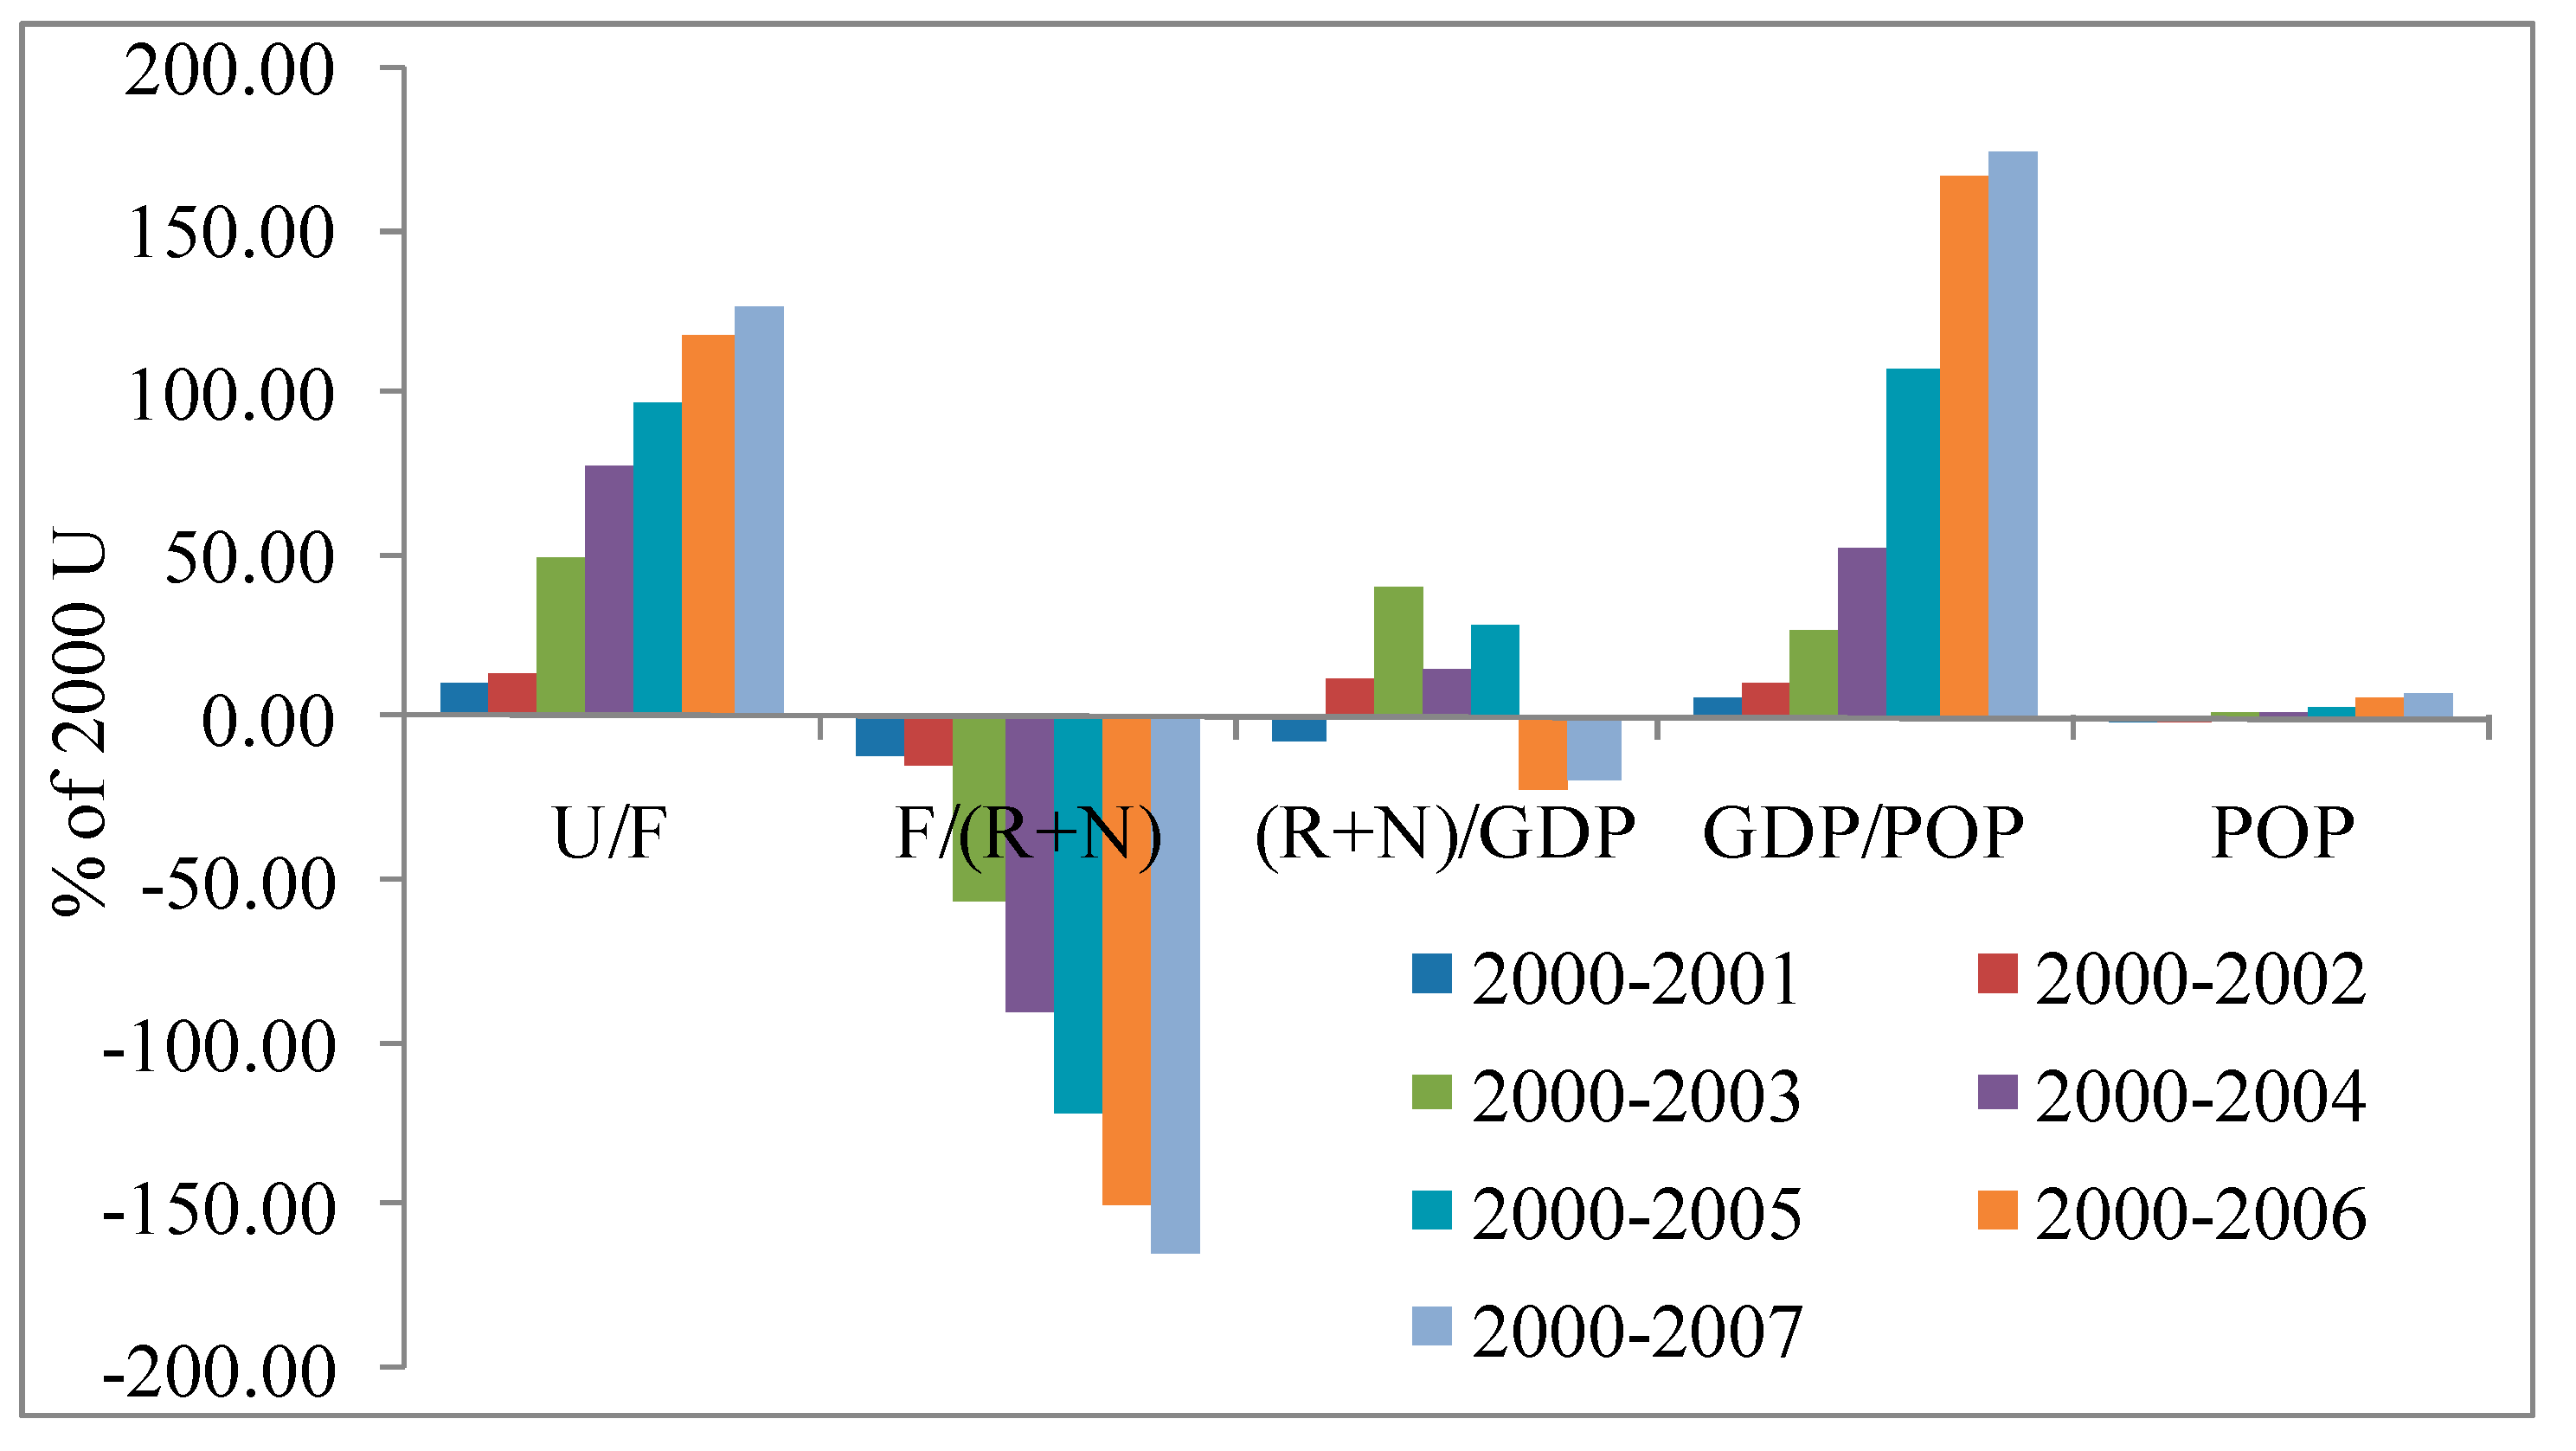
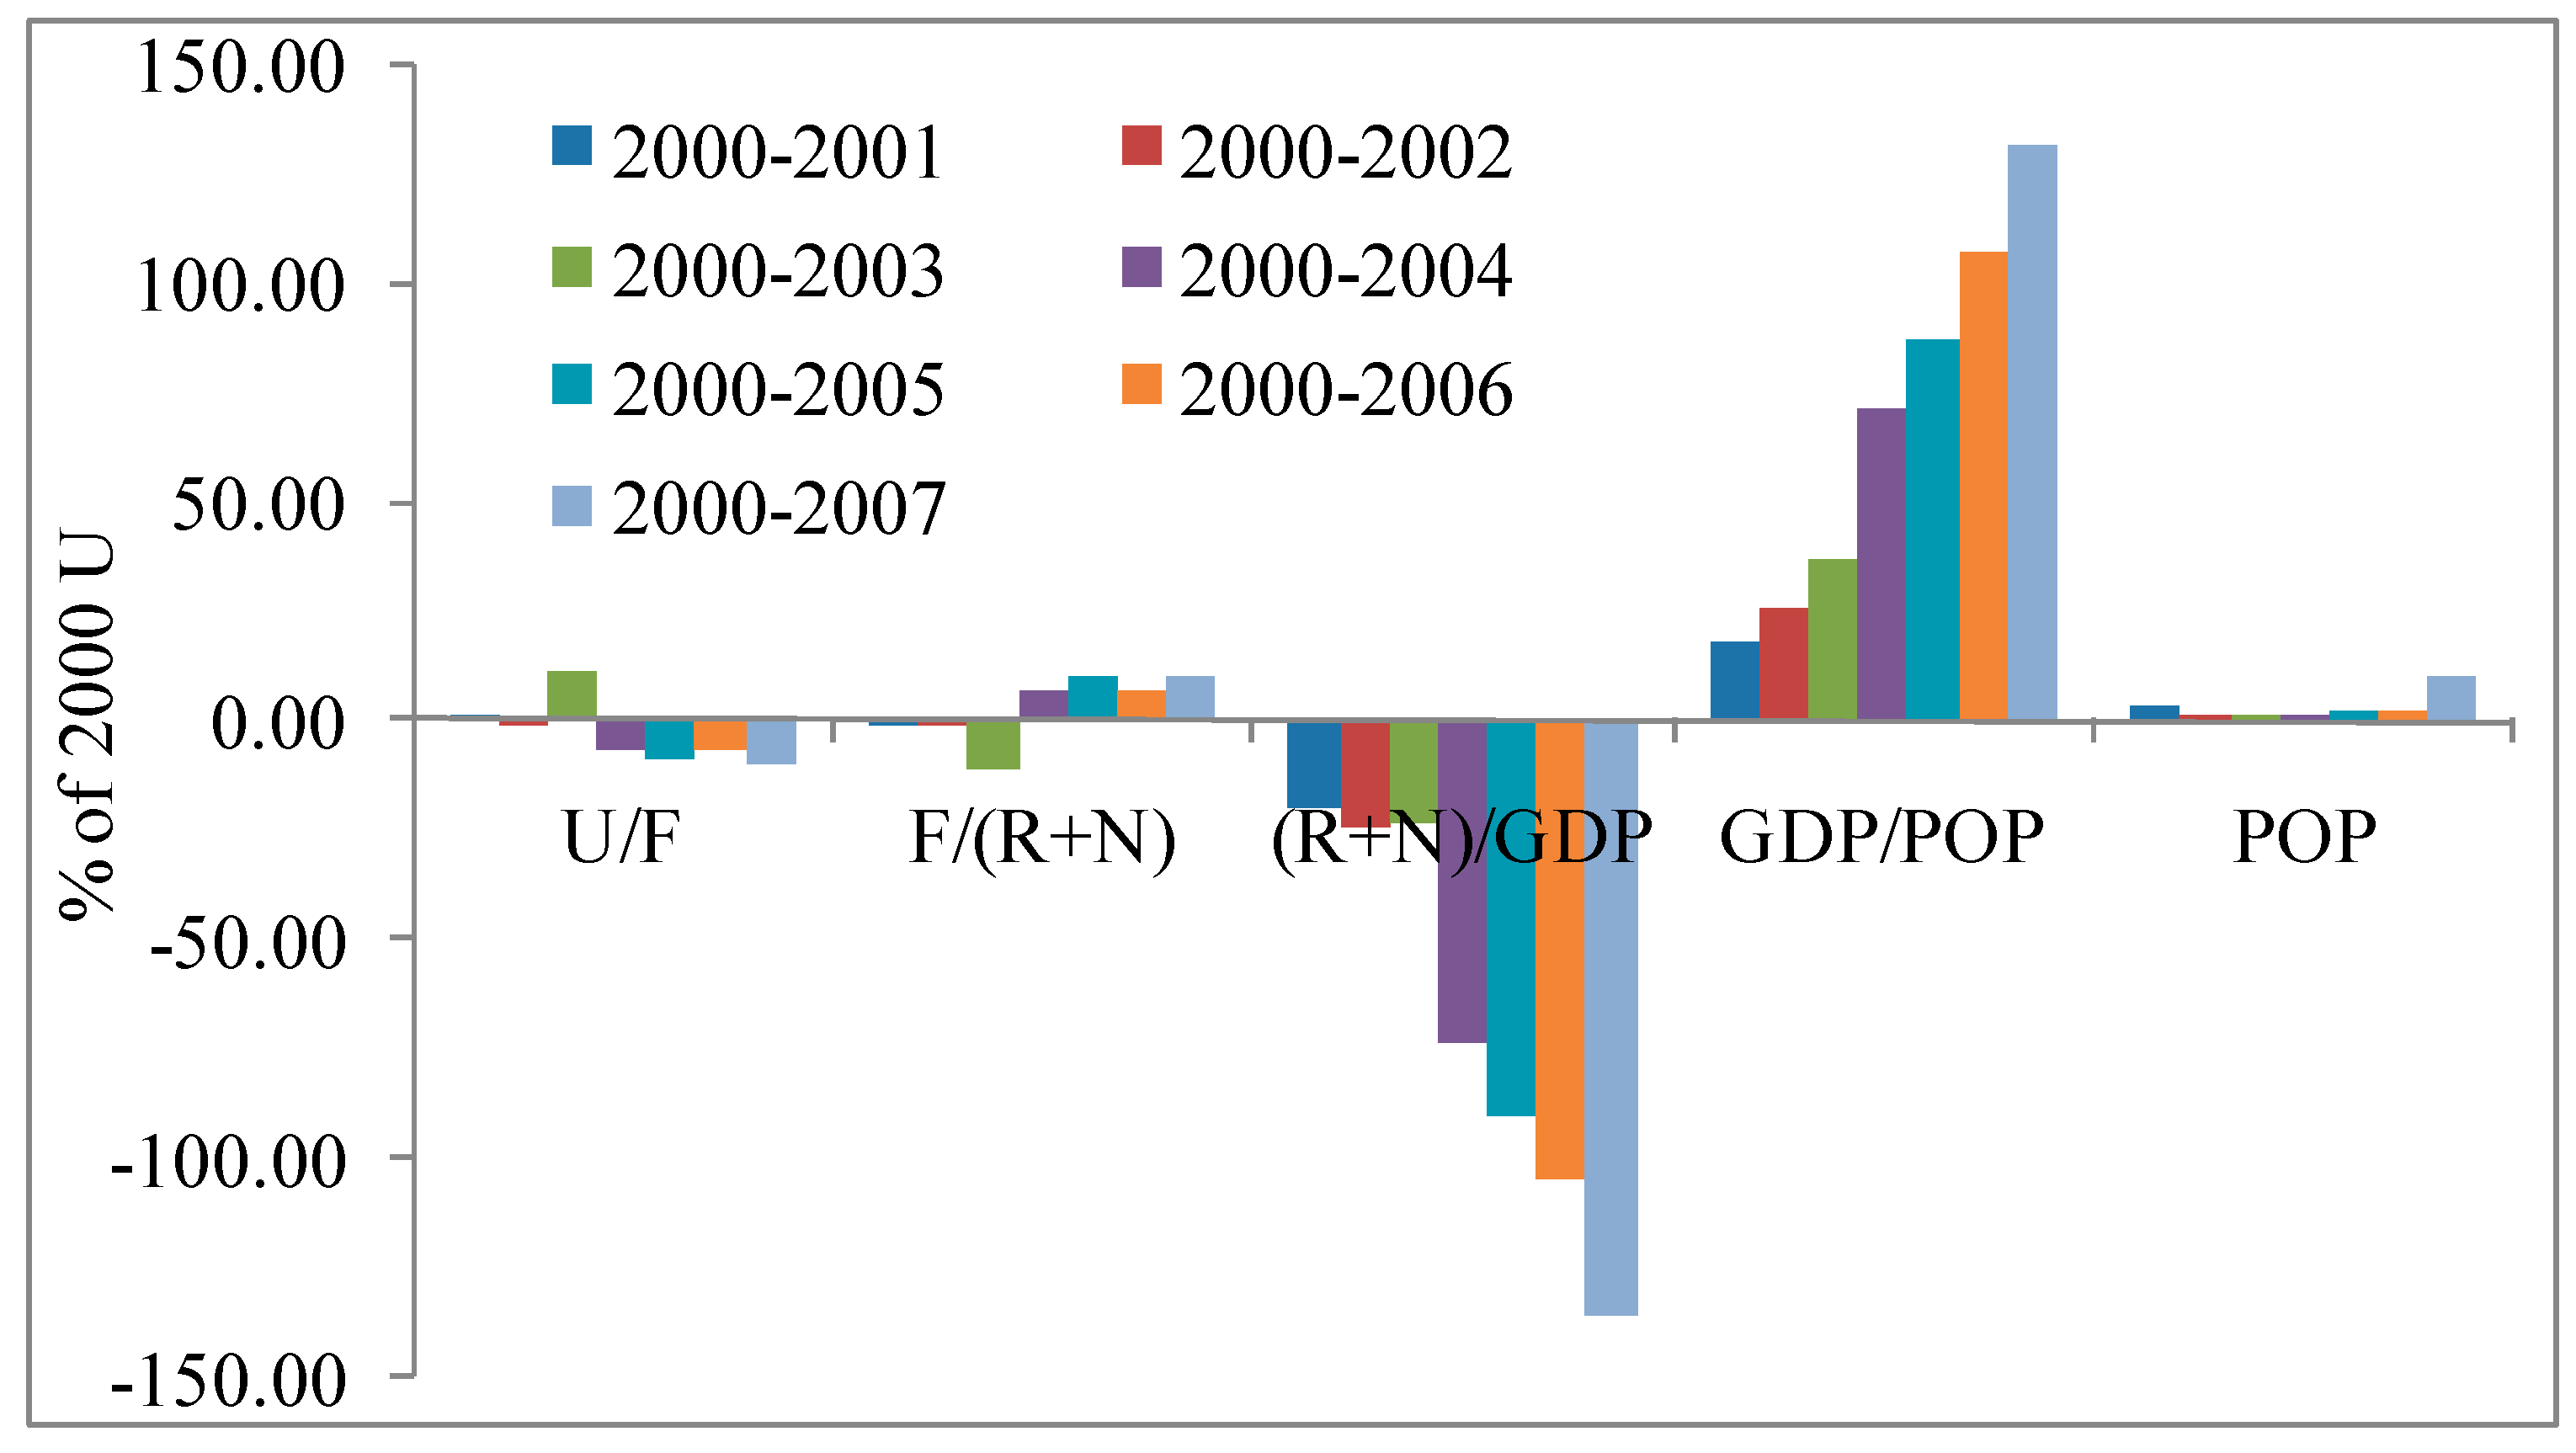
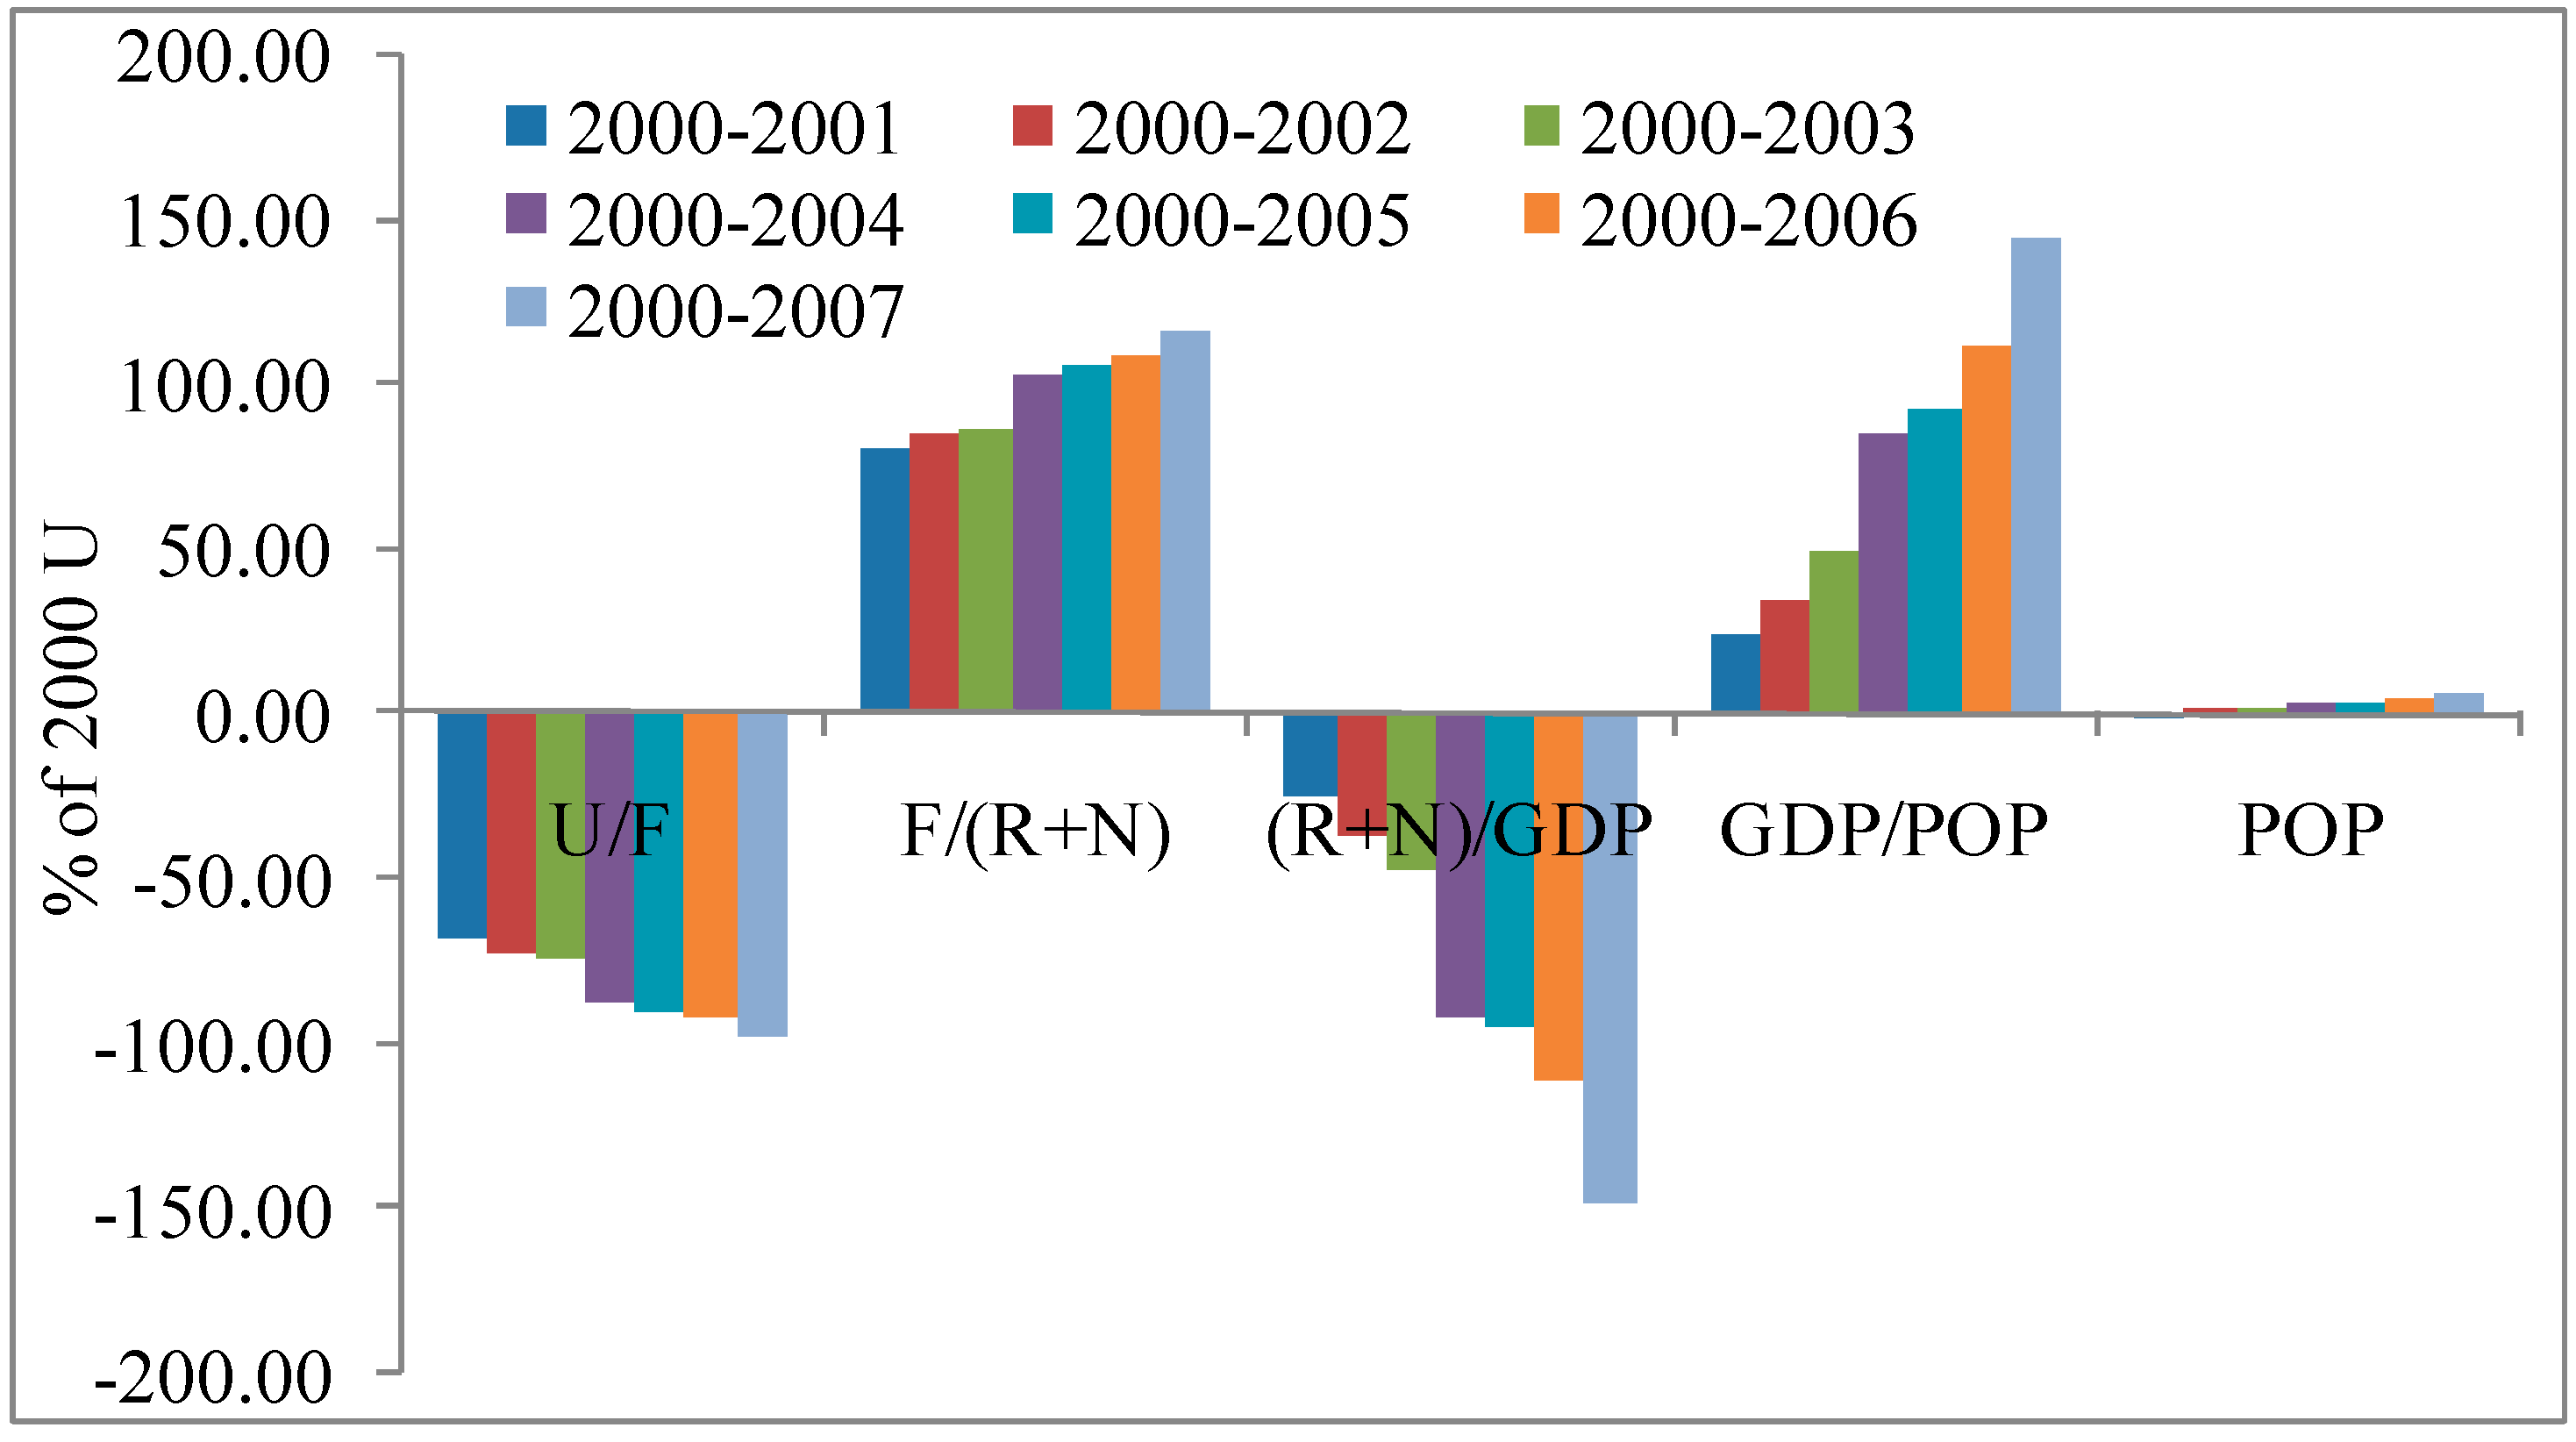
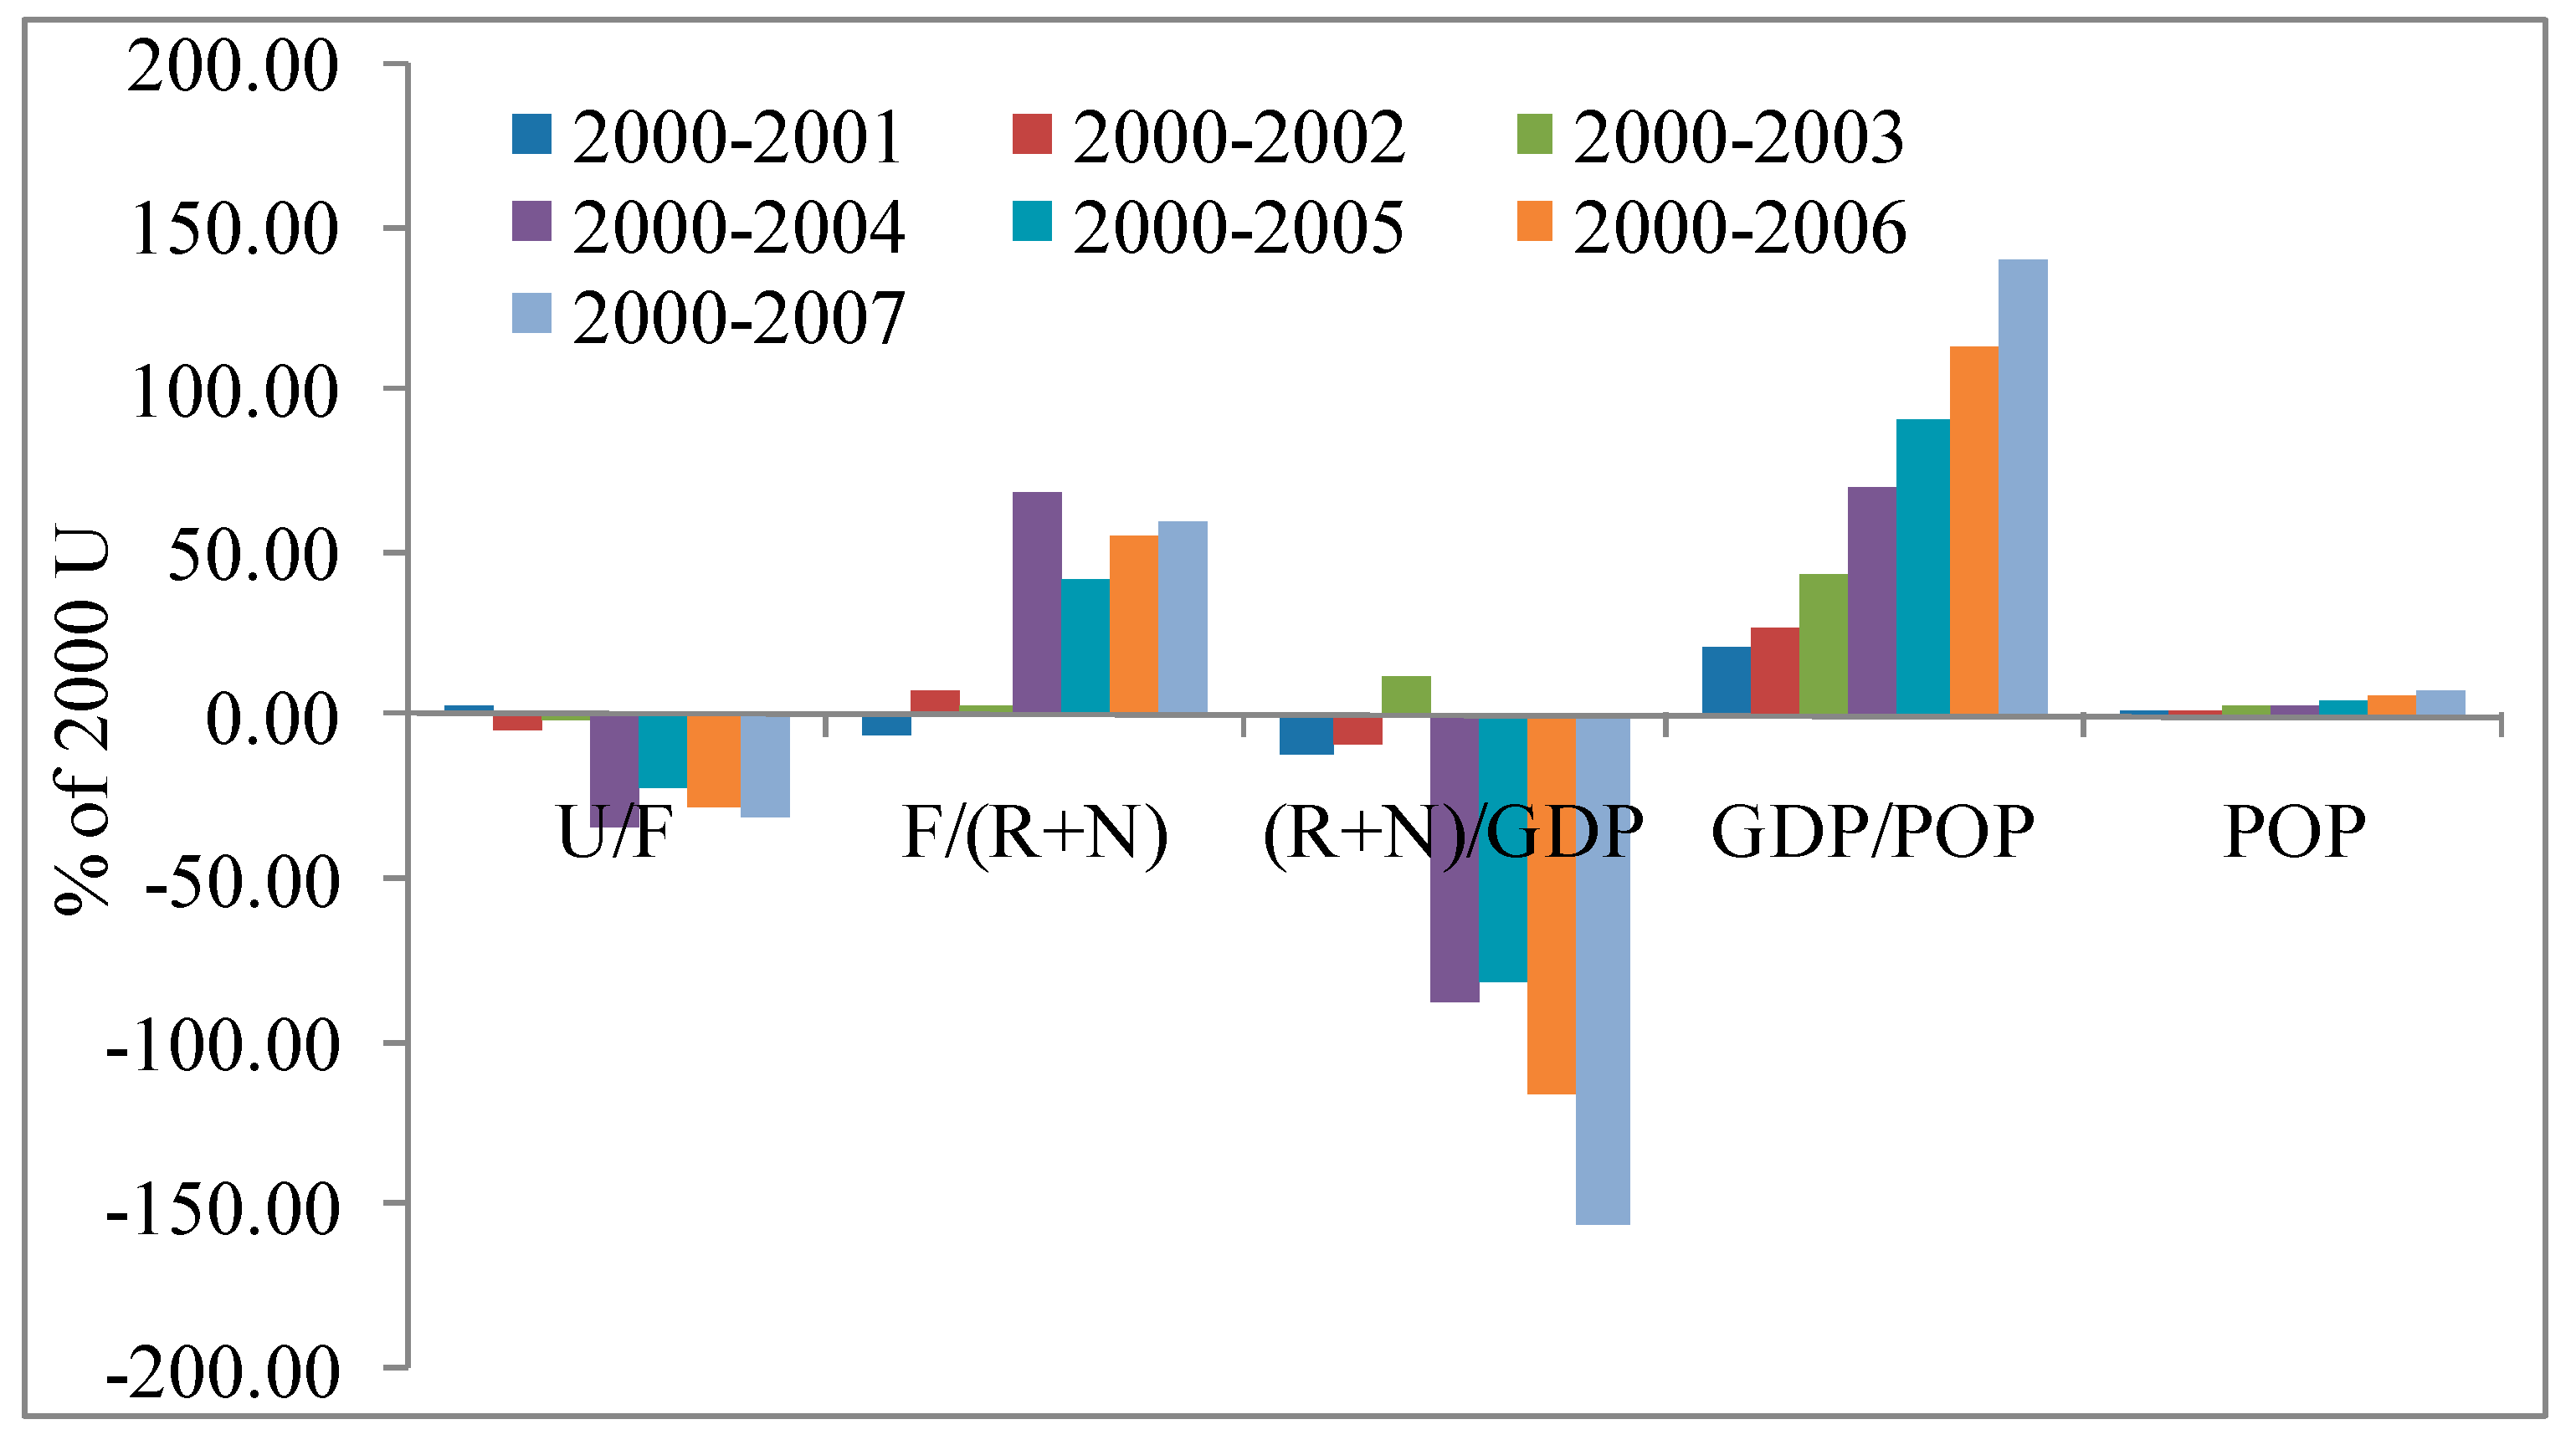
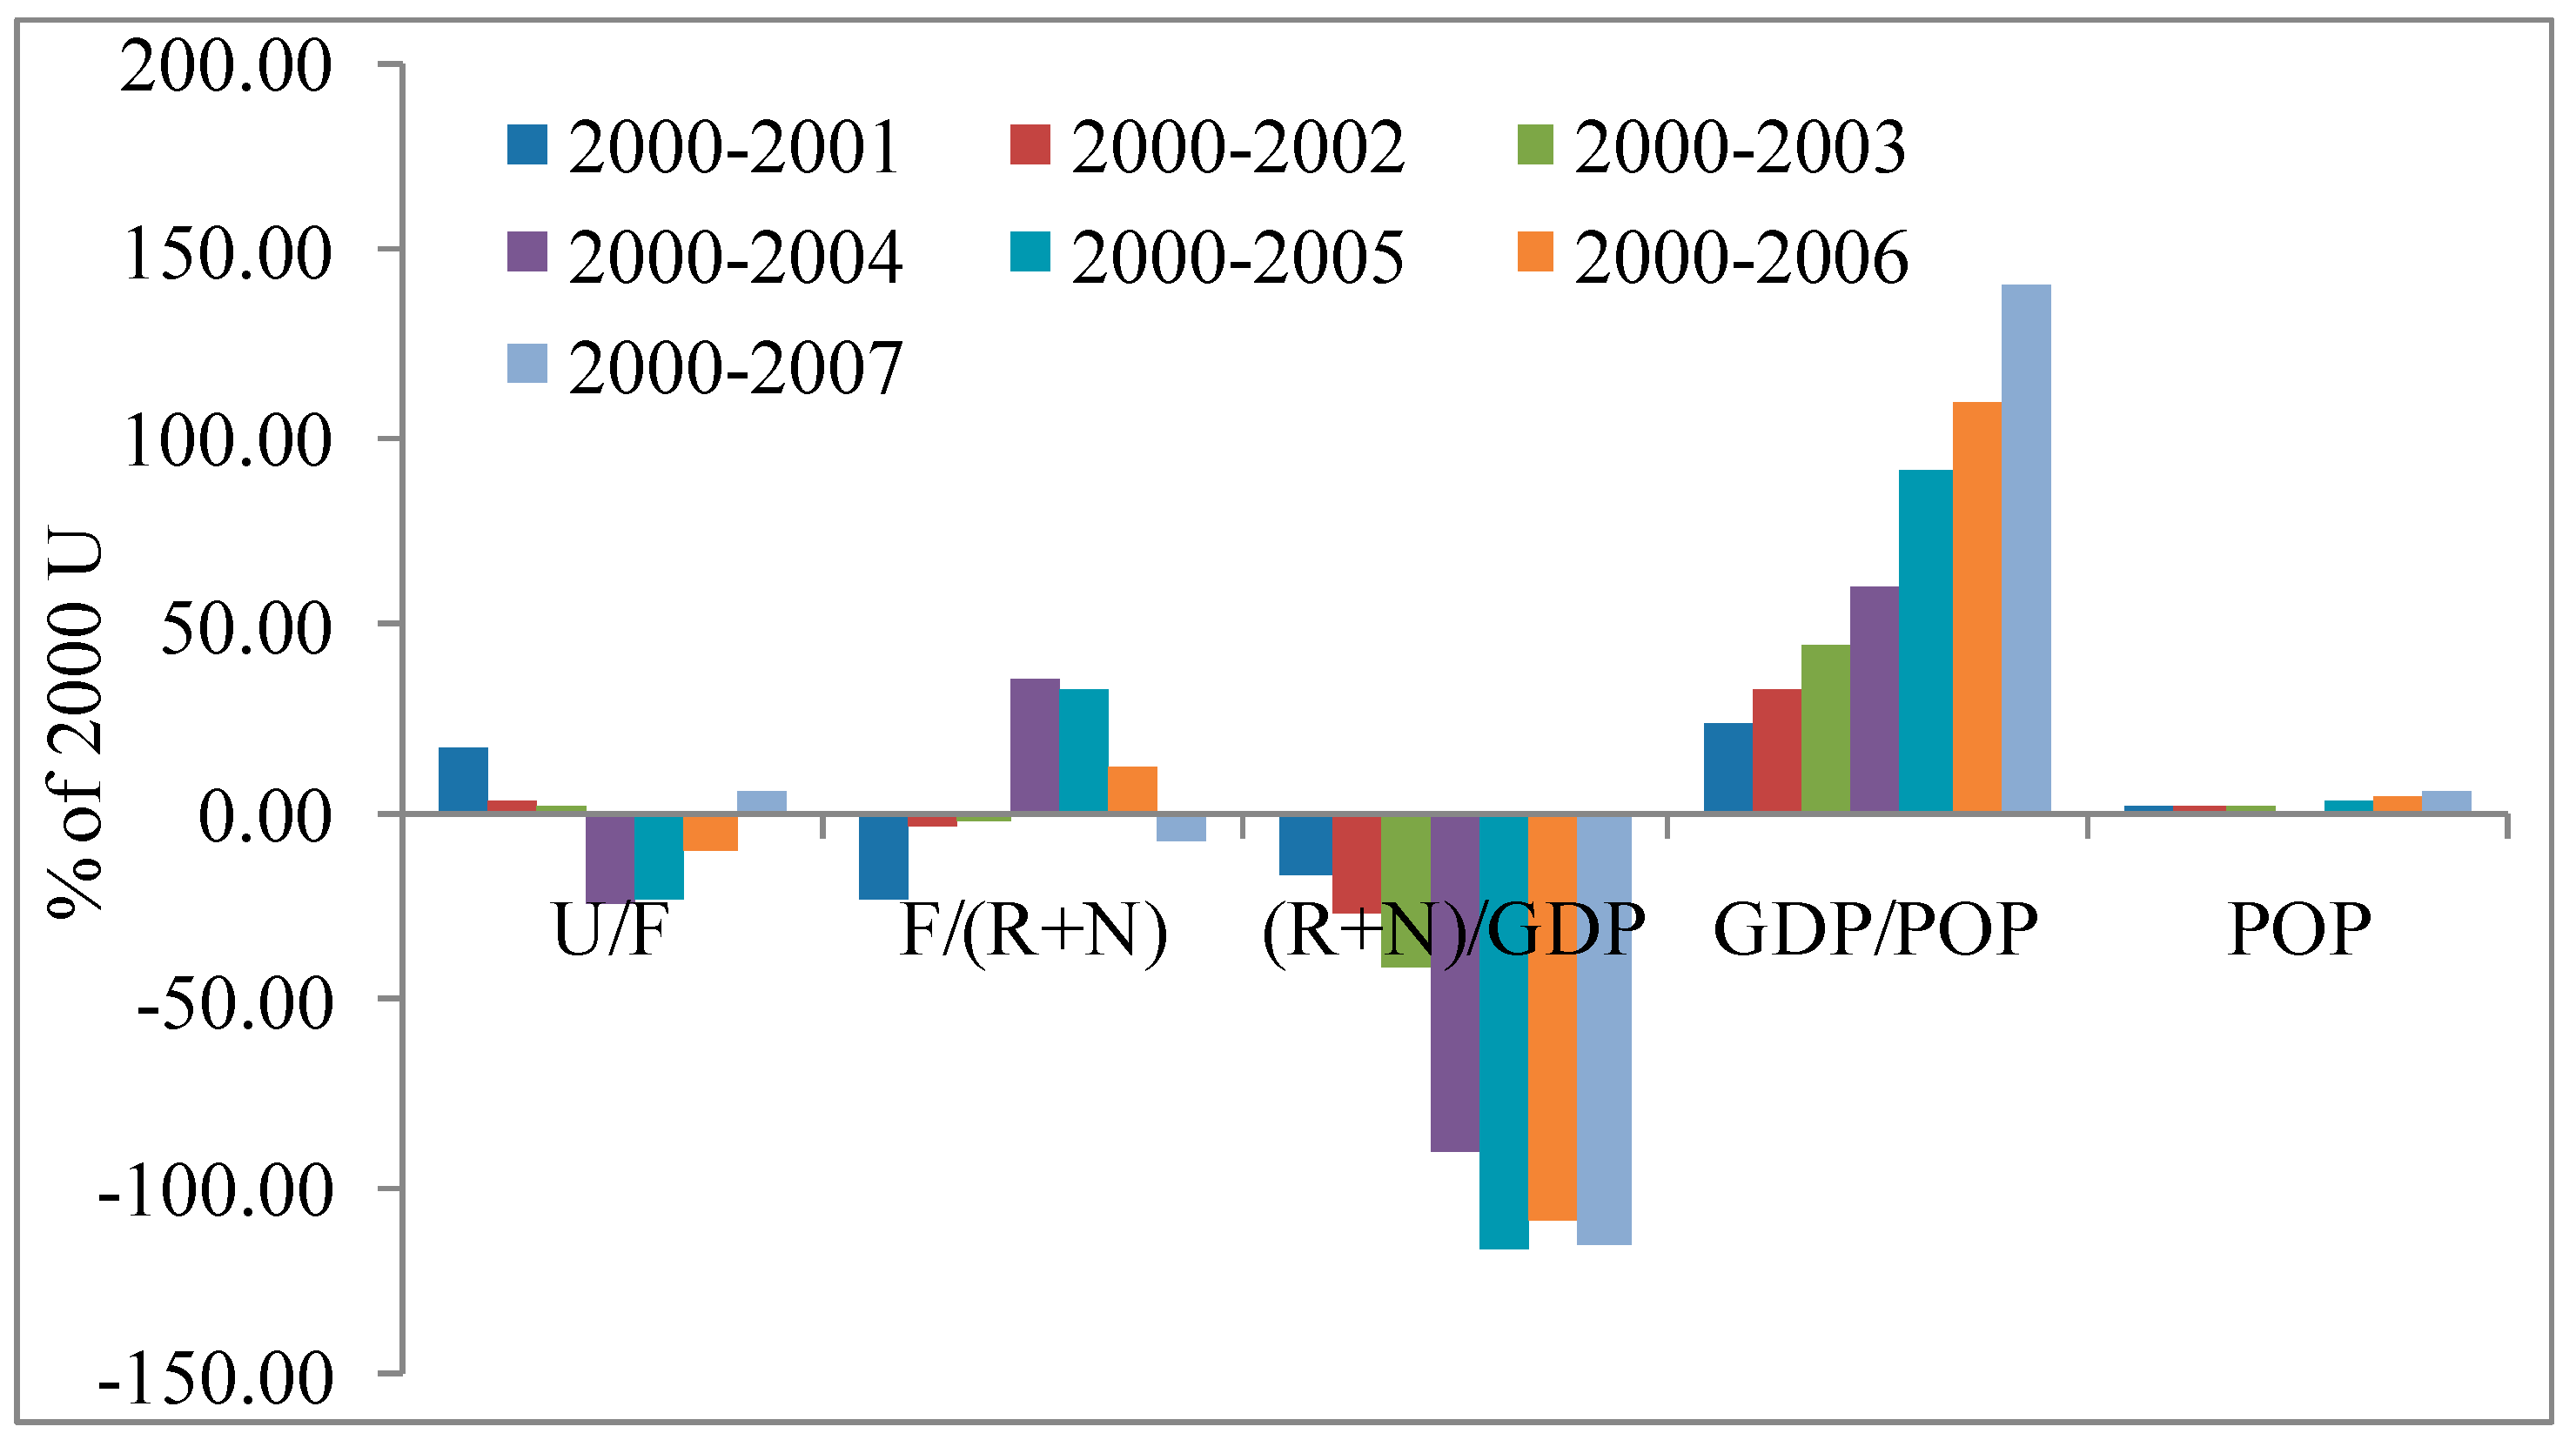
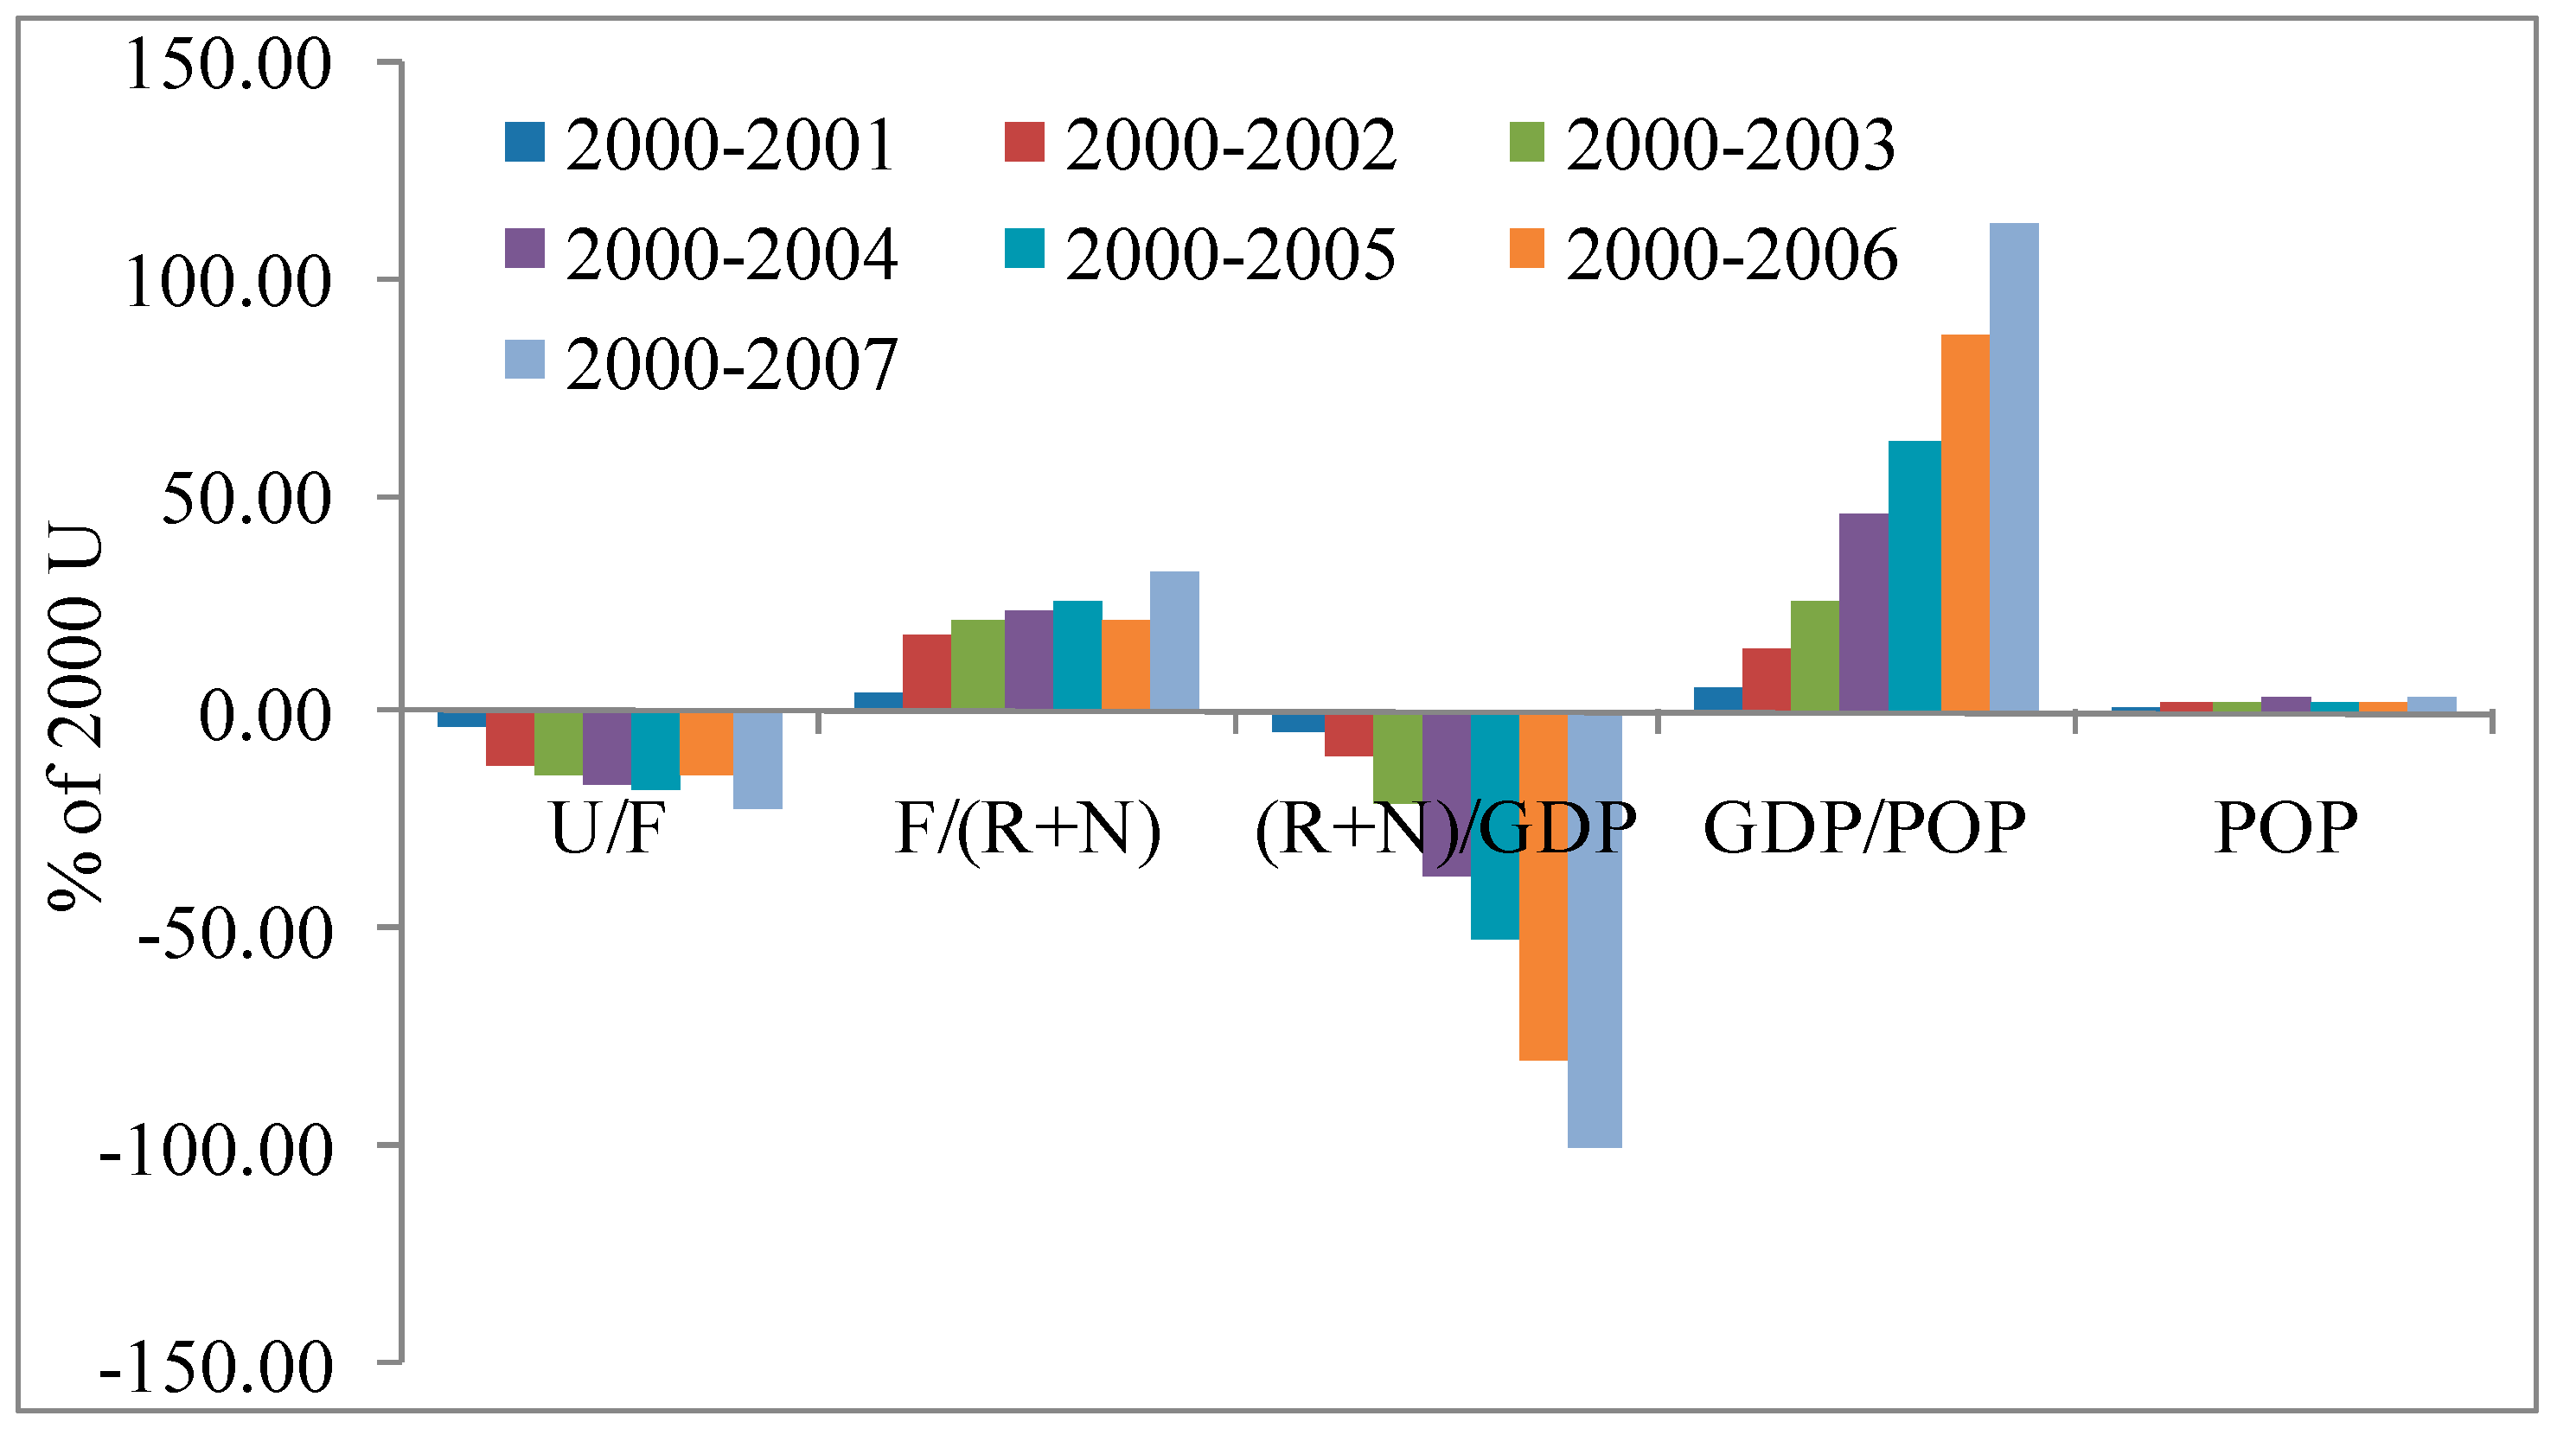
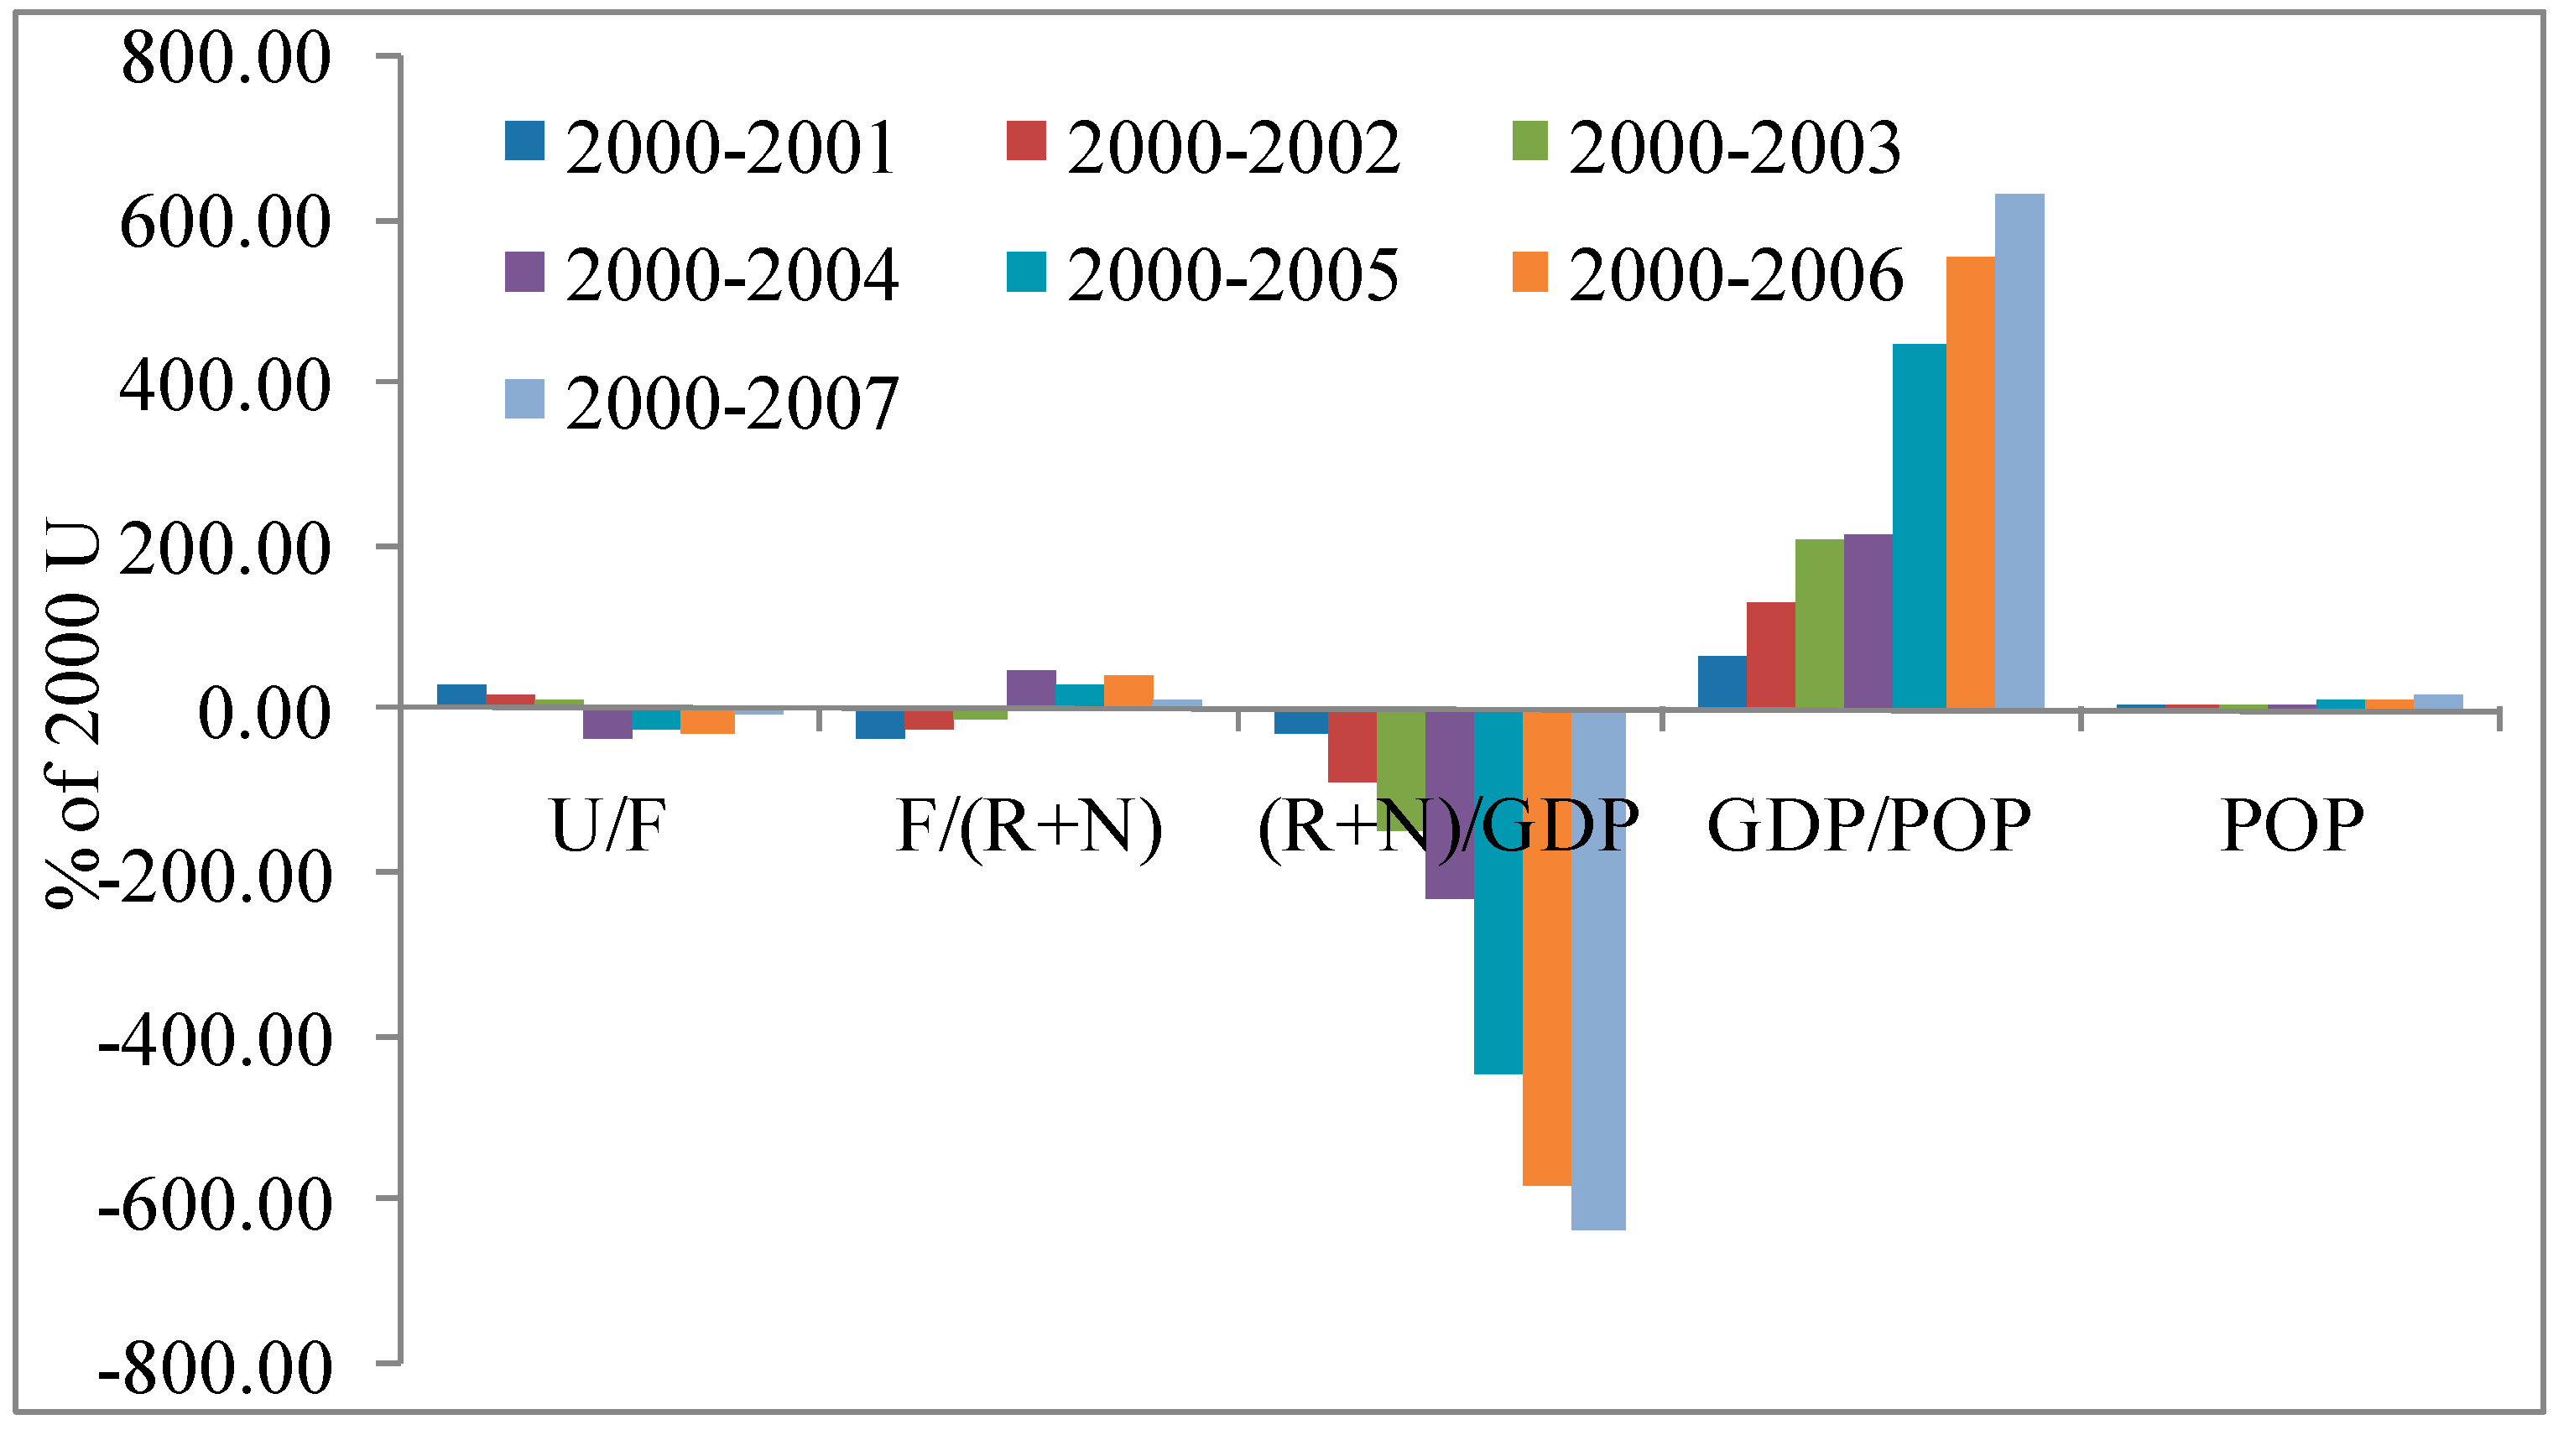
4.3. Decomposition Analysis of Total Emergy Use


5. Summary and Conclusions
Acknowledgments
Author Contributions
Conflicts of Interest
References
- Krausmann, F.; Fischer-Kowalski, M.; Schandl, H.; Eisenmenger, N. The Global Sociometabolic Transition. J. Ind. Ecol. 2008, 12, 637–656. [Google Scholar] [CrossRef]
- Fischer-Kowalski, M.; Krausmann, F.; Pallua, I. A sociometabolic reading of the Anthropocene: Modes of subsistence, population size and human impact on Earth. Anthropocene Rev. 2014, 1, 8–33. [Google Scholar] [CrossRef]
- Huang, S.-L.; Lee, C.-L.; Chen, C.-W. Socioeconomic metabolism in Taiwan: Emergy synthesis versus material flow analysis. Resou. Conser. Recycl. 2006, 48, 166–196. [Google Scholar] [CrossRef]
- Fischer-Kowalski, M.; Haberl, H. Tons, joules, and money: Modes of production and their sustainability problems. Soc. Nat. Resour. 1997, 10, 61–85. [Google Scholar] [CrossRef]
- Huang, S.L.; Chen, C.W. Urbanization and Socioeconomic Metabolism in Taipei. J. Ind. Ecol. 2009, 13, 75–93. [Google Scholar] [CrossRef]
- Zhang, Y.; Liu, H.; Li, Y.T.; Yang, Z.F.; Li, S.S.; Yang, N.J. Ecological network analysis of China’s societal metabolism. J. Environ. Manag. 2012, 93, 254–263. [Google Scholar] [CrossRef]
- Fischer-Kowalski, M. Society’s Metabolism: The Intellectual History of Materials Flow Analysis, Part I, 1860–1970. J. Ind. Ecol. 1998, 2, 61–78. [Google Scholar] [CrossRef]
- Krausmann, F.; Gingrich, S.; Eisenmenger, N.; Erb, K.H.; Haberl, H.; Fischer-Kowalski, M. Growth in global materials use, GDP and population during the 20th century. Ecol. Econ. 2009, 68, 2696–2705. [Google Scholar] [CrossRef]
- Kennedy, C.; Pincetl, S.; Bunje, P. The study of urban metabolism and its applications to urban planning and design. Environ. Pollut. 2011, 159, 1965–1973. [Google Scholar] [CrossRef] [PubMed]
- Anderberg, S. Industrial metabolism and the linkages between economics, ethics and the environment. Ecol. Econ. 1998, 24, 311–320. [Google Scholar] [CrossRef]
- Janssen, M.A.; van den Bergh, J.; van Beukering, P.J.H.; Hoekstra, R. Changing industrial metabolism methods for analysis. Popul. Env. 2001, 23, 139–156. [Google Scholar] [CrossRef]
- Fischer-Kowalski, M.; Amann, C. Beyond IPAT and Kuznets curves: Globalization as a vital factor in analysing the environmental impact of socio-economic metabolism. Popul. Env. 2001, 23, 7–47. [Google Scholar] [CrossRef]
- Lee, C.L.; Huang, S.L.; Chan, S.L. Synthesis and spatial dynamics of socio-economic metabolism and land use change of Taipei Metropolitan Region. Ecol. Model. 2009, 220, 2940–2959. [Google Scholar] [CrossRef]
- Liu, J.R.; Wang, R.S.; Yang, J.X. Metabolism and driving forces of Chinese urban household comsumption. Popul. Env. 2005, 26, 325–341. [Google Scholar] [CrossRef]
- Yang, D.W.; Gao, L.J.; Xiao, L.S.; Wang, R. Cross-boundary environmental effects of urban household metabolism based on an urban spatial conceptual framework: A comparative case of Xiamen. J. Clean. Prod. 2012, 27, 1–10. [Google Scholar] [CrossRef]
- Tian, J.P.; Shi, H.; Chen, Y.; Chen, L.J. Assessment of industrial metabolisms of sulfur in a Chinese fine chemical industrial park. J. Clean. Prod. 2012, 32, 262–272. [Google Scholar] [CrossRef]
- Abel, W. The metabolism of the city. Sci. Am. 1965, 213, 178–193. [Google Scholar] [CrossRef]
- Newman, P.W.G. Sustainability and cities: Extending the metabolism model. Landsc. Urban. Plan. 1999, 44, 219–226. [Google Scholar] [CrossRef]
- Kennedy, C.; Cuddihy, J.; Engel-Yan, J. The changing metabolism of cities. J. Ind. Ecol. 2007, 11, 43–59. [Google Scholar] [CrossRef]
- Zhang, Y.; Yang, Z.F.; Yu, X.Y. Evaluation of urban metabolism based on emergy synthesis: A case study for Beijing (China). Ecol. Model. 2009, 220, 1690–1696. [Google Scholar] [CrossRef]
- Siciliano, G.; Crociata, A.; Turvani, M. A Multi-level Integrated Analysis of Socio-Economic Systems Metabolism: An Application to the Italian Regional Level. Environ. Policy Gov. 2012, 22, 350–368. [Google Scholar] [CrossRef]
- Geng, Y.; Liu, Y.; Liu, D.; Zhao, H.X.; Xue, B. Regional societal and ecosystem metabolism analysis in China: A multi-scale integrated analysis of societal metabolism (MSIASM) approach. Energy 2011, 36, 4799–4808. [Google Scholar] [CrossRef]
- Bringezu, S.; Schütz, H.; Moll, S. Rationale for and interpretation of economy-wide materials flow analysis and derived indicators. J. Ind. Ecol. 2003, 7, 43–64. [Google Scholar] [CrossRef]
- Hoang, V.N. Analysis of resource efficiency: A production frontier approach. J. Environ. Manag. 2014, 137, 128–136. [Google Scholar] [CrossRef]
- Brown, M.T.; Ulgiati, S. Understanding the global economic crisis: A biophysical perspective. Ecol. Model. 2011, 223, 4–13. [Google Scholar] [CrossRef]
- Zhang, L.M.; Xue, B.; Geng, Y.; Ren, W.X.; Lu, C.P. Emergy-Based City’s Sustainability and Decoupling Assessment: Indicators, Features and Findings. Sustainability 2014, 6, 952–966. [Google Scholar] [CrossRef]
- Hau, J.L.; Bakshi, B.R. Promise and problems of emergy analysis. Ecol. Model. 2004, 178, 215–225. [Google Scholar] [CrossRef]
- Zhang, Z.; Chen, X.; Jiao, W.; Lu, C. Dynamic evolution of the coupled environmental-economic system of Qingyang, Gansu Province: Based on emergy theory and econometric method. Acta Scien. Circum. 2010, 30, 2125–2135. (In Chinese) [Google Scholar]
- Odum, H.T.; Peterson, N. Simulation and evaluation with energy systems blocks. Ecol. Model. 1996, 93, 155–173. [Google Scholar] [CrossRef]
- Huang, S.L.; Lee, C.L.; Chen, C.W. Socioeconomic metabolism in Taiwan: Emergy synthesis versus material flow analysis. Resou. Conser. Recycl. 2006, 48, 166–196. [Google Scholar] [CrossRef]
- Brown, M.T.; Herendeen, R.A. Embodied Energy Analysis and Emergy Analysis: A Comparative View. Ecol. Econ. 1996, 19, 219–235. [Google Scholar] [CrossRef]
- Odum, H.T. Environmental Accounting: Emergy And Environmental Decision Making; Wiley: New York, NY, USA, 1996. [Google Scholar]
- Ulgiati, S.; Odum, H.T.; Bastianoni, S. Emergy Use, Environmental Loading and Sustainability: An Emergy Analysis of Italy. Ecol. Model. 1994, 73, 215–268. [Google Scholar] [CrossRef]
- Ulgiati, S.; Ascione, M.; Zucaro, A.; Campanella, L. Emergy-based complexity measures in natural and social systems. Ecol. Indic. 2011, 11, 1185–1190. [Google Scholar] [CrossRef]
- Heshui Bureau of Statistics. Heshui County Statistics Year Book (2001–2008); China Statistics Press: Beijing, China, 2001–2008. [Google Scholar]
- Huanxian Bureau of Statistics. Huan County Statistics Year Book (2001–2008); China Statistics Press: Beijing, China, 2001–2008. [Google Scholar]
- Ningxian Bureau of Statistics. Ningxian Statistics Year Book (2001–2008); China Statistics Press: Beijing, China, 2001–2008. [Google Scholar]
- Qingcheng Bureau of Statistics. Qingcheng County Statistics Year Book (2001–2008); China Statistics Press: Beijing, China, 2001–2008. [Google Scholar]
- Qingyang Bureau of Statistics. Qingyang Statistic Year Book (2001–2008); China Statistics Press: Beijing, China, 2001–2008. [Google Scholar]
- Xifeng Bureau of Statistics. Xifeng District Statistics Year Book (2001–2008); China Statistics Press: Beijing, China, 2001–2008. [Google Scholar]
- Zhengning Bureau of Statistics. Zhengning Statistics Year Book (2001–2008); China Statistics Press: Beijing, China, 2001–2008. [Google Scholar]
- Zhenyuan Bureau of Statistics. Zhenyuan County Statistics Year Book (2001–2008); Chins Statistics Press: Beijing, China, 2001–2008. [Google Scholar]
- Lan, S.; Qin, P.; Lu, H. Emergy Synthesis of Ecological-Economic System; Chemical Press: Beijing, China, 2002. (In Chinese) [Google Scholar]
- Liu, J.S.; Lu, L.Y.Y.; Lu, W.-M.; Lin, B.J.Y. A survey of DEA applications. Omega 2013, 41, 893–902. [Google Scholar] [CrossRef]
- Song, M.; An, Q.; Zhang, W.; Wang, Z.; Wu, J. Environmental efficiency evaluation based on data envelopment analysis: A review. Renew. Sust. Energy Rev. 2012, 16, 4465–4469. [Google Scholar] [CrossRef]
- Färe, R.; Grosskopf, S.; Norris, M.; Zhang, Z. Productivity growth, technical progress, and efficiency change in industrialized countries. Am. Econ. Rev. 1994, 84, 66–83. [Google Scholar]
- Chung, Y.H.; Färe, R.; Grosskopf, S. Productivity and Undesirable Outputs: A Directional Distance Function Approach. J. Environ. Manag. 1997, 51, 229–240. [Google Scholar] [CrossRef]
- Tone, K. A slacks-based measure of efficiency in data envelopment analysis. Eur. J. Oper. Res. 2001, 130, 498–509. [Google Scholar] [CrossRef]
- Tone, K. Dealing with Undesirable Outputs in DEA: A Slacks-Based Measure (SBM) Approach. In Proceedings of the North American Productivity Workshop III, Toronto, ON, Canada, 22–25 June 2004; pp. 44–45.
- Camarero, M.; Castillo, J.; Picazo-Tadeo, A.J.; Tamarit, C. Eco-Efficiency and Convergence in OECD Countries. Environ. Resour. Econ. 2013, 55, 87–106. [Google Scholar] [CrossRef]
- Ang, B.W.; Zhang, F.Q. A survey of index decomposition analysis in energy and environmental studies. Energy 2000, 25, 1149–1176. [Google Scholar] [CrossRef]
- Weinzettel, J.; Kovanda, J. Structural Decomposition Analysis of Raw Material Consumption. J. Ind. Ecol. 2011, 15, 893–907. [Google Scholar] [CrossRef]
- Xu, X.Y.; Ang, B.W. Index decomposition analysis applied to CO2 emission studies. Ecol. Econ. 2013, 93, 313–329. [Google Scholar] [CrossRef]
- Zhang, F.Q.; Ang, B.W. Methodological issues in cross-country/region decomposition of energy and environment indicators. Energy Econ. 2001, 23, 179–190. [Google Scholar] [CrossRef]
- Ang, B.W.; Xu, X.Y. Tracking industrial energy efficiency trends using index decomposition analysis. Energy Econ. 2013, 40, 1014–1021. [Google Scholar] [CrossRef]
- Kaivo-oja, J.; Luukkanen, J.; Malaska, P. Advanced sustainability analysis. In Our Fragile World. Challenges and Opportunities for Sustainable Development; EOLSS Publishers: Oxford, UK, 2001; Volume 2, pp. 1529–1552. [Google Scholar]
- Vehmas, J.; Malaska, P.; Luukkanen, J.; Kaivooja, J.; Hietanen, O.; Vinnari, M.; Iivonen, J. Europe in Global Battle of Sustainability: Rebound Strikes Back? Advanced Sustainability Analysis; Turun kauppakorkeakoulu: Turku, Finland, 2003. [Google Scholar]
- Kaivo-oja, J.; Luukkanen, J.; Malaska, P. Sustainability evaluation frameworks and alternative analytical scenarios of national economies. Popul. Environ. 2001, 23, 193–215. [Google Scholar] [CrossRef]
- Hoffren, J.; Luukkanen, J.; Kaivo-Oja, J. Statistical decomposition modelling on the basis of material flow accounting. J. Ind. Ecol. 2000, 4, 4. [Google Scholar] [CrossRef]
- Jungnitz, A. Decomposition Analysis of Greenhouse Gas Emissions and Energy and Material Inputs in Germany. Available online: http://www.petre.org.uk/pdf/sept08/pETRE_WP1a_GWS_Jungnitz.pdf (accessed on 24 November 2014).
- Ghisellini, P.; Zucaro, A.; Viglia, S.; Ulgiati, S. Monitoring and evaluating the sustainability of Italian agricultural system. An emergy decomposition analysis. Ecol. Model. 2014, 271, 132–148. [Google Scholar] [CrossRef]
- Ridolfi, R.; Andreis, D.; Panzieri, M.; Ceccherini, F. The application of environmental certification to the Province of Siena. J. Environ. Manag. 2008, 86, 390–395. [Google Scholar] [CrossRef]
- Raugei, M. Emergy indicators applied to human economic systems—A word of caution. Ecol. Model. 2011, 222, 3821–3822. [Google Scholar] [CrossRef]
- Vehmas, J.; Luukkanen, J.; Kaivo-oja, J.; Panula-Ontto, J.; Allievi, F. Key Trends of Climate Change in The Asean Countries. Available online: https://www.utu.fi/fi/yksikot/ffrc/julkaisut/e-tutu/Documents/eBook_2012-5.pdf (accessed on 24 November 2014).
- Decoin. Development and Comparison of Sustainability Indicators. Available online: http://www.decoin.eu/ (accessed on 24 November 2014).
- Smile. Synergies in Multi-Scale Inter-Linkages of Eco-Systems. Available online: http://www.smile-fp7.eu/ (accessed on 24 November 2014).
- Brown, M.T.; Ulgiati, S. Emergy-based Indices and Ratios to Evaluate Sustainability: Monitoring Economies and Technology toward Environmentally Sound Innovation. Ecol. Eng. 1997, 9, 51–69. [Google Scholar] [CrossRef]
- Geng, Y.; Zhang, P.; Ulgiati, S.; Sarkis, J. Emergy Analysis of an Industrial Park: The Case of Dalian, China. Sci. Total. Environ. 2010, 408, 5173–5283. [Google Scholar] [CrossRef]
- Siche, J.R.; Agostinho, F.; Ortega, E.; Romeiro, A. Sustainability of Nations by Indices: Comparative Study between Environmental Sustainability Index, Ecological Footprint and the Emergy Performance Indices. Ecol. Econ. 2008, 66, 628–637. [Google Scholar] [CrossRef]
- Brown, M.T.; Ulgiati, S. Energy Quality, emergy, and Transformity: H.T. Odum’s Contributions to Quantifying and Understanding Systems. Ecol. Model. 2004, 178, 201–213. [Google Scholar] [CrossRef]
- Ulgiati, S.; Brown, M.T. Quantifying the Environmental Support for Dilution and Abatement of Process Emissions: The Case of Electricity Production. J. Clean. Prod. 2002, 10, 335–348. [Google Scholar] [CrossRef]
- Ulgiati, S.; Brown, M.T. Monitoring Patterns of Sustainability in Natural and Man-Made Ecosystems. Ecol. Model. 1998, 108, 23–36. [Google Scholar] [CrossRef]
- Zucaro, A.; Ripa, M.; Mellino, S.; Ascione, M.; Ulgiati, S. Urban resource use and environmental performance indicators. An application of decomposition analysis. Ecol. Indic. 2014, 47, 16–25. [Google Scholar] [CrossRef]
© 2014 by the authors; licensee MDPI, Basel, Switzerland. This article is an open access article distributed under the terms and conditions of the Creative Commons Attribution license (http://creativecommons.org/licenses/by/4.0/).
Share and Cite
Zhang, Z.; Chen, X.; Heck, P. Emergy-Based Regional Socio-Economic Metabolism Analysis: An Application of Data Envelopment Analysis and Decomposition Analysis. Sustainability 2014, 6, 8618-8638. https://doi.org/10.3390/su6128618
Zhang Z, Chen X, Heck P. Emergy-Based Regional Socio-Economic Metabolism Analysis: An Application of Data Envelopment Analysis and Decomposition Analysis. Sustainability. 2014; 6(12):8618-8638. https://doi.org/10.3390/su6128618
Chicago/Turabian StyleZhang, Zilong, Xingpeng Chen, and Peter Heck. 2014. "Emergy-Based Regional Socio-Economic Metabolism Analysis: An Application of Data Envelopment Analysis and Decomposition Analysis" Sustainability 6, no. 12: 8618-8638. https://doi.org/10.3390/su6128618