1. Introduction
The production of solid waste (SW) is an inevitable consequence of population boom, economic growth, rapid urbanization and the rise of human living standards, especially for developing countries due to incomplete institutional arrangements for solid waste management (SWM) [
1,
2]. SWM is one of the most challenging issues faced by developing countries [
3]. Due to incomplete institutional arrangement and improper handling of SWM, developing countries are suffering from serious pollution problems caused by growing quantities of SW, such as contamination of water, soil and atmosphere, negative impacts on human health, and its contribution to climate change [
2,
3]. The sustainable management of SW will become necessary at all phases of impact from planning to design, to operation, and to decommissioning in the 21st century [
4].
As the second largest economy in the world, China has become the largest SW generator in the world since 2004 owing to the unprecedented rate of urbanization, industrialization and steadily improving living standards [
5,
6]. According to the projection of the World Bank (2005), the total amount of SW in China will be over 480 million tons in 2030 [
7]. In order to resolve the environmental issues induced by SW disposal, China has devoted considerable efforts to managing SW and issued a series of regulations and policies for SWM, such as the Law of PR China on the Prevention of Environmental pollution, which is the main legislation specifically pertaining to SWM and pollution control, the Law of the People’s Republic of China on The Prevention and Control of Environmental Pollution by Solid Waste issued in 1996 and amended in 2004, the Law on Circular Economy Promotion issued in 2009, and has established a legal framework on SW reduction, reuse and recycling (3Rs)
et al. The investment in SW treatment equipment and infrastructure increased 7.94 times, and over 3.95 times more SW was treated or disposed of safely from 1991–2010. However, compared with developed countries, such as Germany, Japan, Sweden, The Netherlands and Sweden, China still has a long way to go in the sustainable management of SW (especially for municipal solid waste, MSW) with respect to reduction, recycling, reuse and safely treatment technology and strategy [
5,
8,
9].
There are lots of studies which have focused on China’s SWM at the city level [
8,
10,
11,
12,
13,
14], provincial level [
6,
15] and even at the country level [
5,
7,
9,
16,
17,
18,
19,
20], including the trend of SW generation, the composition of SW, the barriers of SWM [
7,
9,
18,
21], and the impacts of SW on the environment [
15,
22] and contribution to climate change [
13]. However, to our knowledge, few studies have focused on the sustainability assessment of China’s SWM which is very important for designing relevant policy for further improving the overall efficiency of SWM. The paper integrated the approach of decoupling and decomposition analysis to assess the sustainability status of SWM by analyzing the decoupling of SW from economic growth, and identified the main driving factors of changes in SW during 1991–2010, to serve as the basis for future policy scenarios.
2. Methodologies
Sustainability assessment has been developed conceptually and through practical applications, and has increasingly become associated with the family of impact assessment tools [
23,
24]. Ness
et al. conceptually reviewed several tools of sustainability assessment based on three main categories such as indicators/indices, product-related assessment, and integrated assessment tools [
24]. With regard to the approaches for sustainability assessment of SMM, many scholars applied environmental performance indicators [
25], zero waste index [
26,
27], life cycle assessment [
28,
29], material flow analysis [
30] and emergy (or exergy) analysis [
15] to assess the sustainability of SWM, and other scholars have carried out the sustainability assessment by means of computer based multiple sustainability assessment models and sustainability assessment by success and efficiency factors [
30]. Except for the approaches mentioned above, from the perspective of macroeconomics, decoupling of economic activity from environmental or waste impacts has been proposed as the inter-linked objectives for enhancing cost-effective and operational environmental policies in the context of sustainability [
31,
32]. Due to the problems of availability of a sufficient quantity of reliable data, especially for detailed data on SW composition, it is very difficult to conduct process-based sustainability analysis (e.g., LCA, MFA) of China at the macro level. So, the paper proposes to apply the decoupling analysis (including decoupling SW generation and discharge from economic growth) to evaluate the sustainability performance of SWM in China during 1991–2010. The paper also used decomposition analysis to investigate the underlying determinant effects that influence the change of total SW generation and discharge.
2.1. Decoupling Analysis
The definition of decoupling environmental pressures (E) from economic growth (take GDP for example) is shown as in
Figure 1 [
33]. Decoupling status could be estimated by the GDP elasticity values of environmental pressure which shows in Equation (1):
When using economic output per capita as the X-axis and environmental impact as the Y-axis, eight logical possibilities can be distinguished. In order to not over-interpret slight changes as significant, a ±20% variation of the elasticity values around 1.0 (0.8–1.2) is still regarded as coupling [
33,
34]. Compared to this diagram, actually, our research results mostly fell in the right part, which is indicated as zone 1 to zone 4 in
Figure 1.
Figure 1.
Degree of coupling and decoupling zones ([
33]).
Figure 1.
Degree of coupling and decoupling zones ([
33]).
The paper conducted the decoupling analysis of industrial solid waste (includes both the non-hazard and hazard industrial solid waste) generation (ISWG), industrial solid waste discharge (ISWD), and municipal solid waste generation (MSWG) from economic growth by calculating the GDP elasticity of ISWG, ISWD, MSWG according to Equation (1). As for the MSWG, since urban population and demographic trend are the key drivers for urban garbage generation and disposal, the role of population in MSWG decoupling allows the capturing of the dynamic effect of consumption and population growth, provides the relative direction of the change and the scale of the change, and also allows comparing real variations in MSWG and population [
35,
36]. So, the paper carried out the decoupling analysis of MSWG from population increase by calculating the population (Pop) elasticity of MSWG according to Equation (2):
2.2. Index Decomposition Analysis
Decomposition methodology which is a technique has been widely applied in environmental analysis, provides a linkage between an aggregate and the original raw data whereby information of interest is captured in a concise and usable form [
37,
38]. The paper applied logarithmic mean divisia index (LMDI), which is one of index decomposition analysis methods and has been widely applied to analyze resource consumption and waste emission, to identify major driving factors influencing changes in ISWD and the harmless disposal of municipal solid waste (MSWHD) of China. The ISWD in China was decomposed into six influencing factors: population, per capita GDP, industrial structure, investment intensity in treatment of ISW, investment efficiency of ISW recycle, and ISWD intensity. The MSWHD in China was divided into three influencing factors: urban population, per capita investment in sanitation (includes collection, transportation and disposal), investment efficiency of MSW treatment and disposal (
Table 1). Based on the LMDI decomposition model [
38,
39,
40], the paper decomposed the ISWD into six influencing factors, and MSWHD into three influencing factors. The meaning of each factor is shown in
Table 1.
Table 1.
The fundamental equations of LMDI model.
Table 1.
The fundamental equations of LMDI model.
| Equations | The Meaning of Factors in Equations |
|---|
| P: population scale; G: gross domestic production (GDP); G2: value added of the secondary industry; ISW(IN): investment in treatment of industrial solid waste; ISW(RECYCLE): the amount of ISW recycled; ISW: the amount of ISW discharged;
a: per capita GDP, s: the proportion of the second industry to GDP refers to industrial structure; e: investment intensity of ISW management; b: investment efficiency of ISW recycling; d: ISW discharged intensity refers to technology. |
| UP: urban population refers to urban scale;
A: investment in sanitation; MSWHD: the amount of harmless disposal of MSW; m: per capita investment in sanitation; n: investment efficiency in MSW treatment and disposal. |
The paper focused on the period of 1991–2010. All the socio-economic data used in this paper was collected from China Statistical Yearbook (1992–2011) [
41]. The GDP data measured and GDP of secondary industry as real GDP value in purchase power parity (at constant price in 1978) to eliminate the impact of price factors on the data. The data related to ISW, MSW and investment in SWM comes from China Environment Yearbook (1992–2011) [
42]. Due to the difficulty in estimating the amount of municipal garbage generation in practical statistics in China, the municipal garbage generation is often replaced by municipal garbage disposal, which refers to the amount of municipal garbage collected and transported to disposal factories or sites and includes the garbage produced from households, commercial activities, markets, street cleaning, public sites
et al. in the urban area [
42].
3. Results
3.1. Overview of SW Generation in China
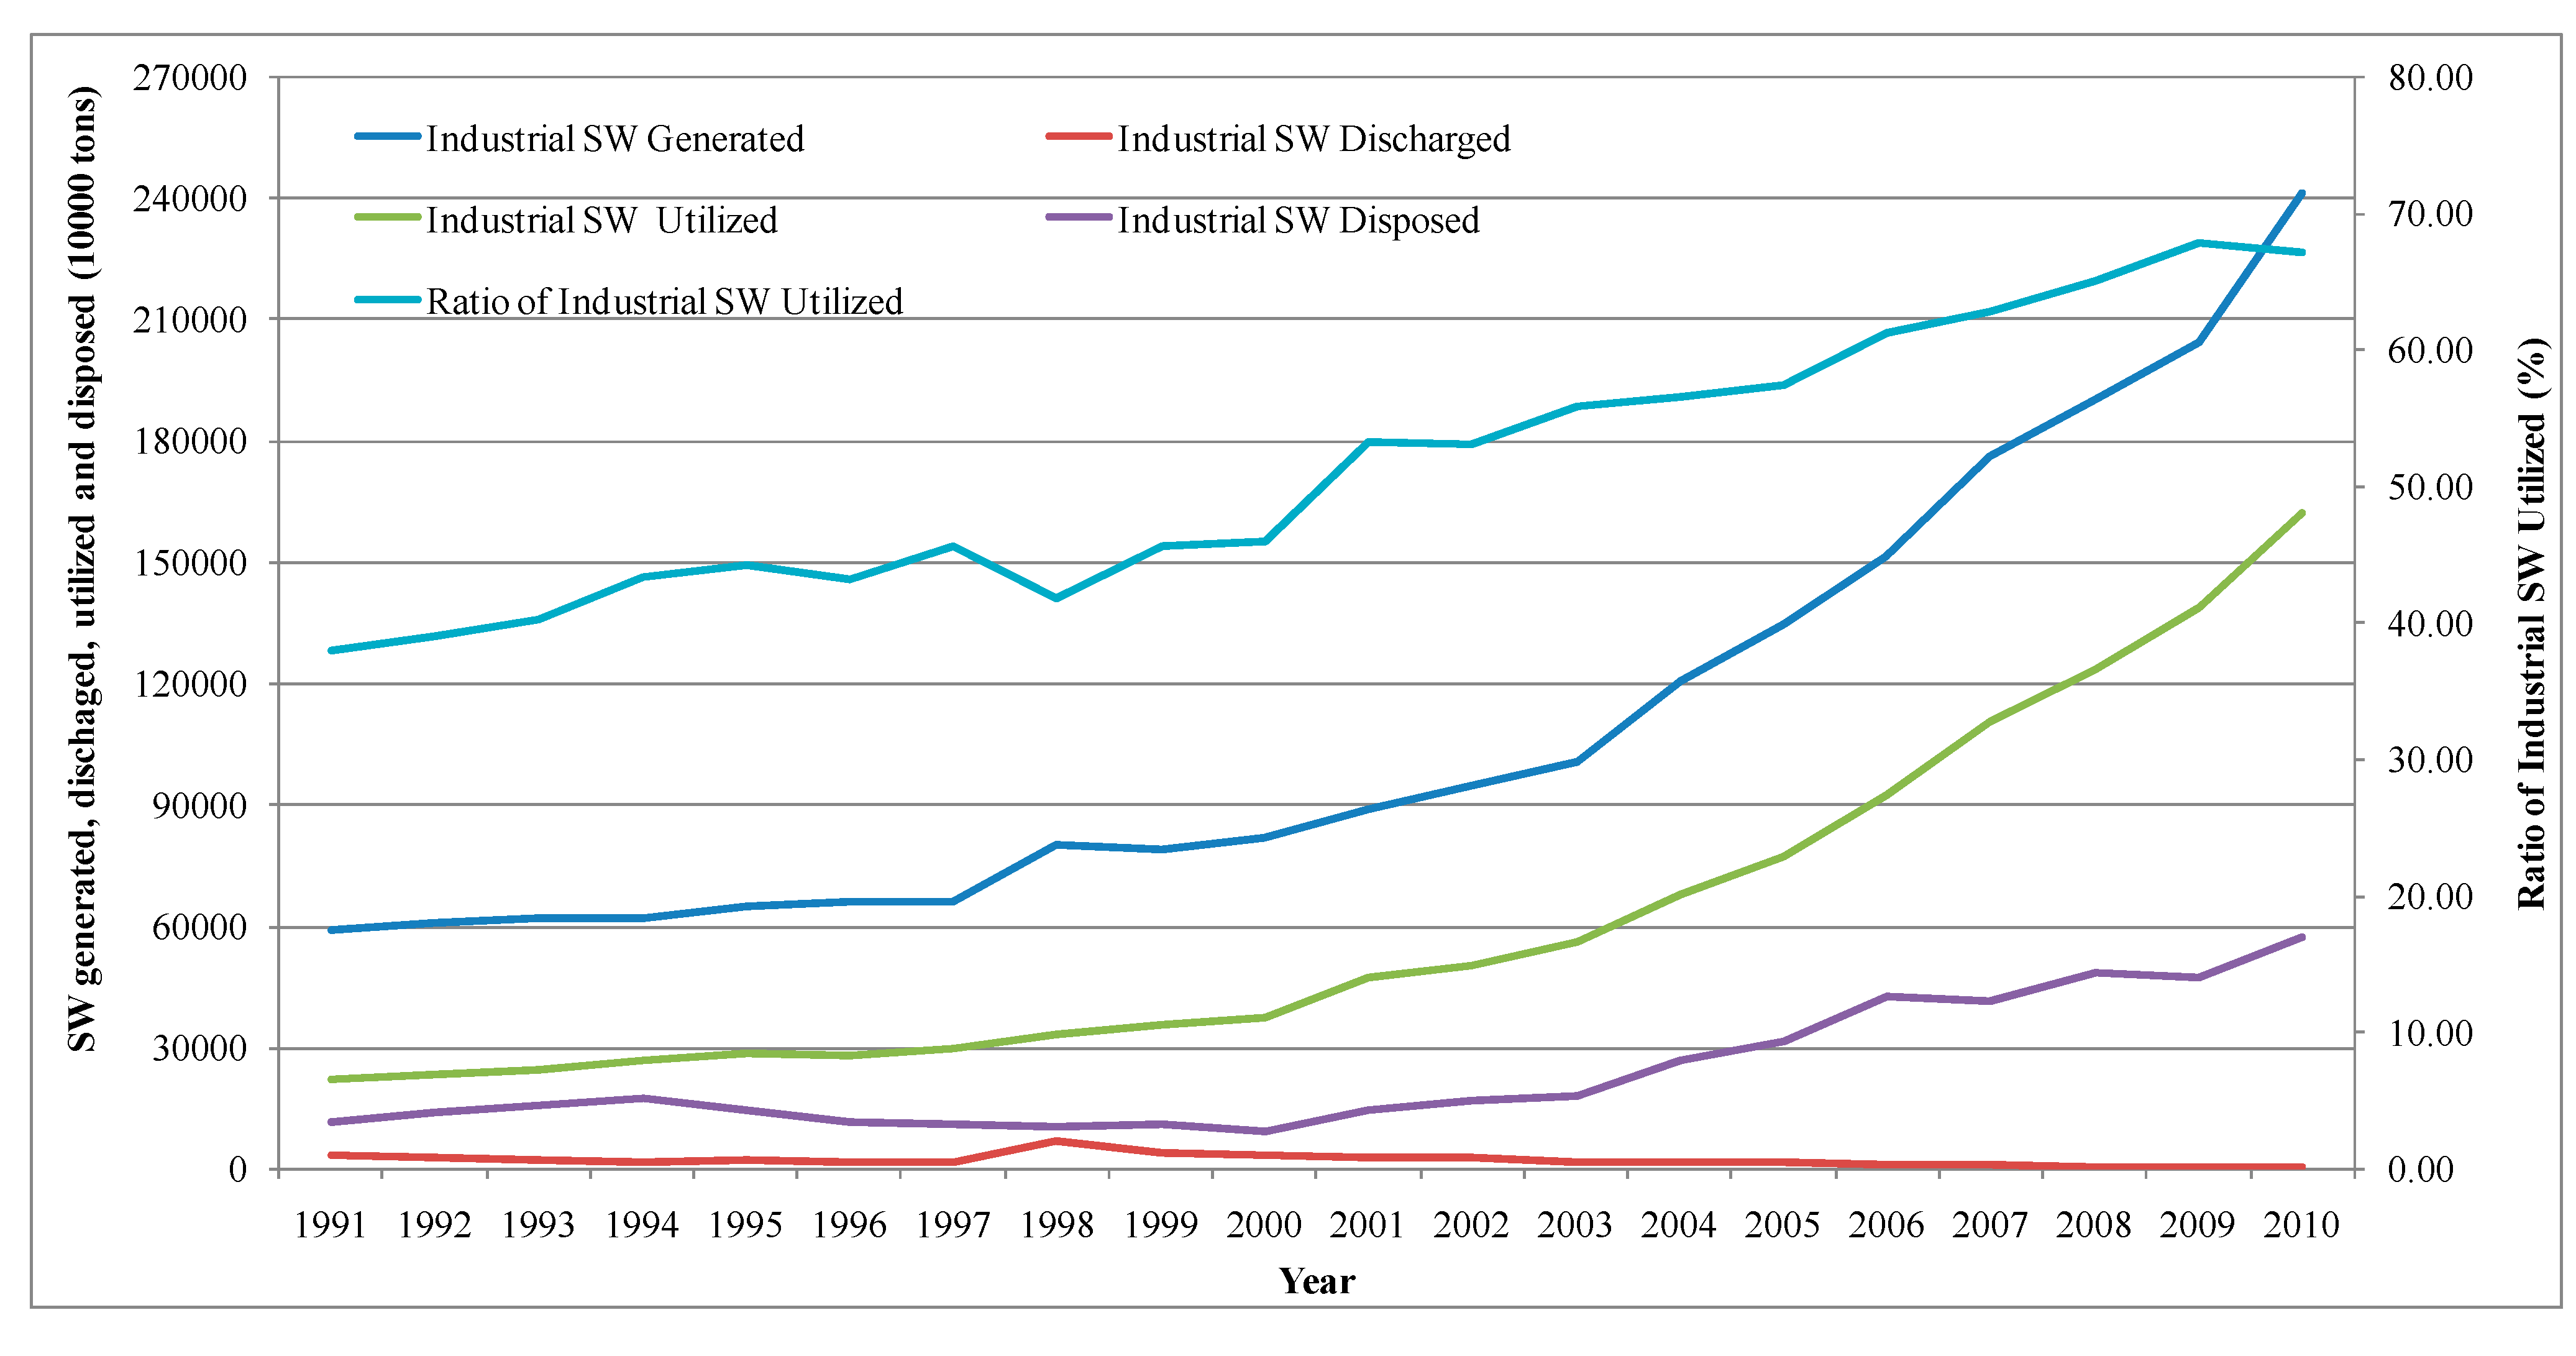
With fast economic growth driven by rapid industrialization, the total amount of ISWG has increased (with an average annual increase rate of 11.5%) from 587.59 million tons in 1990 to 2409.44 million tons in 2010 (
Figure 2). Due to the constant increase of ISW disposed and utilized (the amount of increase was 4.9 and 4.58 times, respectively, during 1991–2010), the amount of ISWD in the last couple years showed a decreasing trend which can be divided into two phases: during 1991–1997, it showed decreasing trend, after 1997, the amount of discharge leaped forward to 70.48 million tons in 1998, then the continuous decreasing trend appeared again during 1998–2010. The reason for the sudden increase in ISWD in 1998 is that the amount of ISWG in the mining and quarrying department rapidly increased from 311.9 million tons in 1997 to 408.23 million tons in 1998. In virtue of the implementation of clean production and circular economy policies, the ratio of ISW utilized increased from 37.92%–67.14%. The benefits of ISW utilization in China is not only shown by the decreased ISWD, but also the output values from utilization, which were 31.05 billion in 2000 and 177.85 billion in 2010. In general, China has made great progress in ISW management which is represented by the significant decrease of discharge and increase of utilization ratio. However, the increase rate of ISW utilized was smaller than ISWG (
Figure 2) which means that there is an increasing amount of non-utilized ISW. Besides, the utilization ratio is still at a very low level, especially compared with developed countries (e.g., USA, Germany, Japan,
et al.).
Figure 2.
The amount of ISW generated, discharged and utilized in China during 1991–2010.
Figure 2.
The amount of ISW generated, discharged and utilized in China during 1991–2010.
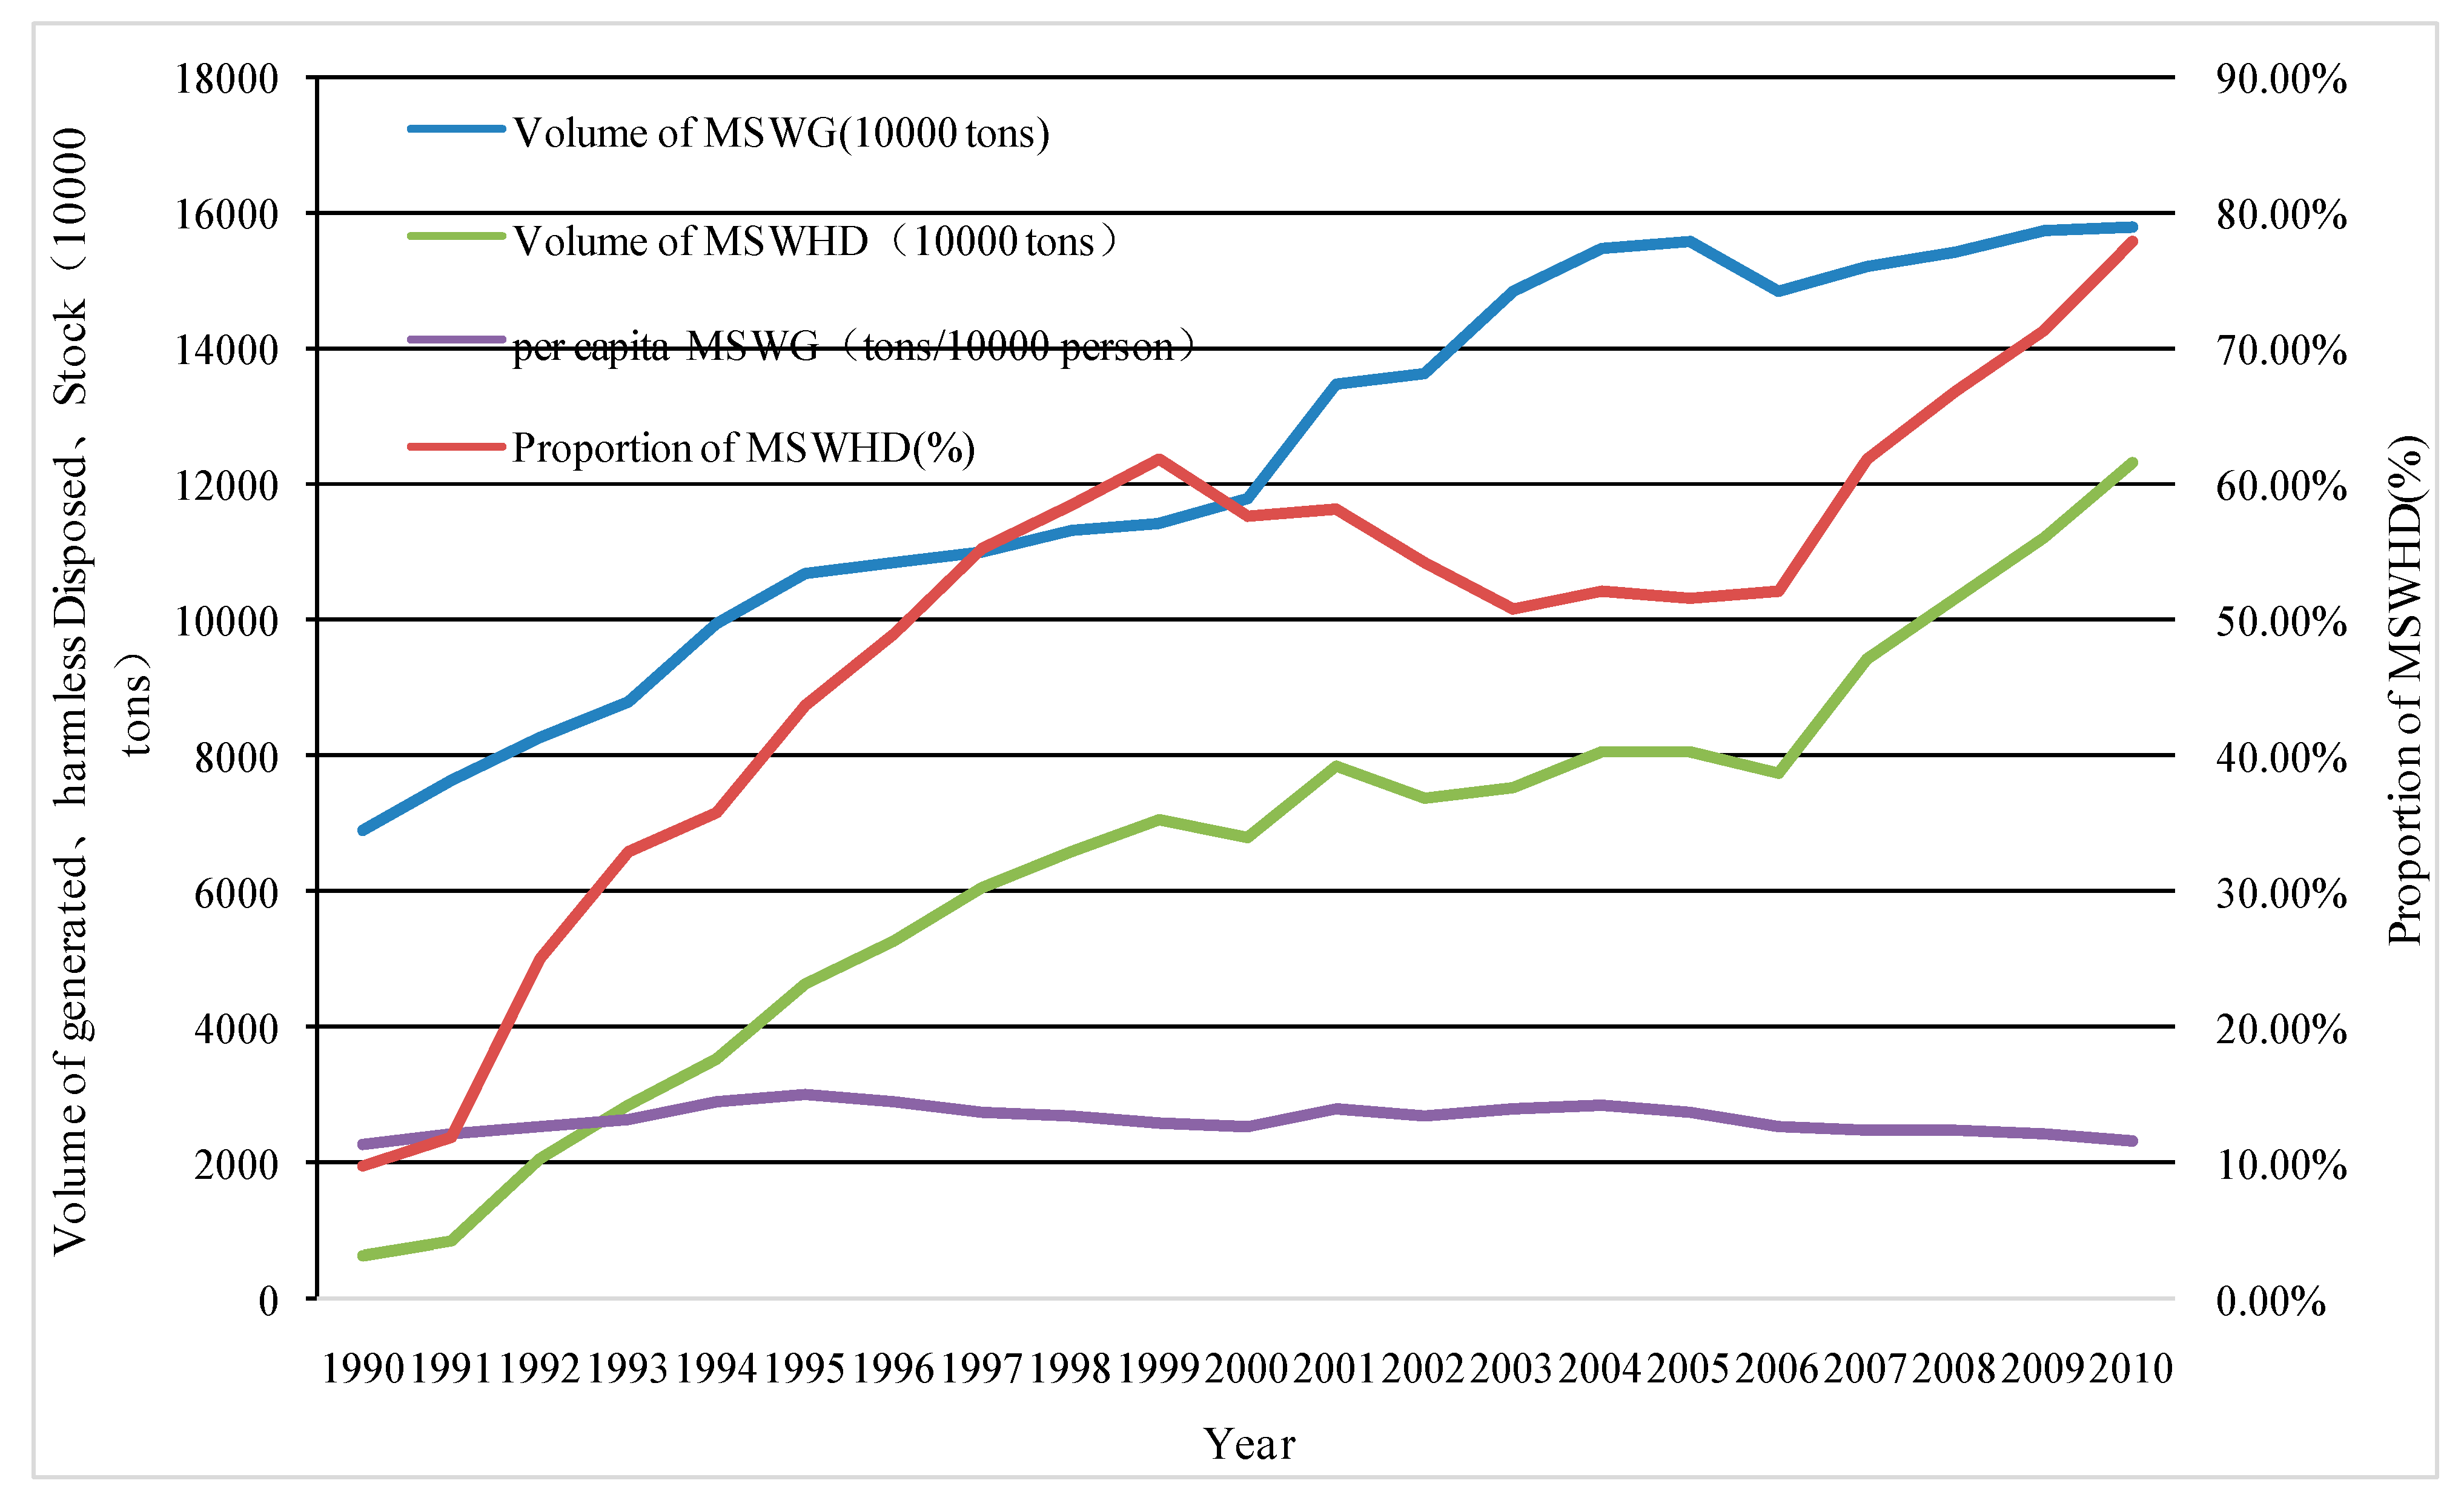
With rapid urbanization and living standard improvements, the MSWG has been constantly increasing [
43]. As the main part of MSW, municipal garbage and its management dramatically influences urban sustainable development. Due to the data unavailability of municipal garbage generation, the paper only analyzes the disposed and harmless disposed municipal garbage. The amount of municipal garbage disposal increased from 68.94 million tons in 1990 to 155.77 million tons in 2005, then decreased from 155.77 million tons in 2005 to 148.41 million tons in 2006, then slowly increased from 148.41 million tons in 2005 to 158.05 million tons in 2010, and its average annual growth rate is 6.16% during the whole period (
Figure 3). The proportion of harmless disposed MSW ranged from 50%–60%, but after 2006, increased rapidly during 2006–2010. The gap between MSWG and MSWHD remained stable in the period of 1990–2001, then enlarged from 2001–2003 and eventually narrowed due to the fast increase in MSWHD. In 2010, 34.93 million tons MSW still was not treated harmlessly. The per capita MSWG remained stable which indicates that the effect of population on MSWG is linear.
Figure 3.
The amount of MSW disposal in China during 1990–2010.
Figure 3.
The amount of MSW disposal in China during 1990–2010.
3.2. Decoupling Analysis
In order to investigate the temporal variations in the decoupling of SW discharge from economic growth and population expansion specifically, the paper calculated the decoupling indicators in each time period by Equations (1) and (2). The results of the decoupling analysis of ISWG, ISWD, and MSWG from GDP, and MSWG from population in the 19 periods (1991–1992, 1992–1993, ..., 2009–2010) is shown in
Figure 4 and
Figure 5.
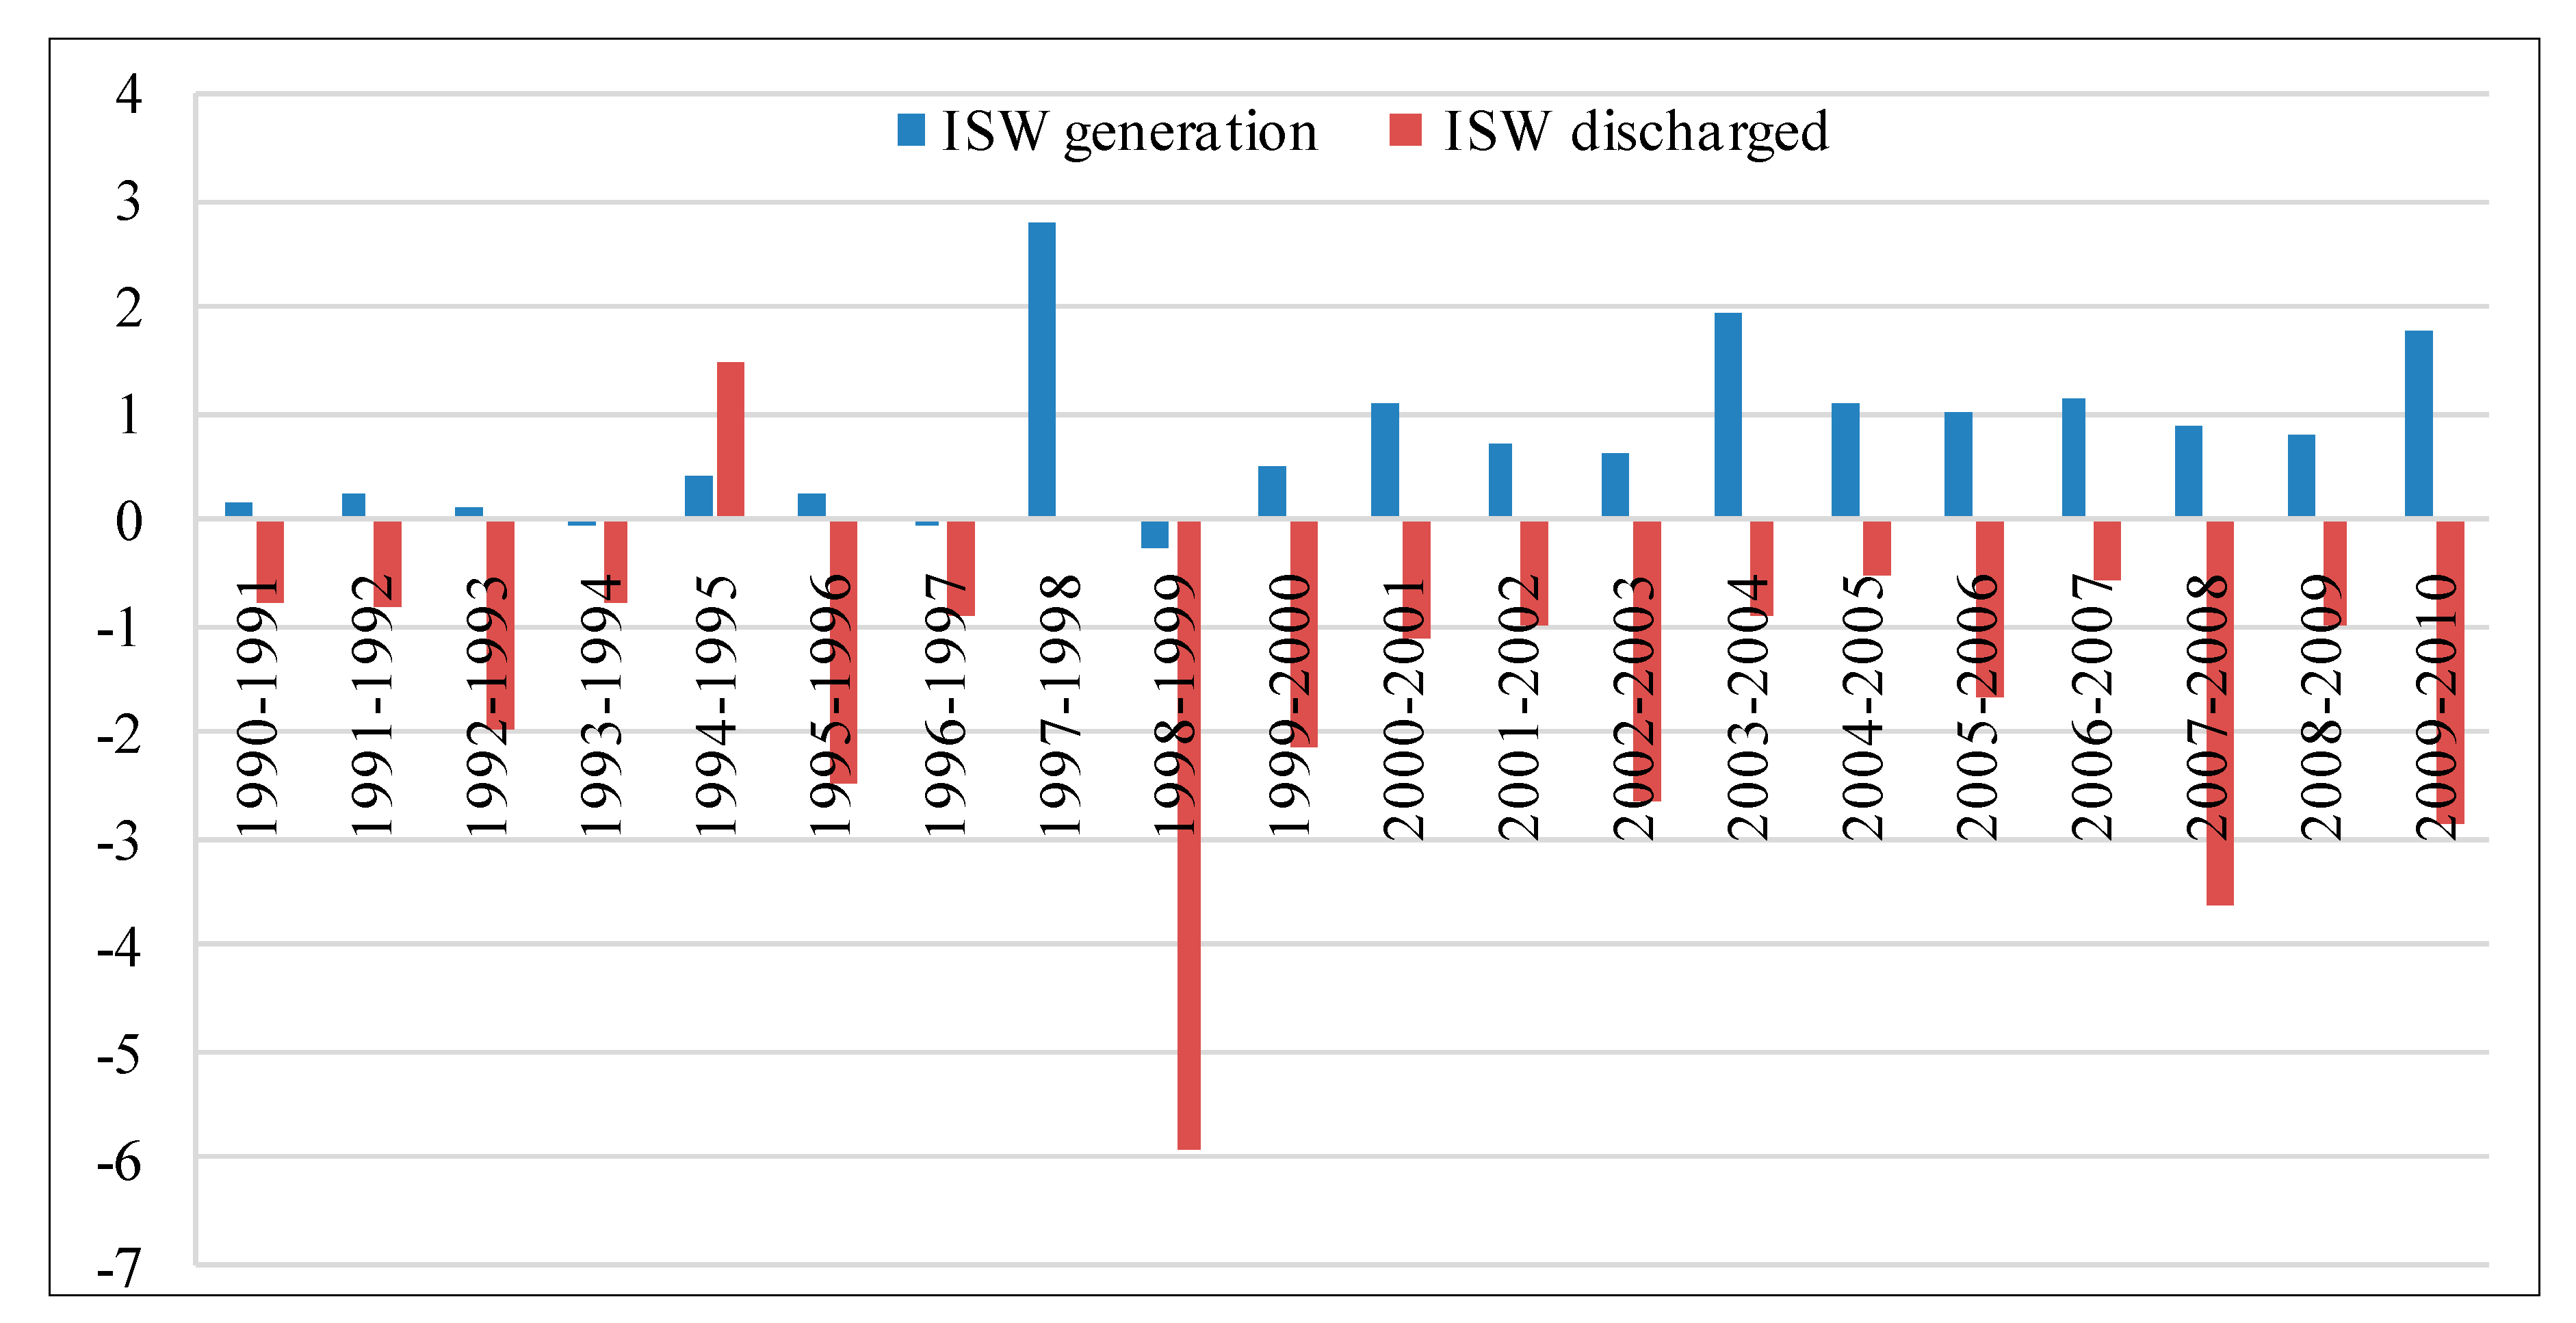
The increasing amount of ISWG could lead to pressure for ISW utilization and recycling at a certain technical level, and thus, potentially contribute to an increase in the discharge amount of ISW. Besides, if the amount of ISW cannot be controlled with economic growth, this means that the socio-economic cost for reducing the environmental pressure induced by ISW could be very large. Therefore, the paper conducts a decoupling analysis for both ISWG and ISWD (
Figure 4). Referring to the ISWG, strong decoupling of ISWG from economic growth happened only in the periods of 1993–1994, 1996–1997 and 1998–1999, and weak decoupling happened in each period of 1990–1993, 1994–1996, 1999–2000, 2001–2003, and 2008–2009. Non-decoupling of ISWG happened in the periods of 1997–1998, 2000–2001, 2003–2008 and 2009–2010, and non-decoupling in the period of 2000–2001, and 2004–2008 shows expanding decoupling status, while the periods of 1997–1998, 2003–2004 and 2009–2010 even showed expansive negative decoupling status. The results suggest the need for policies to reduce the ISW from source controlling.
As for the ISWD, the GDP elasticity was negative, which reflects that the strong decoupling happened at the national level during the period 1991–2010 except the period of 1994–1995 which showed weak decoupling status, and 1997–1998 which showed very strong expansive negative decoupling status due to the discharge of industrial solid waste in 1998 being 4.55 times of that in 1997 due to the fast increase in ISWD of the mining and quarrying sector (from 17.85–59.62 million tons).
Figure 4.
The GDP elasticity of ISWG and ISWD (%∆E/%∆GDP) in China, notes: the GDP elasticity of ISWD in the period of 1997–1998 is not displayed in the figure due to its value (45.32) being too large when compared with other periods.
Figure 4.
The GDP elasticity of ISWG and ISWD (%∆E/%∆GDP) in China, notes: the GDP elasticity of ISWD in the period of 1997–1998 is not displayed in the figure due to its value (45.32) being too large when compared with other periods.
Figure 5.
The GDP and population (Pop) elasticity of MSWG in China.
Figure 5.
The GDP and population (Pop) elasticity of MSWG in China.
With regard to the decoupling of MSWG from economic growth, as depicted in
Figure 5, the expansive negative decoupling was observed in the periods of 1993–1994 and 2000–2001 due to the MSWG growing faster than the economy by more than 1.2 times. Furthermore, the absolute decoupling happened only in the period of 2005–2006. Most of the investigated period showed a weak decoupling status.
As for the decoupling of MSWG from population growth, the situation was even worse. The population elasticity of MSWG is bigger than the GDP's except for in the period of 2005–2006. The expansive negative decoupling is observed in first five periods and the periods of 2000–2001 and 2002–2004.
3.3. Decomposition Analysis of SW Change
In order to understand the main drivers of the changes in SW and thus design appropriate measures to decrease SW, the paper conducted the decomposition analysis according to equations in
Table 1. The decomposition result of ISWD is shown in
Figure 6 with reference to the year 1991 and MSWHD is shown in
Figure 7 with reference to the year 2000.
Figure 6.
LMDI decomposition of change of total ISWD in China during 1991–2010.
Figure 6.
LMDI decomposition of change of total ISWD in China during 1991–2010.
Figure 7.
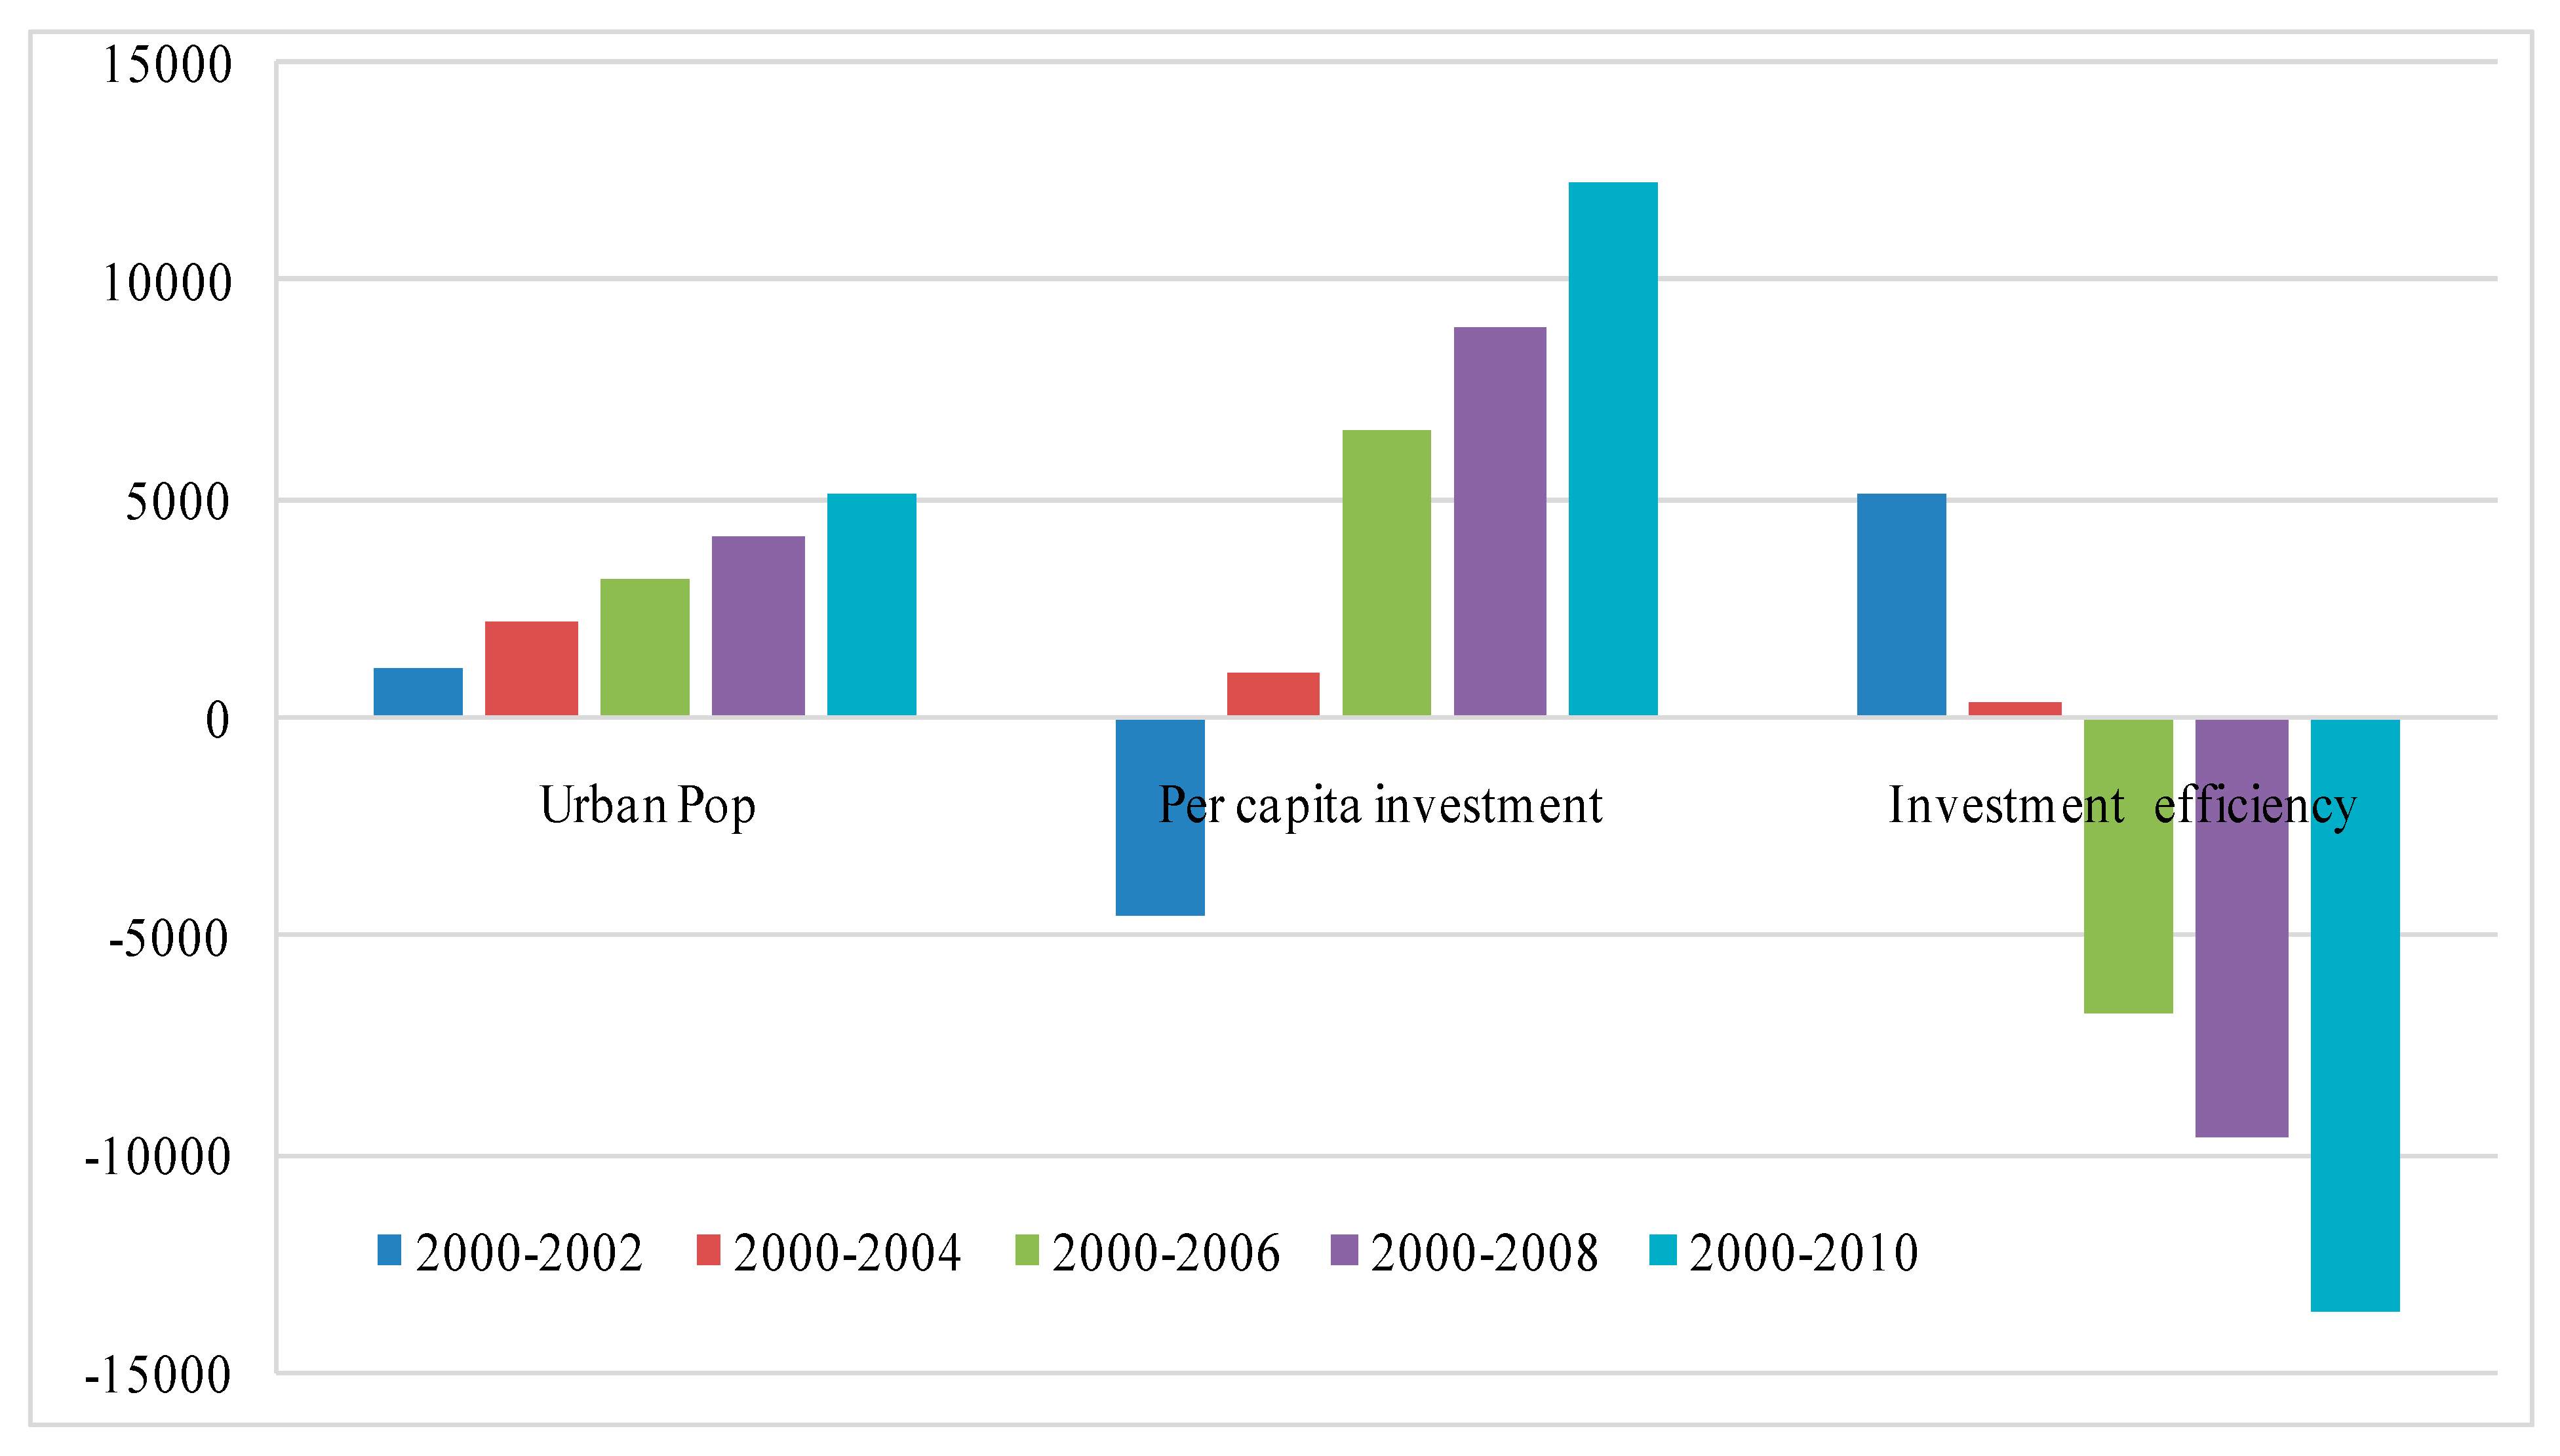
LMDI decomposition of change of MSWHD in China during 2000–2010.
Figure 7.
LMDI decomposition of change of MSWHD in China during 2000–2010.
Referring to the ISWD (
Figure 6), the decomposition analysis indicates that the factors of investment efficiency and technology were the main determinants to decrease the ISWD. However, the factor of economic growth was the most important factor that led to the increase in ISWD. The factor of investment in ISW treatment fluctuated to a large extent, while finally decreasing ISWD. The factors of population growth and industrial structure also contributed to increasing ISWD, but the contribution was less than economic growth.
With regards to MGH, the factors of urban population and per capita investment in sanitation were the main drivers of the MSWHDG increasing (
Figure 7). The positive effect of urban population on MSWHD indicates that the capability of MSW harmless treatment and disposal was promoted with the expansion of urban scale. The change in contribution of per capital investment over the periods indicates that the investment in MSW management had lag effects on MSWHD (the contribution of per capital investment was negative in the first period and then switched to positive in subsequent periods). However, the factor of investment efficiency showed negative effects on MSWHD due to the decrease in efficiency over the whole period (the investment efficiency decreased 2.67 times). All the results indicate that the bigger cities have higher capacity to dispose MSW harmlessly. Additionally, the investment in MSW management can promote the harmless disposal amount of MSW. However, the investment efficiency was still at a low level and even decreased which suggests the need for policies to promote the utilization level of current MSW treatment and disposal facilities, and optimize MSW management strategies (e.g., reduce the MSWG though clarification and recycling, recycle the organic waste to produce biological energy, develop the urban mining to reuse the metal waste,
etc.).
4. Summaries and Conclusions
The paper investigated the sustainability of SWM by analyzing the decoupling of SW generation from economic growth and population increasing during 1990–2010 in China, and further identified the driving factors of ISWG and MSWHD by adopting the LMDI method to serve as the basis for future policy scenarios.
In general, with fast economic growth fueled by urbanization and industrialization, the amount of SW generation has been continuously increasing which will lead to great pressure on SWM. The ISWD decreased due to the increasing amount of utilization of ISW. However, the ratio of utilization is still low, especially compared with developed countries. As for the MSW, both the amount of generation and harmless disposal increased. The amount of MSWG and MSWHD also increased fast, and the gap between MSWG and MSWHD still remains large. The gap between SW generated and utilized suggests that a series of policies should be adopted to improve the capacity in MSWHD.
The paper provided evidence of the absolute decoupling of ISWD from economic growth except for the period of 1997–1998, and weak decoupling, even non-decoupling (including expanding and expansive negative decoupling) of ISWG in most investigated periods. The conflicting results of ISWG and ISWD indicate that China needs timely technology innovation and rational institutional arrangement to reduce the intensity of solid waste emission from the source. Regarding the MSW, the absolute decoupling of disposal from economic growth only can be found in the period of 2005–2006. Most of the investigated period showed the weak decoupling status. With regard to the decoupling of MSWG from urban population growth, the situation is even worse. The expansive negative decoupling was observed in seven of 20 periods investigated, and weak decoupling occurred in 11 periods.
The decomposition analysis helps to understand how the specific driving factors (i.e., population scale, economic growth, industrial structure, urban scale, technology and investment in SWM) affected the changes in ISWD and MSWHD. Results confirm that the economic growth, industrial structure and population scale are the main drivers of increases in ISWD. Meanwhile, investment in ISW management and technology contribute to decreases in the discharge amount, but still cannot offset the positive contribution of the driving factors mentioned above. The negative effects of investment and technology suggest the need for policies to increase investment and promote technology for raising the utilization ratio further. As for the MSW, the urban scale and investment in harmless disposal helps increase the amount of harmless disposal, which means that larger cities will possess a greater capability to dispose MSW harmlessly, due to infrastructure and financial resources for MSW treatment is better in large cities than small cities. Inversely, the investment efficiency has a negative effect on MSWHD which suggests need for policies to promote the utilization level of current MSW treatment and disposal facilities, and optimize MSW management strategies (e.g., reduce the MSWG through classification and recycling, recycle the organic waste to produce biological energy, develop urban mining to reuse metal waste, etc.).
The approaches applied in the paper are suggested as a tool to evaluate the sustainability of SWM and identify the drivers of changes in SW to design future policy scenarios for sustainable management of SW in the near future. However, it is worth noting that the quantity of data (e.g., we use the amount of MSW disposal to replace generation, and investment in sanitation to represent investment in MSW management) may lead to estimation bias of the results to a certain extent. Nevertheless, we believe our findings provide solid and meaningful results with useful implications for policy makers.
Acknowledgments
The authors would like to acknowledge the financial support from the Natural Science Foundation of China (41471462, 41301652, 41101126 and 41261112), the Specialized Research Fund for the Doctoral Program of Higher Education (20120211120026), and the Fundamental Research Funds for the Central Universities (lzujbky-2013-132).
Author Contributions
Jiaxing Pang contributed to data collection, data processing and draft paper; Xingpeng Chen and Zilong Zhang conceived and designed the study, conducted data analysis as well as paper revision; Hengji Li contributed to data analysis and paper revised.
Conflicts of Interest
The authors declare no conflict of interest.
References
- Vergara, S.E.; Tchobanoglous, G. Municipal solid waste and the environment: A global perspective. Annu. Rev. Environ. Resour. 2012, 37, 277–310. [Google Scholar]
- Guerrero, L.A.; Maas, G.; Hogland, W. Solid waste management challenges for cities in developing countries. Waste Manag. 2013, 33, 220–232. [Google Scholar]
- Al-Khatib, I.A.; Monou, M.; Abu Zahra, A.S.F.; Shaheen, H.Q.; Kassinos, D. Solid waste characterization, quantification and management practices in developing countries. A case study: Nablus district-palestine. J. Environ. Manag. 2010, 91, 1131–1138. [Google Scholar]
- Pires, A.; Martinho, G.; Chang, N.B. Solid waste management in european countries: A review of systems analysis techniques. J. Environ. Manag. 2011, 92, 1033–1050. [Google Scholar]
- Chen, X.; Geng, Y.; Fujita, T. An overview of municipal solid waste management in China. Waste Manag. 2010, 30, 716–724. [Google Scholar]
- Xue, B.; Geng, Y.; Ren, W.X.; Zhang, Z.L.; Zhang, W.W.; Lu, C.Y.; Chen, X.P. An overview of municipal solid waste management in inner mongolia autonomous region, China. J. Mater. Cycles Waste Manag. 2011, 13, 283–292. [Google Scholar]
- Hoornweg, D.; Lam, P.; Chaudhry, M. Waste management in China: Issues and recommendations. In Urban Development Working Papers; World Bank: Washington, DC, USA, 2005. [Google Scholar]
- Yuan, H.; Wang, L.; Su, F.; Hu, G. Urban solid waste management in chongqing: Challenges and opportunities. Waste Manag. 2006, 26, 1052–1062. [Google Scholar]
- Zhang, D.Q.; Tan, S.K.; Gersberg, R.M. Municipal solid waste management in china: Status, problems and challenges. J. Environ. Manag. 2010, 91, 1623–1633. [Google Scholar]
- Li, Z.-S.; Yang, L.; Qu, X.-Y.; Sui, Y.-M. Municipal solid waste management in Beijing city. Waste Manag. 2009, 29, 2596–2599. [Google Scholar]
- Chung, S.S.; Poon, C.S. A comparison of waste management in Guangzhou and HongKong. Resour. Conserv. Recycl. 1998, 22, 203–216. [Google Scholar]
- Ju, M.W.; Li, A.M.; Liu, Z.; Ma, Z.Z.; Xu, X.X. Municipal solid waste management in Dalian municipality, China. Waste Manag. 2011, 31, 809–810. [Google Scholar]
- Zhao, W.; Huppes, G.; van der Voet, E. Eco-efficiency for greenhouse gas emissions mitigation of municipal solid waste management: A case study of Tianjin, China. Waste Manag. 2011, 31, 1407–1415. [Google Scholar]
- Chung, S.S.; Poon, C.S. Characterisation of municipal solid waste and its recyclable contents of guangzhou. Waste Manag. Res. 2001, 19, 473–485. [Google Scholar]
- Liu, G.Y.; Yang, Z.F.; Chen, B.; Zhang, Y.; Su, M.R.; Zhang, L.X. Emergy evaluation of the urban solid waste handling in Liaoning province, China. Energies 2013, 6, 5486–5506. [Google Scholar]
- Yang, L.; Chen, Z.L.; Liu, T.; Wan, R.; Wang, J.; Xie, W.G. Research output analysis of municipal solid waste: A case study of China. Scientometrics 2013, 96, 641–650. [Google Scholar]
- Wei, J.B.; Herbell, J.D.; Zhang, S. Solid waste disposal in China—Situation, problems and suggestions. Waste Manag. Res. 1997, 15, 573–583. [Google Scholar]
- Chung, S.S.; Lo, C.W.H. Local waste management constraints and waste administrators in China. Waste Manag. 2008, 28, 272–281. [Google Scholar]
- Wang, H.T.; Nie, Y.F. Municipal solid waste characteristics and management in China. J. Air Waste Manage. Assoc. 2001, 51, 250–263. [Google Scholar]
- Jiang, Y.; Kang, M.Y.; Liu, Z.; Zhou, Y.F. Urban garbage disposal and management in China. J. Environ. Sci. 2003, 15, 531–540. [Google Scholar]
- Troschinetz, A.M.; Mihelcic, J.R. Sustainable recycling of municipal solid waste in developing countries. Waste Manag. 2009, 29, 915–923. [Google Scholar]
- Herva, M.; Neto, B.; Roca, E. Environmental assessment of the integrated municipal solid waste management system in Porto (Portugal). J. Clean. Prod. 2014, 70, 183–193. [Google Scholar]
- Mori, K.; Christodoulou, A. Review of sustainability indices and indicators: Towards a new city sustainability index (CSI). Environ. Impact Assess. Rev. 2012, 32, 94–106. [Google Scholar]
- Ness, B.; Urbel-Piirsalu, E.; Anderberg, S.; Olsson, L. Categorising tools for sustainability assessment. Ecol. Econ. 2007, 60, 498–508. [Google Scholar]
- Huang, Y.T.; Pan, T.C.; Kao, J.J. Performance assessment for municipal solid waste collection in Taiwan. J. Environ. Manag. 2011, 92, 1277–1283. [Google Scholar]
- Zaman, A.U. Measuring waste management performance using the ‘zero waste index’: The case of Adelaide, Australia. J. Clean. Prod. 2014, 66, 407–419. [Google Scholar]
- Zaman, A.U. Identification of key assessment indicators of the zero waste management systems. Ecol. Indicat. 2014, 36, 682–693. [Google Scholar]
- Del Borghi, A.; Gallo, M.; del Borghi, M. A survey of life cycle approaches in waste management. Int. J. Life Cycle Assess. 2009, 14, 597–610. [Google Scholar]
- Menikpura, S.N.M.; Gheewala, S.H.; Bonnet, S. Framework for life cycle sustainability assessment of municipal solid waste management systems with an application to a case study in Thailand. Waste Manag. Res. 2012, 30, 708–719. [Google Scholar]
- Zurbrugg, C.; Caniato, M.; Vaccari, M. How assessment methods can support solid waste management in developing countries—A critical review. Sustainability 2014, 6, 545–570. [Google Scholar]
- Zhang, L.M.; Xue, B.; Geng, Y.; Ren, W.X.; Lu, C.P. Emergy-based city’s sustainability and decoupling assessment: Indicators, features and findings. Sustainability 2014, 6, 952–966. [Google Scholar]
- Wagner, J. Incentivizing sustainable waste management. Ecol. Econ. 2011, 70, 585–594. [Google Scholar]
- Tapio, P. Towards a theory of decoupling: Degrees of decoupling in the EU and the case of road traffic in Finland between 1970 and 2001. Transport Policy 2005, 12, 137–151. [Google Scholar]
- Vehmas, J. Europe in Global Battle of Sustainability: Rebound Strikes Back? In Advanced Sustainability Analysis; Turun kauppakorkeakoulu: Turku, Finland, 2003. [Google Scholar]
- Recalde, M.Y.; Guzowski, C.; Zilio, M.I. Are modern economies following a sustainable energy consumption path? Energy Sustain. Dev. 2014, 19, 151–161. [Google Scholar]
- Ziolkowska, J.R.; Ziolkowski, B. Product generational dematerialization indicator: A case of crude oil in the global economy. Energy 2011, 36, 5925–5934. [Google Scholar]
- Zha, D.L.; Zhou, D.Q.; Ding, N. The contribution degree of sub-sectors to structure effect and intensity effects on industry energy intensity in China from 1993 to 2003. Renew. Sust. Energ. Rev. 2009, 13, 895–902. [Google Scholar]
- Ang, B.W.; Zhang, F.Q. A survey of index decomposition analysis in energy and environmental studies. Energy 2000, 25, 1149–1176. [Google Scholar]
- Zha, D.L.; Zhou, D.Q.; Zhou, P. Driving forces of residential CO2 emissions in urban and rural China: An index decomposition analysis. Energy Policy 2010, 38, 3377–3383. [Google Scholar]
- Xu, X.Y.; Ang, B.W. Index decomposition analysis applied to CO2 emission studies. Ecol. Econ. 2013, 93, 313–329. [Google Scholar]
- National Bureau of Statistics of the People’s Republic of China. In China Statistical Yearbooks 1991–2011; China Statistical Press: Beijing, China; pp. 1991–2011.
- Ministry of Environmental Protection of the People’s Republic of China. China Environment Yearbook 1991–2011; China Environment Yearbook Press: Beijing, China; pp. 1991–2011.
- Cheng, H.; Hu, Y. Mercury in municipal solid waste in China and its control: A review. Environ. Sci. Technol. 2011, 46, 593–605. [Google Scholar]
© 2014 by the authors; licensee MDPI, Basel, Switzerland. This article is an open access article distributed under the terms and conditions of the Creative Commons Attribution license (http://creativecommons.org/licenses/by/4.0/).


