Biofuel for Energy Security: An Examination on Pyrolysis Systems with Emissions from Fertilizer and Land-Use Change


Abstract
:1. Introduction
2. Literature Review

3. Model Structure
3.1. Modified Taiwan Agricultural Sector Model


| Variable | Description of Variables |
|---|---|
| Qi | Domestic demand of ith product |
 | Government purchases quantity for price supported ith product |
 | Import quantity of ith product |
 | Export quantity of ith product |
| ψ(Qi) | Inverse demand function of ith product |
 | Government purchase price on ith product |
| Cik | Purchased input cost in kth region for producing ith product |
| Xik | Land used for ith commodities in kth region |
| Lk | Land supply in kth region |
| αk(Lk ) | Land inverse supply in kth region |
| Rk | Labor supply in kth region |
| βk(Rk ) | Labor inverse supply in kth region |
| PL | Set-aside subsidy |
| ALk | Set-aside acreage in kth region |
| SUBj | Subsidy on planting jth energy crop |
| ECjk | Planted acreage of jth energy crop in kth region |
 | Inverse excess import demand curve for ith product |
 | Inverse excess export supply curve for ith product |
| TRQi | Import quantity exceeding the quota for ith product |
| EXED(TRQi) | Inverse excess demand curve of ith product that the import quantity is exceeding quota. |
| taxi | Import tariff for ith product |
| outtaxi | Out-of-quota tariff for ith product |
| Yik | Per hectare yield of ith commodity produced in kth region |
| Egik | gth greenhouse gas emission from ith product in kth region |
| PGHG | Price of GHG gas |
| GWPg | Global warming potential of gth greenhouse gas |
| GHGg | Net greenhouse gas emissions of gth gas |
| Baselineg | Greenhouse gas emissions under the baseline of the gth gas |
| fik | Labor required per hectare of commodity i in region k |
4. Study Setup
| GHG | Units | Estimated emission level | |
|---|---|---|---|
| GHG emissions from fertilizer and land use change | CO2 | Mg ha−1 yr−1 | 4.7 |
| CH4 | kg ha−1 yr−1 | −2.57 | |
| N2O | kg ha−1 yr−1 | 26.86 | |
| Net emissions | CO2e | Mg ha−1 yr−1 | 11.62 |
5. Results, Policy Implications


Policy Implications
- (a)
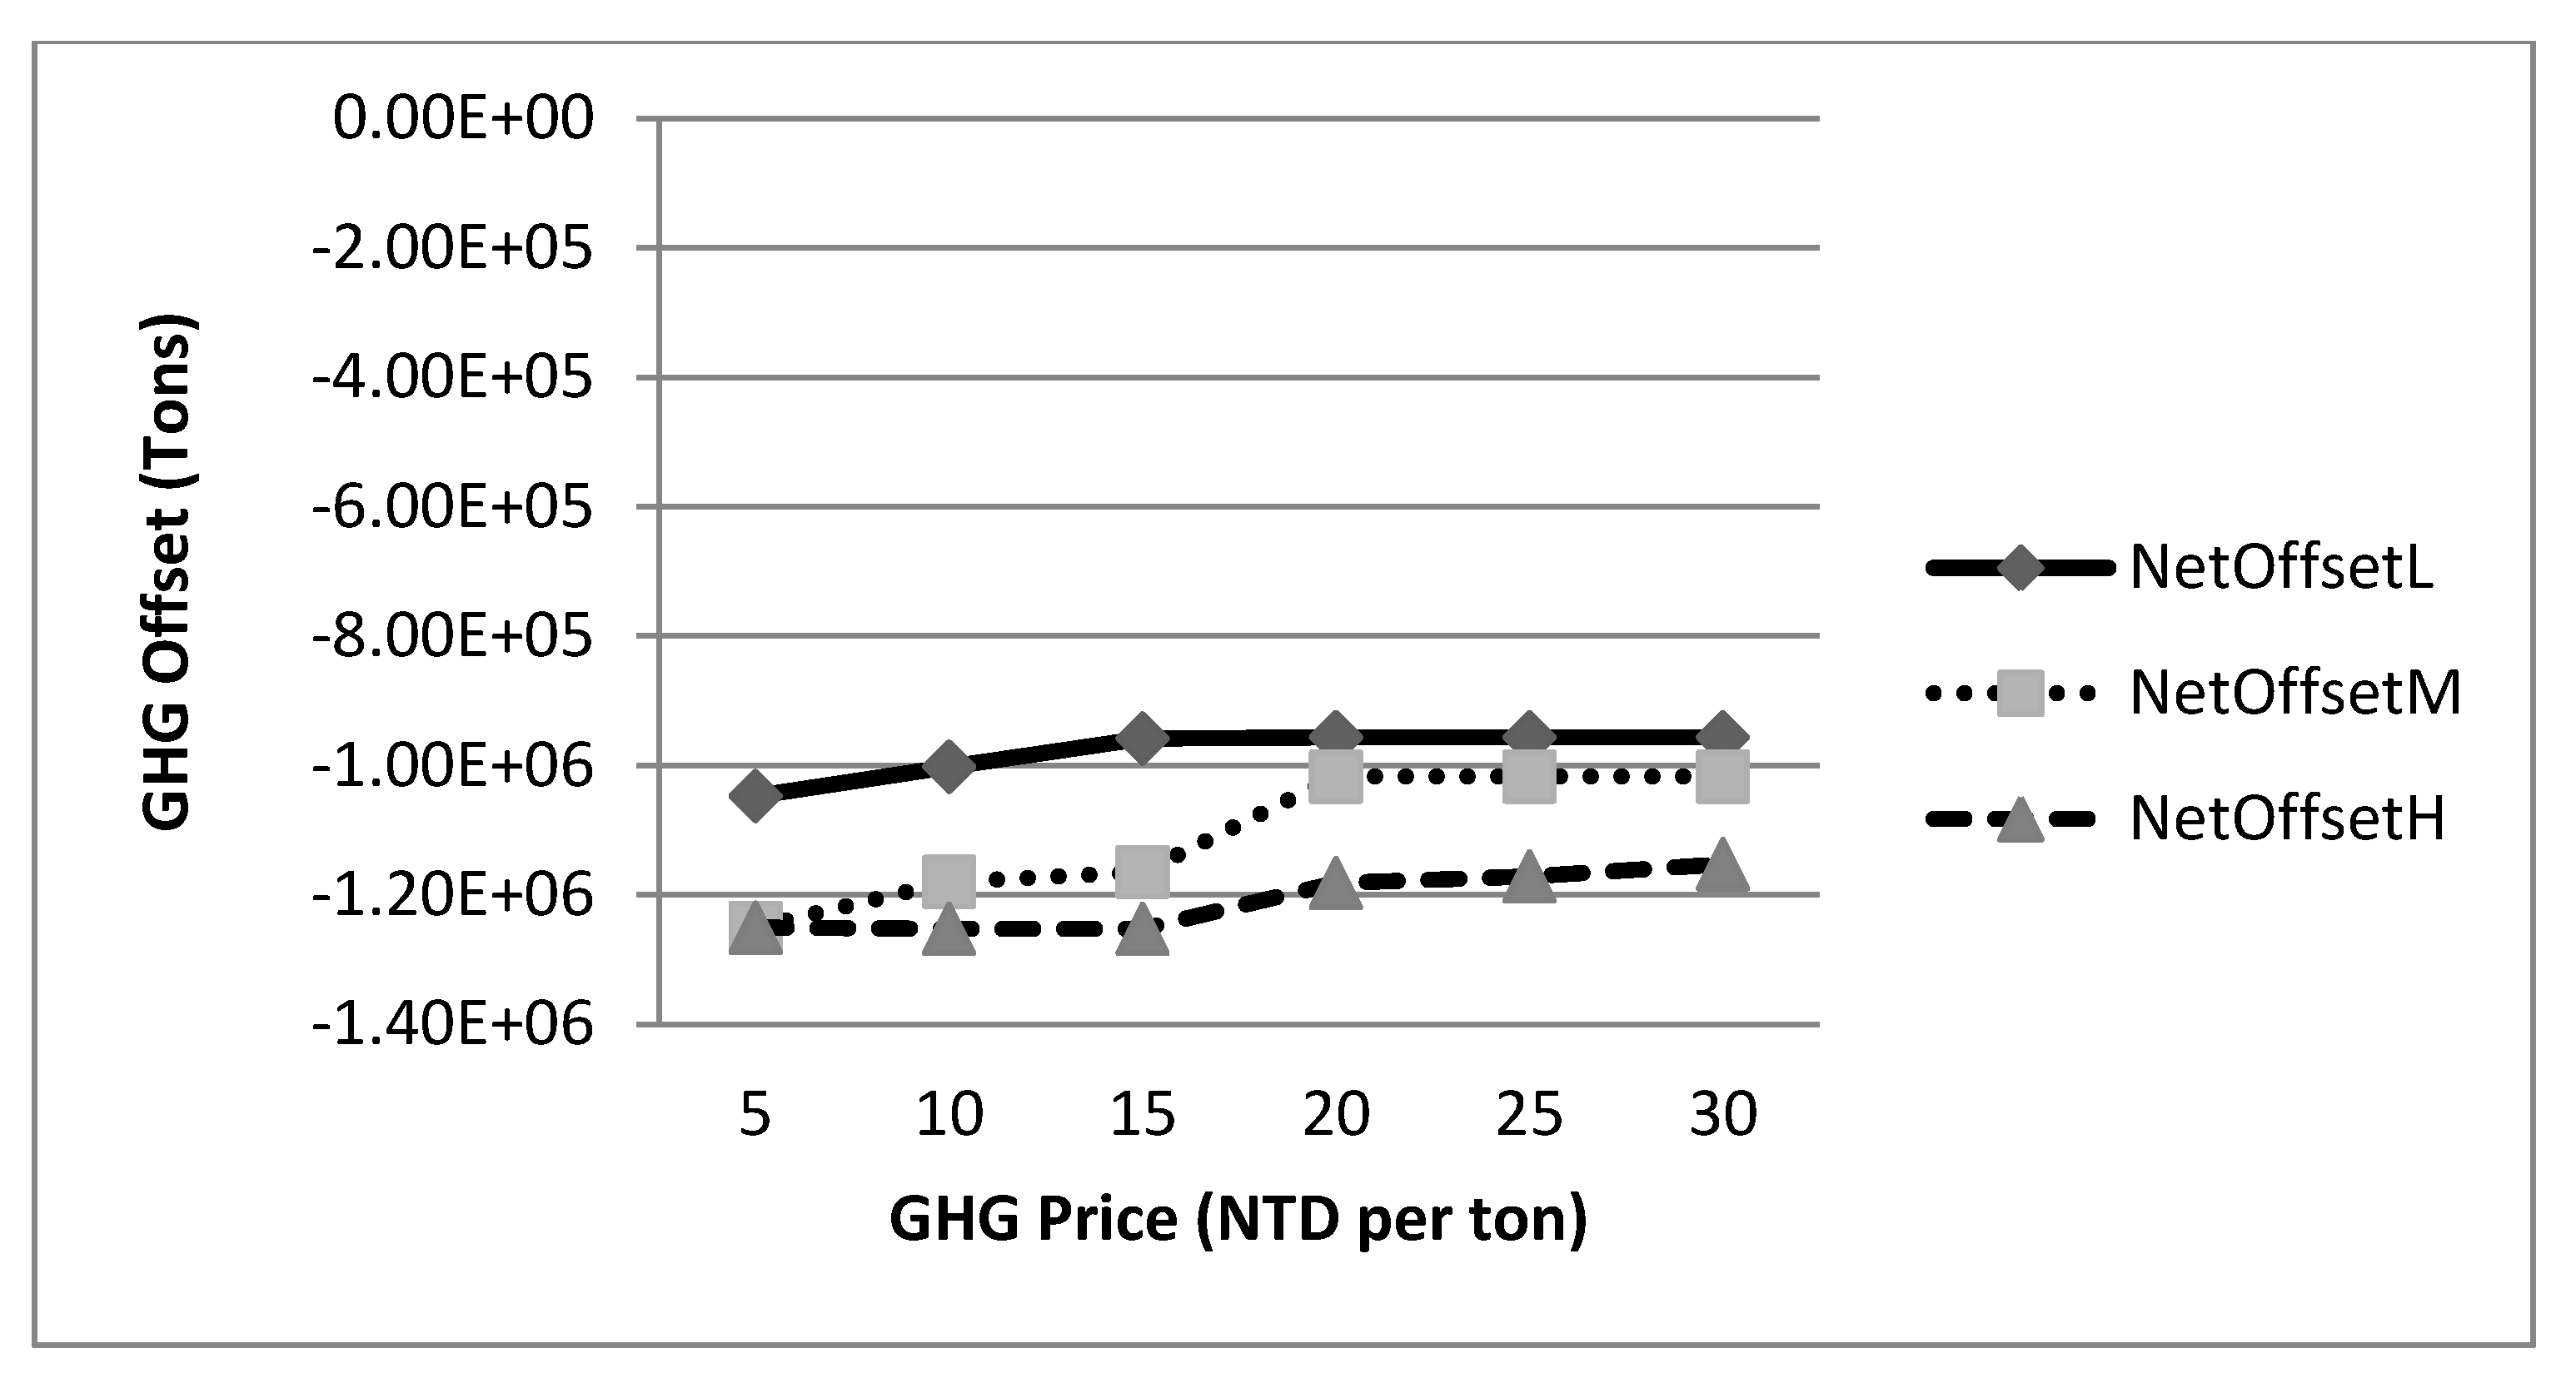
- When Taiwan tries to develop a GHG emissions trading mechanism, effects of the trading system on domestic renewable energy production must be incorporated. As the study shows, bioenergy production is heavily impacted by GHG prices. Therefore, under a marketable GHG emissions trading system, effectiveness of energy security enhancement from bioenergy must be validated;
- (b)
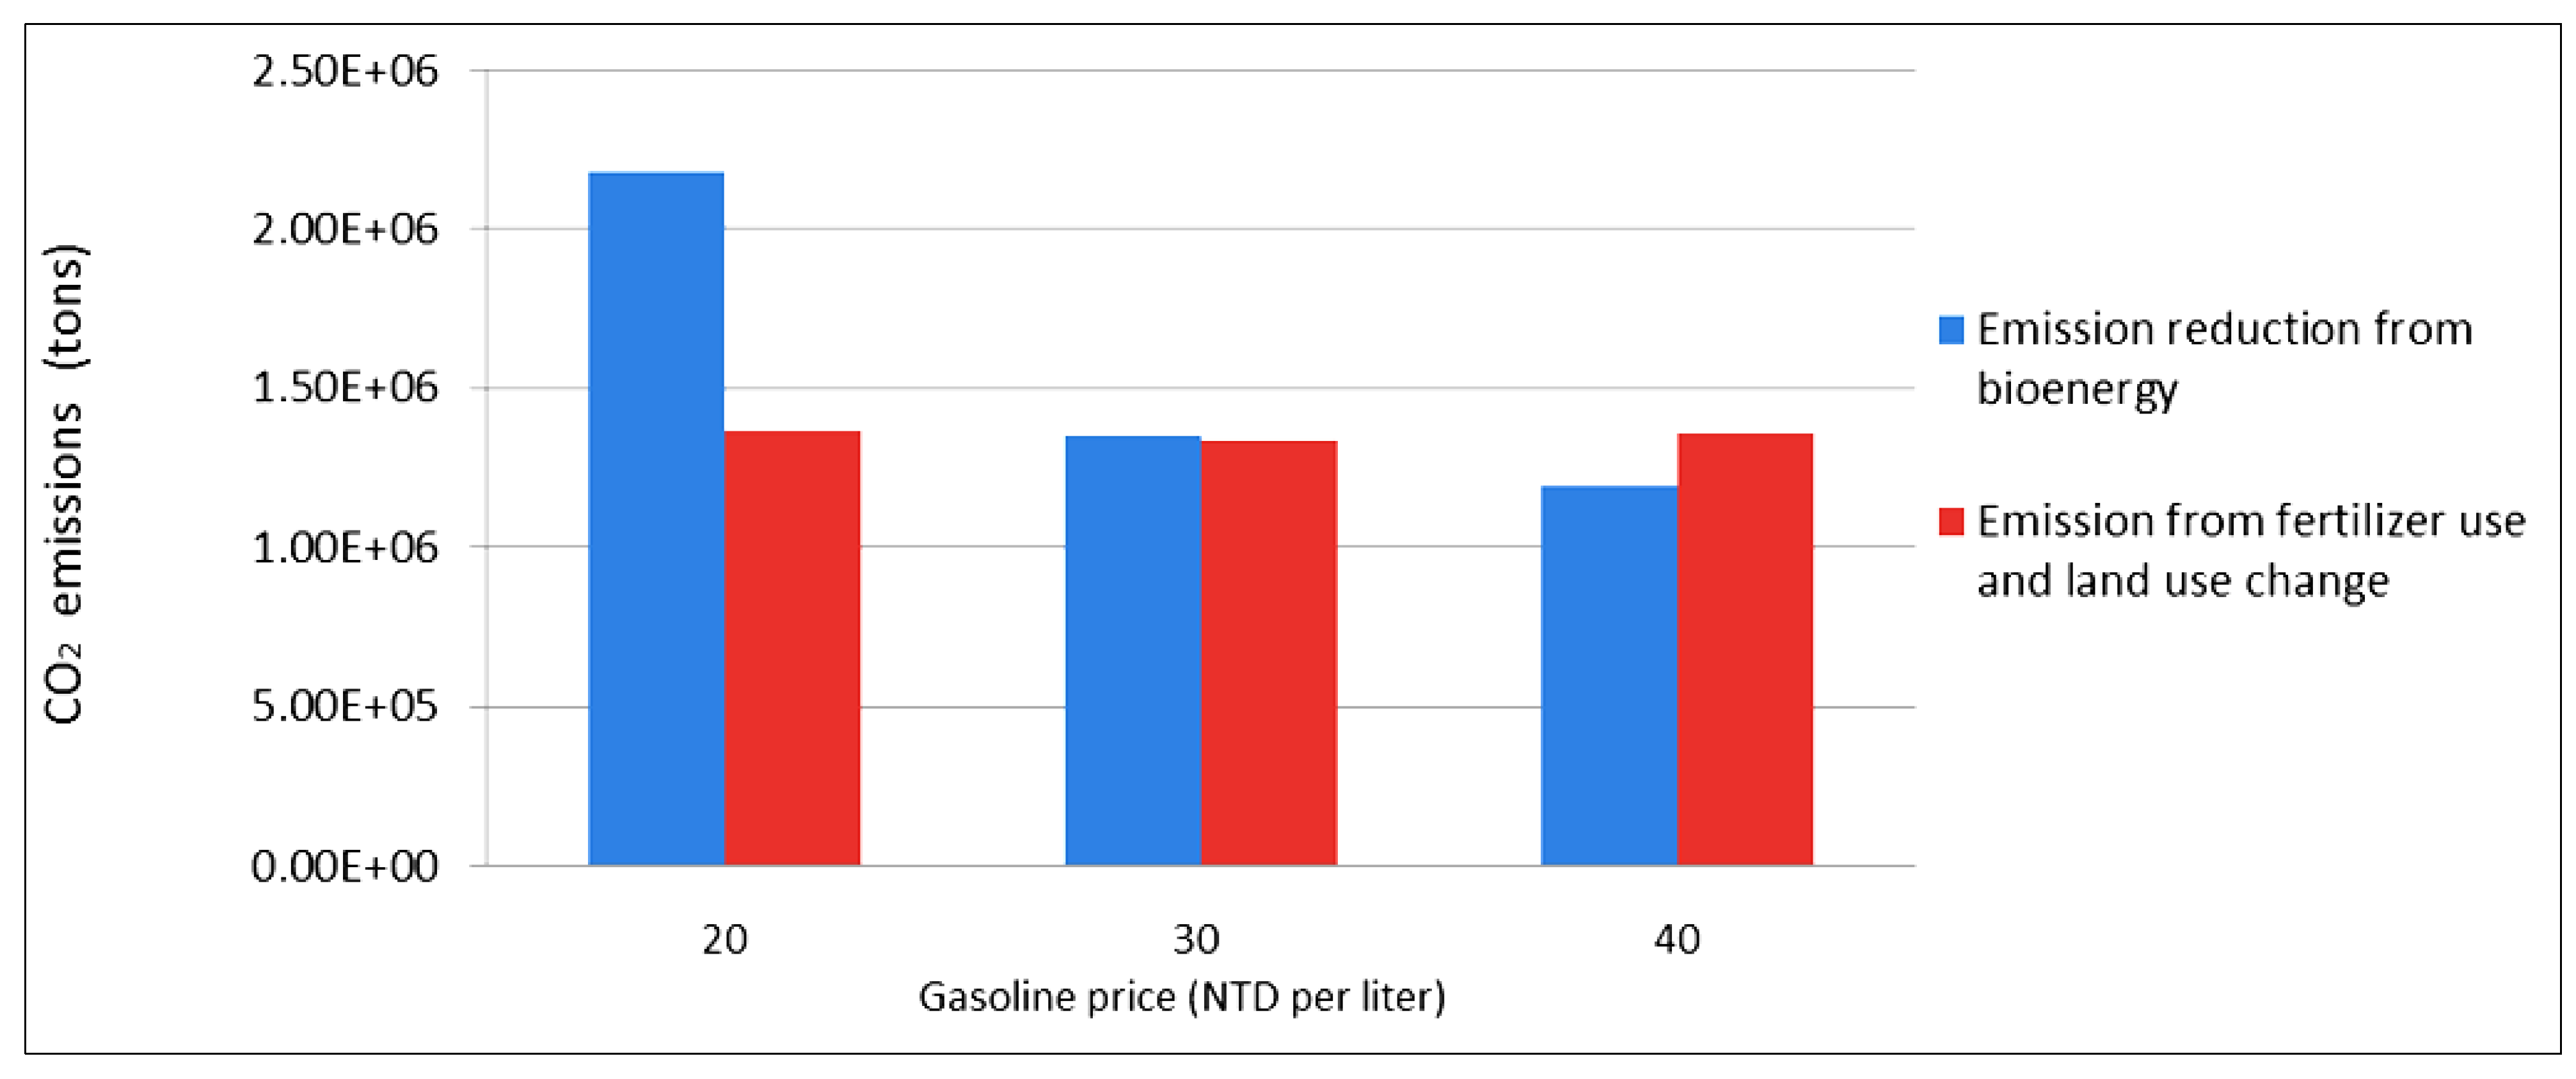
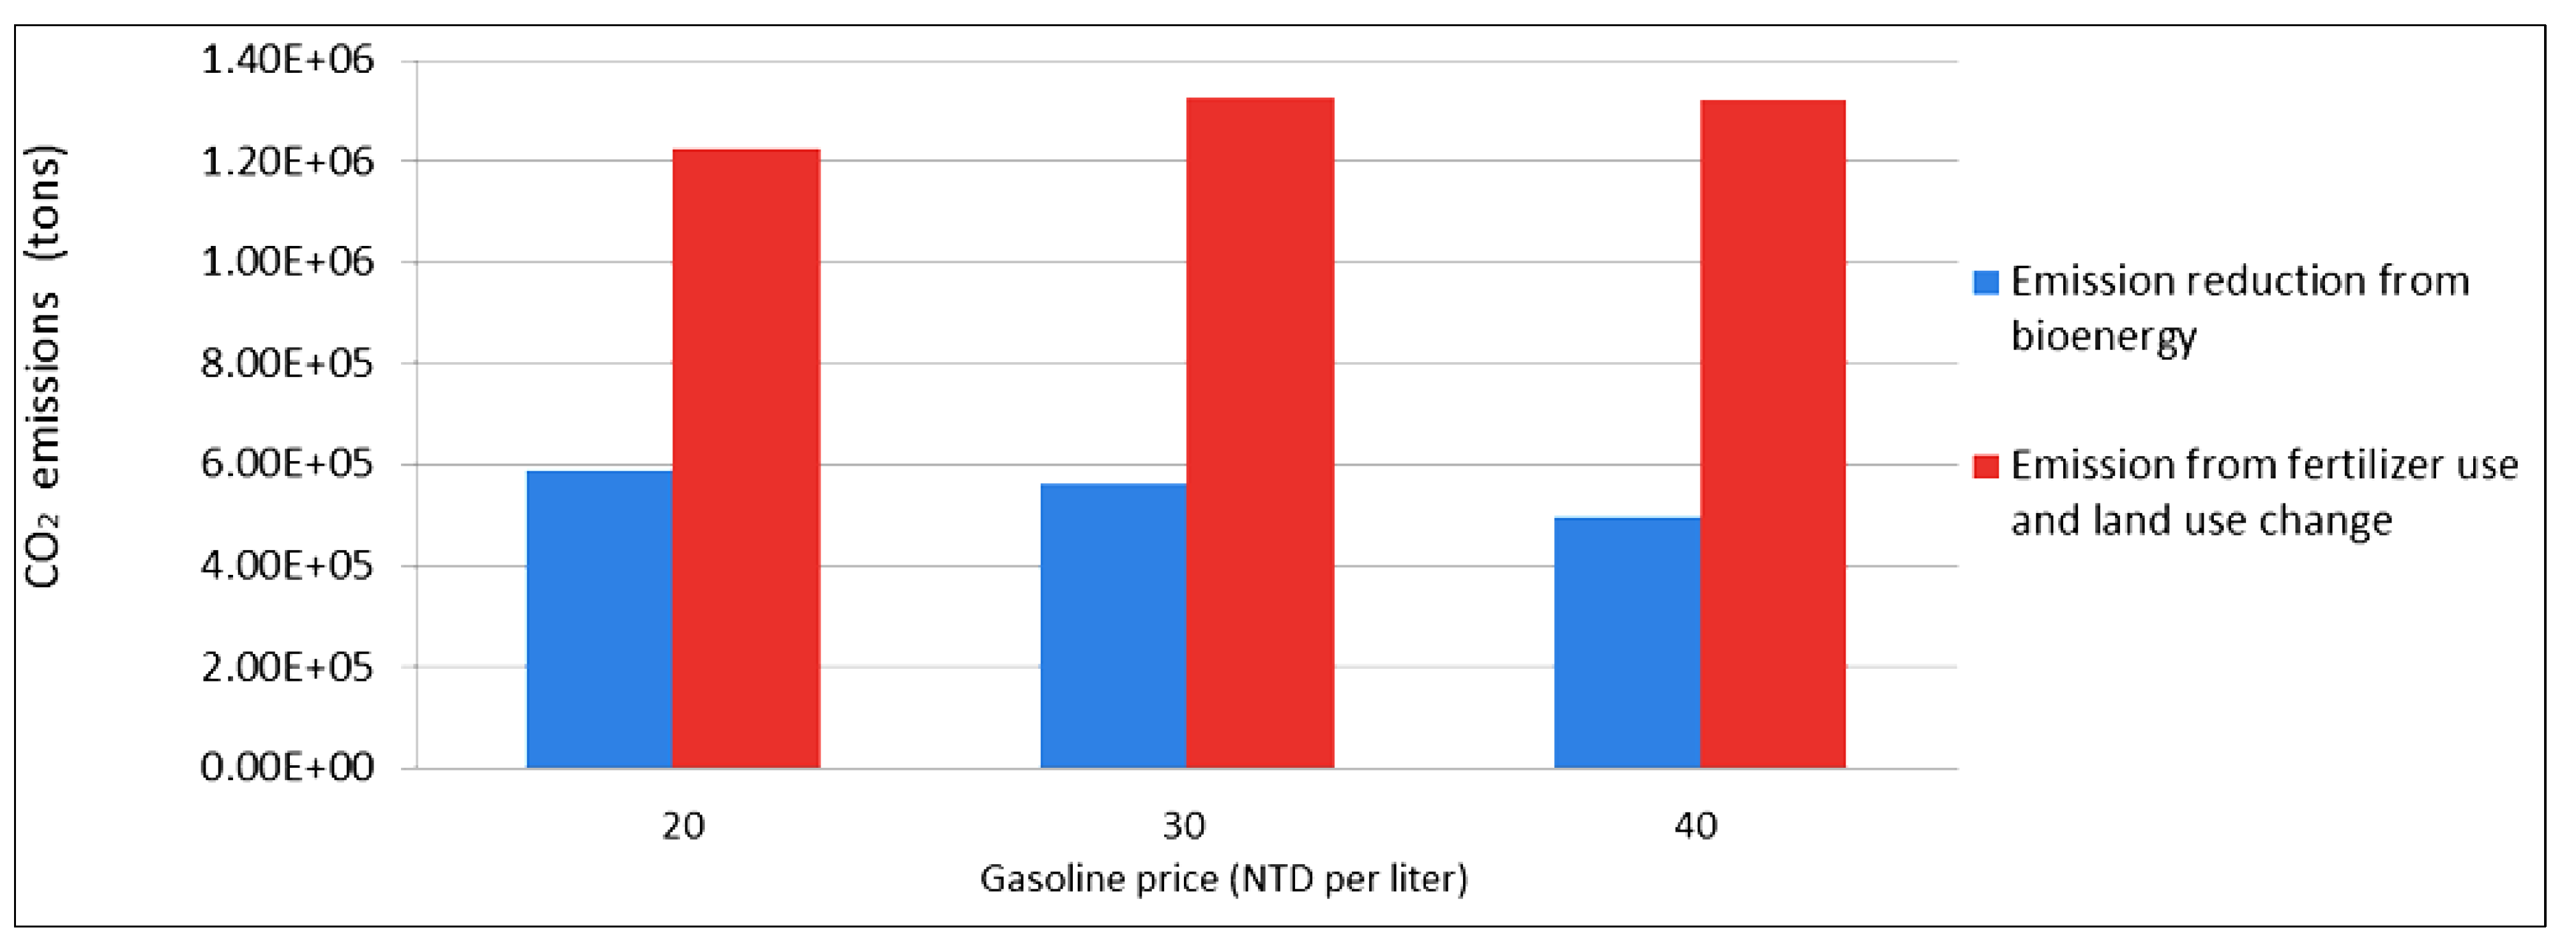
- Development of the bioenergy industry requires long term planning. The simulation result indicates that Taiwan can enhance energy security from bioenergy production at a cost of higher emissions. However, under low energy prices, less set-aside land will be converted into the energy crop plantation and results in a net emissions offset. Bioenergy production will shrink under this situation. Therefore, in order to ensure energy security enhancement when the energy price is low, some government subsidies may be required for farmers to convert set-aside land into energy crop plantations;
- (c)
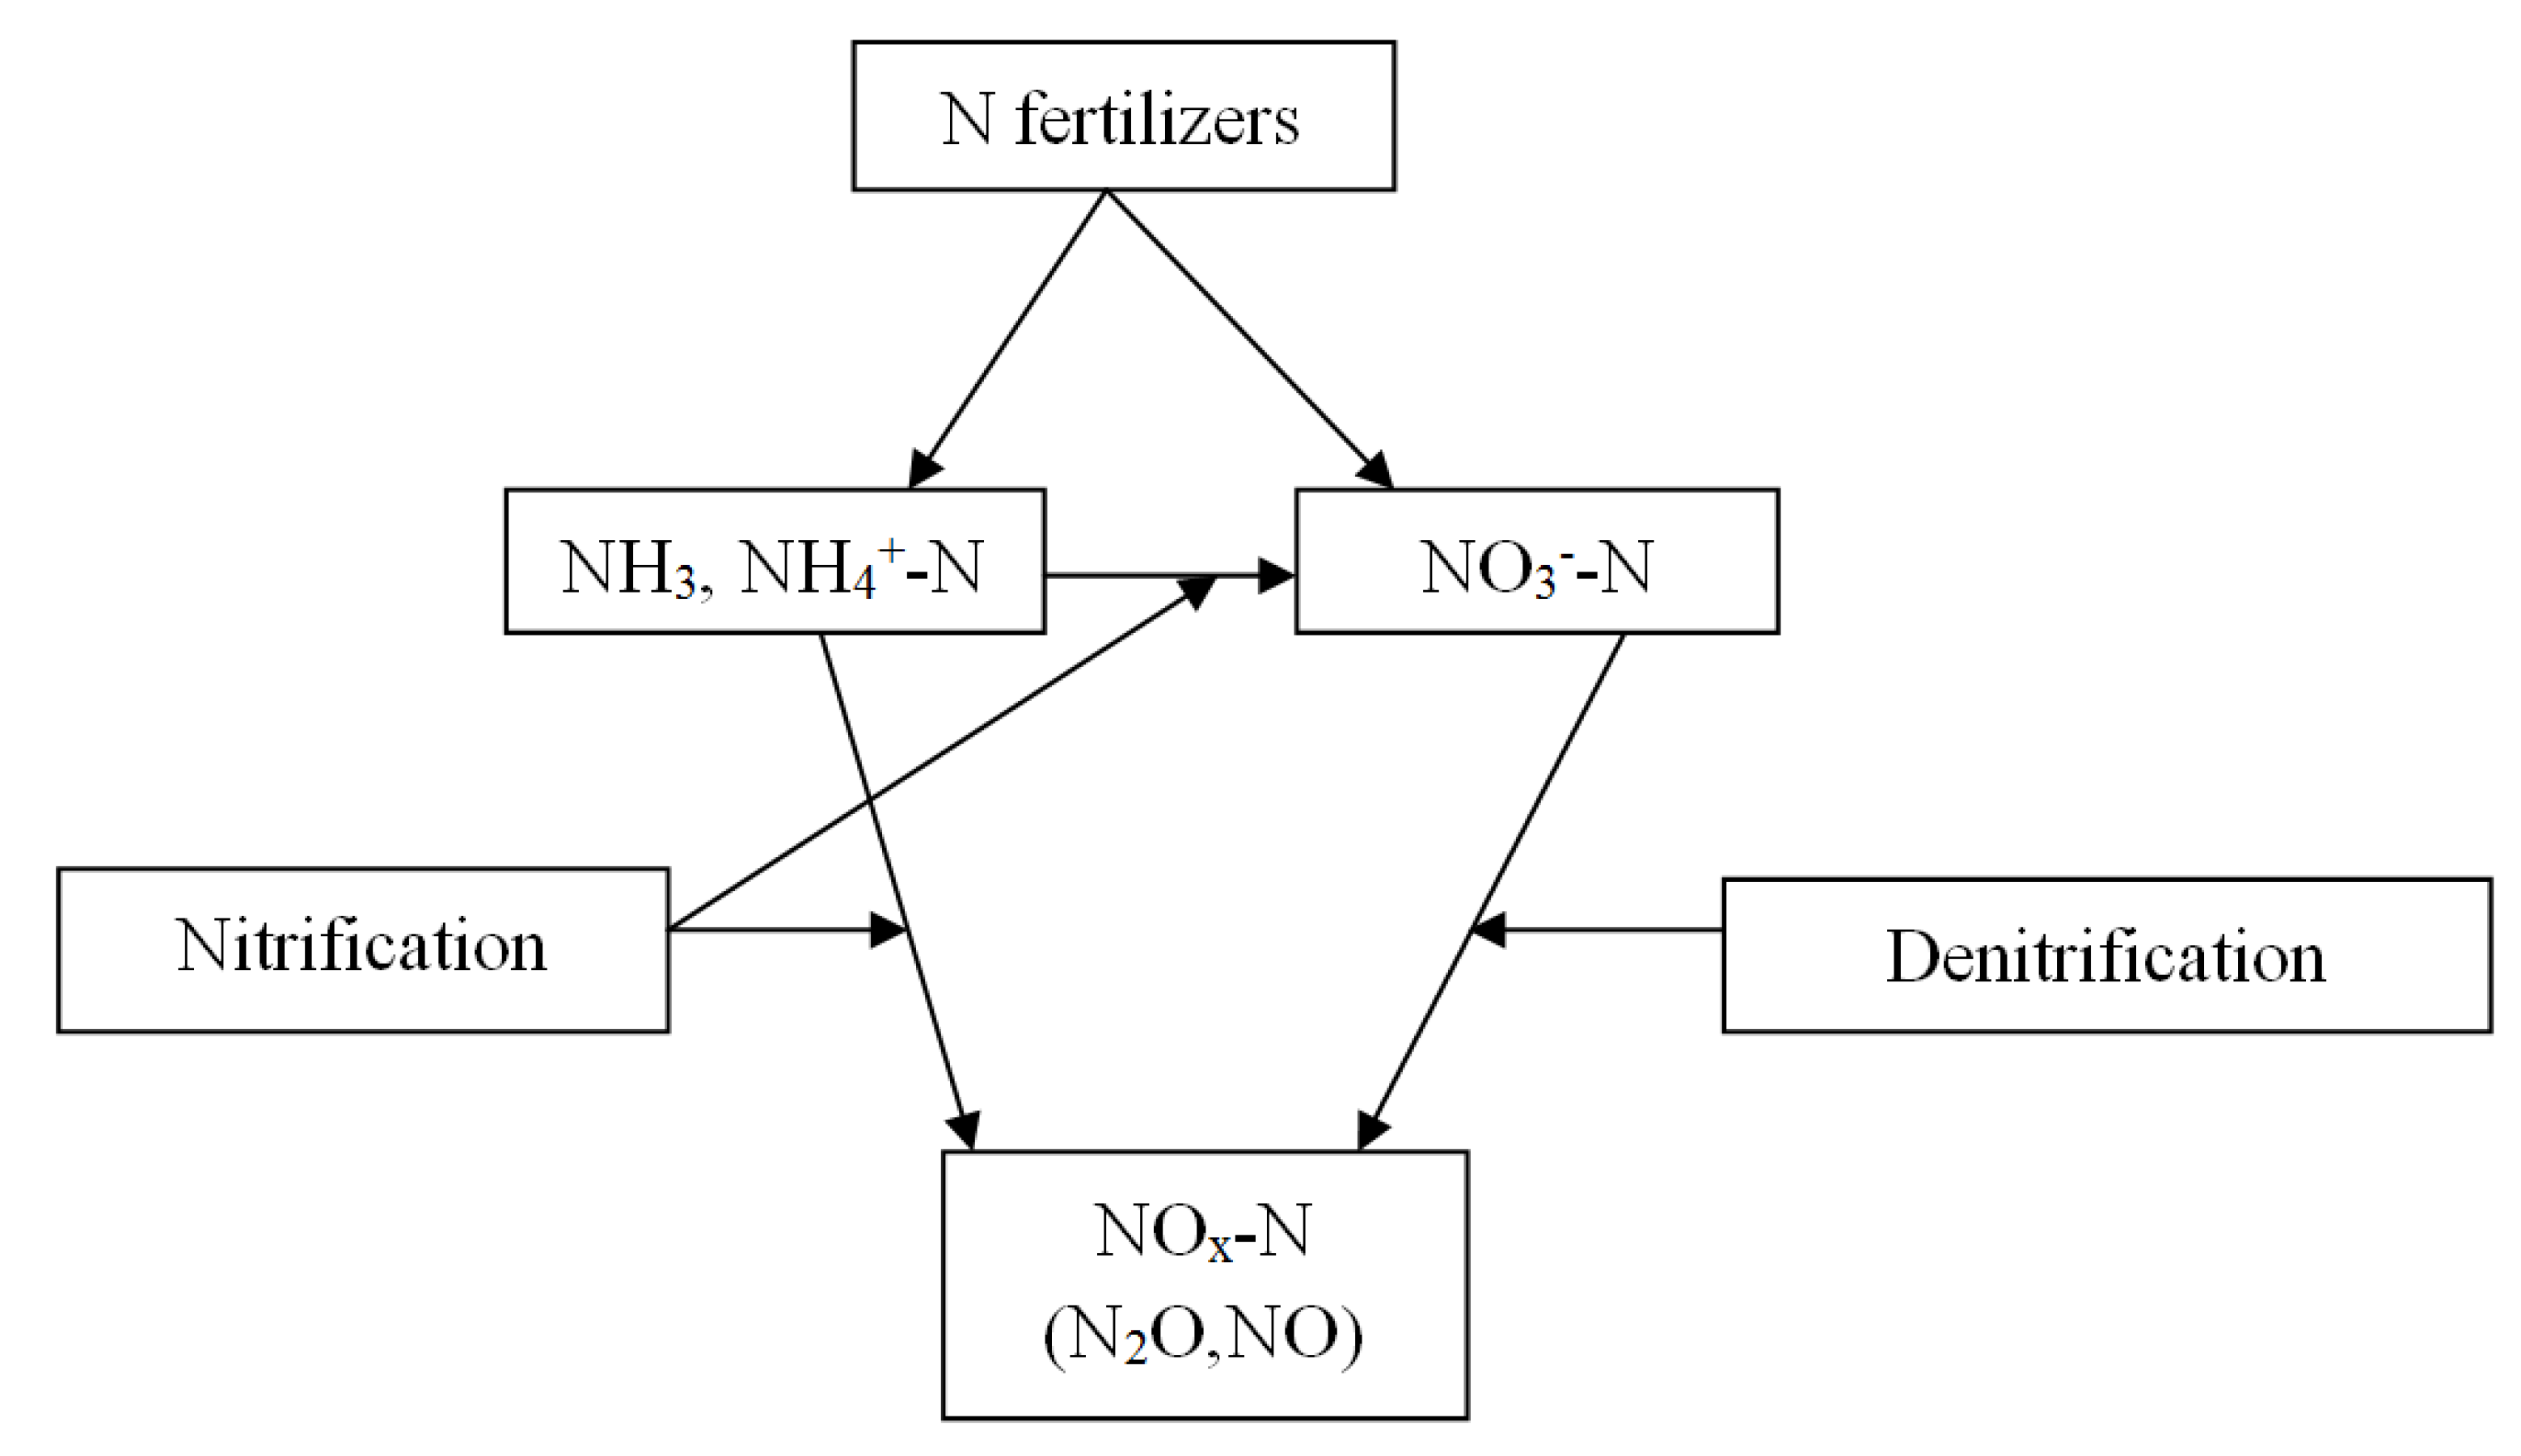
- This study shows that GHG emissions from fertilizer use and land use change are significant and have important impacts on both bioenergy production and net GHG emissions offset. Therefore, a proper estimation of these emission rates is required. The study examines the bioenergy production and GHG effects on Taiwan’s set-aside land, located in the four major areas in Taiwan. Due to local soil and weather conditions, NOx emission rates from land use change and fertilizer application should not be the same in these areas and future studies must be conducted in order to draw a more realistic picture;
- (d)
- Although energy security is the prior concern on Taiwan’s bioenergy development, it may not always be so. As Taiwan is facing direct challenges from global climate shifts, GHG mitigation is another important issue that the Taiwanese must address. Bioenergy is one possible way to increase domestic energy supply, but it may not be an appropriate method for GHG emissions offset, especially for the significant effects from fertilizer and land use change emissions. As the result shows, Taiwan is not able to achieve the maximal bioenergy production and GHG emissions offset at the same time. The Taiwanese government must take this into account for future policy decisions;
- (e)
- Not all set-aside land can be used for bioenergy production. Joining the WTO releases some agricultural land but the Taiwanese government has been trying to utilize the idle land for other economic purposes including development of recreation sites and high economic value commodities. Therefore, using all set-aside land in bioenergy production may not be feasible. Further adjustments combining all existing and potential agricultural and associated policies may be required.
6. Conclusions
Limitations
Acknowledgments
References
- Chen, C.C.; McCarl, B.A.; Chang, C.C.; Tso, C. Evaluation the potential economic impacts of Taiwanese biomass energy production. Biomass Bioenergy 2011, 35, 1693–1701. [Google Scholar] [CrossRef]
- Intergovernmental Panel on Climate Change (IPCC). Guidelines for National Greenhouse Gas Inventories; Cambridge University Press: Cambridge, UK, 2007. [Google Scholar]
- Carbon Dioxide Information Analysis Center (CDIAC). List of Countries by Carbon Dioxide Emissions; Annual Report; United States Department of Energy: Washington, DC, USA, 2008. [Google Scholar]
- Turner, D.P.; Lee, J.L.; Koerper, G.J.; Barker, J.R. The forest sector carbon budget of the United States: Carbon pools and flux under alternative policy options. Environ. Res. 1993, 8, 27–39. [Google Scholar]
- Kung, C.C.; McCarl, B.A.; Cao, X.Y. Environmental impact and bioenergy production from pyrolysis in Taiwan. Energy Policy 2013, 60, 317–323. [Google Scholar] [CrossRef]
- Kung, C.C.; McCarl, B.A.; Cao, X.Y.; Xie, H.L. Bioenergy prospects in Taiwan using set—aside land-an economic evaluation. China Agr. Econ. Rev. 2013, 5, 489–511. [Google Scholar]
- Wang, M.; Saricks, C.; Santini, D. Effects of Fuel Ethanol Use on Fuel-Cycle Energy and Greenhouse Gas Emissions; Report No. ANL/ESD-38; Center for Transportation Research, Argonne National Laboratory: Argonne, IL, USA, 1999. [Google Scholar]
- Wang, M.; Han, J.; Dunn, J.B.; Cai, H.; Elgowainy, A. Well-to-wheels energy use and greenhouse gas emissions of ethanol from corn, sugarcane and cellulosic biomass for us use. Environ. Res. Lett. 2012, 7, 045905. [Google Scholar] [CrossRef]
- Searchinger, T.; Heimlich, R.; Houghton, R.A.; Dong, F.; Elobeid, A.; Fabiosa, J.; Tokgoz, S.; Hayes, D.; Yu, T.-H. Use of U.S. croplands for biofuels increases greenhouse gases through emissions from land-use change. Science 2008, 319, 1238–1240. [Google Scholar] [CrossRef]
- Liu, H.; Zhao, P.; Lu, P.; Wang, Y.S.; Lin, Y.B.; Rao, X.Q. Greenhouse gases fluxes from soils of different land-use types in a hilly area of south China. Agr. Ecosyst. Environ. 2007, 124, 125–135. [Google Scholar]
- Grover, S.P.P.; Liverley, S.J.; Hutley, I.B.; Jamali, H.; Fest, B.; Beringer, J.; Butterbach-Bahl, K.; Arndt, S.K. Land use change and the impact on greenhouse gas exchange in north Australian savanna soils. Biogeosciences 2012, 9, 423–437. [Google Scholar] [CrossRef]
- Snyder, C.S.; Bruulsema, T.W.; Jensen, T.L.; Fixen, P.E. Review of greenhouse gas emissions from crop production systems and fertilizer management effects. Agr. Ecosyst. Environ. 2009, 133, 247–266. [Google Scholar] [CrossRef]
- Lehmann, J. A Handful of carbon. Nature 2007, 447, 143–144. [Google Scholar] [CrossRef]
- Lehmann, J.; Gaunt, J.; Rondon, M. Biochar sequestration in terrestrial ecosystems—a review. Mitig. Adapt. Strat. Gl. 2006, 11, 403–427. [Google Scholar]
- Kung, C.C. Economics of Taiwanese Biochar Production, Utilization and GHG Offsets: A Case Study on Taiwanese Rice Fields. Ph.D. Thesis, Texas A&M University, College Station, Texas, TX, USA, 2010. [Google Scholar]
- McCarl, B.A.; Peacocke, C.; Chrisman, R.; Kung, C.C.; Ronald, D. Economics of biochar production, utilization, and GHG offsets. In Biochar for Environmental Management: Science and Technology; Lehmann, J., Joseph, S., Eds.; Earthscan Publisher: London, UK, 2009; pp. 341–357. [Google Scholar]
- Deluca, T.H.; MacKenzie, M.D.; Gundale, M.J. Biochar effects on soil nutrient transformations. In Biochar for Environmental Management: Science and Technology; Lehmann, J., Joseph, S., Eds.; Earthscan Publisher: London, UK, 2009; pp. 137–182. [Google Scholar]
- Chan, K.Y.; Zwieten, L.; Meszaros, I.; Downie, A.; Joseph, S. Agronomic values of green waste biochar as a soil amendment. Aust. J. Soil. Res. 2007, 45, 629–634. [Google Scholar] [CrossRef]
- Wang, M. Well-to-wheels Energy and Greenhouse Gas Emission Results of Fuel Ethanol; Working paper; Argonne National Laboratory: Lemont, IL, USA, 2007. [Google Scholar]
- Baggs, E.M.; Stevenson, M.; Pihlatie, M.; Regar, A.; Cook, H.; Cadisch, G. Nitrous oxide emissions following application of residues and fertilizer under zero and conventional tillage. Plant Soil 2003, 254, 361–370. [Google Scholar]
- Baldos, U.L.C. A sensitivity analysis of the lifecycle and global land use change greenhouse gas emissions of U.S. corn ethanol fuel. Master thesis, Purdue University, West Lafayette, IN, USA, 2009. [Google Scholar]
- Schaufler, G.; Kitzler, B.; Schindlbacher, A.; Skiba, U.; Sutton, M.A.; Zechmeister-Boltenstern, S. Greenhouse gas emissions from European soils under differ rent land use: effects of soil moisture and temperature. Eur. J. Soil. Sci. 2010, 61, 683–696. [Google Scholar] [CrossRef]
- Fargione, J.; Hill, J.; Tilman, D.; Polasky, S.; Hawthorne, P. Land clearing and the biofuel carbon debt. Science 2008, 319, 1235–1238. [Google Scholar] [CrossRef]
- Hill, J.; Polaskya, S.; Nelson, E.; Tilman, D.; Huo, H.; Ludwig, L.; Neumann, J.; Zheng, H.; Bonta, D. Climate change and health costs of air emissions from biofuels and gasoline. Pro. Nat. Acad. Sci. USA 2008, 106, 2077–2082. [Google Scholar]
- Kim, H.; Kim, S.; Dale, B.E. Biofuels, land use change, and greenhouse gas emissions: some unexplored variables. Environ. Sci. Tech. 2009, 43, 961–967. [Google Scholar] [CrossRef]
- Timilsina, G.R.; Beghin, J.C.; Van Der Mensbrugghe, D.; Mevel, S. The impacts of biofuels targets on land-use change and food supply: A global CGE assessment. Agr. Econ. 2012, 43, 315–332. [Google Scholar] [CrossRef]
- Kwon, H.Y.; Mueller, S.; Dunn, J.B.; Wander, M.M. Modeling state-level soil carbon emission factors under various scenarios for direct land use change associated with united states biofuel feedstock production. Biomass Bioenergy 2013, 55, 299–310. [Google Scholar] [CrossRef]
- Farquharson, J.; Baldock, J. Concepts in modeling N2O emissions from land use. Plant Soil 2008, 309, 17–167. [Google Scholar]
- Qin, Z.; Zhuang, Q.; Zhu, X. Carbon and nitrogen dynamics in bioenergy ecosystems: 1. Model development, validation and sensitivity analysis. GCB bioenergy 2013. [Google Scholar] [CrossRef]
- Qin, Z.; Zhuang, Q.; Zhu, X. Carbon and nitrogen dynamics in bioenergy ecosystems: 2. Potential greenhouse gas emissions and global warming intensity in the Conterminous United States. In GCB Bioenergy; 2013. [Google Scholar]
- Samuelson, P.A. Spatial price equilibrium and linear programming. Am. Econ. Rev. 1950, 42, 283–303. [Google Scholar]
- Takayama, T.; Judge, G.G. Spatial and Temporal Price Allocation Models; North-Holland Publishing Co.: Amsterdam, The Netherland, 1971. [Google Scholar]
- McCarl, B.A.; Spreen, T.H. Price endogenous mathematical programming as a tool for sector analysis. Am. J. Agr. Econ. 1980, 62, 87–102. [Google Scholar] [CrossRef]
- Chang, C.C.; McCarl, B.A.; Mjedle, J.; and Richardson, J.W. Sectorial implications of farm program modifications. Am. J. Agr. Econ. 1992, 74, 38–49. [Google Scholar] [CrossRef]
- Adams, D.M.; Hamilton, S.A.; McCarl, B.A. The benefits of air pollution control: The case of the ozone and U.S. agriculture. Am. J. Agr. Econ. 1986, 68, 886–894. [Google Scholar] [CrossRef]
- McCarl, B.A.; Keplinger, K.O.; Dillon, C.R.; Williams, R.L. Limiting pumping from the edwards aquifer: An economic investigation of proposals, water markets and springflow guarantees. Water Resour. Res. 1999, 35, 1257–1268. [Google Scholar] [CrossRef]
- Reilly, J.M.; Tubiello, F.; McCarl, B.A.; Abler, D.; Darwin, R.; Fuglie, K.; Hollinger, S.;Izaurralde, C.; Jagtap, S.; Jones, J.; et al. U.S. Agriculture and climate change: New results. Clim. Change 2002, 57, 43–69. [Google Scholar]
- McCarl, B.A.; Schneider, U.A. U.S. Agriculture’s role in a greenhouse gas emission mitigation world: An economic perspective. Rev. Agr. Econ. 2000, 22, 134–159. [Google Scholar]
- Chang, C.C.; Eddleman, B.R.; McCarl, B.A. Potential benefits of rice variety and water management improvements in the Texas gulf coast. J. Agr. Resource Econ. 1991, 16, 185–193. [Google Scholar]
- Coble, K.H.; Chang, C.C.; McCarl, B.A.; Eddleman, B.R. Assessing economic implications of new technology: The case of cornstarch-based biodegradable plastics. Rev. Agr. Econ. 1992, 14, 33–43. [Google Scholar] [CrossRef]
- Chen, C.C.; Chang, C.C. The impact of weather on crop yield distribution in Taiwan: Some new evidence from panel data models and implications for crop insurance. J. Agr. Econ. 2005, 33, 503–511. [Google Scholar] [CrossRef]
- Burton, R.O.; Martin, M.A. Restrictions on herbicide use: An analysis of economic impacts on U.S. agriculture. N. Cent. J. Agr. Econ. 1987, 9, 181–194. [Google Scholar]
- Chang, C.C. The potential impacts of climate change on Taiwan’s agriculture. Agr. Econ. 2002, 27, 51–64. [Google Scholar] [CrossRef]
- Chen, C.C.; McCarl, B.A.; Chang, C.C.; Tso, C. Evaluation the potential economic impacts of Taiwanese biomass energy production. Biomass Bioenergy 2011, 35, 1693–1701. [Google Scholar] [CrossRef]
- McCarl, B.A. Food, Biofuel, Global agriculture, and environment: Discussion. Rev. Agr. Econ. 2008, 30, 530–532. [Google Scholar] [CrossRef]
- McCarl, B.A.; Adams, D.M.; Alig, R.J.; Chmelik, J.T. Analysis of biomass fueled electrical power plants: Implications in the agricultural and forestry sectors. Ann. Oper. Res. 2000, 94, 37–55. [Google Scholar] [CrossRef]
Appendix
| Term | Unit | Haul biochar to the cropland as soil amendment | |||||
| Ethanol Price | NT$/liter | 20 | 30 | 40 | 20 | 30 | 40 |
| GHG Price | NT$/ton | 5 | 5 | 5 | 5 | 5 | 5 |
| Electricity Price | NT$/kg | 1.7 | 1.7 | 1.7 | 3.45 | 3.45 | 3.45 |
| Electricity Prod. | 1000kwh | 2,607,800 | 773,500 | 773,500 | 2,519,400 | 2,475,200 | 2,165,800 |
| Electricity Supp. | % | 0.0118 | 0.0035 | 0.0035 | 0.0114 | 0.0112 | 0.0098 |
| Ethanol Prod. | 1000liter | 156,000 | 284,650 | 287,430 | 179,070 | 202,828 | 217,112 |
| Total Planted Ha | 1000 Ha | 113.5 | 113.5 | 113.73 | 105.59 | 114.14 | 113.73 |
| CO2 Emission Reduction | Tons | 603,841 | 216,557 | 201,581 | 587,067 | 564,761 | 498,605 |
| Emissions (FU & LUC) | Tons | 1,318,870 | 1,318,870 | 1,321,543 | 1,226,956 | 1,326,307 | 1,321,543 |
| Net offset | Tons | −715,029 | −1,102,313 | −1,119,962 | −639,889 | −761,546 | −822,938 |
| Ethanol Price | NT$/liter | 20 | 30 | 40 | 20 | 30 | 40 |
| GHG Price | NT$/ton | 10 | 10 | 10 | 10 | 10 | 10 |
| Electricity Price | NT$/kg | 1.7 | 1.7 | 1.7 | 3.45 | 3.45 | 3.45 |
| Electricity Prod. | 1000kwh | 3,291,299 | 1,657,000 | 773,500 | 2,041,242 | 3,270,318 | 2,652,000 |
| Electricity Supp. | % | 0.0149 | 0.0075 | 0.0035 | 0.0092 | 0.0148 | 0.0120 |
| Ethanol Prod. | 1000liter | 156,000 | 236,901 | 282,260 | 156,000 | 156,000 | 187,384 |
| Total Planted Ha | 1000 Ha | 114.34 | 113.84 | 114.07 | 114.36 | 106.57 | 114.07 |
| CO2 Emission Reduction | Tons | 780,618 | 431,894 | 243,388 | 1,076,035 | 776,024 | 644,134 |
| Emissions (FU & LUC) | Tons | 1,328,631 | 1,322,821 | 1,325,493 | 1,328,863 | 1,238,343 | 1,325,493 |
| Net offset | Tons | −548,013 | −890,927 | −1,082,105 | −252,828 | −462,319 | −681,359 |
| Ethanol Price | NT$/liter | 20 | 30 | 40 | 20 | 30 | 40 |
| GHG Price | NT$/ton | 15 | 15 | 15 | 15 | 15 | 15 |
| Electricity Price | NT$/kg | 1.7 | 1.7 | 1.7 | 3.45 | 3.45 | 3.45 |
| Electricity Prod. | 1000kwh | 1,740,322 | 1,743,157 | 1,748,897 | 1,740,847 | 1,745,286 | 3,274,577 |
| Electricity Supp. | % | 0.0079 | 0.0079 | 0.0079 | 0.0079 | 0.0079 | 0.0148 |
| Ethanol Prod. | 1000liter | 156,000 | 156,000 | 156,000 | 156,000 | 156,000 | 156,000 |
| Total Planted Ha | 1000 Ha | 115.06 | 114.85 | 115.15 | 114.97 | 115.05 | 106.63 |
| CO2 Emission Reduction | Tons | 1,163,300 | 1,165,167 | 1,168,946 | 1,163,646 | 1,166,568 | 776,957 |
| Emissions (FU & LUC) | Tons | 1,336,997 | 1,334,557 | 1,338,043 | 1,335,951 | 1,336,881 | 1,239,041 |
| Net offset | Tons | −173,697 | −169,390 | −169,097 | −172,305 | −170,313 | −462,084 |
| Ethanol Price | NT$/liter | 20 | 30 | 40 | 20 | 30 | 40 |
| GHG Price | NT$/ton | 20 | 20 | 20 | 20 | 20 | 20 |
| Electricity Price | NT$/kg | 1.7 | 1.7 | 1.7 | 3.45 | 3.45 | 3.45 |
| Electricity Prod. | 1000kwh | 2,007,884 | 1,732,932 | 1,790,653 | 2,009,107 | 1,745,573 | 1,749,992 |
| Electricity Supp. | % | 0.0091 | 0.0078 | 0.0081 | 0.0091 | 0.0079 | 0.0079 |
| Ethanol Prod. | 1000liter | 130,000 | 156,000 | 156,000 | 130,000 | 156,000 | 156,000 |
| Total Planted Ha | 1000 Ha | 115 | 114.62 | 116.36 | 114.89 | 114.85 | 115.04 |
| CO2 Emission Reduction | Tons | 1,336,551 | 1,158,434 | 1,196,438 | 1,337,356 | 1,166,757 | 1,169,667 |
| Emissions (FU & LUC) | Tons | 1,336,300 | 1,331,884 | 1,352,103 | 1,335,022 | 1,334,557 | 1,336,765 |
| Net offset | Tons | 251 | −173,450 | −155,665 | 2,334 | −167,800 | −167,098 |
| Ethanol Price | NT$/liter | 20 | 30 | 40 | 20 | 30 | 40 |
| GHG Price | NT$/ton | 25 | 25 | 25 | 25 | 25 | 25 |
| Electricity Price | NT$/kg | 1.7 | 1.7 | 1.7 | 3.45 | 3.45 | 3.45 |
| Electricity Prod. | 1000kwh | 3,353,326 | 2,003,550 | 1,743,007 | 3,315,000 | 2,088,495 | 1,752,801 |
| Electricity Supp. | % | 0.0152 | 0.0091 | 0.0079 | 0.0150 | 0.0095 | 0.0079 |
| Ethanol Prod. | 1000liter | 5,200 | 130,000 | 156,000 | 8,861 | 130,000 | 156,000 |
| Total Planted Ha | 1000 Ha | 121.01 | 114.89 | 114.92 | 120.97 | 120.58 | 115.02 |
| CO2 Emission Reduction | Tons | 2,208,412 | 1,333,697 | 1,165,068 | 2,183,588 | 1,389,625 | 1,171,517 |
| Emissions (FU & LUC) | Tons | 1,406,136 | 1,335,022 | 1,335,370 | 1,405,671 | 1,401,140 | 1,336,532 |
| Net offset | Tons | 802,276 | −1,325 | −170,302 | 777,917 | −11,515 | −165,015 |
| Ethanol Price | NT$/liter | 20 | 30 | 40 | 20 | 30 | 40 |
| GHG Price | NT$/ton | 30 | 30 | 30 | 30 | 30 | 30 |
| Electricity Price | NT$/kg | 1.7 | 1.7 | 1.7 | 3.45 | 3.45 | 3.45 |
| Electricity Prod. | 1000kwh | 3353,446 | 2,043,067 | 1,788,248 | 3,308,116 | 2,028,091 | 1,788,649 |
| Electricity Supp. | % | 0.0152 | 0.0092 | 0.0081 | 0.0150 | 0.0092 | 0.0081 |
| Ethanol Prod. | 1000liter | 5,200 | 130,000 | 156,000 | 5,200 | 130,000 | 156,000 |
| Total Planted Ha | 1000 Ha | 121.02 | 116.94 | 117.15 | 117.3 | 115.24 | 117.16 |
| CO2 Emission Reduction | Tons | 2,208,492 | 1,359,715 | 1,194,854 | 2,178,646 | 1,349,855 | 1,195,118 |
| Emissions (FU & LUC) | Tons | 1,406,252 | 1,358,843 | 1,361,283 | 1,363,026 | 1,339,089 | 1,361,399 |
| Net offset | Tons | 802,240 | 872 | −166,429 | 815,620 | 10,766 | −166,281 |
| Term | Unit | Burn biochar at pyrolysis plant to generate electricity | |||||
| Ethanol Price | NT$/liter | 20 | 30 | 40 | 20 | 30 | 40 |
| GHG Price | NT$/ton | 5 | 5 | 5 | 5 | 5 | 5 |
| Electricity Price | NT$/kg | 1.7 | 1.7 | 1.7 | 3.45 | 3.45 | 3.45 |
| Electricity Prod. | 1000kwh | 2,364,700 | 773,500 | 773,500 | 2,475,200 | 2,408,900 | 2,187,900 |
| Electricity Supp. | % | 0.0107 | 0.0035 | 0.0035 | 0.0112 | 0.0109 | 0.0099 |
| Ethanol Prod. | 1000liter | 228,822 | 306,243 | 306,797 | 224,533 | 242,777 | 251,907 |
| Total Planted Ha | 1000 Ha | 111.91 | 117 | 117 | 111.91 | 117 | 117.11 |
| CO2 Emission Reduction | Tons | 253,214 | 108,743 | 108,806 | 263,370 | 259,032 | 238,785 |
| Emissions (FU & LUC) | Tons | 1,300,394 | 1,359,540 | 1,359,540 | 1,300,394 | 1,359,540 | 1,360,818 |
| Net offset | Tons | −1,047,180 | −1,250,797 | −1,250,734 | −1,037,024 | −1,100,508 | −1,122,033 |
| Ethanol Price | NT$/liter | 20 | 30 | 40 | 20 | 30 | 40 |
| GHG Price | NT$/ton | 10 | 10 | 10 | 10 | 10 | 10 |
| Electricity Price | NT$/kg | 1.7 | 1.7 | 1.7 | 3.45 | 3.45 | 3.45 |
| Electricity Prod. | 1000kwh | 2,873,000 | 1,547,000 | 773,500 | 2,762,500 | 2,652,000 | 2,364,700 |
| Electricity Supp. | % | 0.013 | 0.007 | 0.0035 | 0.0125 | 0.012 | 0.0107 |
| Ethanol Prod. | 1000liter | 209,628 | 276,271 | 306,954 | 213,916 | 233,389 | 245,114 |
| Total Planted Ha | 1000 Ha | 112.04 | 117.01 | 117.15 | 112.04 | 117.01 | 117.1 |
| CO2 Emission Reduction | Tons | 299,986 | 179,831 | 108,823 | 289,831 | 281,377 | 255,040 |
| Emissions (FU & LUC) | Tons | 1,301,905 | 1,359,656 | 1,361,283 | 1,301,905 | 1,359,656 | 1,360,702 |
| Net offset | Tons | −1,001,919 | −1,179,825 | −1,252,460 | −1,012,074 | −1,078,279 | −1,105,662 |
| Ethanol Price | NT$/liter | 20 | 30 | 40 | 20 | 30 | 40 |
| GHG Price | NT$/ton | 15 | 15 | 15 | 15 | 15 | 15 |
| Electricity Price | NT$/kg | 1.7 | 1.7 | 1.7 | 3.45 | 3.45 | 3.45 |
| Electricity Prod. | 1000kwh | 3,315,000 | 1,712,750 | 773,500 | 3,094,000 | 2,983,500 | 2,607,800 |
| Electricity Supp. | % | 0.015 | 0.00775 | 0.0035 | 0.014 | 0.0135 | 0.0118 |
| Ethanol Prod. | 1000liter | 192,163 | 269,840 | 306,954 | 201,321 | 220,524 | 235,769 |
| Total Planted Ha | 1000 Ha | 111.77 | 117.01 | 117.15 | 112.11 | 117.01 | 117.15 |
| CO2 Emission Reduction | Tons | 340,569 | 195,062 | 108,823 | 320,325 | 311,840 | 277,390 |
| Emissions (FU & LUC) | Tons | 1,298,767 | 1,359,656 | 1,361,283 | 1,302,718 | 1,359,656 | 1,361,283 |
| Net offset | Tons | −958,198 | −1,164,594 | −1,252,460 | −982,393 | −1,047,816 | −1,083,893 |
| Ethanol Price | NT$/liter | 20 | 30 | 40 | 20 | 30 | 40 |
| GHG Price | NT$/ton | 20 | 20 | 20 | 20 | 20 | 20 |
| Electricity Price | NT$/kg | 1.7 | 1.7 | 1.7 | 3.45 | 3.45 | 3.45 |
| Electricity Prod. | 1000kwh | 3,315,000 | 3,315,000 | 1,547,000 | 3,315,000 | 3,315,000 | 2,873,000 |
| Electricity Supp. | % | 0.015 | 0.015 | 0.007 | 0.015 | 0.015 | 0.013 |
| Ethanol Prod. | 1000liter | 192,100 | 207,660 | 276,973 | 192,057 | 207,660 | 225,514 |
| Total Planted Ha | 1000 Ha | 111.6 | 117 | 117.16 | 111.59 | 117.01 | 117.16 |
| CO2 Emission Reduction | Tons | 340,562 | 342,305 | 179,910 | 340,557 | 342,305 | 301,765 |
| Emissions (FU & LUC) | Tons | 1,296,792 | 1,359,540 | 1,361,399 | 1,296,676 | 1,359,656 | 1,361,399 |
| Net offset | Tons | −956,230 | −1,017,235 | −1,181,489 | −956,119 | −1,017,351 | −1,059,634 |
| Ethanol Price | NT$/liter | 20 | 30 | 40 | 20 | 30 | 40 |
| GHG Price | NT$/ton | 25 | 25 | 25 | 25 | 25 | 25 |
| Electricity Price | NT$/kg | 1.7 | 1.7 | 1.7 | 3.45 | 3.45 | 3.45 |
| Electricity Prod. | 1000kwh | 3,315,000 | 3,315,000 | 1,657,000 | 3,315,000 | 3,315,000 | 3,315,000 |
| Electricity Supp. | % | 0.0150 | 0.0150 | 0.0075 | 0.0150 | 0.0150 | 0.0150 |
| Ethanol Prod. | 1000liter | 192,140 | 207,660 | 272,685 | 192,098 | 207,660 | 208,361 |
| Total Planted Ha | 1000 Ha | 111.61 | 117 | 117.16 | 111.6 | 117.01 | 117.16 |
| CO2 Emission Reduction | Tons | 340,567 | 342,305 | 190,064 | 340,562 | 342,305 | 342,383 |
| Emissions (FU & LUC) | Tons | 1,296,908 | 1,359,540 | 1,361,399 | 1,296,792 | 1,359,656 | 1,361,399 |
| Net offset | Tons | −956,341 | −1,017,235 | −1,171,335 | −956,230 | −1,017,351 | −1,019,016 |
| Ethanol Price | NT$/liter | 20 | 30 | 40 | 20 | 30 | 40 |
| GHG Price | NT$/ton | 30 | 30 | 30 | 30 | 30 | 30 |
| Electricity Price | NT$/kg | 1.7 | 1.7 | 1.7 | 3.45 | 3.45 | 3.45 |
| Electricity Prod. | 1000kwh | 3,315,000 | 3,315,000 | 1,856,400 | 3,315,000 | 3,315,000 | 3,315,000 |
| Electricity Supp. | % | 0.015 | 0.015 | 0.0084 | 0.015 | 0.015 | 0.015 |
| Ethanol Prod. | 1000liter | 192,096 | 207,660 | 264,866 | 192,097 | 207,660 | 208,261 |
| Total Planted Ha | 1000 Ha | 111.6 | 117 | 117.11 | 111.6 | 117.01 | 117.11 |
| CO2 Emission Reduction | Tons | 340,562 | 342,305 | 208,331 | 340,562 | 342,305 | 342,372 |
| Emissions (FU & LUC) | Tons | 1,296,792 | 1,359,540 | 1,360,818 | 1,296,792 | 1,359,656 | 1,360,818 |
| Net offset | Tons | −956,230 | −1,017,235 | −1,152,487 | −956,230 | −1,017,351 | −1,018,446 |
© 2014 by the authors; licensee MDPI, Basel, Switzerland. This article is an open access article distributed under the terms and conditions of the Creative Commons Attribution license (http://creativecommons.org/licenses/by/3.0/).
Share and Cite
Kung, C.-C.; Xie, H.; Wu, T.; Chen, S.-C. Biofuel for Energy Security: An Examination on Pyrolysis Systems with Emissions from Fertilizer and Land-Use Change. Sustainability 2014, 6, 571-588. https://doi.org/10.3390/su6020571
Kung C-C, Xie H, Wu T, Chen S-C. Biofuel for Energy Security: An Examination on Pyrolysis Systems with Emissions from Fertilizer and Land-Use Change. Sustainability. 2014; 6(2):571-588. https://doi.org/10.3390/su6020571
Chicago/Turabian StyleKung, Chih-Chun, Hualin Xie, Tao Wu, and Shih-Chih Chen. 2014. "Biofuel for Energy Security: An Examination on Pyrolysis Systems with Emissions from Fertilizer and Land-Use Change" Sustainability 6, no. 2: 571-588. https://doi.org/10.3390/su6020571