Implementation of Brackish Groundwater Desalination Using Wind-Generated Electricity: A Case Study of the Energy-Water Nexus in Texas


Abstract
:1. Introduction

2. Background
2.1. Wind Power

2.2. Desalination

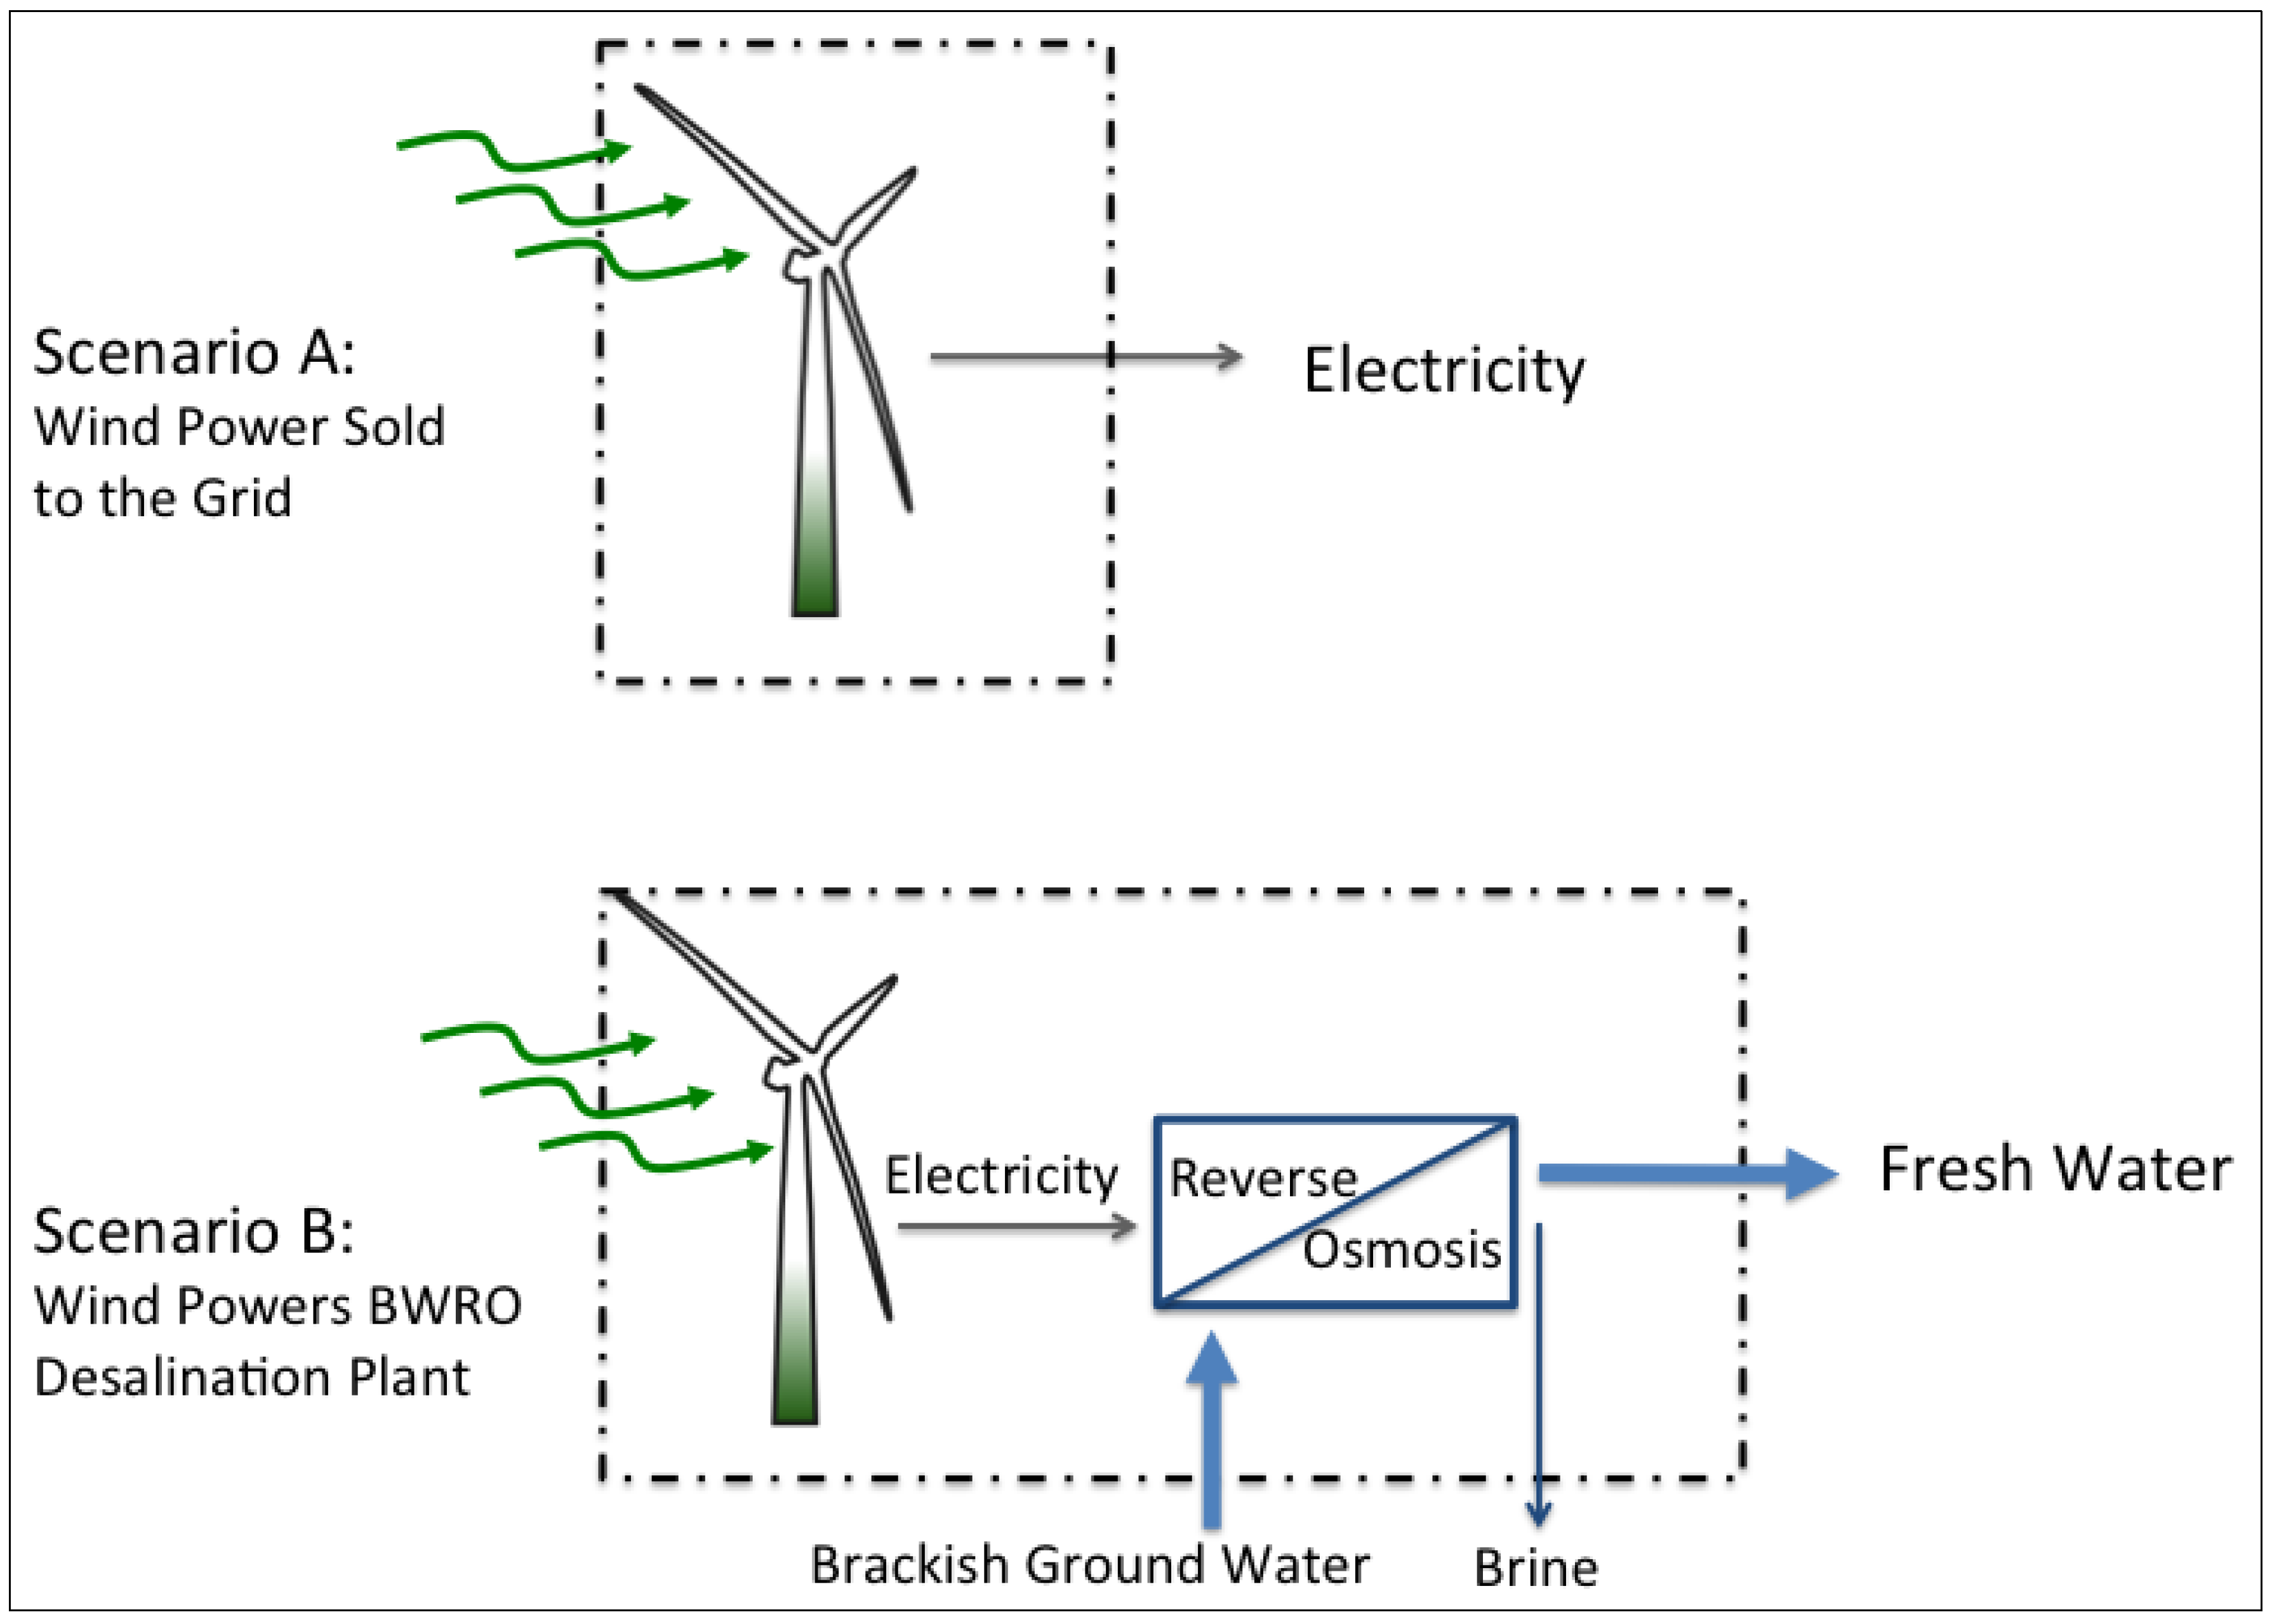
2.3. Integrated Wind and Desalination Technology
3. Methodology
3.1. Energetic Performance Analysis


| Factor | Description | Units | Value |
|---|---|---|---|
| ρ | Density of water | kg/m3 | 1000 |
| g | Acceleration due to gravity | m/s2 | 9.81 |
| ηP | Pump efficiency | - | 0.65 |
| d | Pipe diameter | m | 0.30 |
| f | Friction factor | - | 0.0162 |

| Factor | Project Parameters | Units | Favorable | Average | Unfavorable |
|---|---|---|---|---|---|
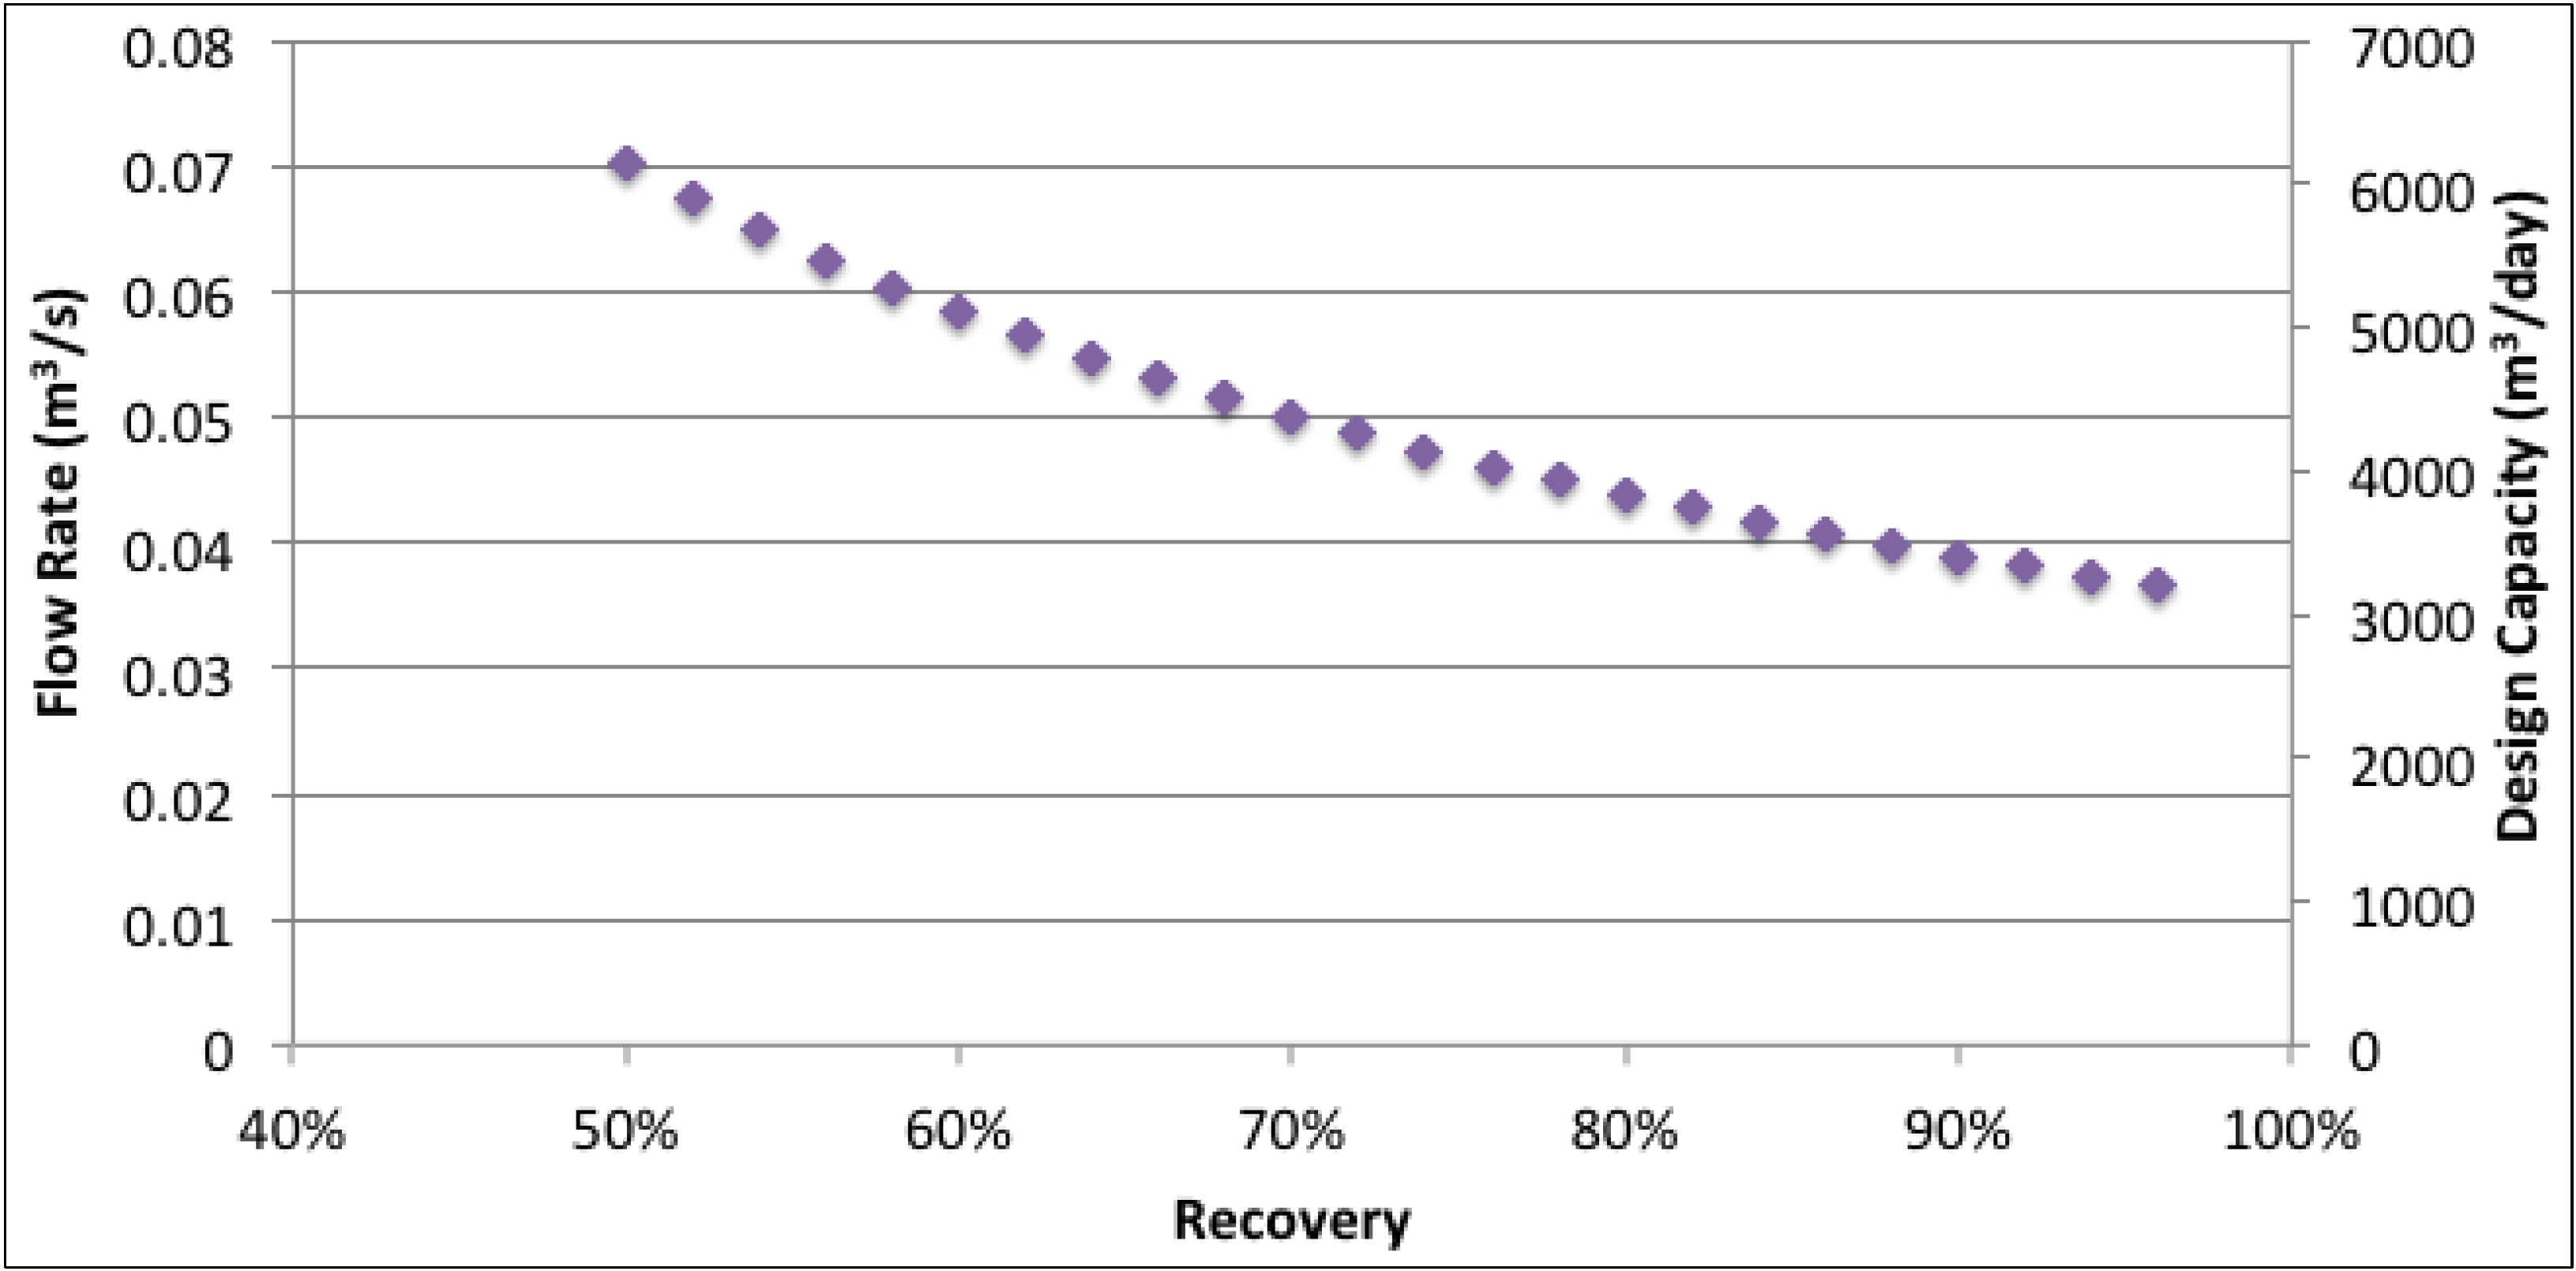
| RD | BWRO recovery | - | 0.9 | 0.8 | 0.7 |
| z | Depth to aquifer | m | 50 | 275 | 500 |
| l | Distribution pipe length | m | 500 | 5250 | 10,000 |
| EID | Energy intensity of desalination | kWh/m3 | 1.03 | 1.8 | 2.56 |
| CFWT | Wind turbine capacity factor | - | 0.45 | 0.35 | 0.25 |


3.2. Economic Feasibility Analysis


| Expense | Units | Reported Costs | Source | ||
|---|---|---|---|---|---|
| Low | Average | High | |||
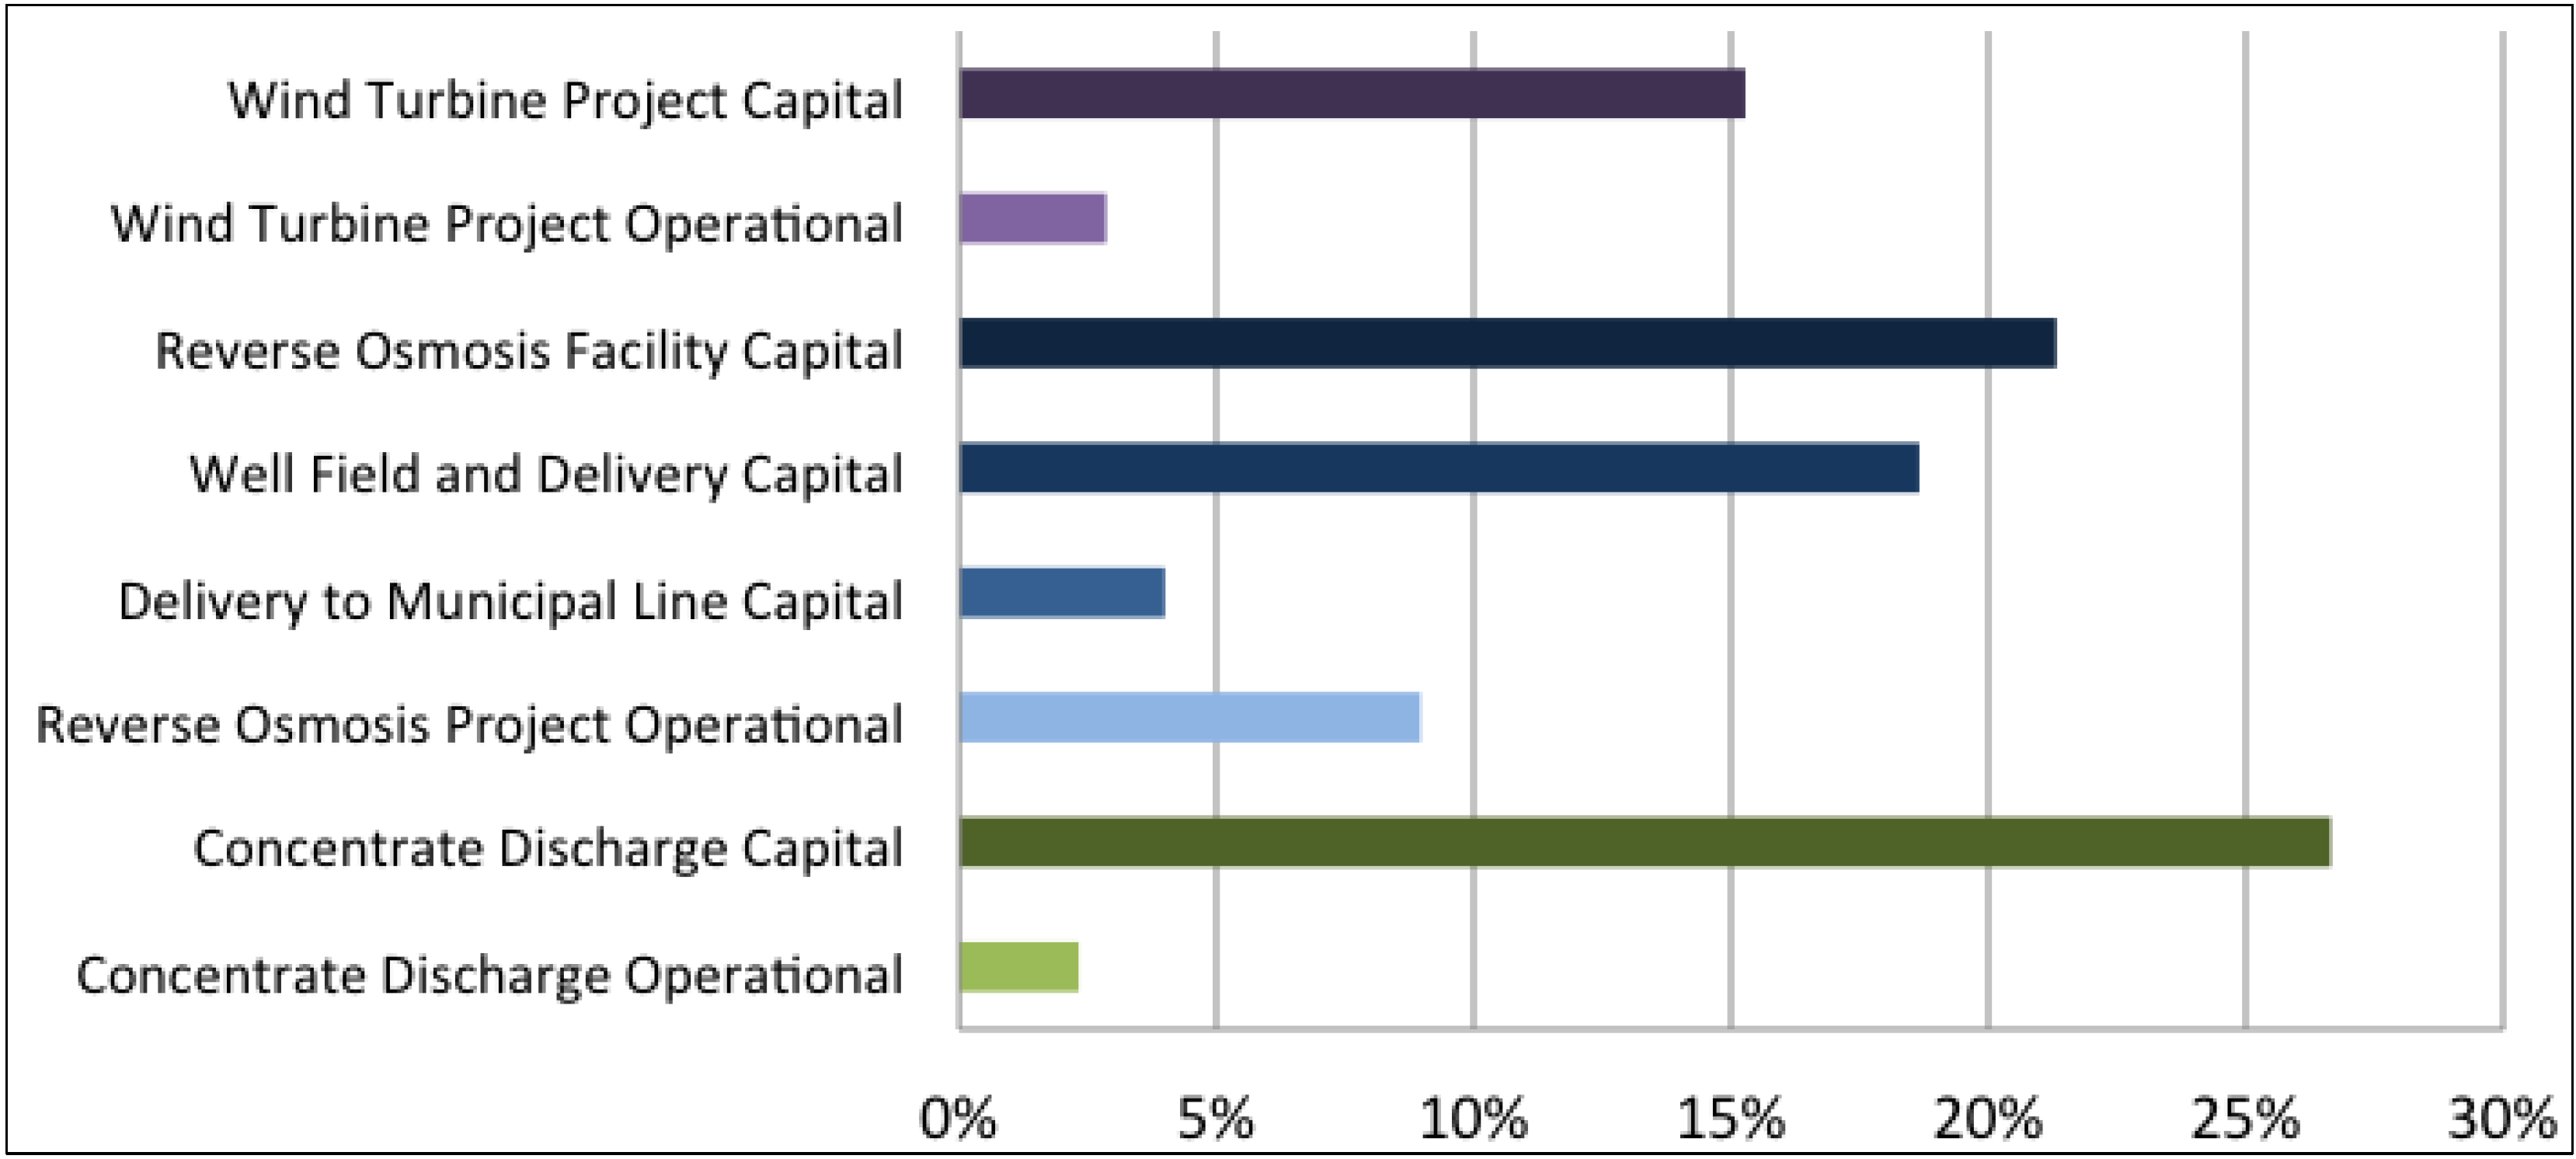
| Wind Turbine Project Capital | $/kW | 1500 | 2250 | 3000 | [3] |
| Wind Turbine Project Operational | $/MWh | 7 | 11 | 15 | [3] |
| Reverse Osmosis Facility Capital | $/m3/day | 300 | 400 | 500 | [8,26,27] |
| Well Field and Delivery Capital | $/m3/day | 250 | 350 | 450 | [8,26,27] |
| Delivery to Municipal Line Capital | $/m3/day | 50 | 75 | 100 | [8,26,27] |
| Reverse Osmosis Project Operational | $/m3 | 0.08 | 0.14 | 0.19 | [26,27] |
| Concentrate Discharge Capital | $/m3/day | 250 | 500 | 750 | [11,28] |
| Concentrate Discharge Operational | $/m3 | 0.01 | 0.04 | 0.06 | [11,28] |
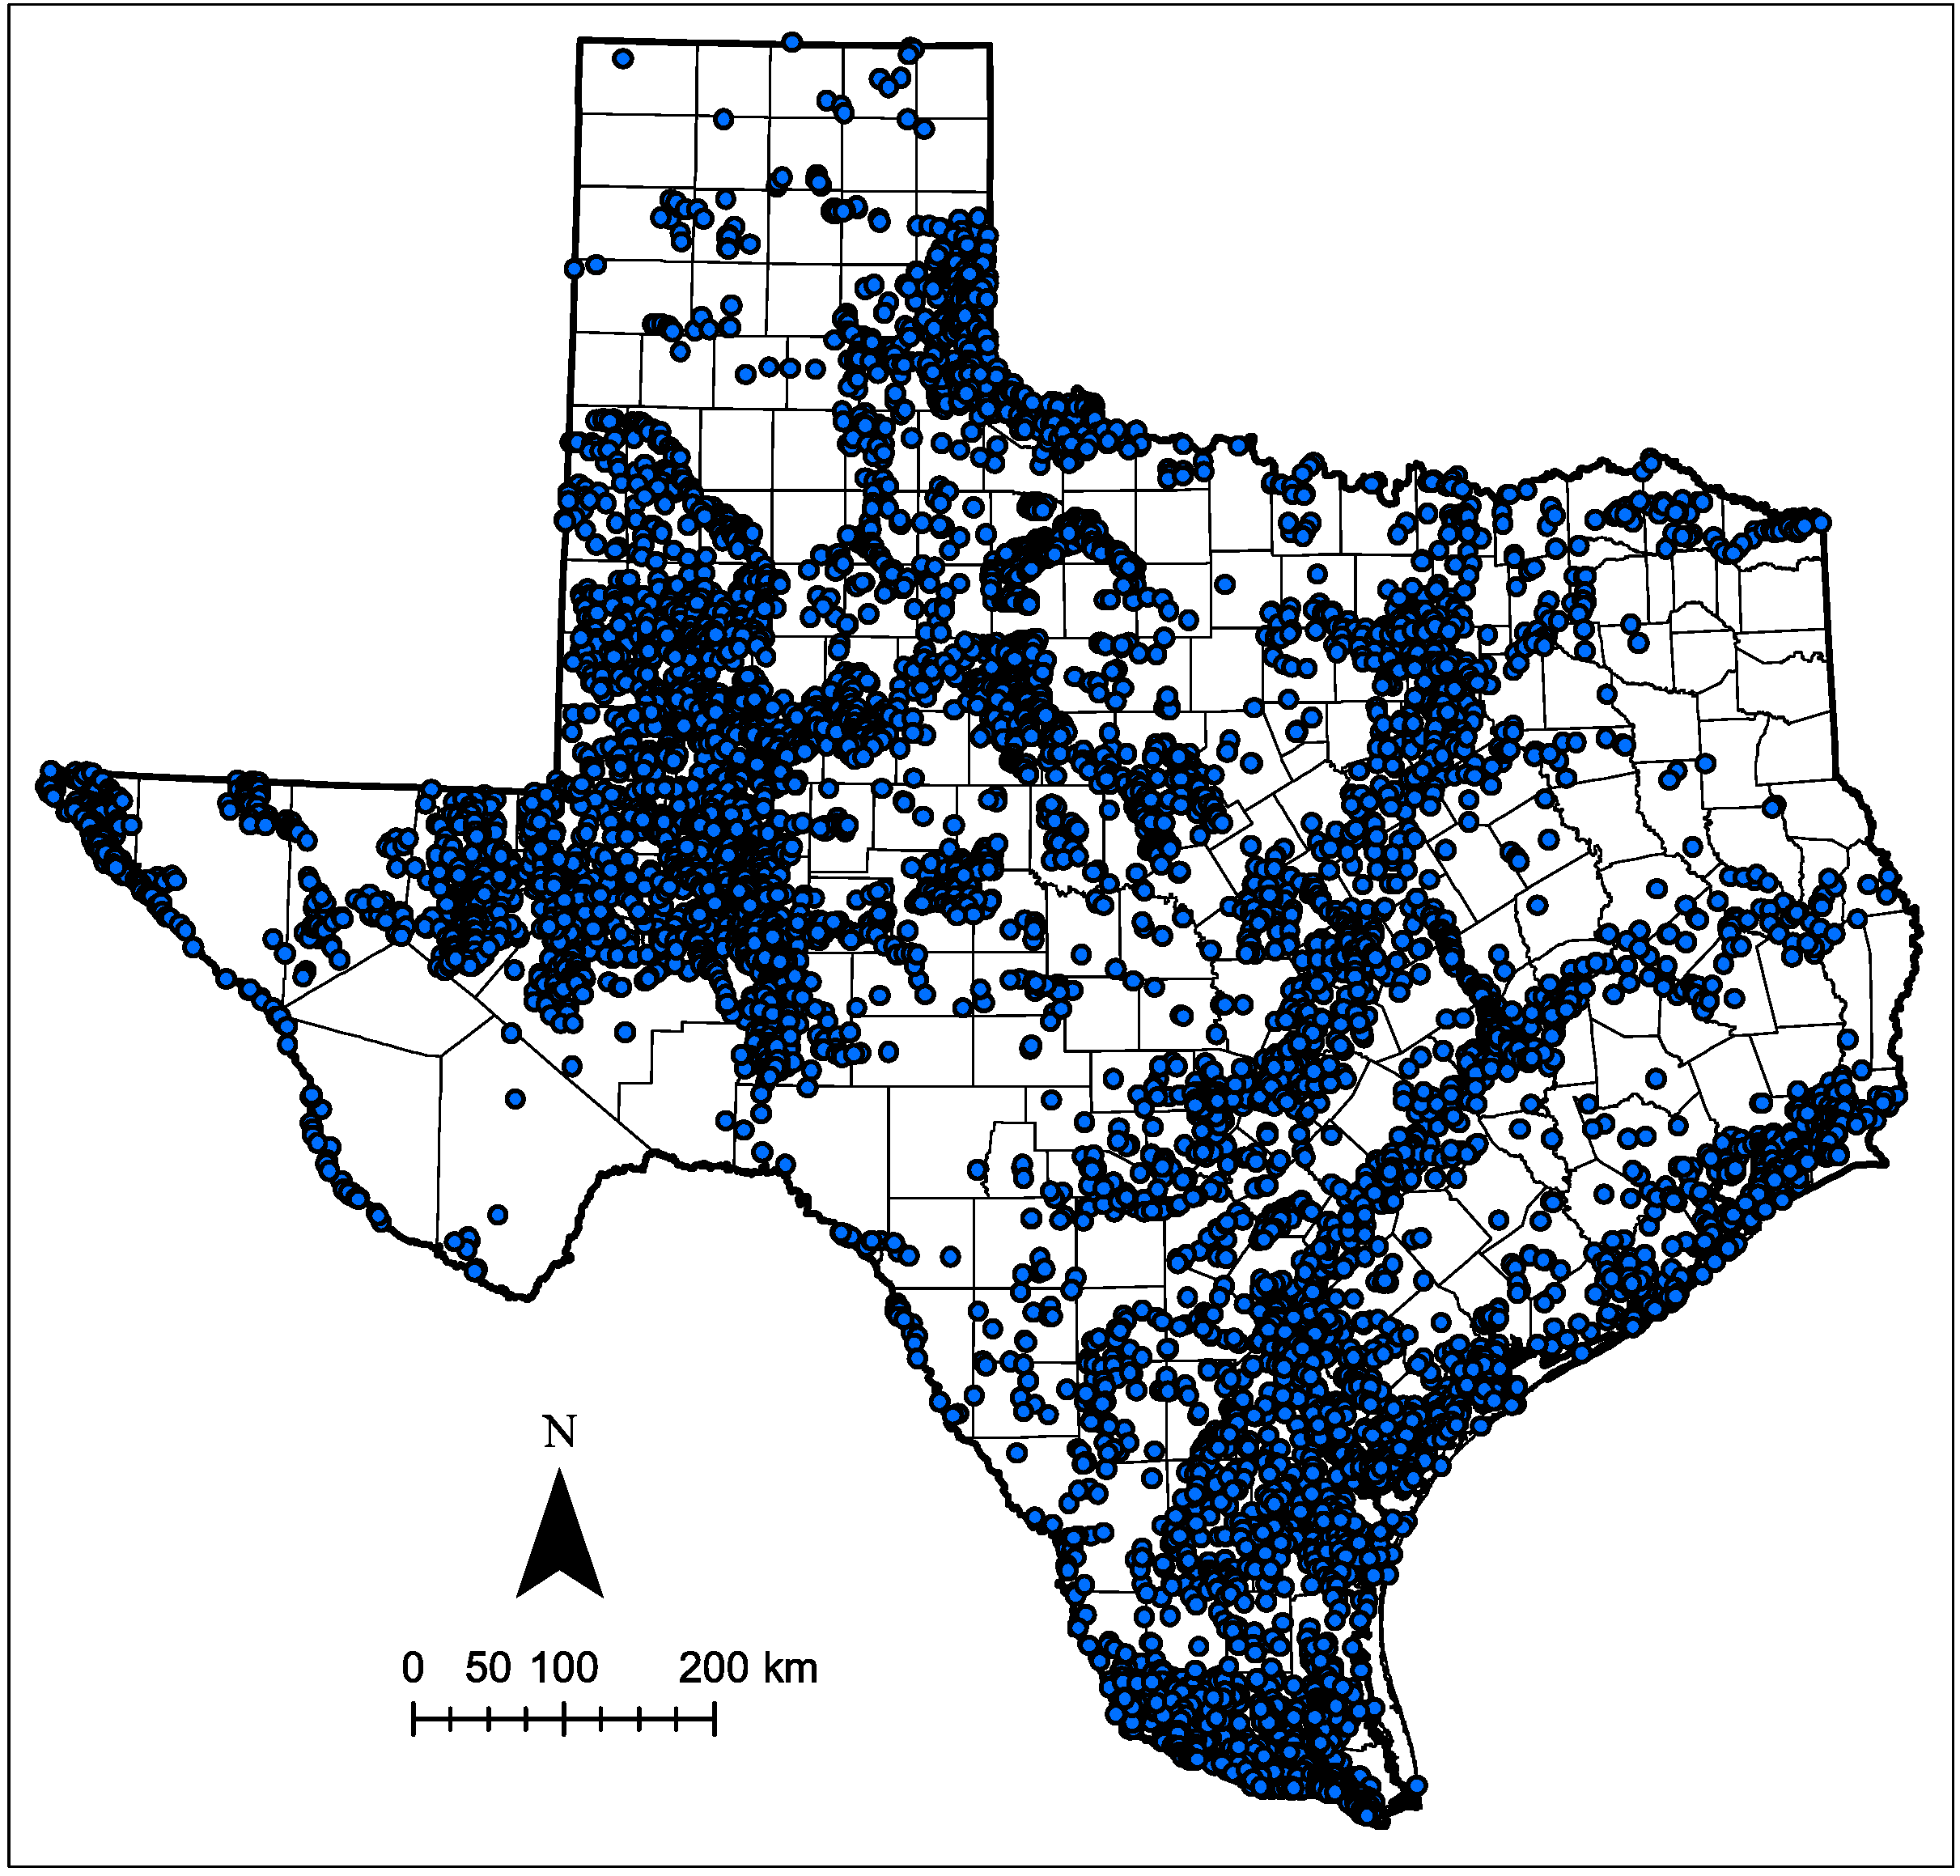
3.3. Geographic Feasibility Analysis
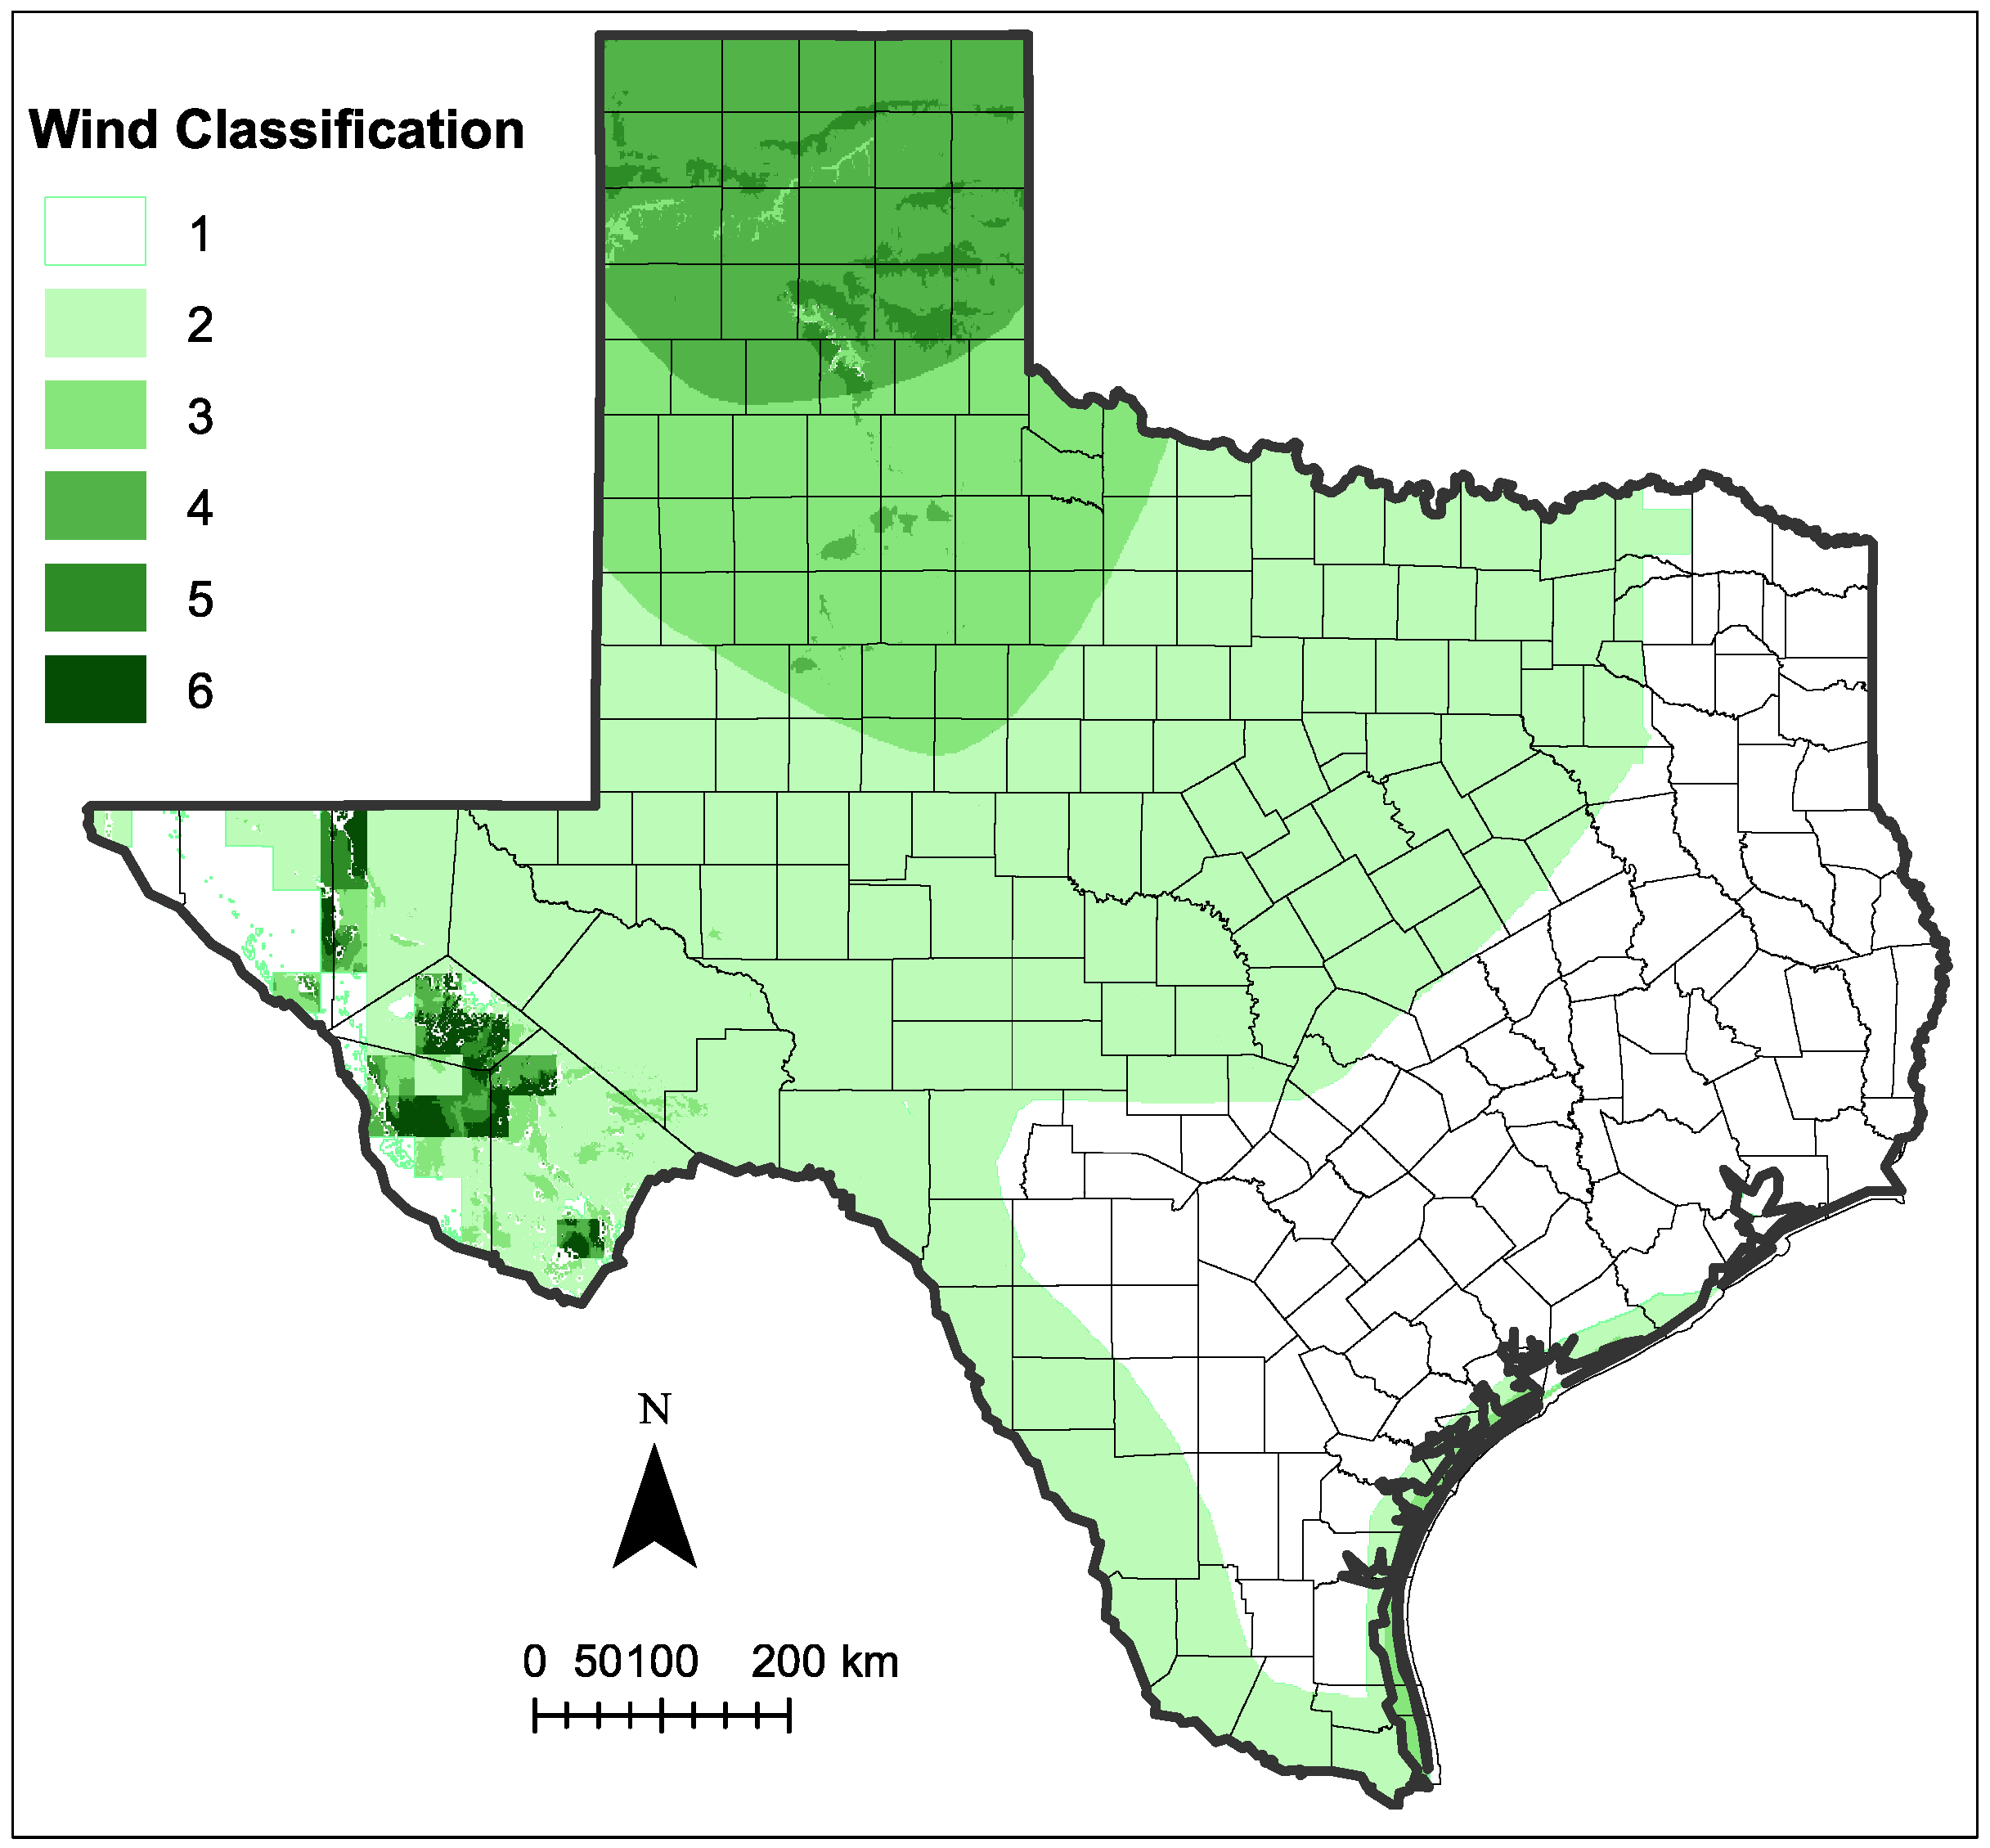
- Wind power classification: The dataset from the National Renewable Energy Laboratory (NREL) provides wind energy potential as a GIS raster file [5]. The dataset demonstrates the availability of wind resources with classifications of 3 or greater, as shown in Figure 2, which is generally considered the minimum threshold for profitably generating electricity with large wind turbines.

4. Results
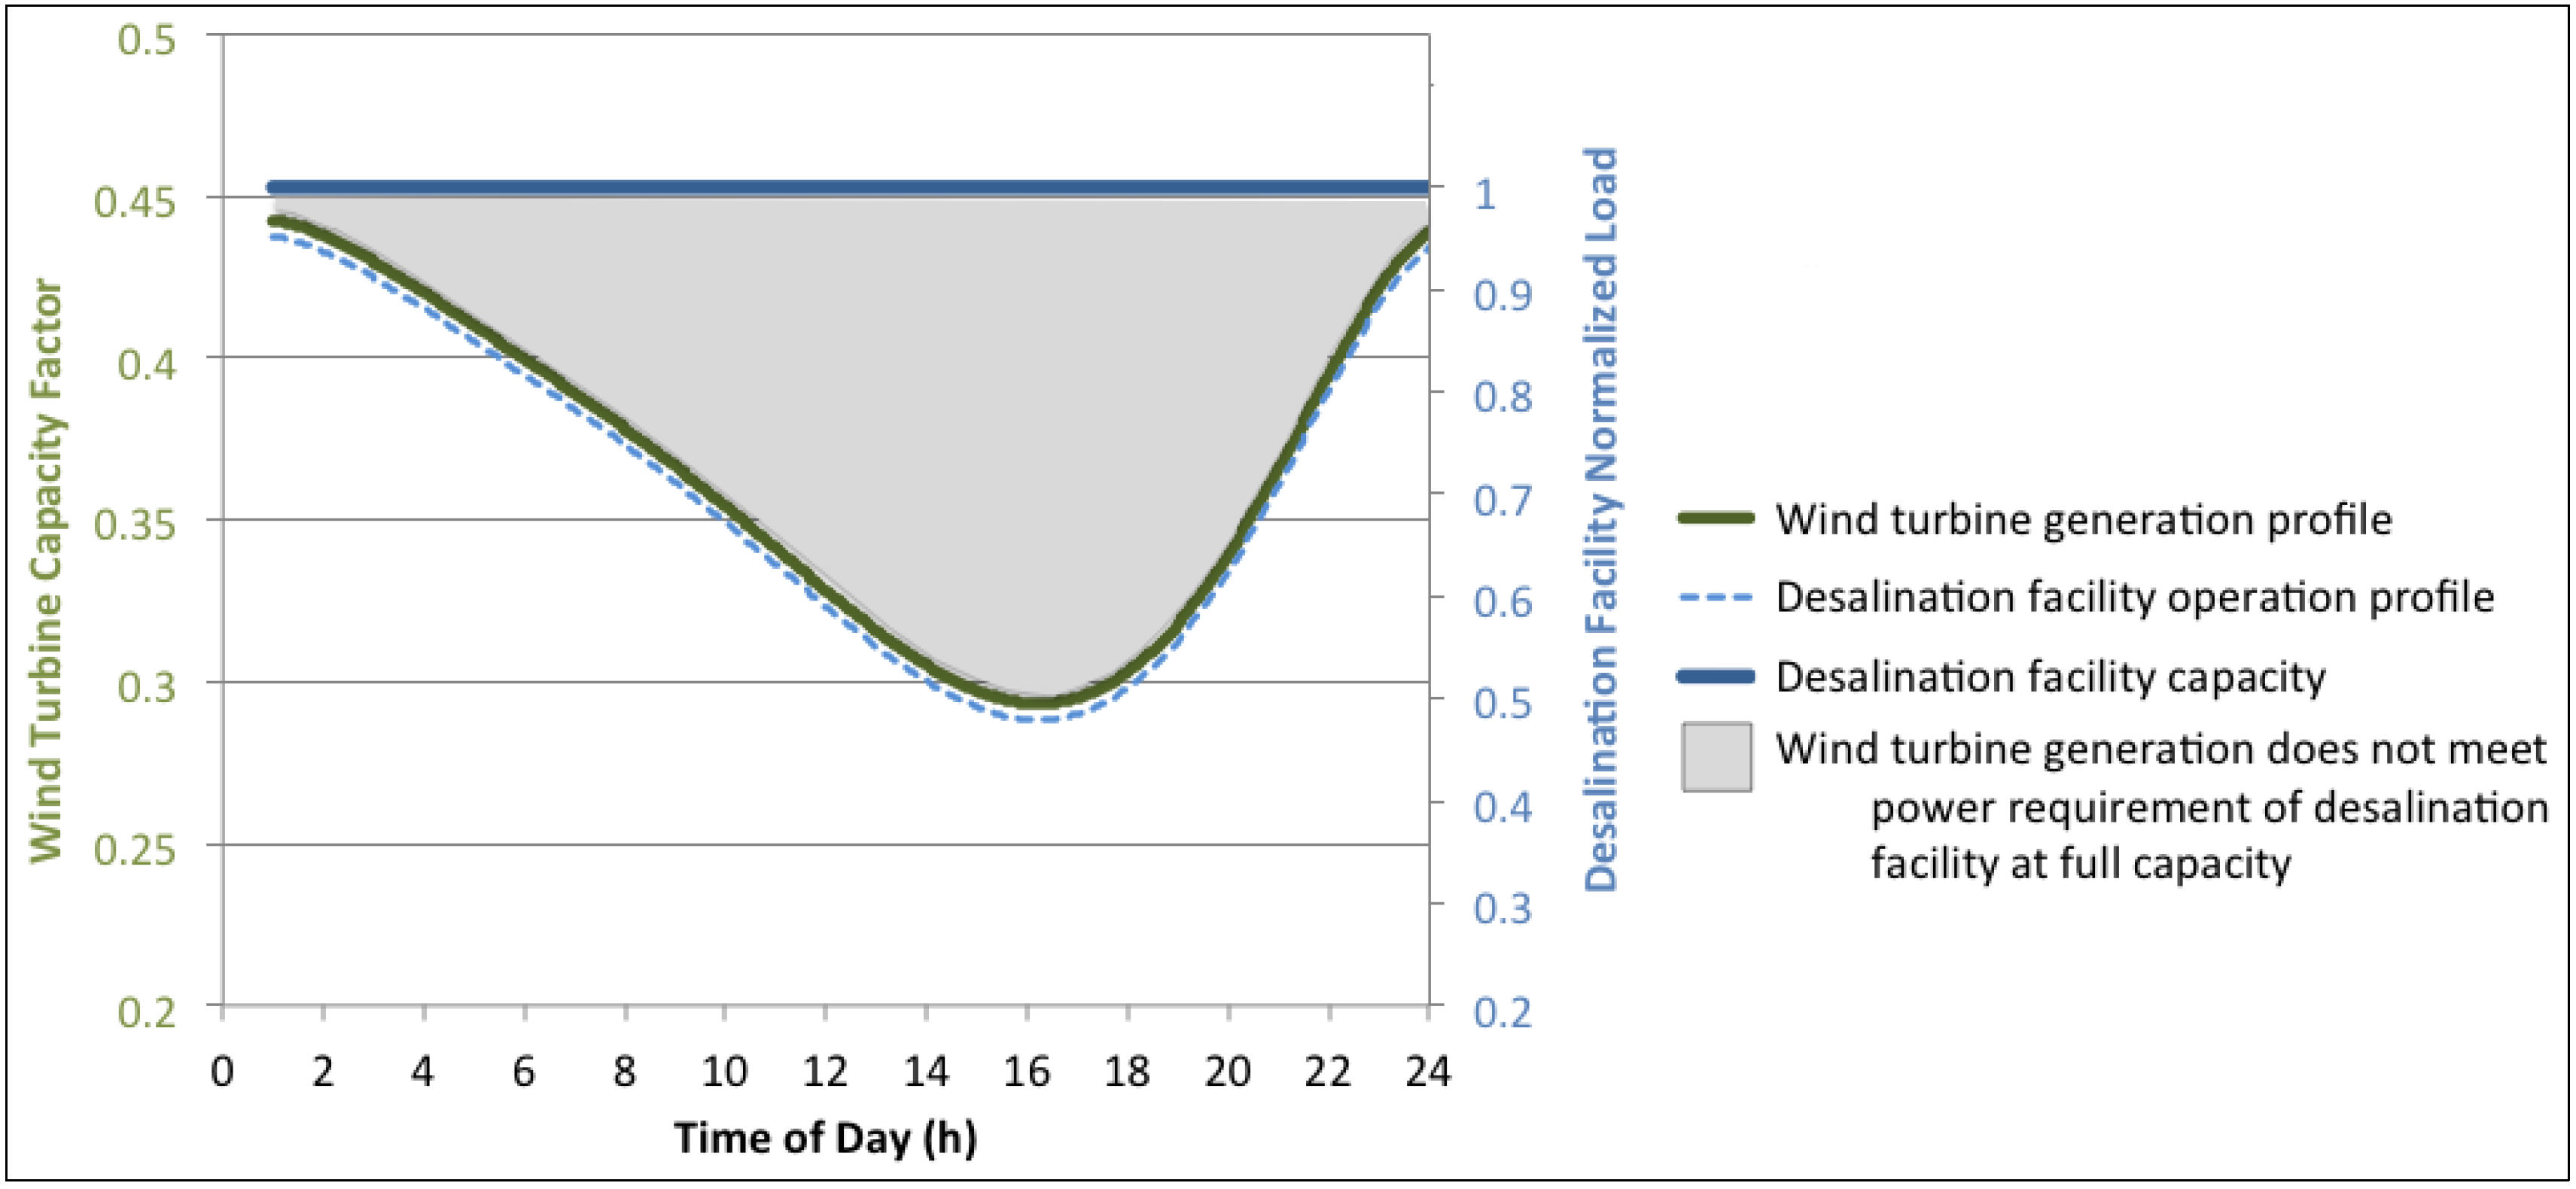
4.1. Energetic Analysis Results
| Increase in Power Requirement of Desalination Facility (kW) | |
|---|---|
| Per 1000 m length of pipe | 0.68 |
| Per 10 m depth to aquifer | 6.97 |
| Per 0.5 kWh/m3 energy intensity | 8.30 |

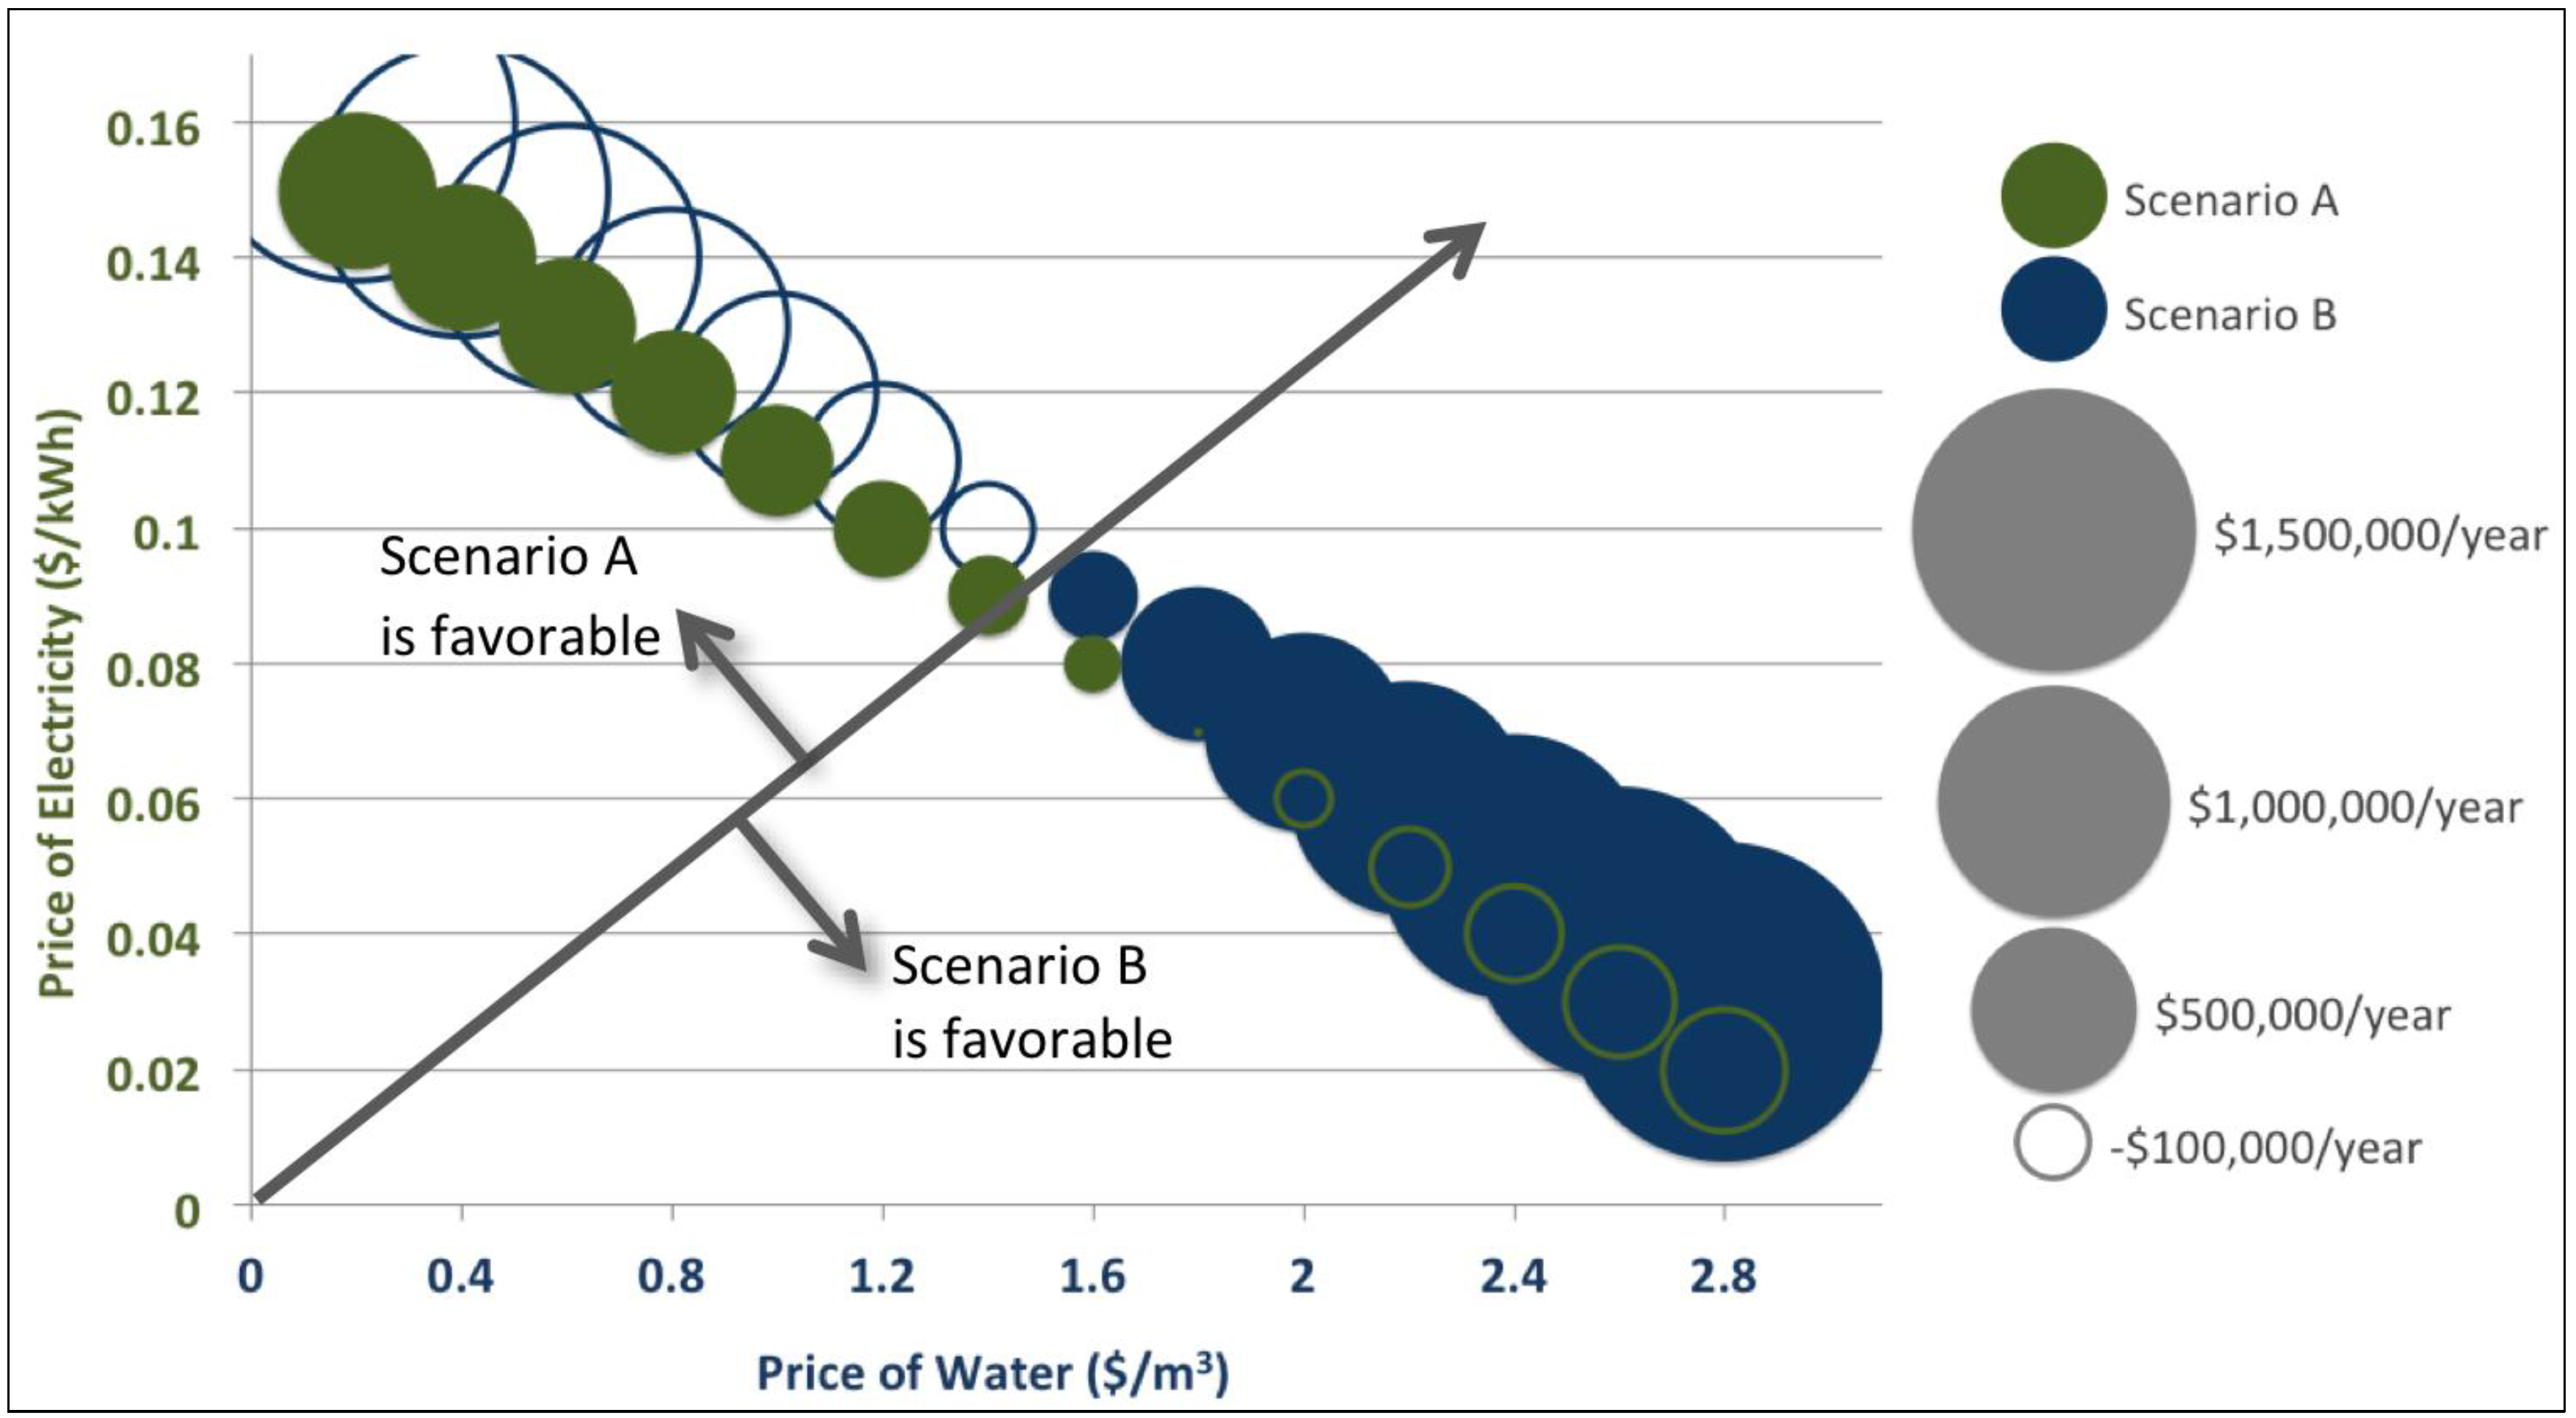
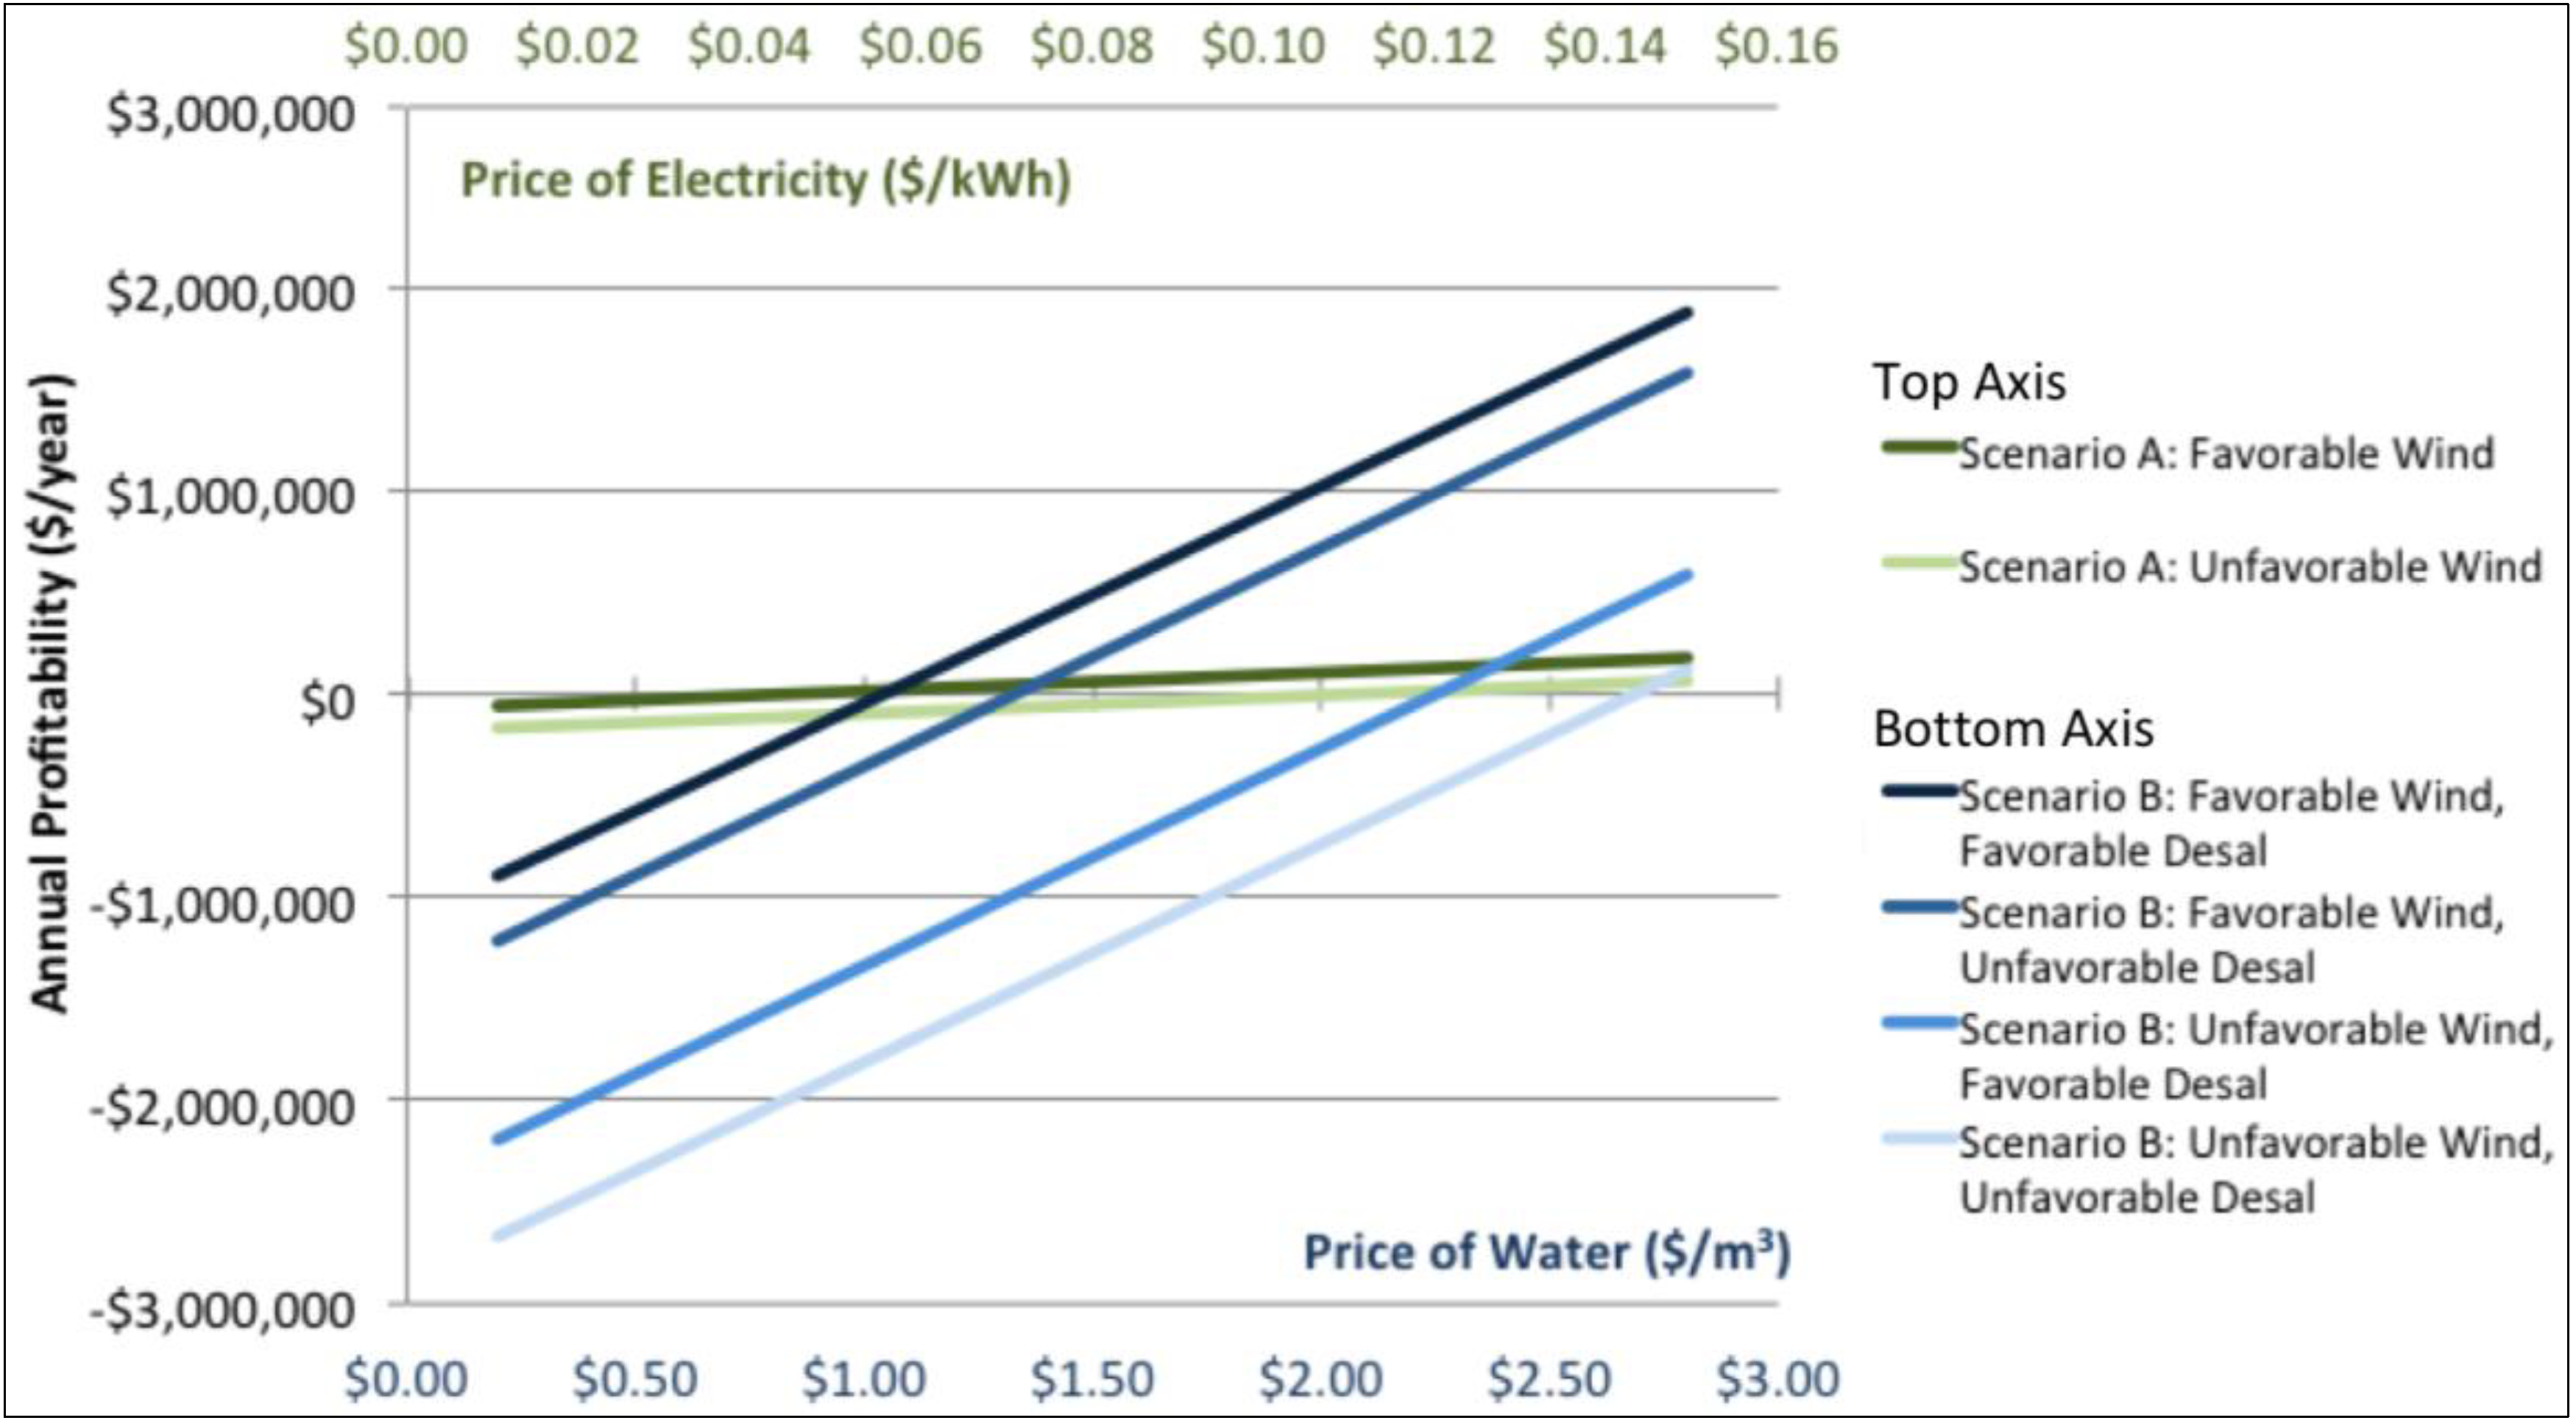
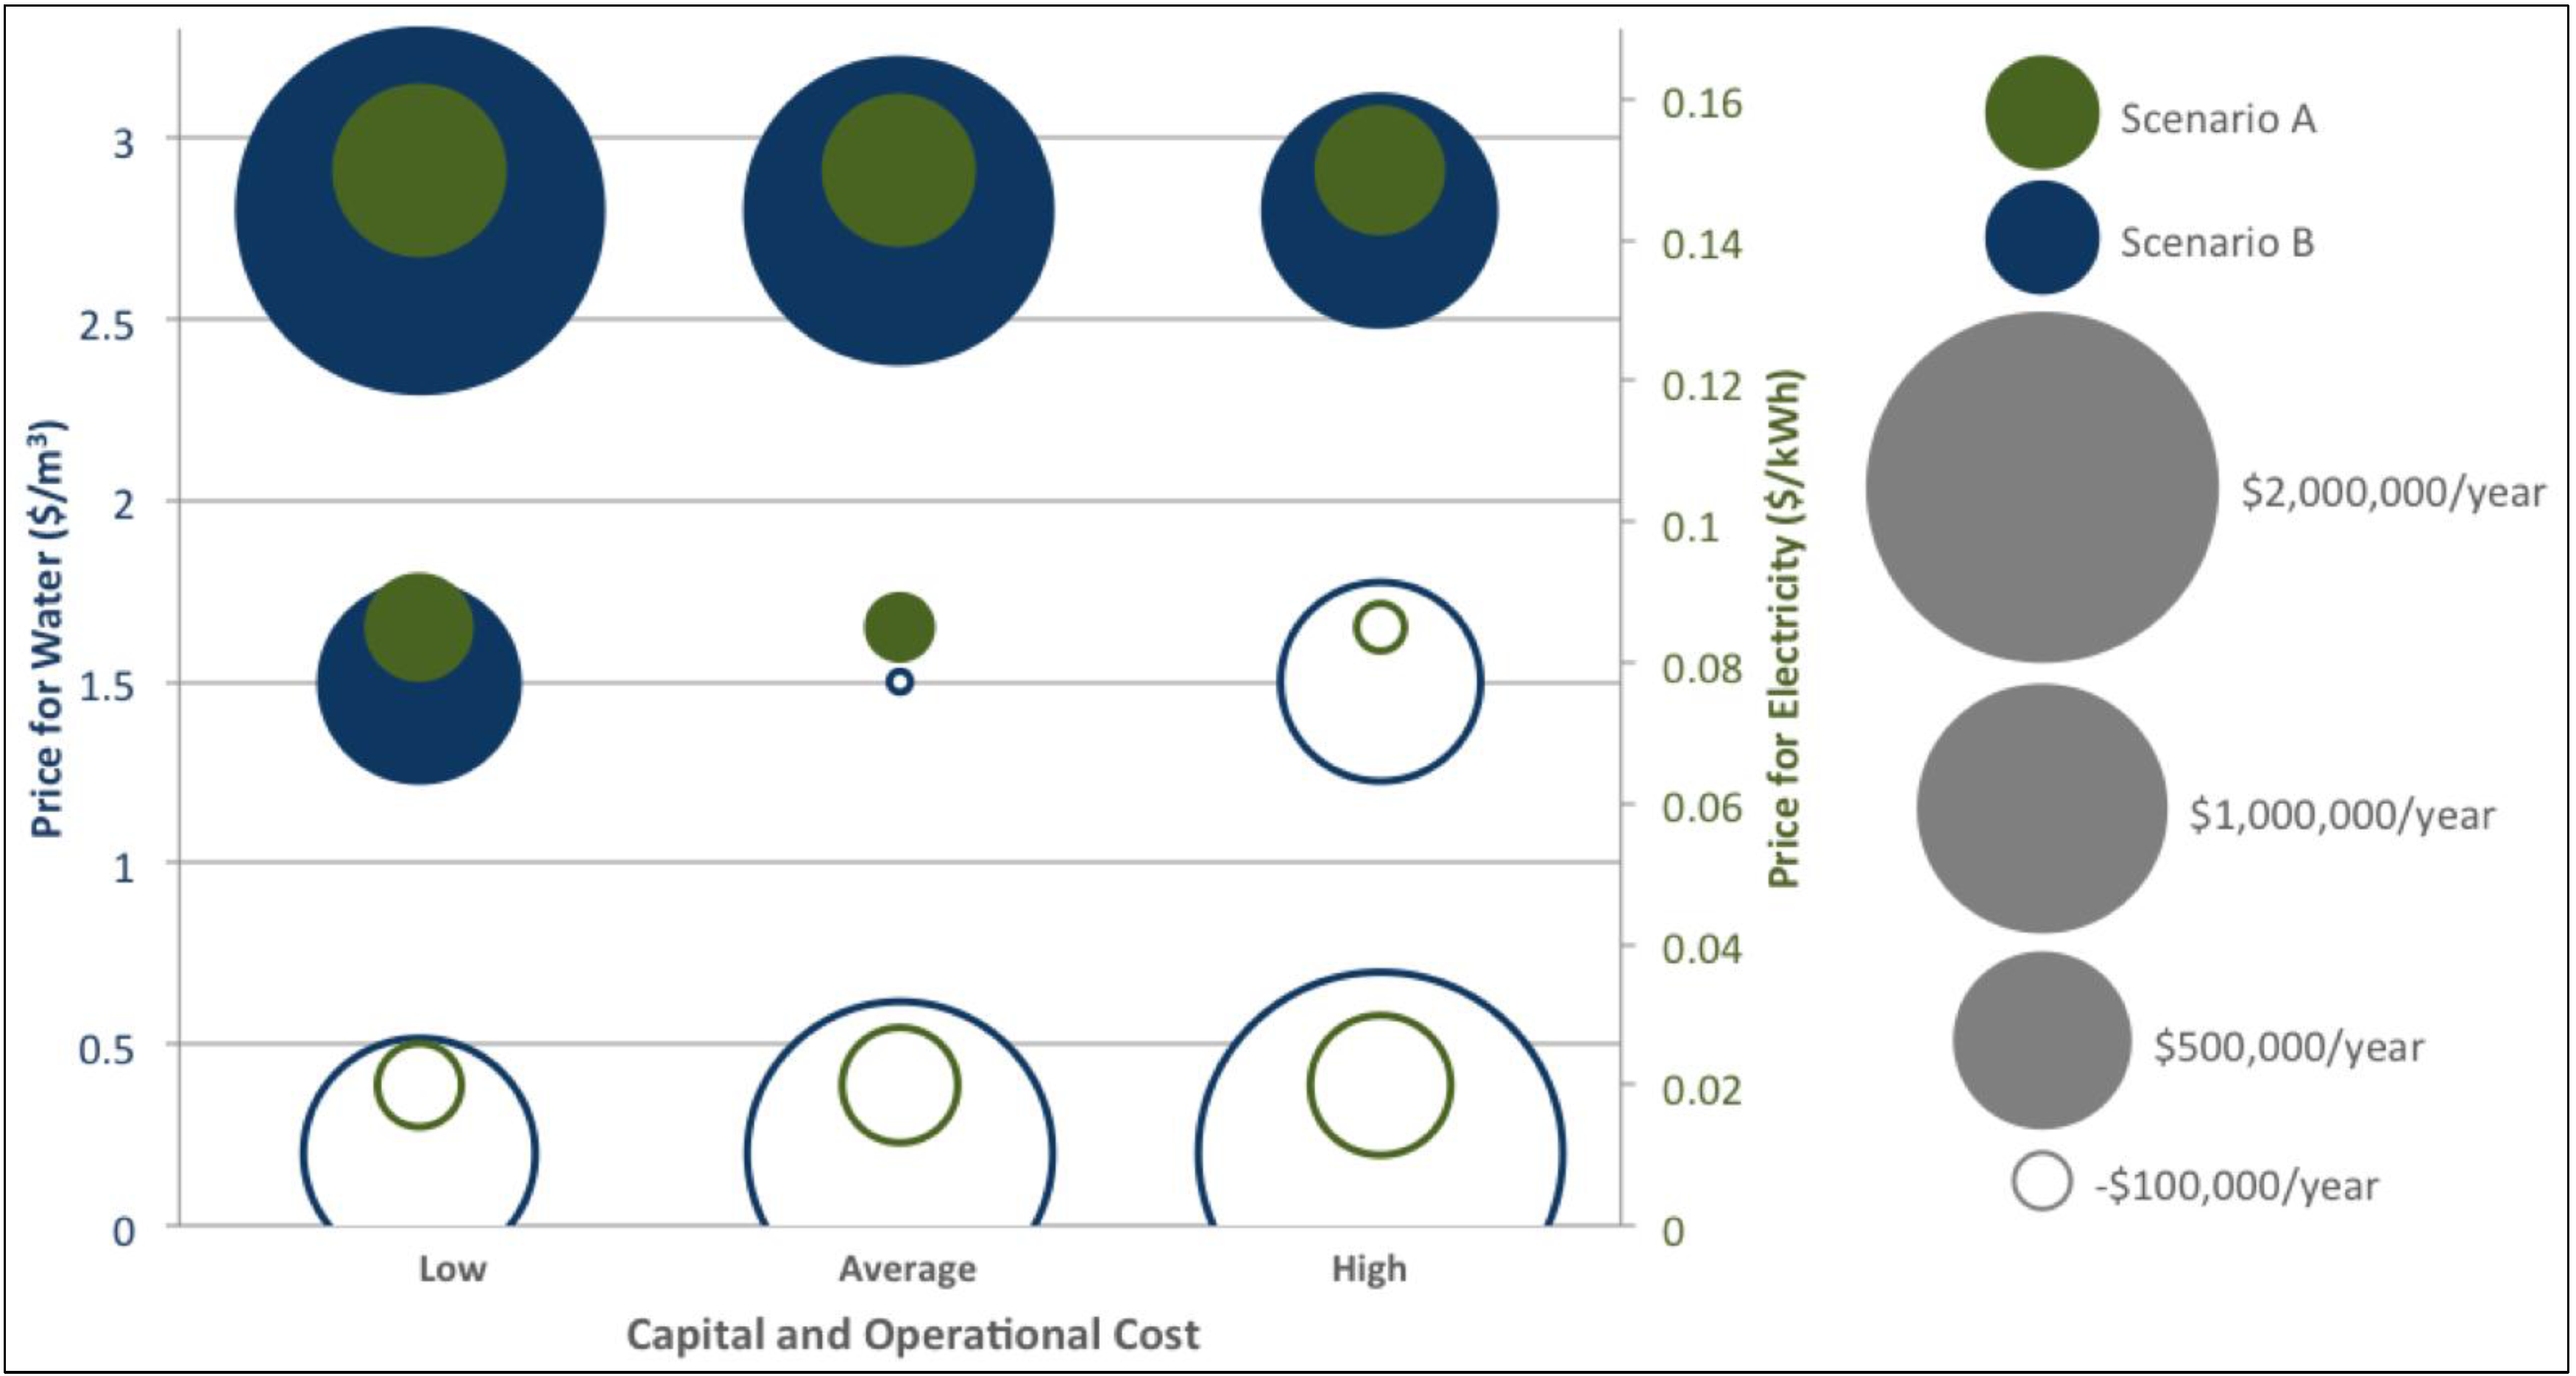
4.2. Economic Analysis Results


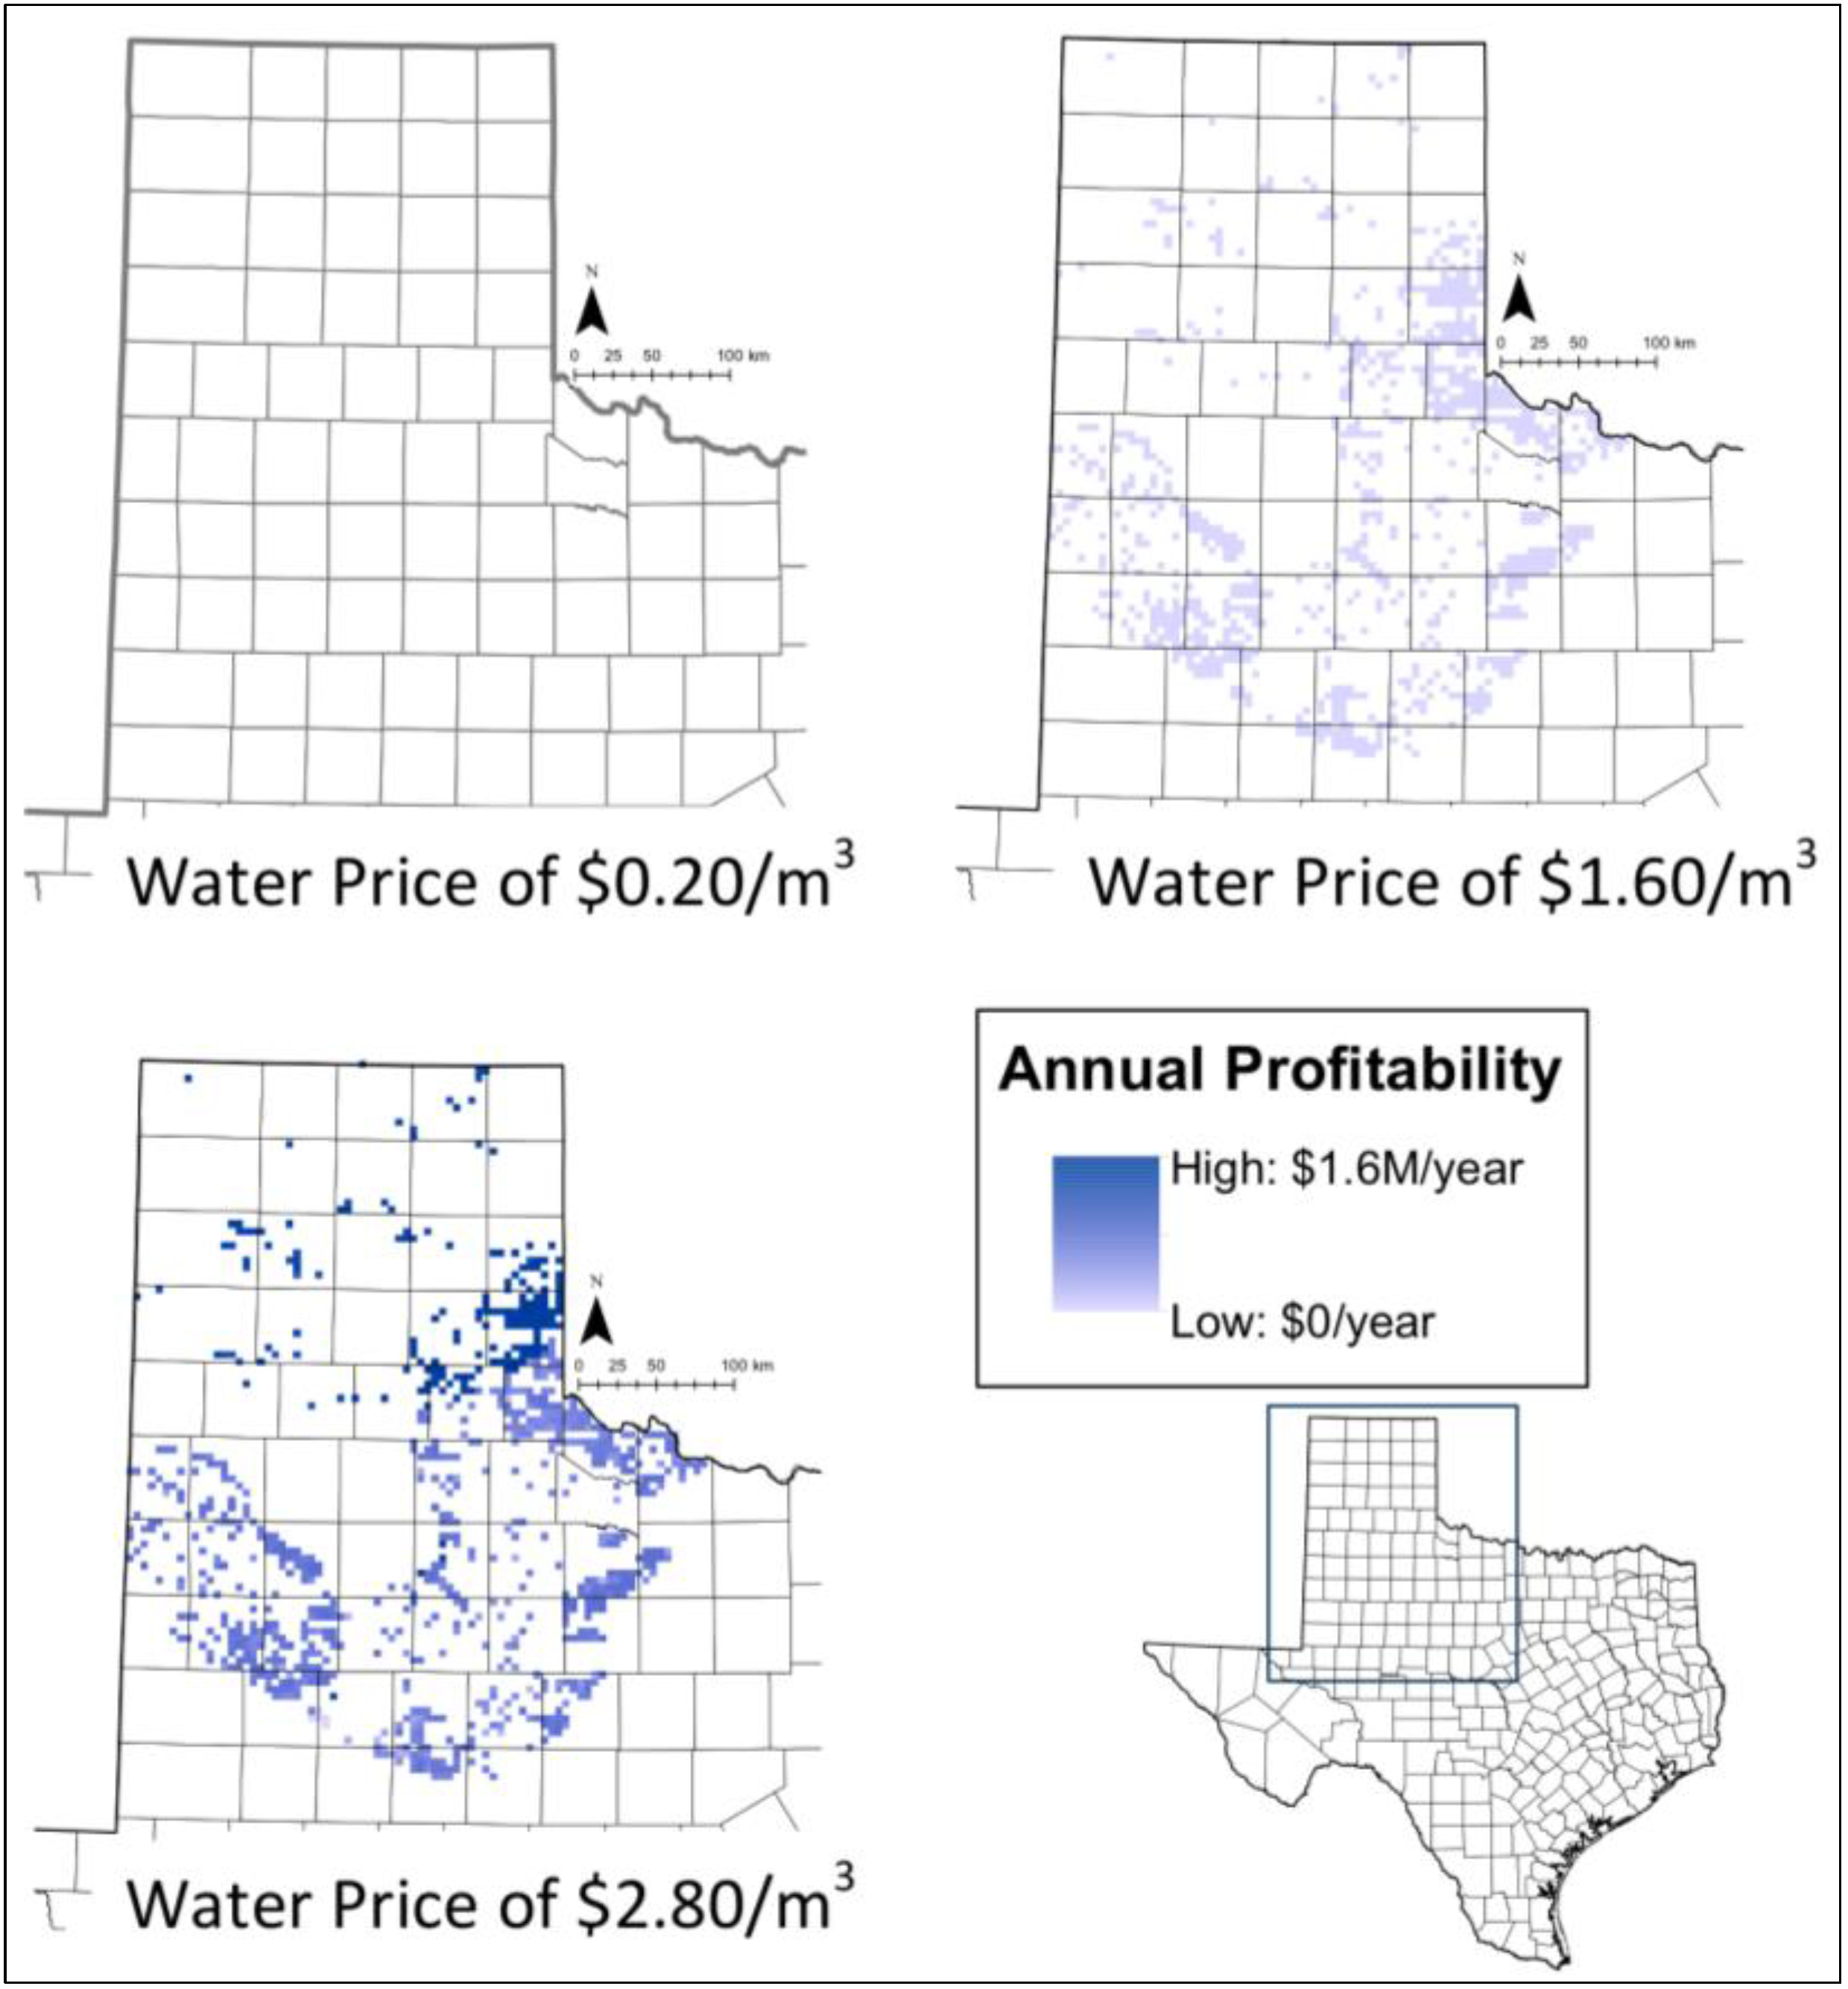
4.3. Geographic Analysis Results
| Brackish Groundwater and Wind Conditions | Turbine Capacity (kW) | Water Price ($/m3) | Profitability ($/year) | |
|---|---|---|---|---|
| Well 1 | Depth: 50 m | 505 | $0.20 | −$930,000 |
| TDS: 1000 | $1.60 | $570,000 | ||
| Wind Classification: 5 | $2.80 | $1,900,000 | ||
| Well 2 | Depth: 500 m | 1900 | $0.20 | −$1,200,000 |
| TDS: 10,000 | $1.60 | $270,000 | ||
| Wind Classification: 5 | $2.80 | $1,600,000 | ||
| Well 3 | Depth: 500 m | 2660 | $0.20 | −$1,300,000 |
| TDS: 10,000 | $1.60 | $130,000 | ||
| Wind Classification: 3 | $2.80 | $1,400,000 | ||
| Well 4 | Depth: 50 m | 710 | $0.20 | −$970,000 |
| TDS: 1000 | $1.60 | $530,000 | ||
| Wind Classification: 3 | $2.80 | $1,800,000 |

5. Conclusions
Acknowledgments
Conflicts of Interest
References
- Committee on Advancing Desalination Technology, National Research Council. Desalination: A National Perspective; National Academies Press: Washington, DC, USA, 2008.
- Sandia National Laboratories, U.S. Department of Energy. Electric Power Industry Needs for Grid-Scale Storage Applications. Available online: http://energy.tms.org/docs/pdfs/Electric_Power_Industry_Needs_2010.pdf (accessed on 18 November 2013).
- U.S. Department of Energy, Energy Efficiency and Renewable Energy. 2012 Wind Technologies Market Report. Available online: http://www1.eere.energy.gov/wind/pdfs/2012_wind_technologies_market_report.pdf (accessed on 18 November 2013).
- U.S. Department of Energy, National Renewable Energy Laboratory. Installed Wind Capacity. Available online: http://www.windpoweringamerica.gov/wind_installed_capacity.asp (accessed on 18 November 2013).
- U.S. Department of Energy, National Renewable Energy Laboratory. Dynamic Maps, GIS Data, & Analysis Tools, U.S. 50 m Wind Resource Map. Available online: http://www.nrel.gov/gis/wind.html (accessed on 18 November 2013).
- Texas Water Development Board. Water for Texas, 2012 State Water Plan. Available online: http://www.twdb.state.tx.us/publications/state_water_plan/2012/2012_SWP.pdf (accessed on 18 November 2013).
- Desalination and Water Reuse. Total World Desalination Capacity. Available online: http://www.desalination.biz/news/news_story.asp?id=5121 (accessed on 18 November 2013).
- Texas Water Development Board. Groundwater Database; Texas Water Development Board: Austin, TX, USA, 2009.
- Texas Water Development Board; LBG-Guyton Associates. Brackish Groundwater Manual for Texas Regional Water Planning Groups; LBG-Guyton Associates: Austin, TX, USA, 2003.
- Bureau of Economic Geology; Texas Water Development Board; LBG-Guyton Associates. A Desalination Database for Texas; LBG-Guyton Associates: Austin, TX, USA, 2006.
- Van der Bruggen, B.; Vandecasteele, C. Distillation vs. membrane filtration: Overview of process evolutions in seawater desalination. Desalination 2002, 143, 207–218. [Google Scholar] [CrossRef]
- Mickley & Associates. Membrane Concentrate Disposal: Practices and Regulation. In Reclamation: Managing Water in the West; Desalination and Water Purification Research and Development Program Report No. 123, (Second Edition) edU.S. Department of the Interior, Bureau of Reclamation: Washington, DC, USA, 2006. [Google Scholar]
- Veza, J.M.; Penate, B.; Castellano, F. Electrodialysis desalination designed for off-grid wind energy. Desalination 2004, 160, 211–221. [Google Scholar] [CrossRef]
- Rodriguez, L.G.; Romero-Ternero, V.; Camacho, C.G. Economic analysis of wind-powered desalination. Desalination 2001, 137, 259–265. [Google Scholar] [CrossRef]
- Ma, Q.; Hui, L. Wind energy technologies integrated with desalination systems: Review and state-of-the-art. Desalination 2011, 277, 274–280. [Google Scholar] [CrossRef]
- Miranda, M.S. A wind-powered seawater reverse-osmosis system without batteries. Desalination 2003, 153, 9–16. [Google Scholar] [CrossRef]
- Mohamed, E.S.; Papdakis, G. Design, simulation and economic analysis of a stand-alone reverse osmosis desalination unit powered by wind turbines and photovoltaics. Desalination 2003, 164, 87–97. [Google Scholar] [CrossRef]
- Weiner, D.; Fisher, D.; Moses, E.J.; Katz, B.; Meron, G. Operation experience of a solar- and wind-powered desalination demonstration plant. Desalination 2001, 137, 7–13. [Google Scholar] [CrossRef]
- Barta, P. Amid Water Shortage, Australia Looks to the Sea. Available online: http://online.wsj.com/article/SB120518234721525073.html (accessed on 18 November 2013).
- Texas Water Development Board. City of Seminole: An Integrated Wind-Water Desalination Demonstration Project for an Inland Municipality. Available online: http://www.twdb.state.tx.us/innovativewater/desal/projects/seminole/ (accessed on 18 November 2013).
- U.S. Department of Energy, Energy Efficiency & Renewable Energy. Database of State Incentives for Renewables and Efficiency: Renewable Electricity Production Tax Credit. Available online: http://dsireusa.org/incentives/incentive.cfm?Incentive_Code=US13F (accessed on 18 November 2013).
- Electric Reliability Council of Texas. Historical RTM Load Zone and Hub Prices—2012. Available online: http://www.ercot.com/mktinfo/prices/ (accessed on 18 November 2013).
- Electric Reliability Council of Texas. Entity-Specific Resource Output. Available online: http://www.nodal.ercot.com/gridinfo/sysplan/esrrps/ (accessed on 18 November 2013).
- Hardberger, A. Environmental Defense Fund. In From Policy to Reality: Maximizing Urban Water Conservation in Texas; Environmental Defense Fund: New York, NY, USA, 2008. [Google Scholar]
- U.S. Department of Labor, Bureau of Labor Statistics. Consumer Price Index: All Urban Consumers; Department of Labor, Bureau of Labor Statistics: Washington, DC, USA, 2013.
- Arroyo, J.; Shirazi, S. Texas Water Development Board, Innovative Water Technologies. In Cost of Brackish Groundwater Desalination in Texas; Texas Water Development Board, Innovative Water Technologies: Austin, TX, USA, 2012. [Google Scholar]
- Sturdivant, A.W.; Rogers, C.S.; Rister, M.E.; Lacewell, R.D.; Norris, J.W.; Leal, J.; Garza, J.A.; Adams, J. Economic costs of desalination in south Texas: A case study. J. Contemp. Water Res. Educ. 2007, 137, 21–39. [Google Scholar]
- Foldager, R.A. Economics of Desalination Concentrate Disposal Methods in Inland Regions: Deep-Well Injection, Evaporative Ponds, and Salinity Gradient Solar Ponds. Available online: http://wrri.nmsu.edu/research/rfp/studentgrants03/reports/foldager.pdf (accessed on 18 November 2013).
- Semiat, R. Energy issues in desalination processes. Environ. Sci. Technol. 2008, 42, 8193–8201. [Google Scholar] [CrossRef]
© 2014 by the authors; licensee MDPI, Basel, Switzerland. This article is an open access article distributed under the terms and conditions of the Creative Commons Attribution license (http://creativecommons.org/licenses/by/3.0/).
Share and Cite
Clayton, M.E.; Stillwell, A.S.; Webber, M.E. Implementation of Brackish Groundwater Desalination Using Wind-Generated Electricity: A Case Study of the Energy-Water Nexus in Texas. Sustainability 2014, 6, 758-778. https://doi.org/10.3390/su6020758
Clayton ME, Stillwell AS, Webber ME. Implementation of Brackish Groundwater Desalination Using Wind-Generated Electricity: A Case Study of the Energy-Water Nexus in Texas. Sustainability. 2014; 6(2):758-778. https://doi.org/10.3390/su6020758
Chicago/Turabian StyleClayton, Mary E., Ashlynn S. Stillwell, and Michael E. Webber. 2014. "Implementation of Brackish Groundwater Desalination Using Wind-Generated Electricity: A Case Study of the Energy-Water Nexus in Texas" Sustainability 6, no. 2: 758-778. https://doi.org/10.3390/su6020758