3.1. MFAs of Various Items for Sugar Cane, Pasturage and Beef Cattle
The final goals for this chapter are to demonstrate the material cycle between the cattle, pasturage and sugar cane and then, to propose ways to make the material flow more efficient. For these purposes, this section presents: (1) MFA for the poultry breeding and raising, MFA for the dairy cattle breeding and raising, the hog breeding and raising, sugar mills and the Miyakojima City Resources Recycling Center. The target period in this research for all MFAs given above is one year except for the Miyakojima City Resources Recycling Center. (2) Establishment of loss ratios for composting at composting facilities and in the soil. (3) Applied fertilizer and biomass resource allocations to sugar cane and pasturage.
Manure from stockbreeding of beef cattle, dairy cattle, pigs, and chicken are plowed under as a basal fertilizer. Residues from sugar cane fields and sugar mills are plowed under for composting. Note that stockbreeding manure and residues from sugar cane fields and sugar mills are plowed under because they are considered as fertilizers. Other biomass resources including sludge from sewage plants, waste from pruned trees, the fishery residues, food wastes and methane fermentation residues from Awamori (a distilled liquor in the island) plants are also used. Sludge from sewage plants is also plowed under for use as fertilizer whereas pruned trees, fishery residues, raw garbage and lees from Awamori are used as the raw materials for the composting facilities.
In previous research [
17], we clarified the MFA for four types of cattle breeding and raising. It shows the MFA for the lifecycle of each type of cattle breeding and raising. We need the “annual” MFA for the four types of cattle breeding and raising for this discussion (see
Appendix 2). What we need to consider is biomass information, including quantity of manure, nitrogen quantity of manure, carbon quantity of manure, phosphorus quantity of manure, quantity of urine, nitrogen quantity of urine, carbon quantity of urine and phosphorus quantity of urine.
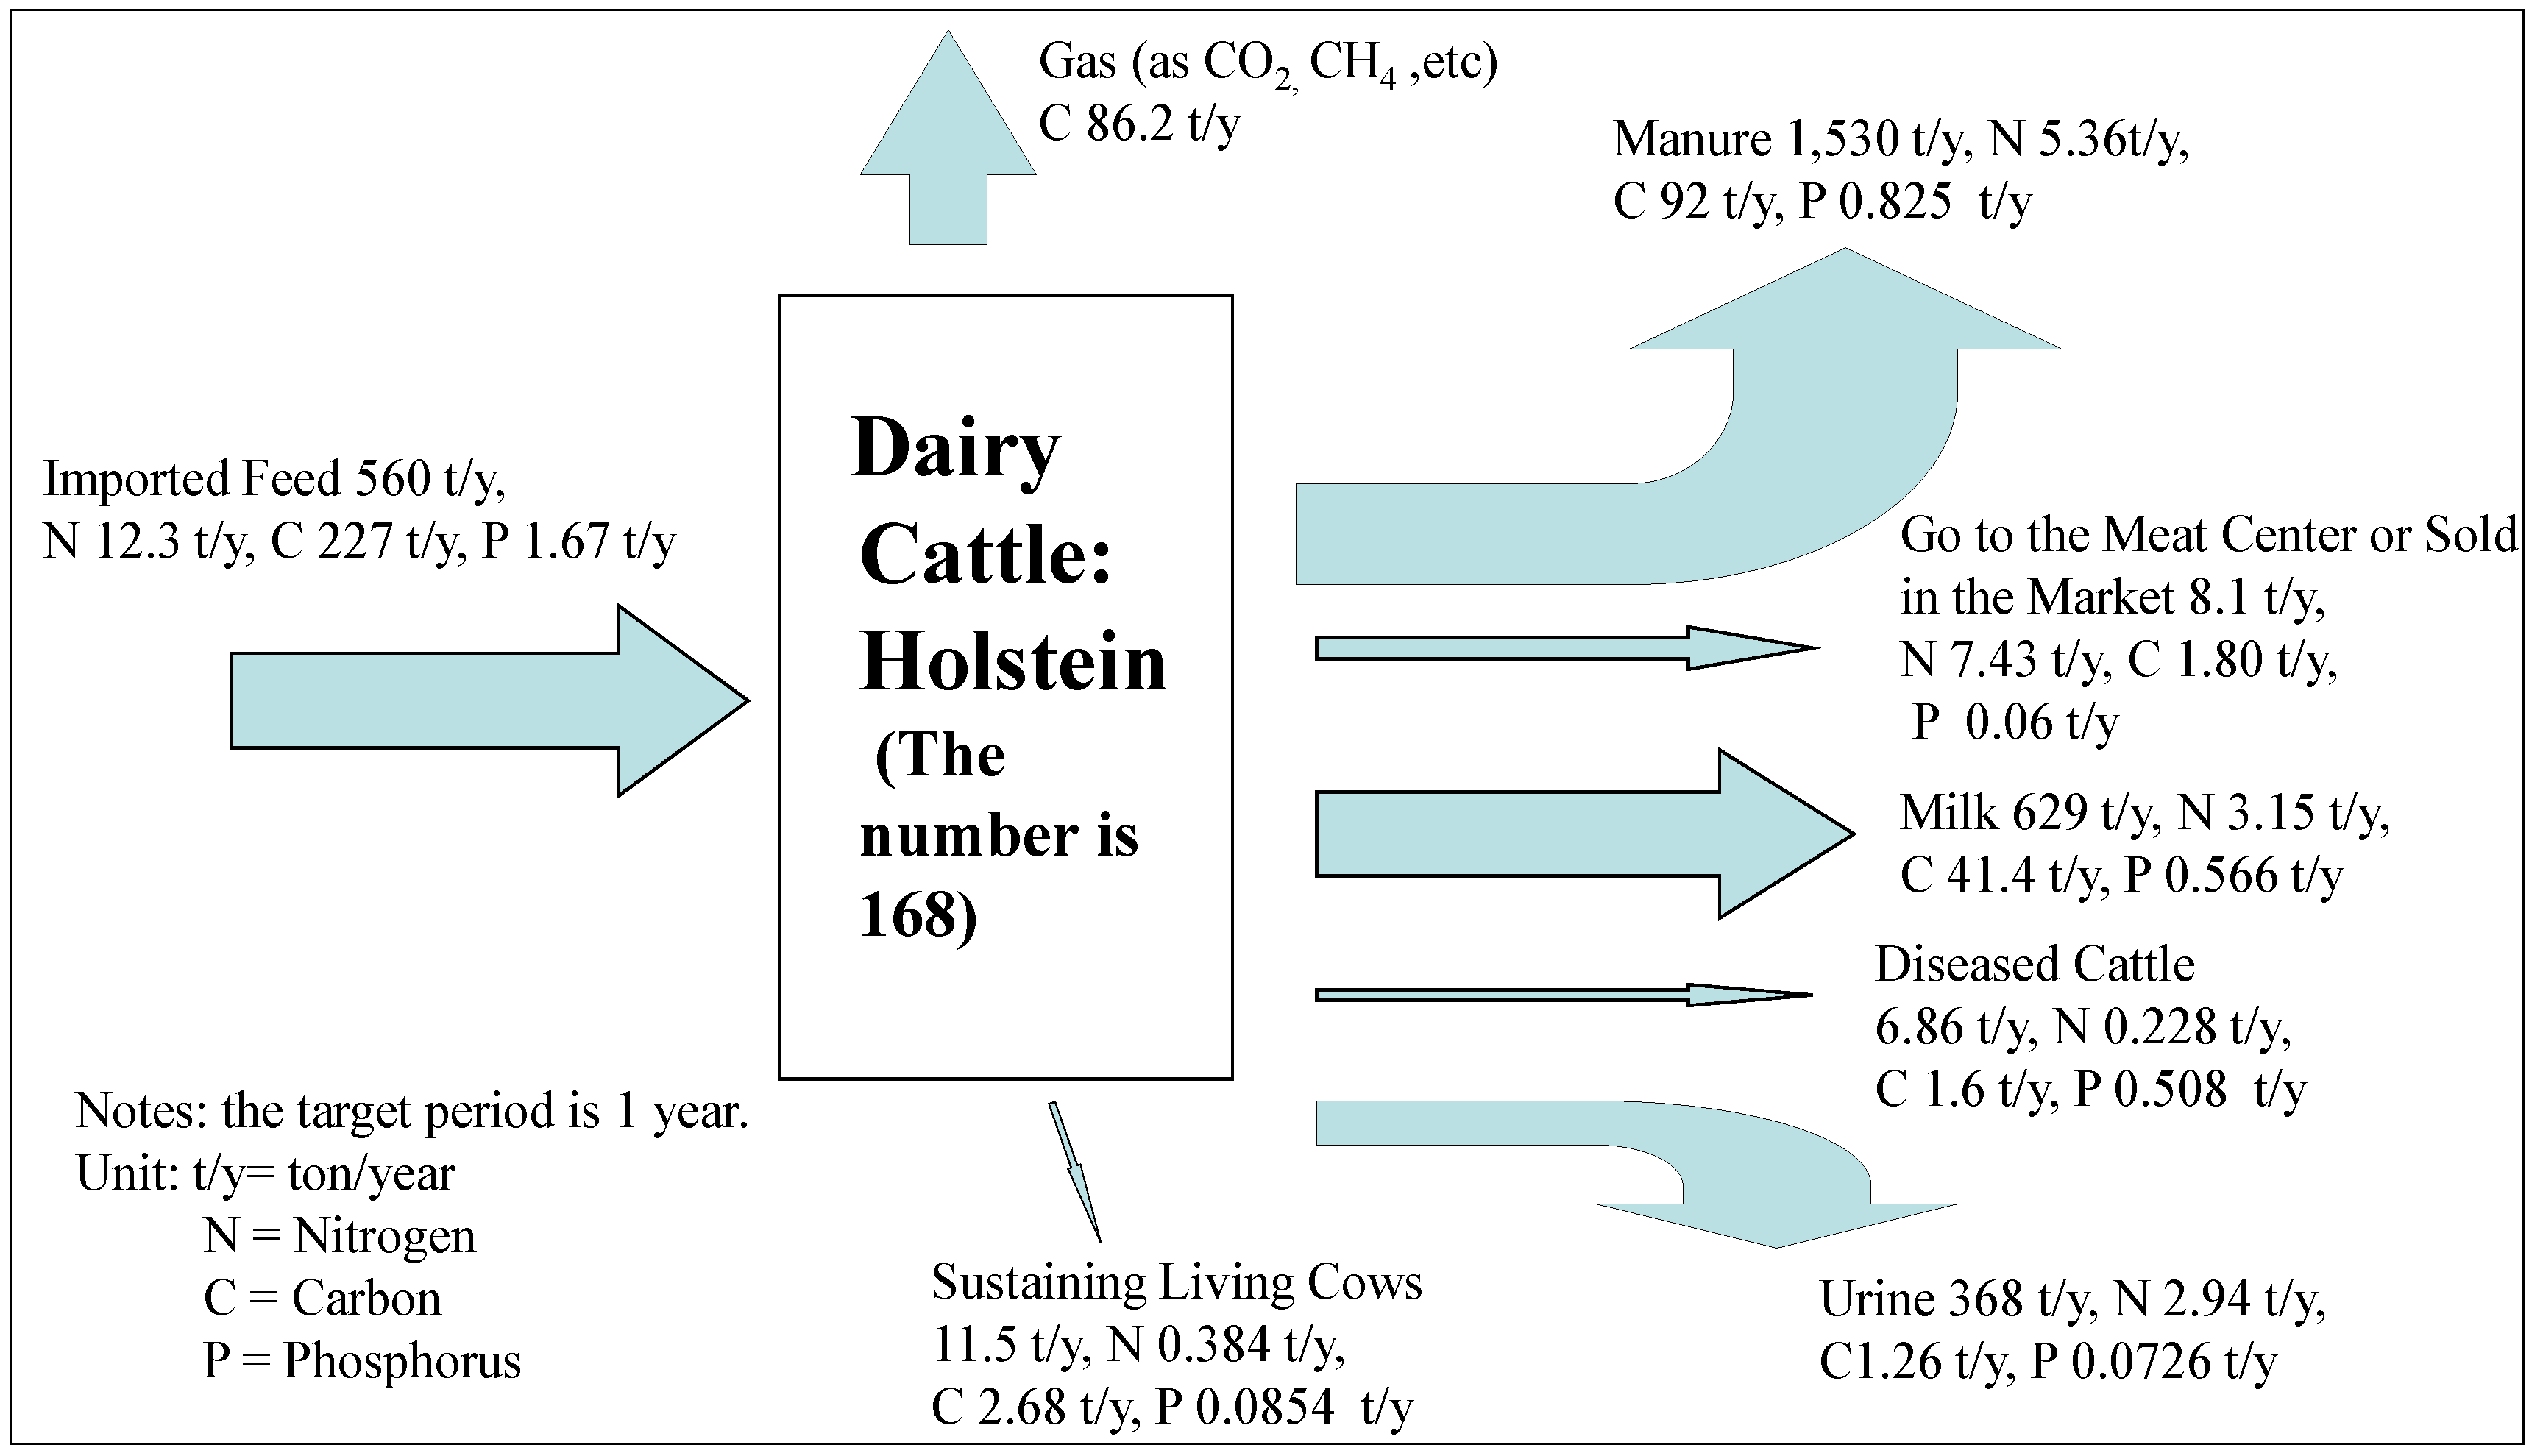
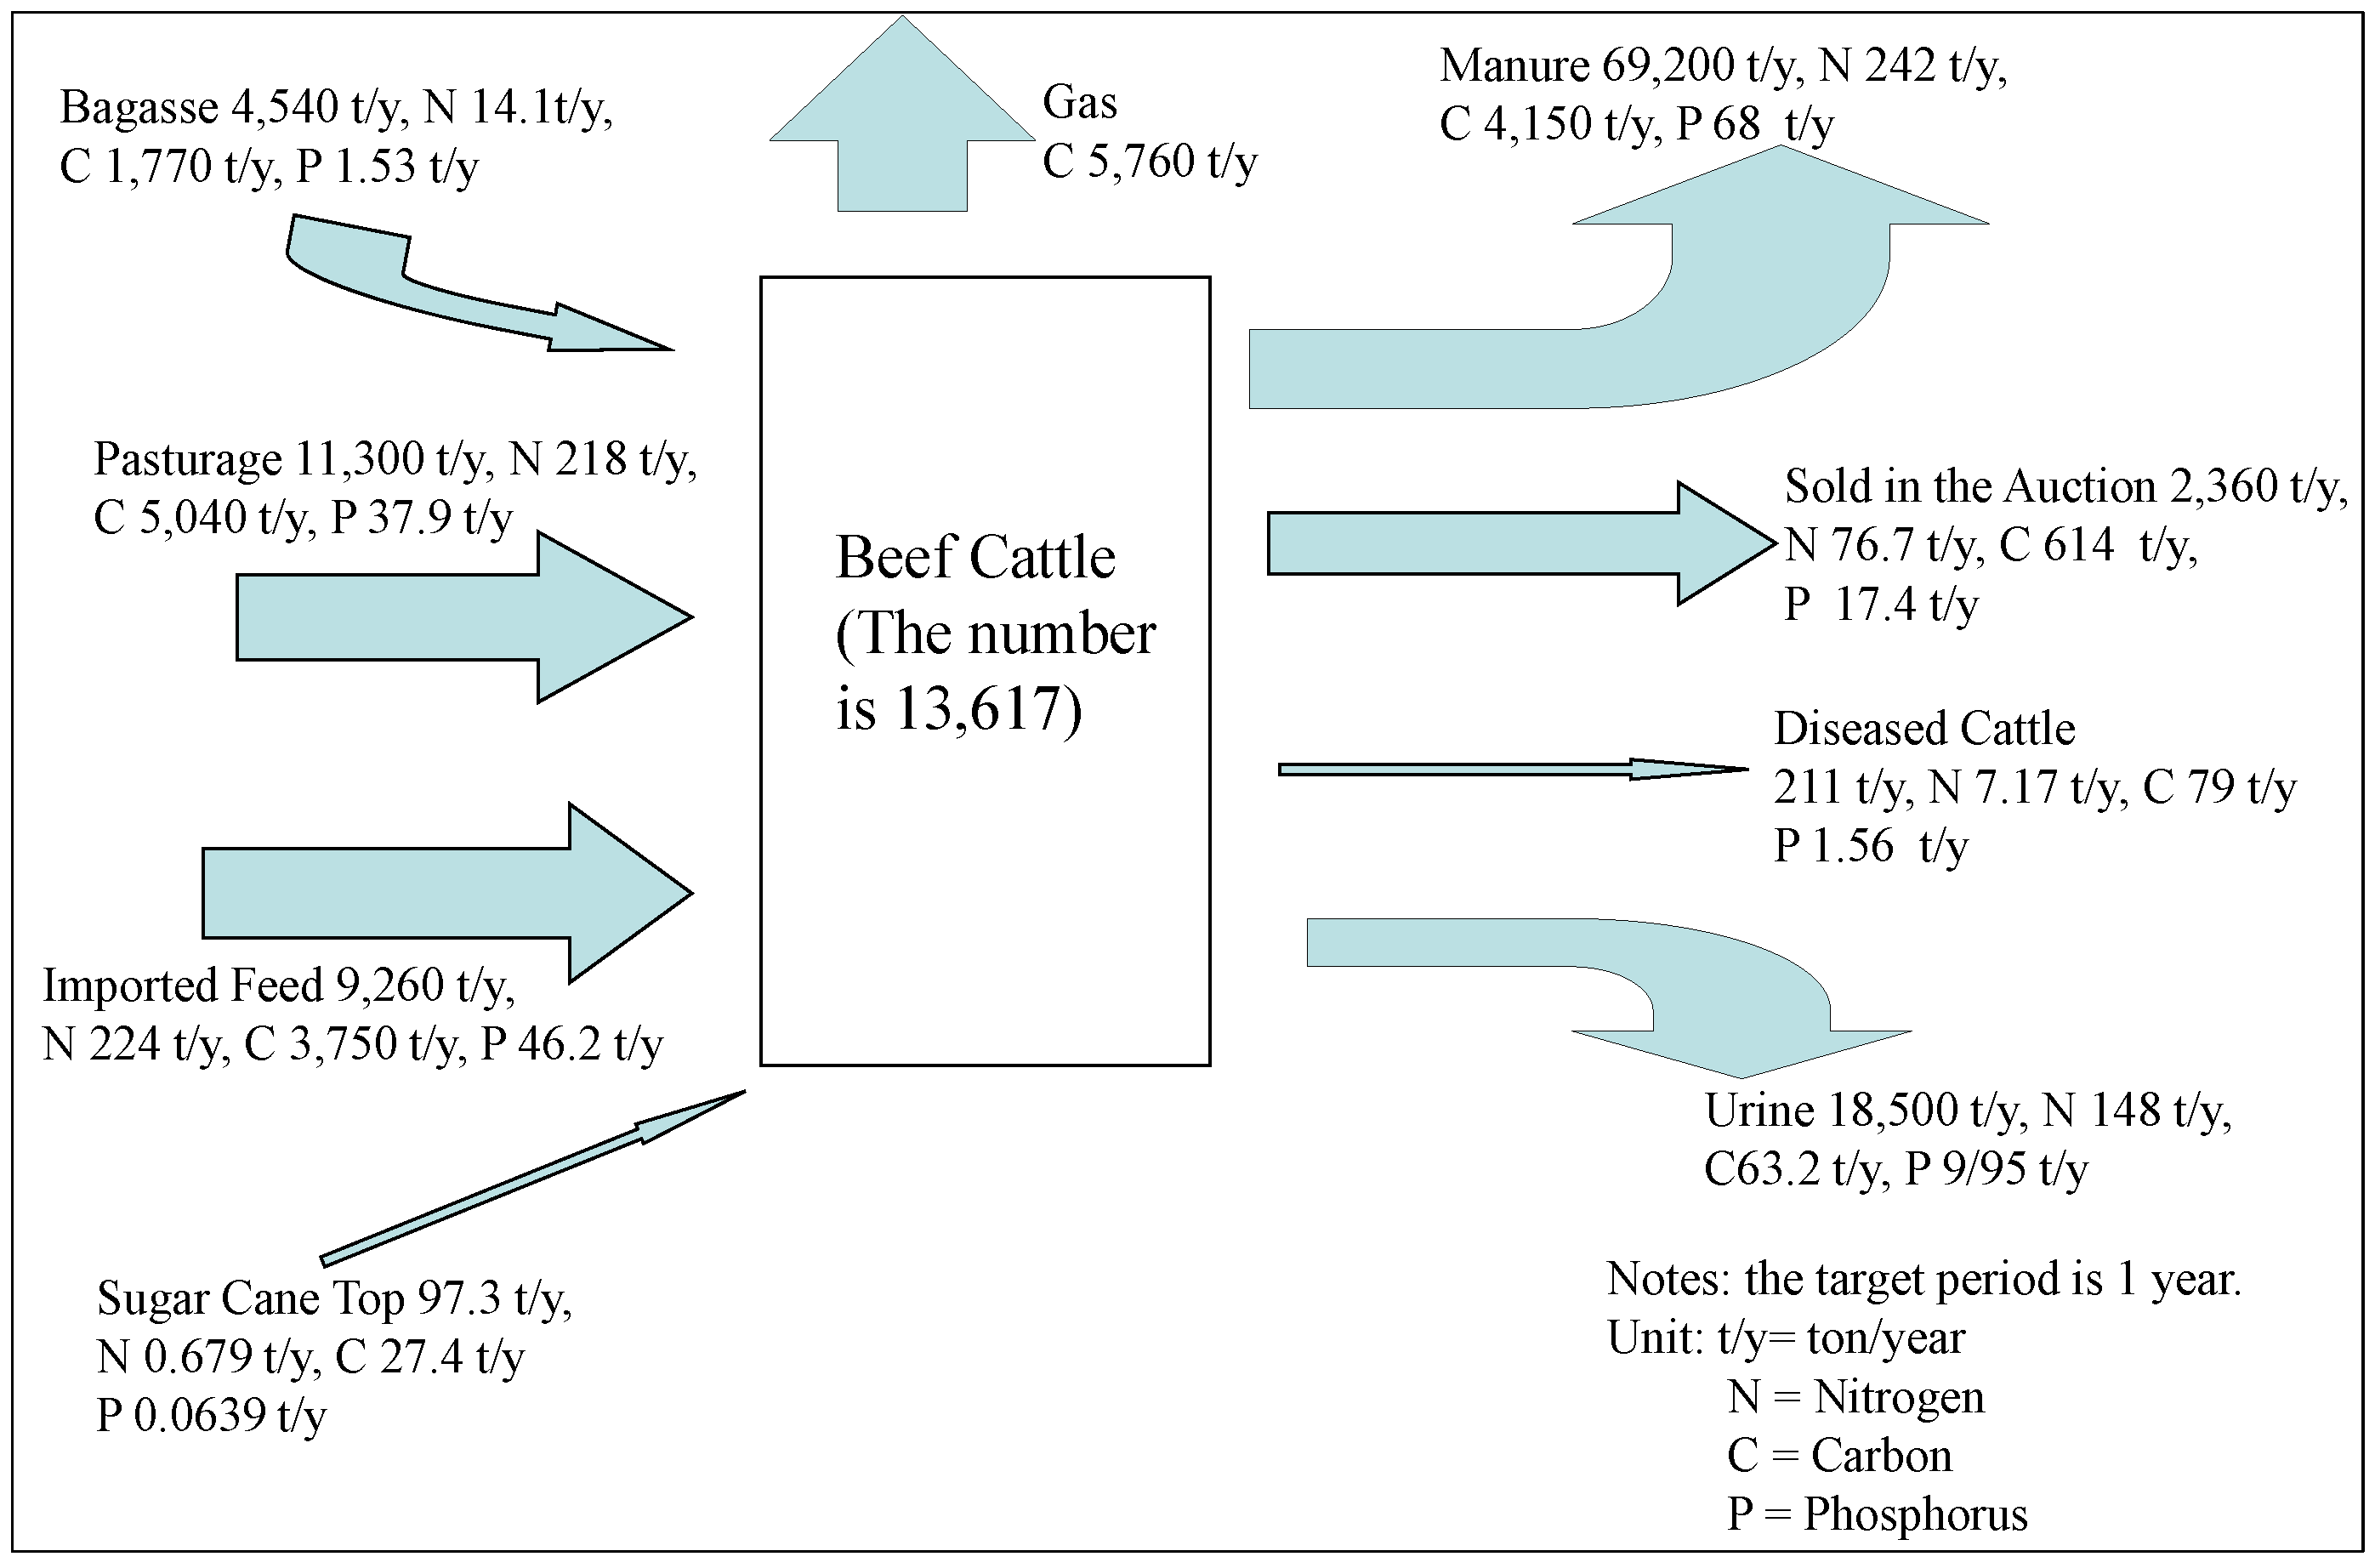
We will now provide MFAs for three types of stockbreeding. The present research first examines the dairy cattle. One farmer raises dairy cattle and provides the milk to schools. Dairy cattle are fed imported concentrate feeds and imported roughages. The reason for imported feed is that dairy cattle (Holstein) eat pasturage grown in cold climates, such as Italian rye grass, alfalfa, and other grasses, few of which are cultivated on Miyakojima Island. As discussed above, concentrate feeds are not cultivated on Miyakojima Island. This agricultural system is not reliably sustainable, as the farmer went bankrupt in September 2013, partially because procurement of all feed depended on the resources coming from outside of the island. The MFA for dairy cattle is shown in
Figure 3 [
2,
3,
5,
8,
9,
11].
Figure 3.
MFA for the dairy cattle.
Figure 3.
MFA for the dairy cattle.
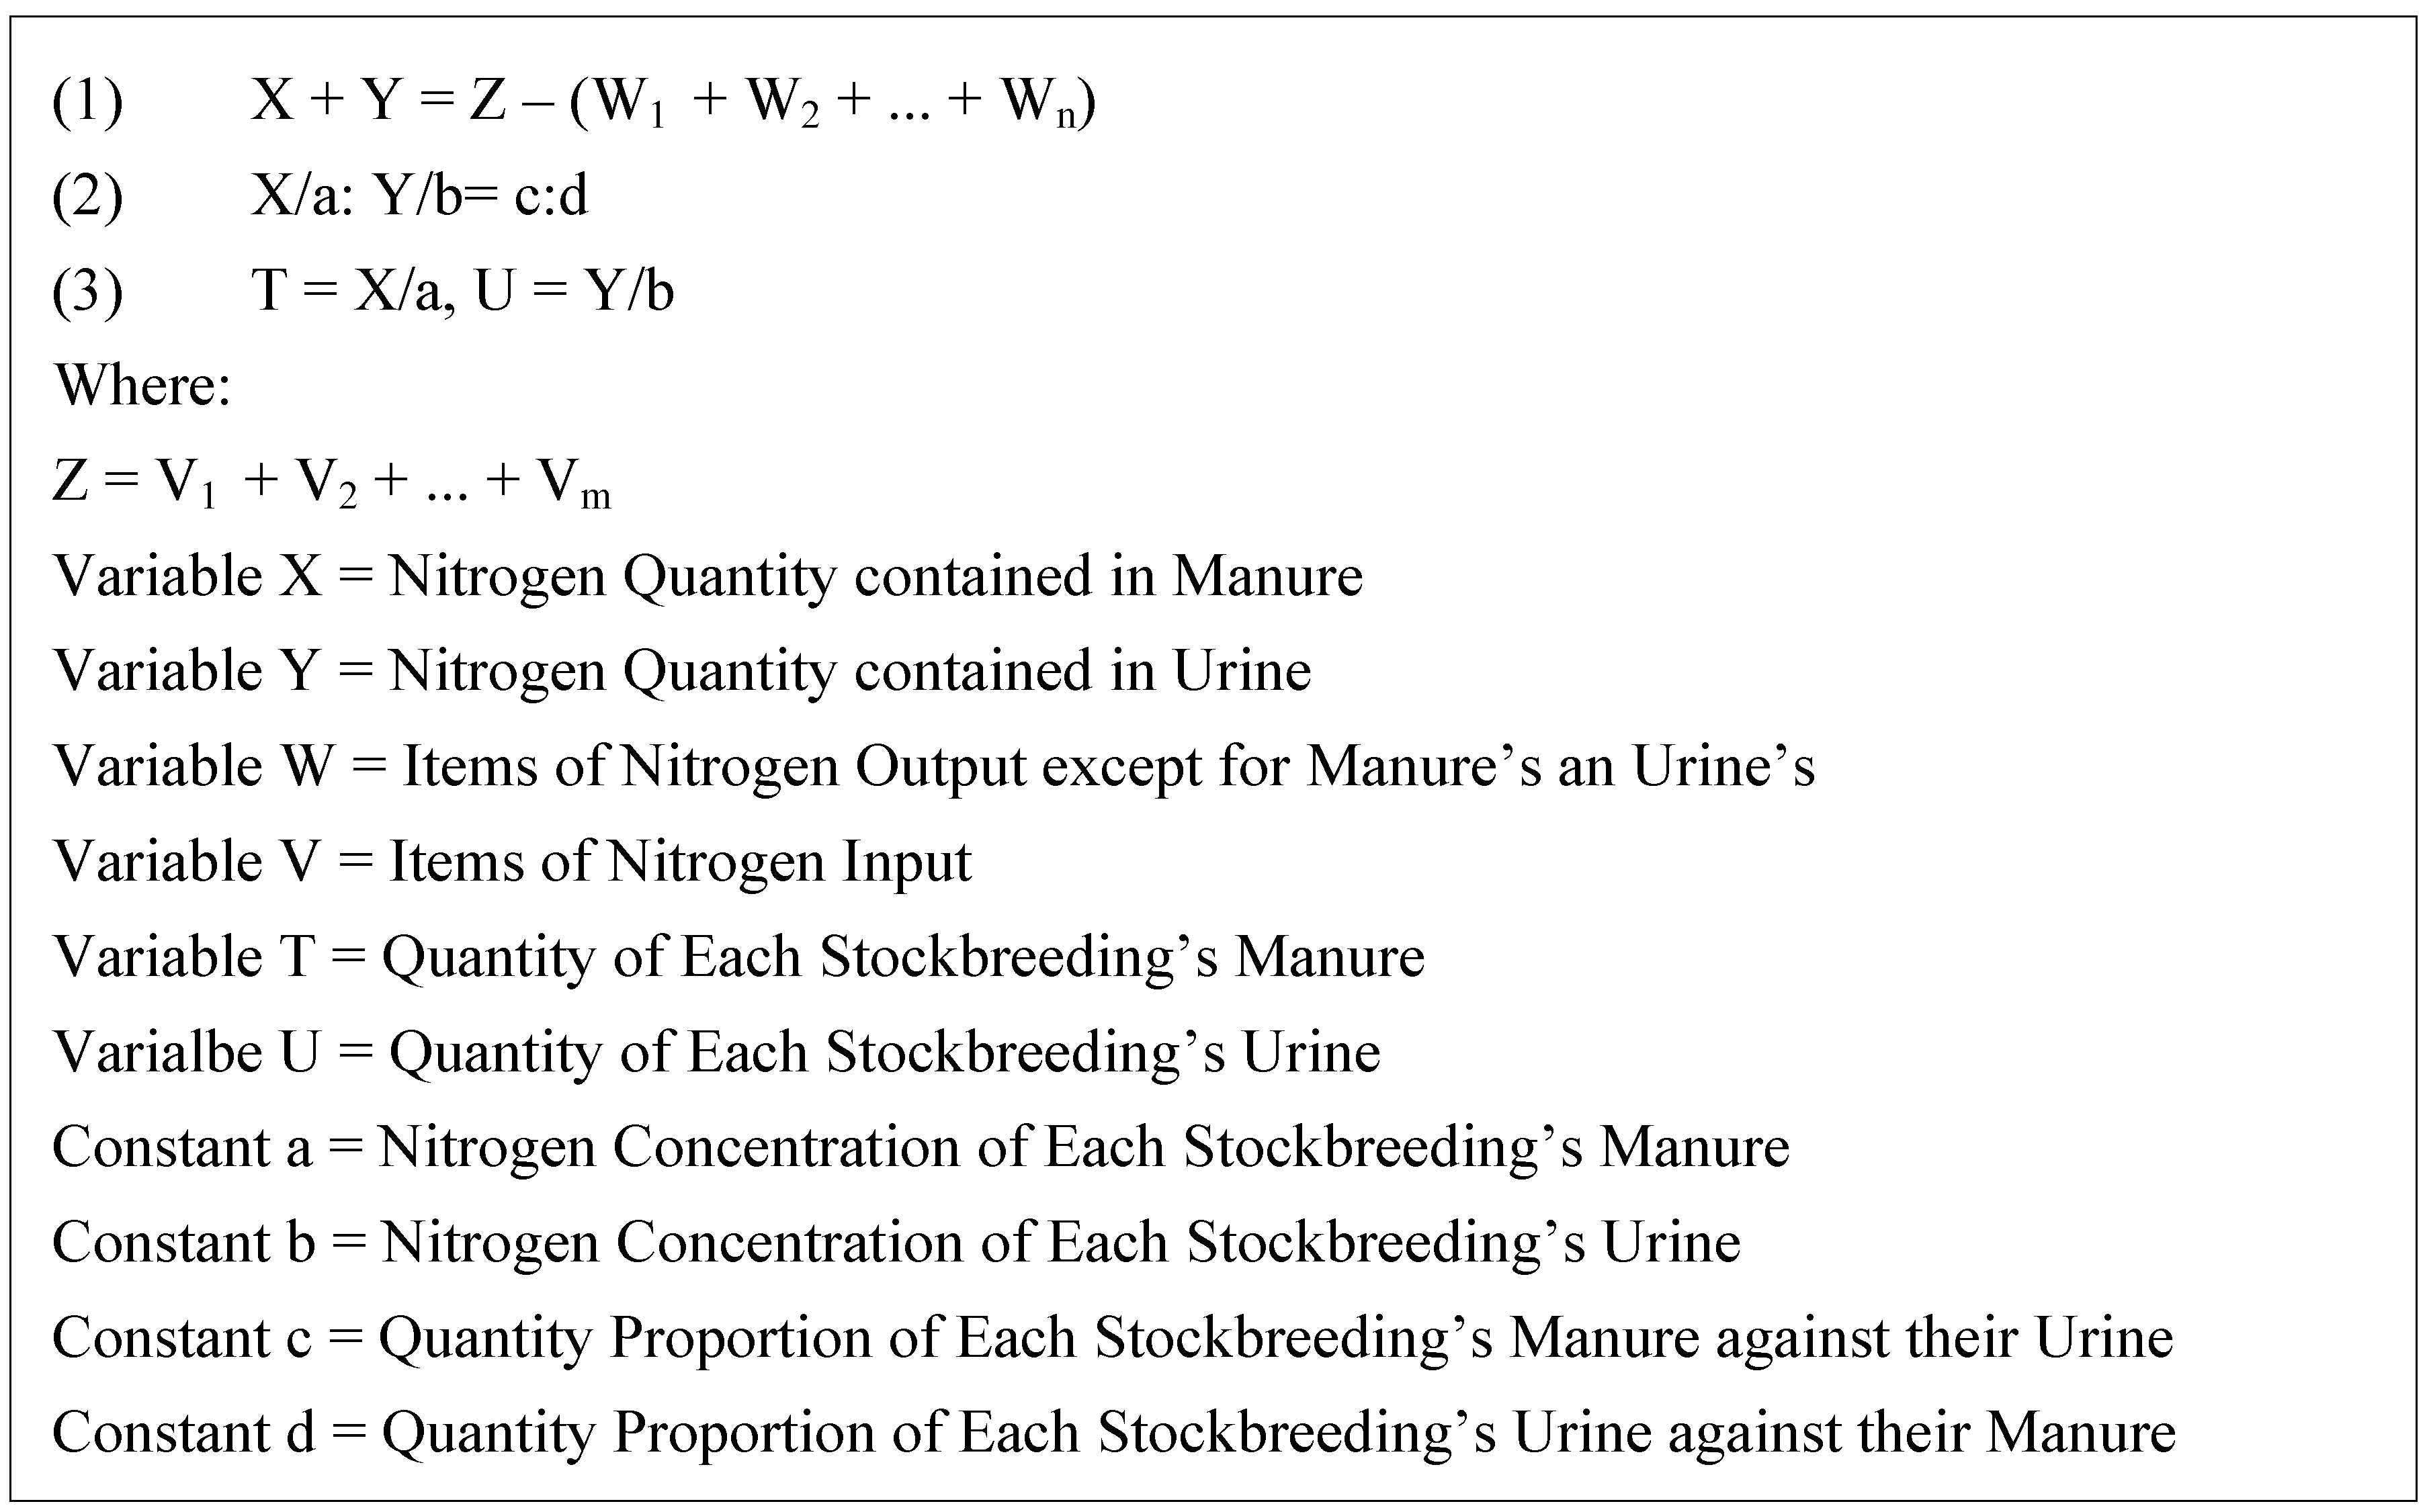
To obtain the quantity of manure from dairy cattle, we use an improved formula to obtain the quantity of manure as well as urine production of Stockbreeding. See
Appendix 3. This formula is proposed in the previous research “An Evaluation of the Cattle Raising Business in Miyakojima Island: Material Flow Analysis about Four Types of Cattle Raising [
17]”, but is slightly adjusted to the need of the present study: the previous research only deals with cattle production whereas the present research deals with dairy cattle, poultry and hogs as well.
When we actually obtain the quantity of each stockbreeding manure and urine from the formula, we need to use the values of
Table 3 as well [
8,
9,
10]:
Table 3.
Nitrogen concentrations and proportional quantities of stockbreeding of manure and urine.
Table 3.
Nitrogen concentrations and proportional quantities of stockbreeding of manure and urine.
| | Nitrogen Concentration of Manure: Wet Matter | Nitrogen Concentration of Urine: Wet Matter | Proportion of Each Type of Stockbreeding’s Manure against their Urine: Wet Matter | Proportion of Each Type of Stockbreeding’s Urine against their Manure: Wet Matter |
|---|
| Beef Cattle | 0.0035 | 0.008 | 15 | 4 |
| Chicken | 0.0115 | N/A | 1 | N/A |
| Dairy Cattle | 0.0035 | 0.008 | 25 | 6 |
| Pigs | 0.0074 | 0.004 | 1 | 1 |
The quantity of manure production is 25 kg/day, according to “Stockbreeding Great Encyclopedia” [
9]. The quantity of manure for dairy cattle for this research is 20kg/day but it would be within acceptable range. The MFA includes manure production when dairy cattle are still calves. Therefore, the quantity of the manure is expected to be smaller. “Sustaining living cows” in the MFA means the substances which are required to sustain the living dairy cattle. The lifespan of dairy cattle is 8 years. Feed is imported from outside the island, while meats and dairy cattle can be exported from the island.
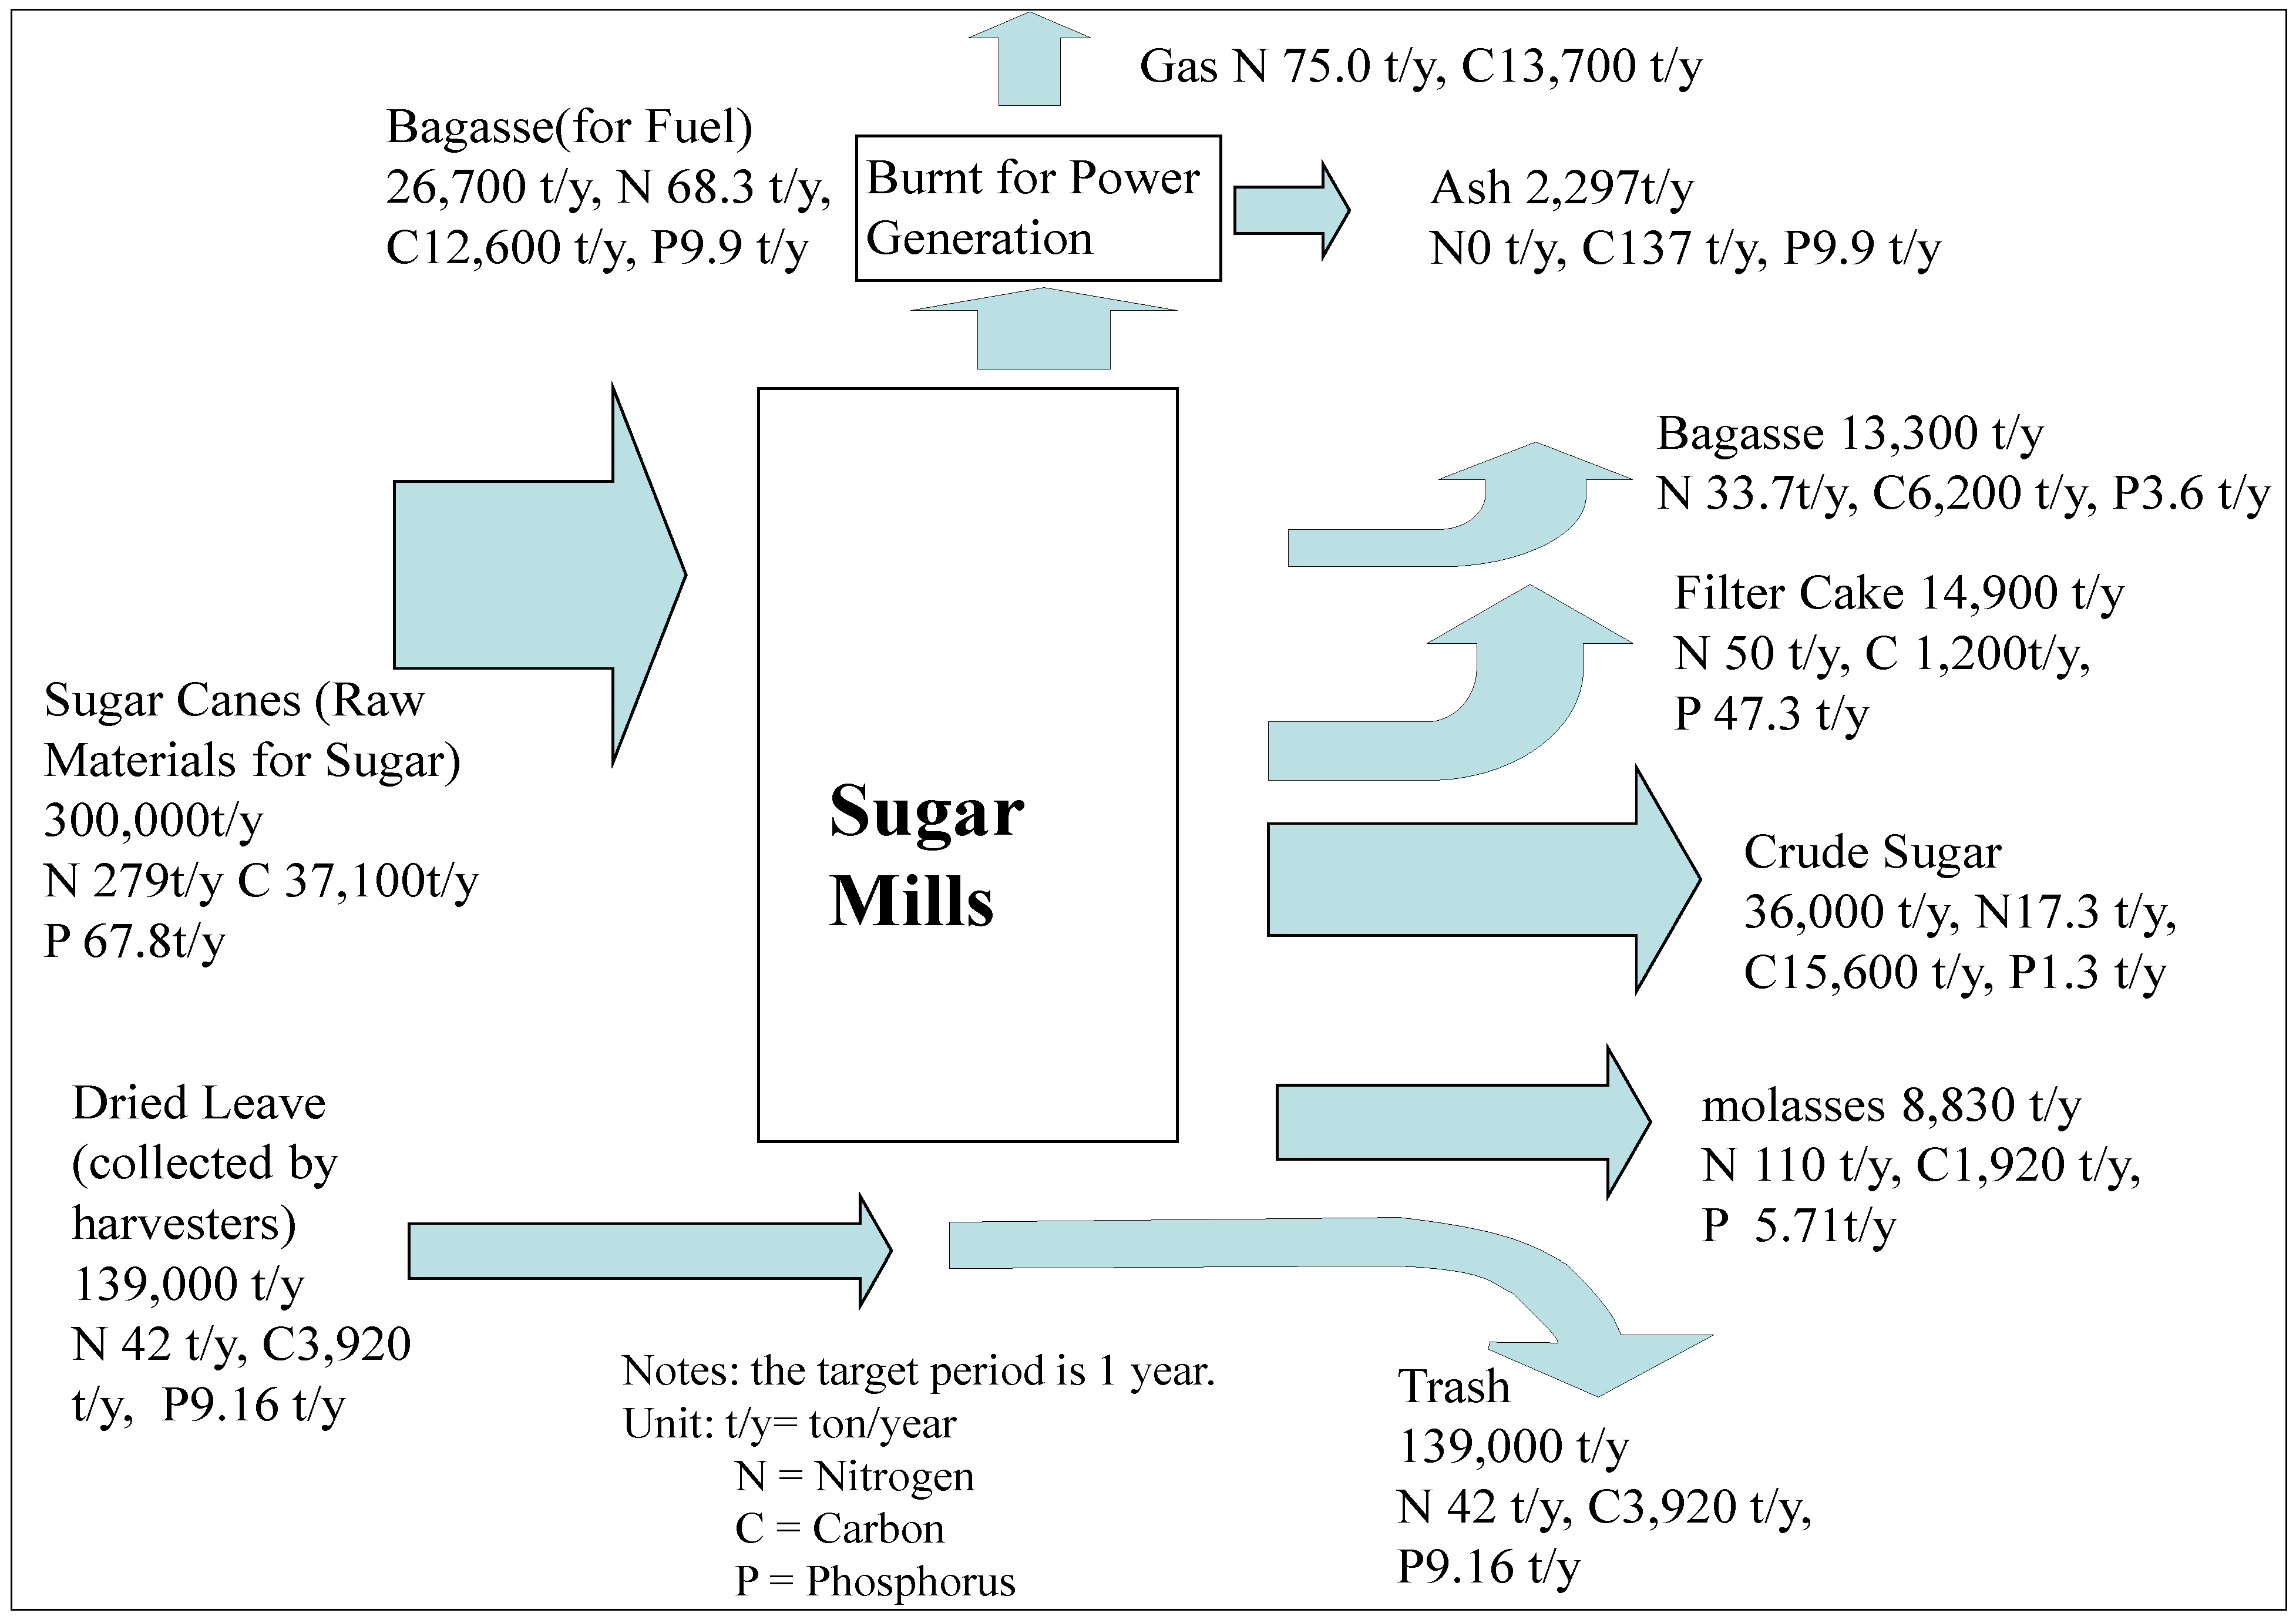
Now we will take a look at the MFA of sugar mills in
Figure 4 [
2,
3,
5,
11] prior to looking at the other types of stockbreeding. There are three sugar mills on Miyakojima Island that are run by two companies. Most of sugar cane is harvested manually but some farmers use harvesters. Harvesters also collect dried leaves from the sugar cane fields but they are not processed in sugar production. They go out from the sugar mills as trash. Sugar production generates crude sugars, molasses, bagasse, and filter cakes. Crude sugars go to sugar mills off the island, which can create white sugar. Molasses is purchased as raw material for stockbreeding feeds by a buyer from the outside of the island because it has a sweet odor and useful minerals for stockbreeding feeds. Crude sugar and molasses are exported from the island. Much of the bagasse is used as fuel for power generation and meets almost all electricity needs for sugar production operations. Because ashes generated from power generation contain useful minerals for agriculture, they are plowed under by farmers or are used as raw materials for composting. A part of the rest of bagasse is consumed as a cattle feed but most of it is plowed under or is used as raw material for composting. Trash and filter cakes are plowed under or are used as raw materials for composting.
We will clarify MFA for poultry breeding and raising. See the
Figure 4 [
2,
3,
8,
9,
11].
The majority of chickens, 30,598 out of a total of 31,738 chickens, are raised by one large farm. They are fed with imported concentrate feeds. Because chickens can only eat cereal, they are fed concentrate feeds, which consist primarily of cereals like corn. Miyakojima Island is not suitable for cultivation of cereals other than sweet potatoes. The present research does not discuss whether poultry breeding and raising with sweet potatoes is possible or not. Chickens are raised primarily for eggs, not meat. In FY 2010, farmers chose to dispose of half of the chickens as industrial waste rather than consuming them as meat. However, according to private communications with the large farmer, all chickens are currently consumed as meat. To sustain 31,738 chickens per year, the materials shown in
Figure 5, “Sustaining Living Chicken”, are necessary. Stockbreeding of an animal that has a life cycle longer than one year needs this type of substance output in the MFA.
Figure 4.
MFA for sugar mills.
Figure 4.
MFA for sugar mills.
Figure 5.
MFA for the poultry breeding.
Figure 5.
MFA for the poultry breeding.
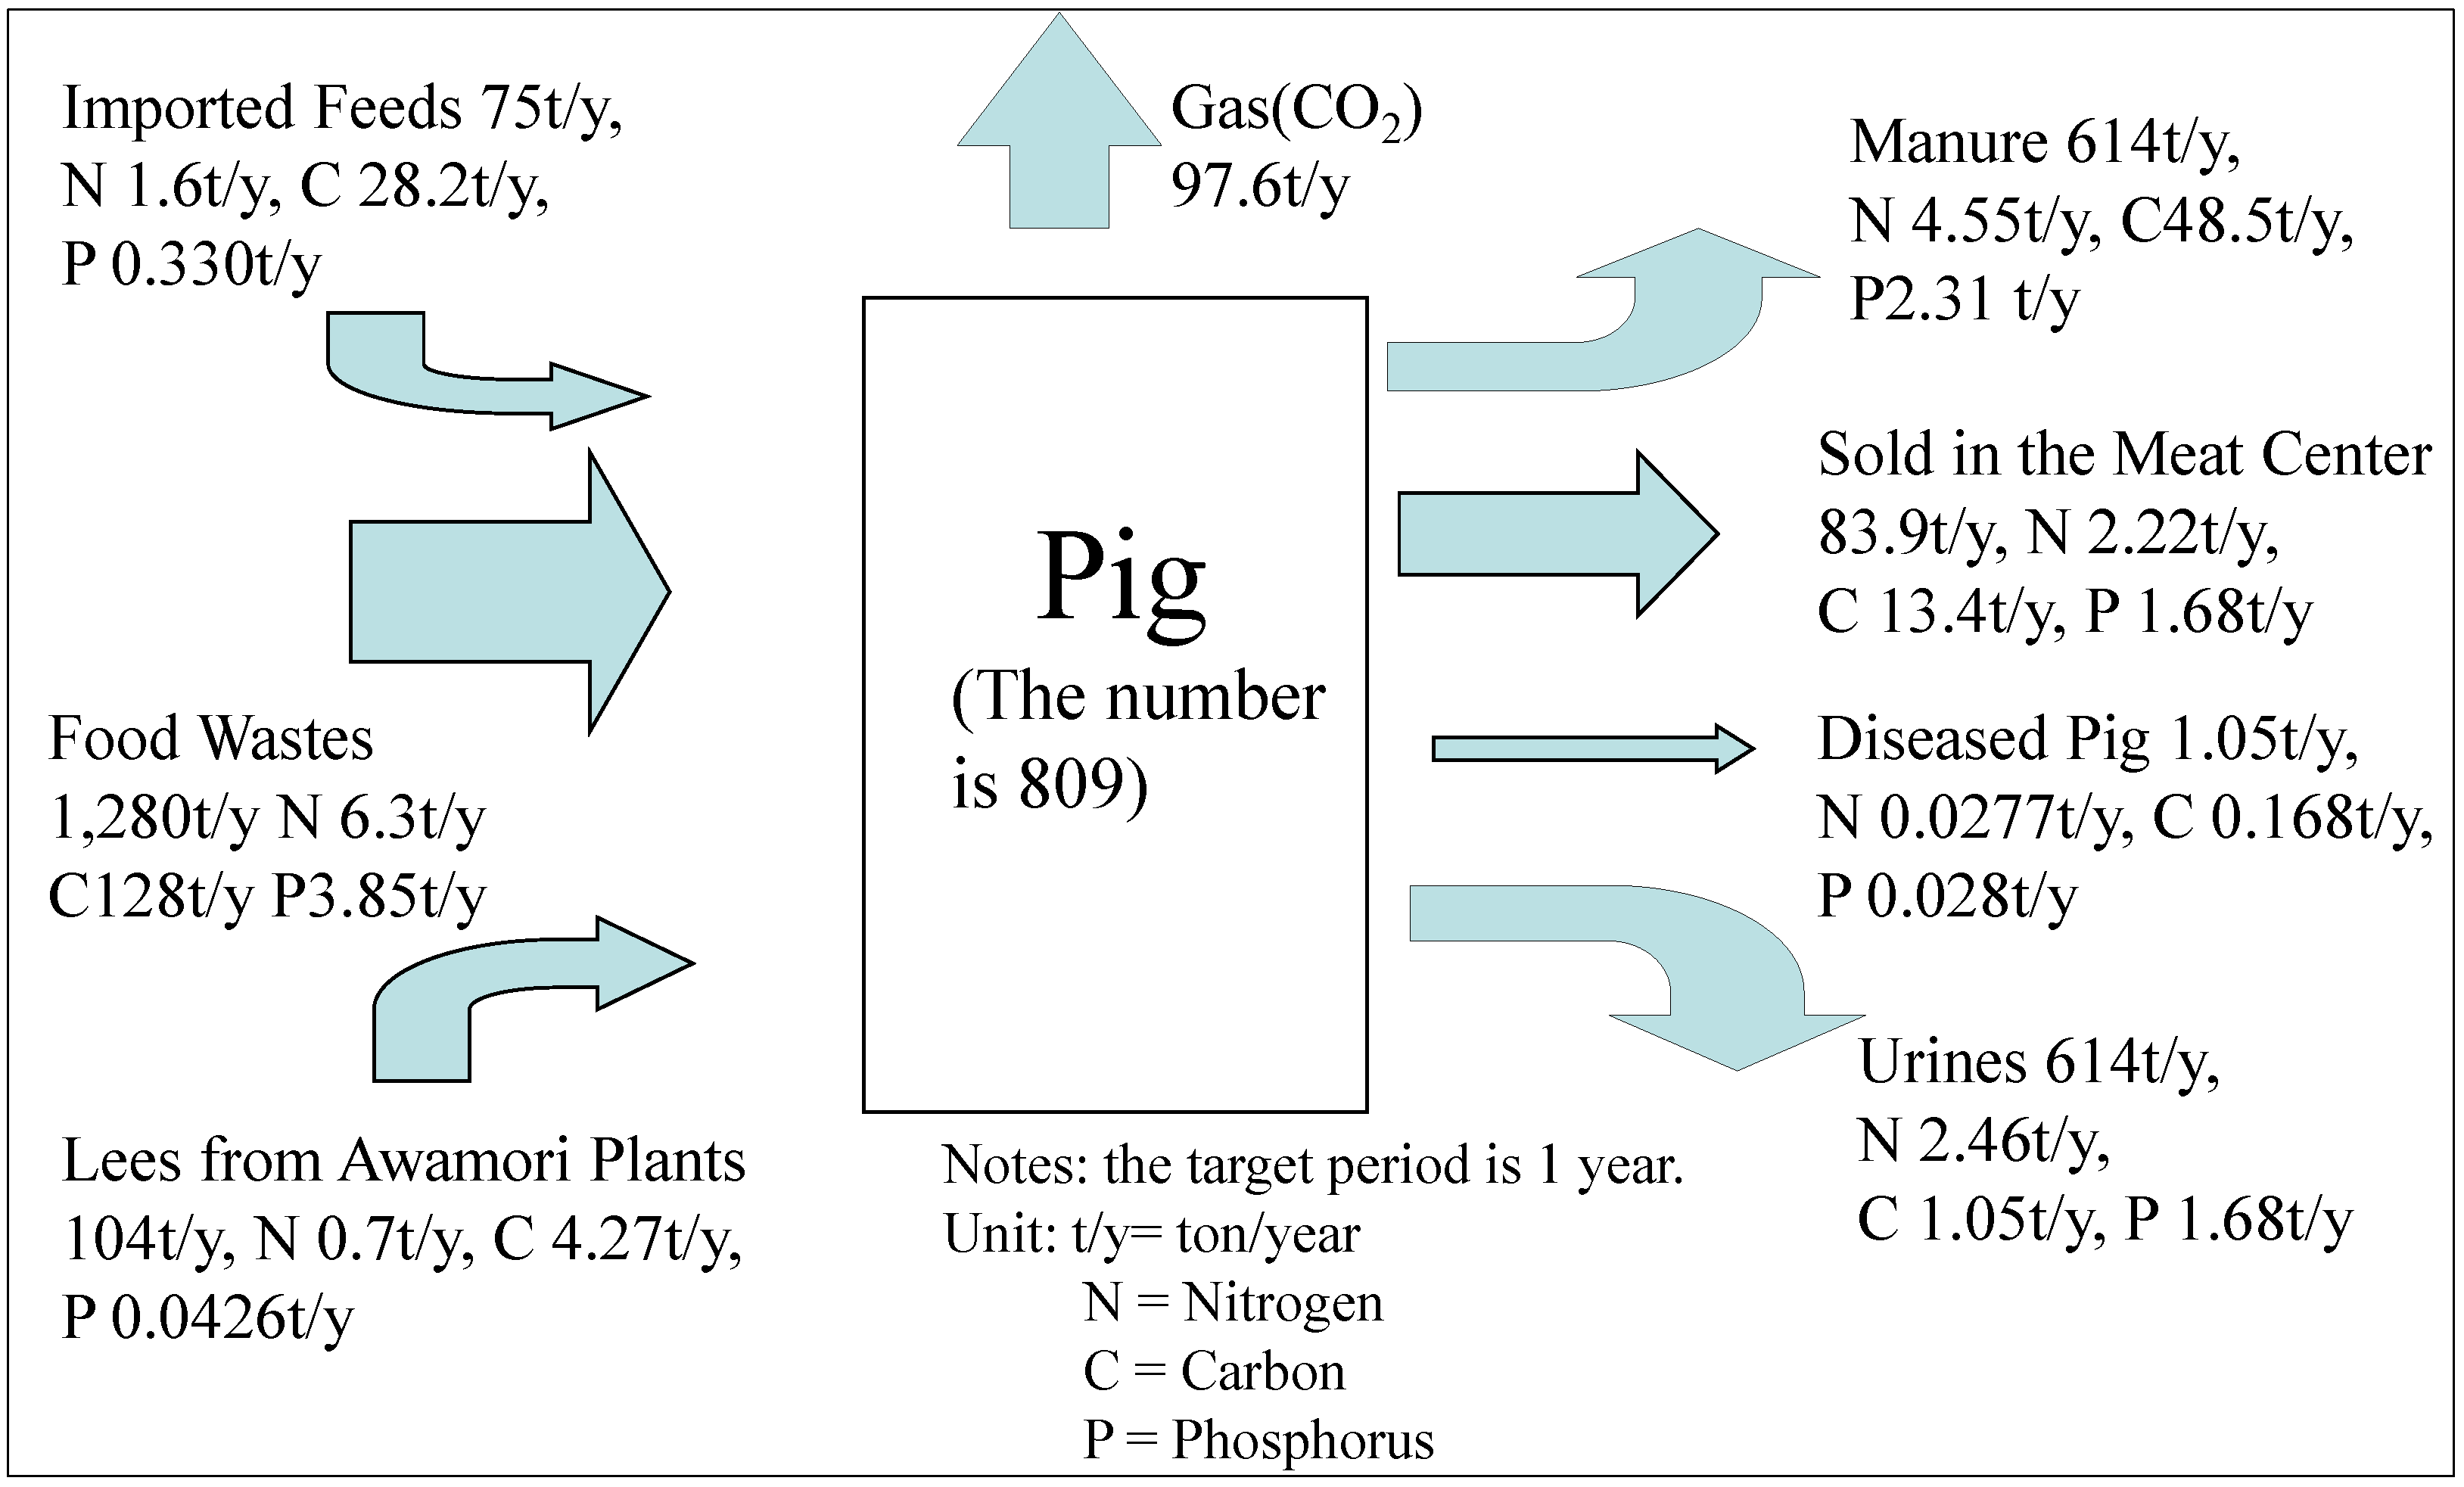
We next show the MFA for hog breeding and raising in
Figure 6 [
2,
3,
6,
7,
8,
9,
10,
11,
12,
15,
16]. Pigs on Miyakojima Island are primarily fed food wastes from restaurants, supermarkets, hotels, and so on and do not need to be fed imported concentrate feeds. However, lees from Awamori production, which is done with imported broken rice from Thailand, is given to them. Imported feeds are concentrate feeds created from corn, wheat bran, food oils, fish, pork, and so on. The purpose of the concentrate feed provision is to reduce fats from pigs before they are shipped to the Miyako Meat Center. This can raise the price of pigs. The quantity of manure production is 2.08 kg/day. According to “Stockbreeding Great Encyclopedia” [
9], the quantity should be 3kg/day but it would be within the acceptable range. The MFA includes manure production when pigs are still piglets, so the quantity of the manure is expected to be smaller. The quantity after the storage process will become 1 kg/day according to a farmer in Okinawa Main Island. If the quantity of raw manure is 3 kg/day, the required quantity loss ratio quantity of manure in the storage process would be 66.7%.
Figure 6.
MFA for the hog breeding and raising.
Figure 6.
MFA for the hog breeding and raising.
The primary purpose of the discussion above is to determine the quantity of biomass resources, i.e., manure from stockbreeding, which can go to sugar cane. Now we can determine other biomass resources with the MFA for sugar mills, i.e., residues from sugar mills such as bagasse, filter cakes, trash and ash. Other biomass resources which go to sugar cane, such as pruned trees, methane fermentation residues from Awamori plants, sludge from sewage plants, and green manures, are determined in the later part of this section. Note that not all biomass resources go to sugar cane. We will discuss the quantity of biomass resources that go to sugar cane at the end of this section.
Next, we would like to demonstrate the MFA of Miyakojima City Resources Recycling Center. The purpose is to establish the fraction of materials and substances that were lost in the process of composting conducted in three composting facilities of Miyakojima Island. We also need to establish the quantity of loss in the storage process. Note that loss in the storage process is caused by decomposition of microbes: organic matters are decomposed and primarily emit carbon, nitrogen, hydrogen and oxygen gas. Private communication with the stockbreeding farmers revealed that mixing manure for composting is not conducted except in the three composting facilities. For examples, most cattle breeding and raising farmers cultivate sugar cane at the same time as sugar cane cultivation and therefore they use manure as fertilizer for sugar cane cultivation. They place manure in the storage without mixing procedures for composting and plow under the manure for the sugar cane fields one month prior to planting sugar cane so that substances contained in the manure that are harmful to the sugar cane growth are decomposed by the bacteria in the soil. A few cattle breeding and raising farmers and one poultry breeding and raising farmer use two composting facilities with their manure for sale or for bagasse which is used as bedding material: one composting facility always keeps bagasse to exchange it for cattle manure. Another composting facility is not able to obtain any manure from stockbreeding farmers and so it uses the fishery residues instead.
First, we try to establish the quantity loss in the storage process. One farmer raises 200 calves and 300 breeding cows (beef cattle); the quantity of raw manure was ascertained in previous research [
17]. Also the quantity of manure stored is kept in the administrative records of the farmer: the quantity of raw manure is 2,440 t/y while the quantity of stored manure is 1,500 t/y. Therefore we estimate that the loss ratio of quantity of beef cattle and dairy cattle is 38.7%. Since there are no reliable records on Miyakojima Island, we adopt the value from “Estimation of Flow Sheet and Load Unit to Farm Soils of Nitrogen Excreted by Animals on the Basis of the National Statistical Data” regarding the nitrogen loss ratio [
18]. Note that we adopt the value of dairy cattle for the beef cattle
i.e., 10.3% because the loss ratio of dairy cattle is greater than that of beef cattle and because the storage term of beef cattle is thought to be longer than any other type of stockbreeding according to personal communications with stockbreeding farmers.
Regarding the loss ratio for chickens, the quantity of raw manure of the large farmer is 1,100 t/y while the quantity of stored manure is 903 t/y: therefore the loss ratio for chicken manure production is 19.1%.
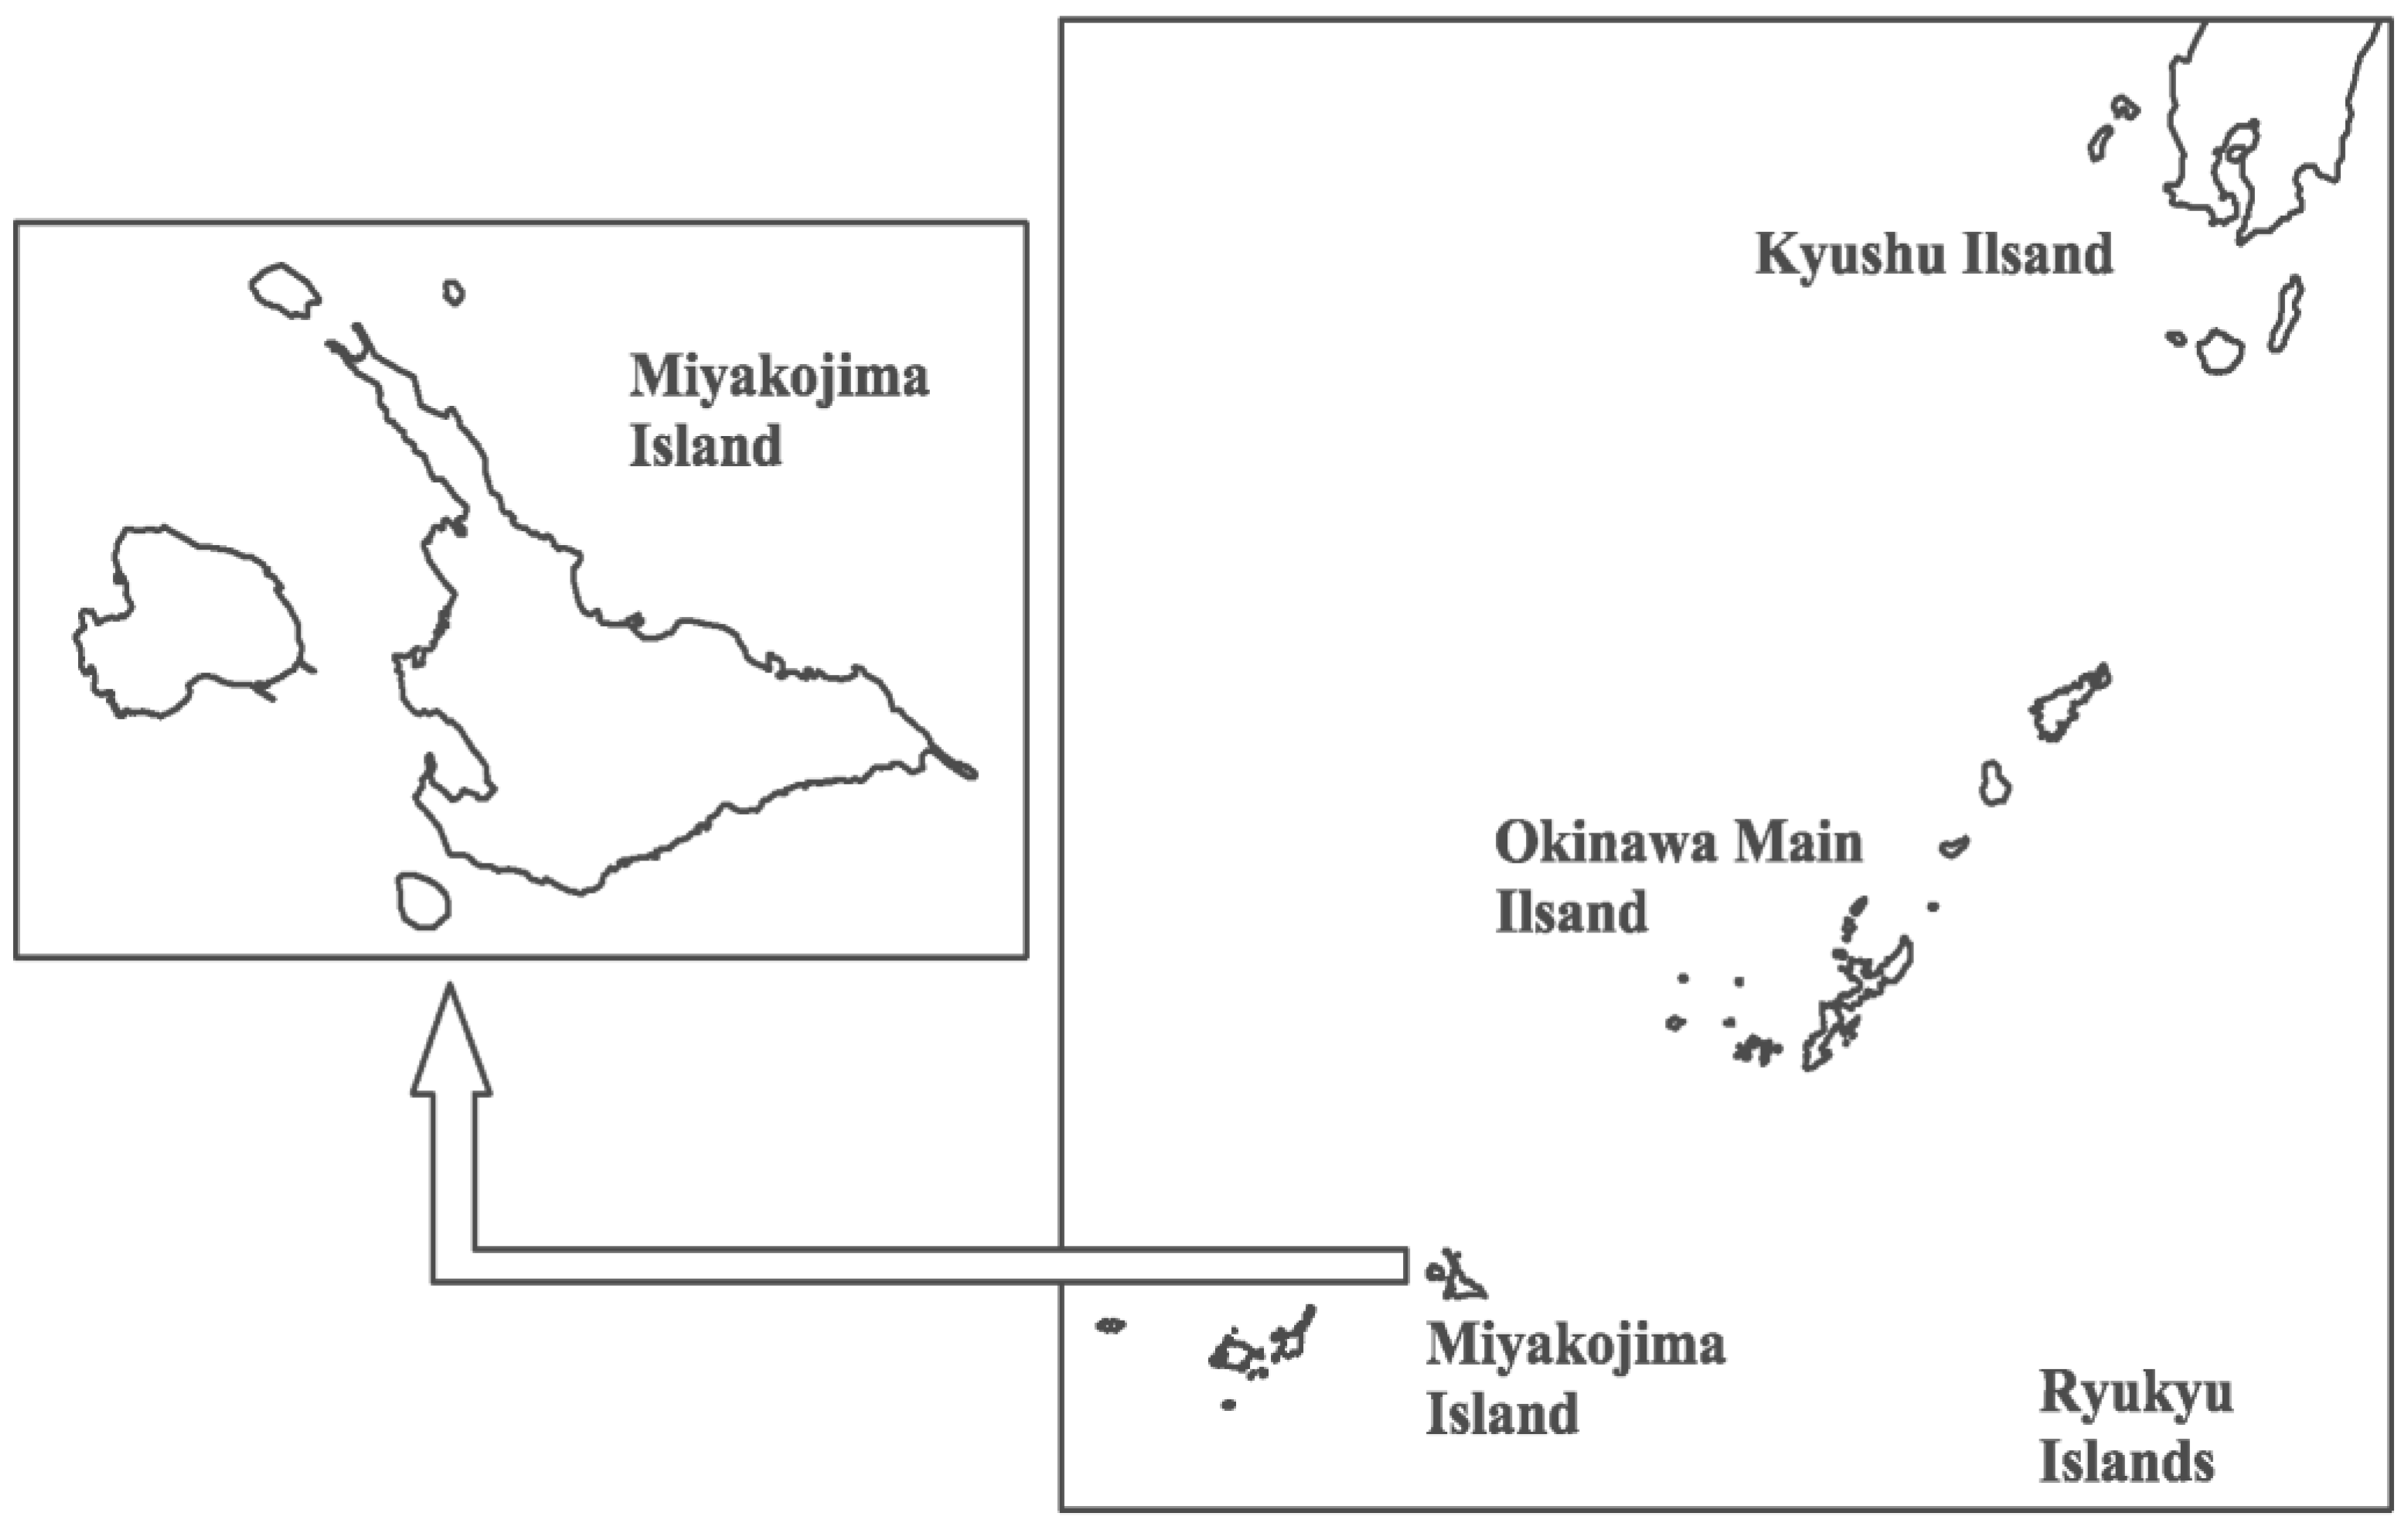
Regarding the loss ratio for pigs, we were not able to obtain the information on Miyakojima Island but obtained it from a farmer on Okinawa Main Island (see
Figure 1) who raises hogs with food wastes and was able to provide the relevant information: The quantity of stored manure is 295 t/y as shown in
Figure 6, and the quantity of raw manure of hog breeding and raising is 737 t/y. Therefore the loss ratio for pigs is 59.9%.
Note that the storage period for chickens are considered to be 0.5 month. But the storage period of the beef cattle/dairy cattle and pigs is 5–6 month, and is primarily used as the basic fertilizer for sugar canes, which are planted one time a year. Almost all manure from chicken goes to two composting facilities once per month. Therefore the loss ratio for chickens is relatively low when compared with other loss ratios in
Table 4: however, because research studies for loss ratios of stockbreeding manure are few in number, we think further research will be necessary.
Table 4.
Quantity and substance loss ratio of manure in the storage process.
Table 4.
Quantity and substance loss ratio of manure in the storage process.
| | Quantity (%) | Nitrogen (%) | Carbon (%) | Phosphorus (%) |
|---|
| Beef Cattle / Dairy Cattle | 38.7 | 10.3 | 13.1 | 0% |
| Chicken | 18.1 | 8.4 | 10.7 | 0% |
| Pig | 59.9 | 14.7 | 18.7 | 0% |
Regarding the carbon loss ratio of composting process of manure and urine, this information is available in the research “Carbon, Nitrogen Balances and Greenhouse Gas Emission during Cattle Feedlot Manure Composting” [
19]. The proportion between nitrogen loss and carbon loss in the research is applied to the quantity of carbon and nitrogen quantity for each type of stockbreeding in
Figure 3,
Figure 4,
Figure 5,
Figure 6 and
Figure 7. Although the result is obtained from cattle breeding and raising, it is applied to the other types of stockbreeding for the convenience of this discussion.
In this research, when the nitrogen loss is 8.3 kg, the carbon loss is 174 kg. Accordingly, the carbon loss ratios are obtained as shown in the
Table 4.
Table 5 shows the nitrogen, carbon and phosphorus concentrations of stockbreeding manure after the storage process. Manure from each stockbreeding loses total quantity of nitrogen and carbon. However, concentrations themselves are increased by the storage process.
Table 5.
Nitrogen, carbon and phosphorus concentrations of stockbreeding manure after the storage process.
Table 5.
Nitrogen, carbon and phosphorus concentrations of stockbreeding manure after the storage process.
| | Nitrogen Concentration of Manure: Wet Matter (%) | Carbon Concentration of Manure: Wet Matter (%) | Phosphorus Concentration of Manure: Wet Matter (%) |
|---|
| Beef Cattle | 0.51 | 8.51 | 0.183 |
| Dairy Cattle | 0.397 | 6.01 | 0.0667 |
| Chicken | 2.64 | 23.5 | 0.621 |
| Pigs | 1.58 | 16 | 0.938 |
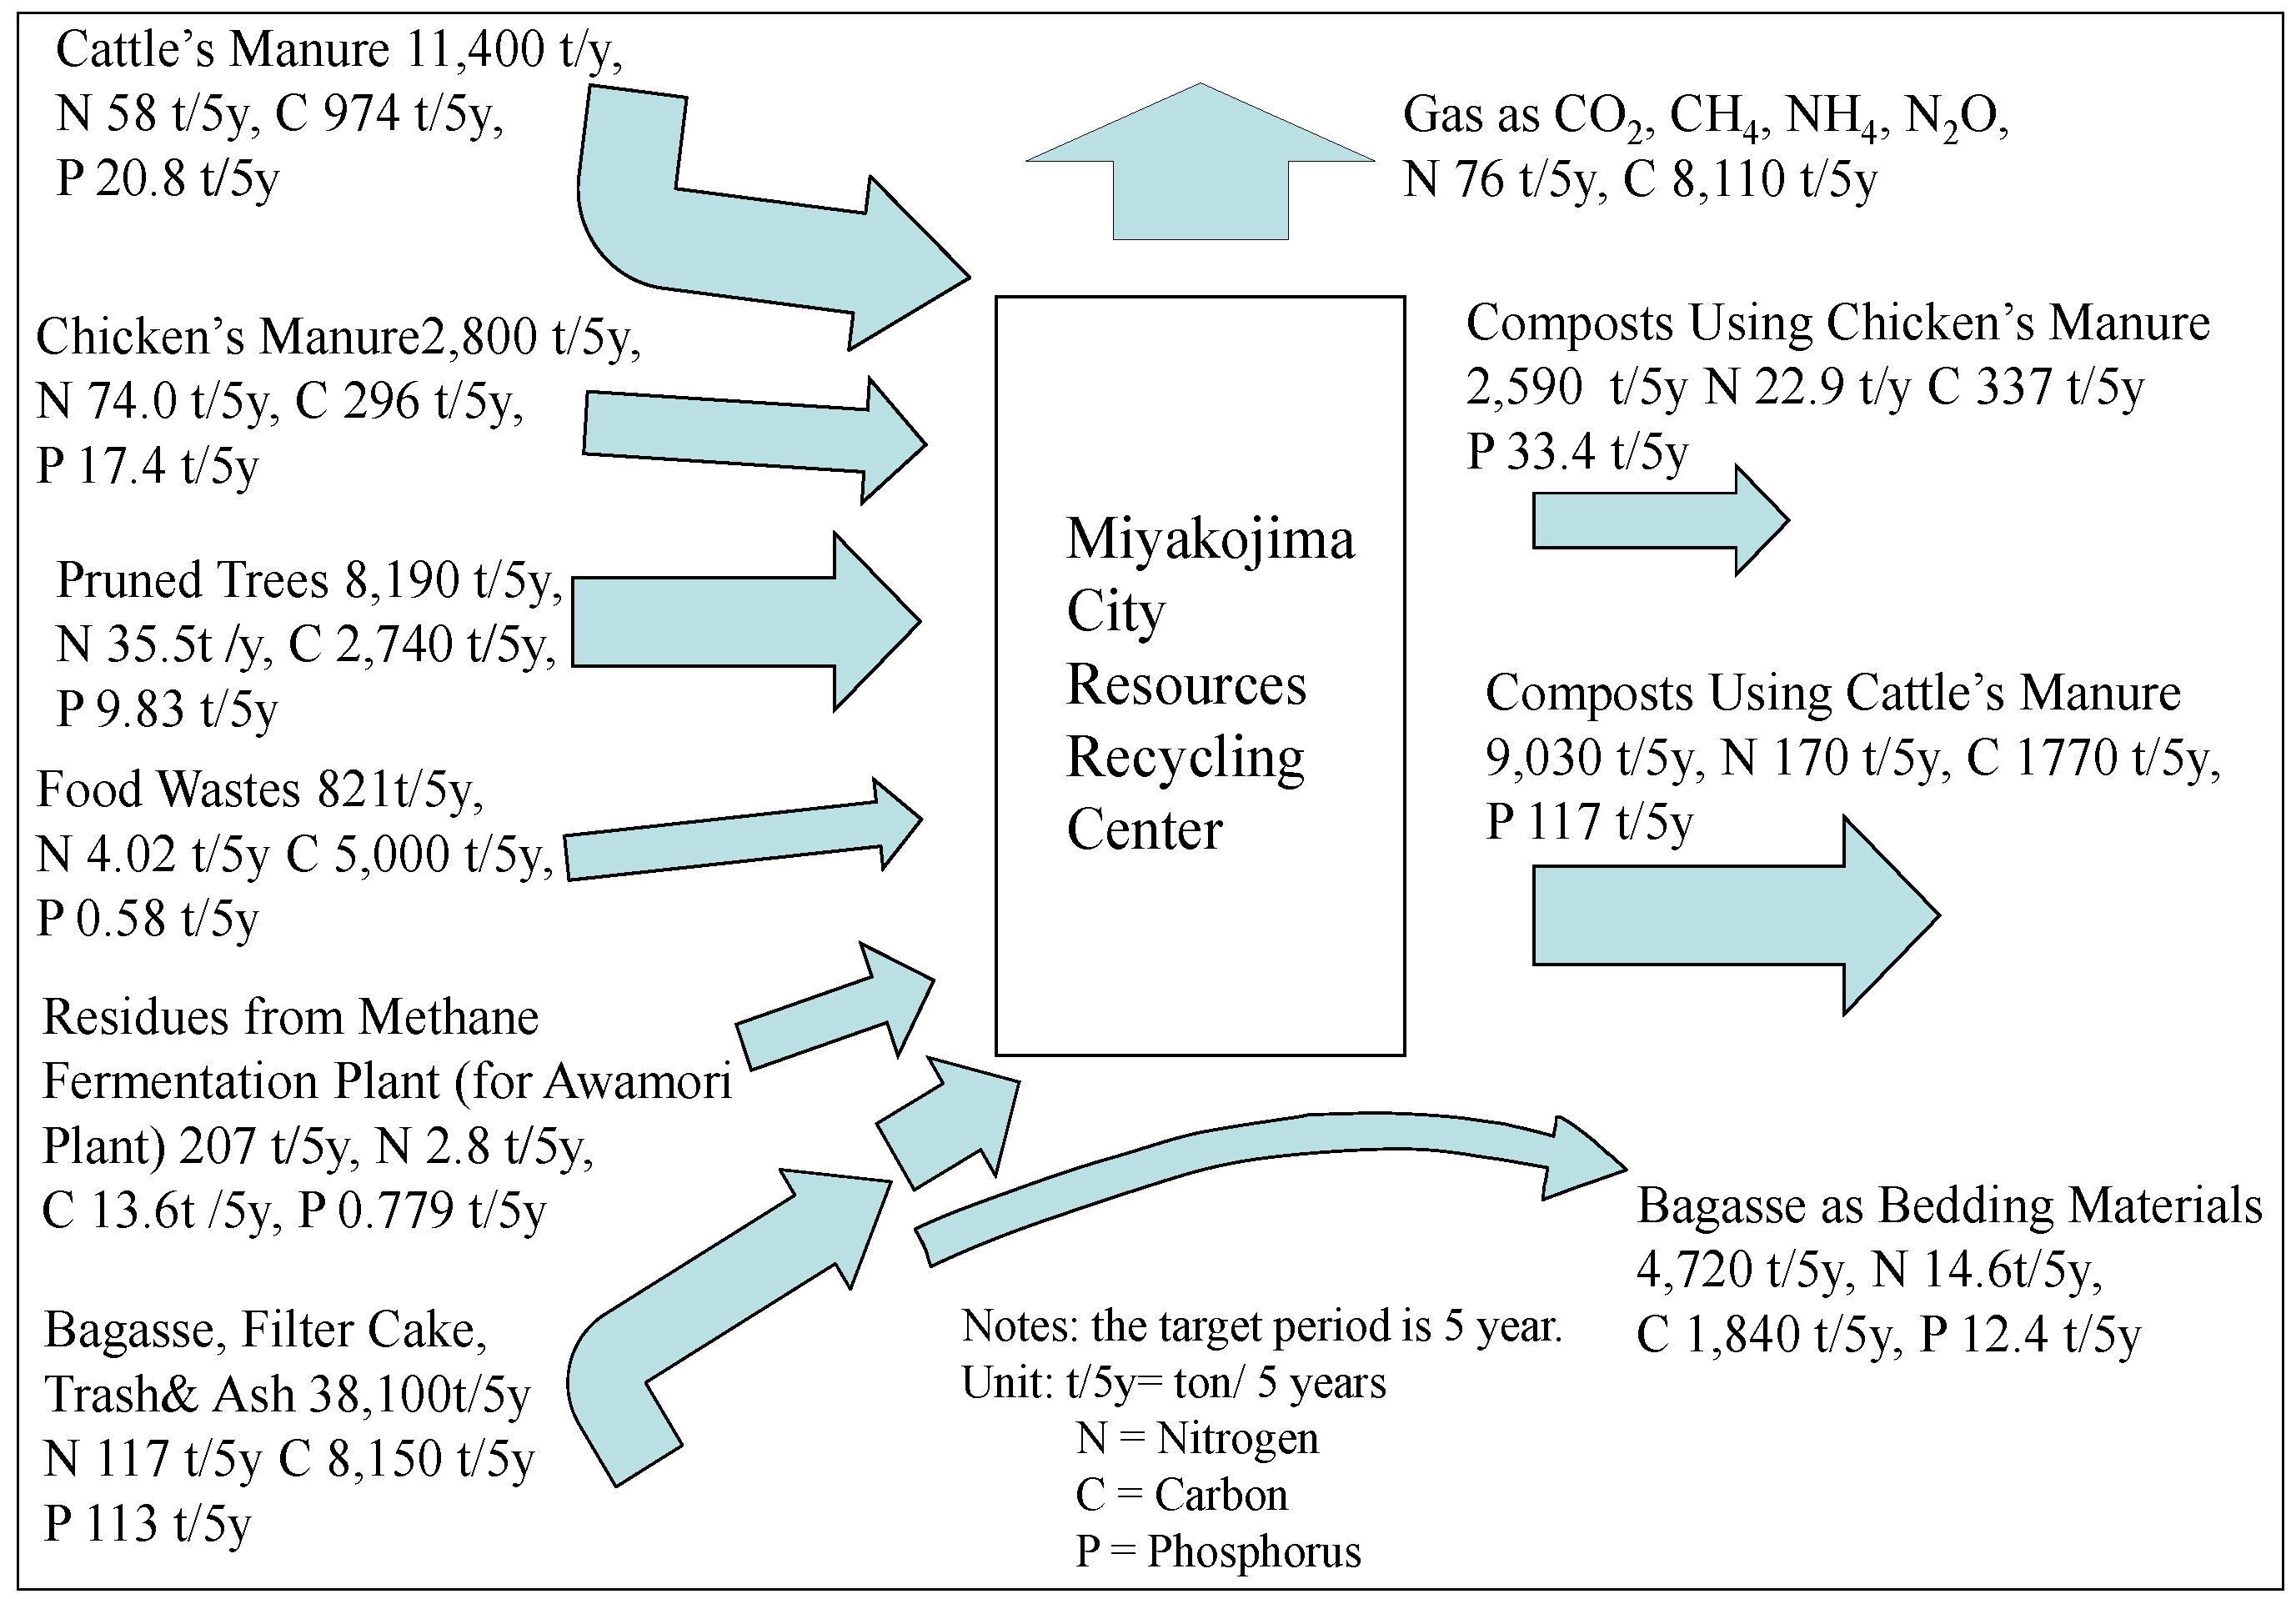
With these concentration values in mind, we turn to the MFA for the Miyakojima City Resources Recycling Center. The purpose of this MFA is to establish the, nitrogen and carbon loss ratios of the raw materials, which are processed in the three composting facilities. The target period of the MFA of Miyakojima City Resources Recycling Center is five years because the loss ratios among years are variable. The reasons for variability of the loss ratios are because (1) composting processes take a few months, (2) the period of high demands are during August or September, i.e., the application timing of base fertilization to sugar cane and (3) Composts are competitive with other composts and organic fertilizers from the inside and the outside of the island. Note that organic fertilizers are manure from stockbreeding but did not go through composting processes. It is usually a pellet dried by machines. To enhance the accuracy, the present research sets the target period as five years.
Now we show the MFA for the Miyakojima City Resources Recycling Center, as follows [
2,
3,
10,
11,
20].
As discussed above, one composting facility always keeps bagasse to exchange it for cattle manure, which is the Miyakojima City Resources Recycling Center. Two types of the composts are created at the Miyakojima City Resources Recycling Center, which are composts using chicken manure and composts using cattle manure. Another composting facility purchased manure from the biggest poultry breeding and raising farmer when this MFA of the poultry breeding and raising farm was conducted. Food waste is collected by the city together with other wastes from homes and businesses. The difference between food wastes for the composting facility and food wastes for hog breeding and raising is that the food wastes for the composting facility are usually decayed because they are stored at homes or at companies until they are collected by the city whereas food wastes for hog breeding and raising are collected daily from restaurants, hotels and supermarkets as addressed above. These food wastes are not fully used but they may be discussed in future research.
Figure 7.
MFA for the miyakojima city resources recycling center.
Figure 7.
MFA for the miyakojima city resources recycling center.
Waste from pruned trees are also collected by the city hall and are shredded into wood chips for composting and residues from sugar mills are purchased by the facility. Even if the public composting facility like Miyakojima City Resources Recycling Center does not need to compost residues from sugar mills, they are fully utilized by farmers who plow them under their farm soil. This topic may be discussed in future research. Regarding the residues from a methane fermentation plant, two Awamori plants own these and one of them has a composting facility that uses them as raw materials for composting.
The present research adopts the analytical results for the nitrogen and carbon concentrations provided by the composting facility: however, the analytical results for the phosphorus concentrations are not adopted for the convenience of the discussion: The phosphorus quantity of the input should be the same quantity as the output within the framework of the present research, because Miyakojima City Resources Recycling Center has the concrete floors and phosphorus in the input will not be lost
Now we are able to obtain the quantity, nitrogen and carbon loss ratios of the raw materials, which are processed at the three composting facilities, as shown in
Table 6:
Table 6.
Loss ratio establishment of all materials for composting in the facility.
Table 6.
Loss ratio establishment of all materials for composting in the facility.
| | Quantity (%) | Nitrogen (%) | Carbon (%) | Phosphorus (%) |
|---|
| Composting in the Facility | 73.4 | 26.1 | 78.6 | 0% |
Another composting system that is used widely on Miyakojima Island uses residues from sugar mills and sugar cane fields. For the present research, we need to establish these loss ratios as well. The carbon-to-nitrogen ratio (hereafter, C/N ratio) of the residues from sugar mills and sugar cane fields are high. No past research was done regarding loss ratios of the residues from sugar mills and sugar cane fields: however there was a study which determined the residual ratio of plants with the relatively high C/N ratio are when they are plowed under. The research paper entitled, “Studies on Soil Science and Fertilizer in the Paddy Field Applied Rice and Barley Straw” [
21], determines how much barley and rice straw remain when they are plowed under. For the convenience of this discussion, we use the residual ratios this report determines. The residues decompose relatively slowly and a nitrogen deficiency occurs. The nitrogen quantity in the residues increases because the residues absorb the nitrogen from the soil: 138% for barley and 95% for rice show the maximum values of nitrogen when 9.5 months elapse for barley and when 6 months elapse for rice. The nitrogen values 84% and 89% are the lowest values until 9.5 months for barley and 6 months for rice. Those are judged to show the nitrogen quantity that barley and rice residues lost. The present research adopts the values highlighted in bold face because they are conservative for this purpose. Note that
Table 7 only applies to residues from sugar mills and residues from sugar cane. Because they cause a nitrogen deficiency, they are plowed under 6 months prior to the billet planting for sugar cane. On Miyakojima Island, billet planting for sugar cane is usually made in late August or early September.
Table 7.
Residual ratio (of the residues from sugar cane) for composting when plowed under [
19].
Table 7.
Residual ratio (of the residues from sugar cane) for composting when plowed under [19].
| | Quantity (%) | Nitrogen (%) | Carbon (%) | Phosphorus (%) |
|---|
| Barley (9.5 Months Elapsed) | 34.3 | 84 (138) | 55 | 100 |
| Rice (6 Months Elapsed) | 54.8 | 89 (95) | 39.6 | 100 |
Next, the present research tries to clarify how much biomass resources are plowed under. Note that
Table 7 is applied to residues from sugar mills and residues from sugar cane while
Table 5 is applied to stockbreeding’s manure. Regarding sewage plant sludge and green manure plants, nothing is applied because it does not have any storage process and any composting process. There were two sewage plants in the island in FY 2010: one collects sludge from individual home septic tanks by tanker truck; the other collects sewage from sewage collection system lines. The present research adopts the C/N ratio from sludge processed from sewage collected from the sewage collection system lines because the analysis of sludge collected from home septic tanks was not made.
Table 8 shows biomass resources that are plowed under and incorporated into the soil. When we use the values in
Table 4 and
Table 7 together, we are able to obtain values for the quantity of biomass and the quantities of nutrients (nitrogen, carbon and phosphorus) that are used to fertilize agricultural plants on Miyakojima Island that are derived from biomass resources that are incorporated into the soil.
Table 8.
List of biomass resources which are plowed under [
4,
13,
14].
Table 8.
List of biomass resources which are plowed under [4,13,14].
| | Total Quantity (t/y) | Nitrogen Quantity (t/y) | Carbon Quantity (t/y) | Phosphorus Quantity (t/y) |
|---|
| Residues from Sugar Mills | 25,900 | 150 | 17,200 | 47 |
| Residues from Sugar Cane Fields | 201,000 | 812 | 56,500 | 133 |
| Beef Cattle’s Manure | 69,200 | 242 | 4,150 | 68 |
| Chicken’s Manure | 39.5 | 0.456 | 4.17 | 0.0984 |
| Dairy Cattle’s Manure | 1,530 | 5.36 | 92 | 0.825 |
| Pig’s Manure | 386 | 2.86 | 30.5 | 1.45 |
| Sewage Plant Sludge | 793 | 7.63 | 61.0 | 2.17 |
| Green Manure Plants | 42,800 | 61.3 | 1640 | N/A |
| Residues from Methane Fermentation Plants | 50 | 0.954 | 4.64 | 0.266 |
Table 9 shows biomass resources that are composted in three composting facilities. When we use the values in
Table 6 and
Table 9 together, we are able to obtain quantities of biomass resources and quantities of nutrients (nitrogen, carbon and phosphorus) that are used to fertilize agricultural plants on Miyakojima Island that are derived from compost.
Table 9.
Biomass resource list for composting facilities.
Table 9.
Biomass resource list for composting facilities.
| | Total Quantity (t/y) | Nitrogen Quantity (t/y) | Carbon Quantity (t/y) | Phosphorus Quantity (t/y) |
|---|
| Residues from Sugar Mills | 11,200 | 32 | 2,920 | 19.3 |
| Beef Cattle’s Manure | 3770 | 40.2 | 791 | 4.59 |
| Chicken’s Manure | 1,060 | 12.2 | 112 | 2.64 |
| Fishery Residues | 101 | 3.89 | 17.2 | 0.26 |
| Wastes from Pruned Trees | 4,360 | 18.9 | 1460 | 5.23 |
| Food Wastes | 189 | 0.93 | 18.9 | 0.134 |
| Lees from Awamori Plants/ Residues from Methane Fermentation Plants | 671 | 8.29 | 41.3 | 2.14 |
Table 10 shows a biomass resource from 300 pigs that is a slurry mixture of manure and urine used for vegetable cultivation:
Table 10.
Pig’s slurry and loss ratios [
13,
19,
22].
Table 10.
Pig’s slurry and loss ratios [13,19,22].
| | Total Quantity and Loss Ratio | Nitrogen Quantity and Loss Ratio | Carbon Quantity and Loss Ratio | Phosphorus Quantity and Loss Ratio |
|---|
| Pig’s Slurry | 455 t/y | 2.60 t/y | 18.4 t/y | 1.4 t/y |
| Loss Ratio | 0% | 25% | 31.8% | 0% |
Table 11 shows quantitates of imported chemical and organic fertilizers and composts. The information in
Table 11 is based on the administrative data provided by Miyakojima city hall and JA Okinawa Miyakojima District. As you can see, chemical fertilizers contain a large amount of nitrogen. On the other hand, organic fertilizer tends to contain more carbon (Organic fertilizers are different from composts: They are usually created with machines while compost is created by microbial decomposition. Therefore most of “Organic Fertilizer and Compost” in
Table 11 is occupied by one product: it is chicken’s manure dried by machines. So the composition of “Organic Fertilizer and Compost” in
Table 11 is relatively high). Regarding the carbon concentration of non-organic chemical fertilizers, manufacturers do not analyze chemical fertilizer for the carbon content because it is not required by regulations in Japan. Therefore, we rely on two methods for determining carbon content. When we know the active ingredients such as urea, we estimate the concentration from its chemical formula; and we also made chemical analysis of several fertilizers. We are able to estimate and analyze the carbon concentration from 86.4% of fertilizers by these two methods. For the carbon concentration of the remaining 13.6% of fertilizers, the present research assumes that they have the similar concentrations.
Table 11.
Imported fertilizer quantity.
Table 11.
Imported fertilizer quantity.
| | Total Quantity (t/y) | Nitrogen Quantity (t/y) | Carbon Quantity (t/y) | Phosphorus Quantity (t/y) |
|---|
| Chemical Fertilizer | 5,940 | 1,000 | 217 | 202 |
| Organic Fertilizer and Compost | 3,870 | 96.7 | 1,090 | 59.1 |
| Total | 9,810 | 1,040 | 1,310 | 262 |
Now we discuss the distribution of fertilizer and biomass resources shown in
Table 12. This is based on interviews with farmers and the quantity of nitrogen contained in agricultural plants. Fertilizers are available for purchase by anyone, but biomass, like stockbreeding manures are unevenly distributed: usually sugar cane farmers keep beef cattle and they tend to use manure from them for their sugar cane fields. They own their own grass lands for pasturage cultivation. Farmers of other agricultural plants seem to purchase the manure from the farmers in stockbreeding. Otherwise, they obtain organic fertilizers or composts imported from outside of the island.
Table 12.
Agricultural plant biomass ranking and fertilizer and biomass distribution ratio.
Table 12.
Agricultural plant biomass ranking and fertilizer and biomass distribution ratio.
| Agricultural Plant Name | Nitrogen Quantity of Each Agricultural Plant (t/y) | Stockbreeding Manure’s and other Biomass (excluding sugar cane residues) Distribution Ratio (%) | Sugar Cane Residue’s Distribution Ratio (%) | Fertilizer Distribution Ratio (%) |
|---|
| Sugar Cane | 1,130 | 80.6 | 100% | 66 |
| Pasturage | 16.7 | 15.6 | 0% | 21 |
| Squash | 6.1 | 1.49% | 0% (negligible) | 5 |
| Leaf Tobacco | 20.9 | 0.435% | 0% (negligible) | 2 |
| Chinese Preserving Melon | 12.2 | 0.991% | 0% (negligible) | 3 |
| Bitter Melon | 13.9 | 0.87% | 0% (negligible) | 2.5 |
| Mango | 16.7 | 0.0588% | 0% (negligible) | 0.5 |
Sugar cane residues (meaning residues from sugar mills and residues from sugar cane fields) are exclusively used by sugar cane farmers except for the residues that go to composting facilities. Few farmers of the other agricultural plants use them for composting (see the relevant parts of
Table 9).
Fertilizer utilization is not that straightforward. The present research allocates fertilizer use according to the results of interviews with farmers. In addition, “Okinawa Prefectural Government Fertilizer Application Standard” is referenced as well [
23]. Note that the quantity of fertilizers is not precisely in agreement with the results of interviews. Adjustments are made, considering the nitrogen quantity that each plant has.
3.2. Material Cycle between Stockbreeding and Agricultural Plants and Proposals for its Improvement
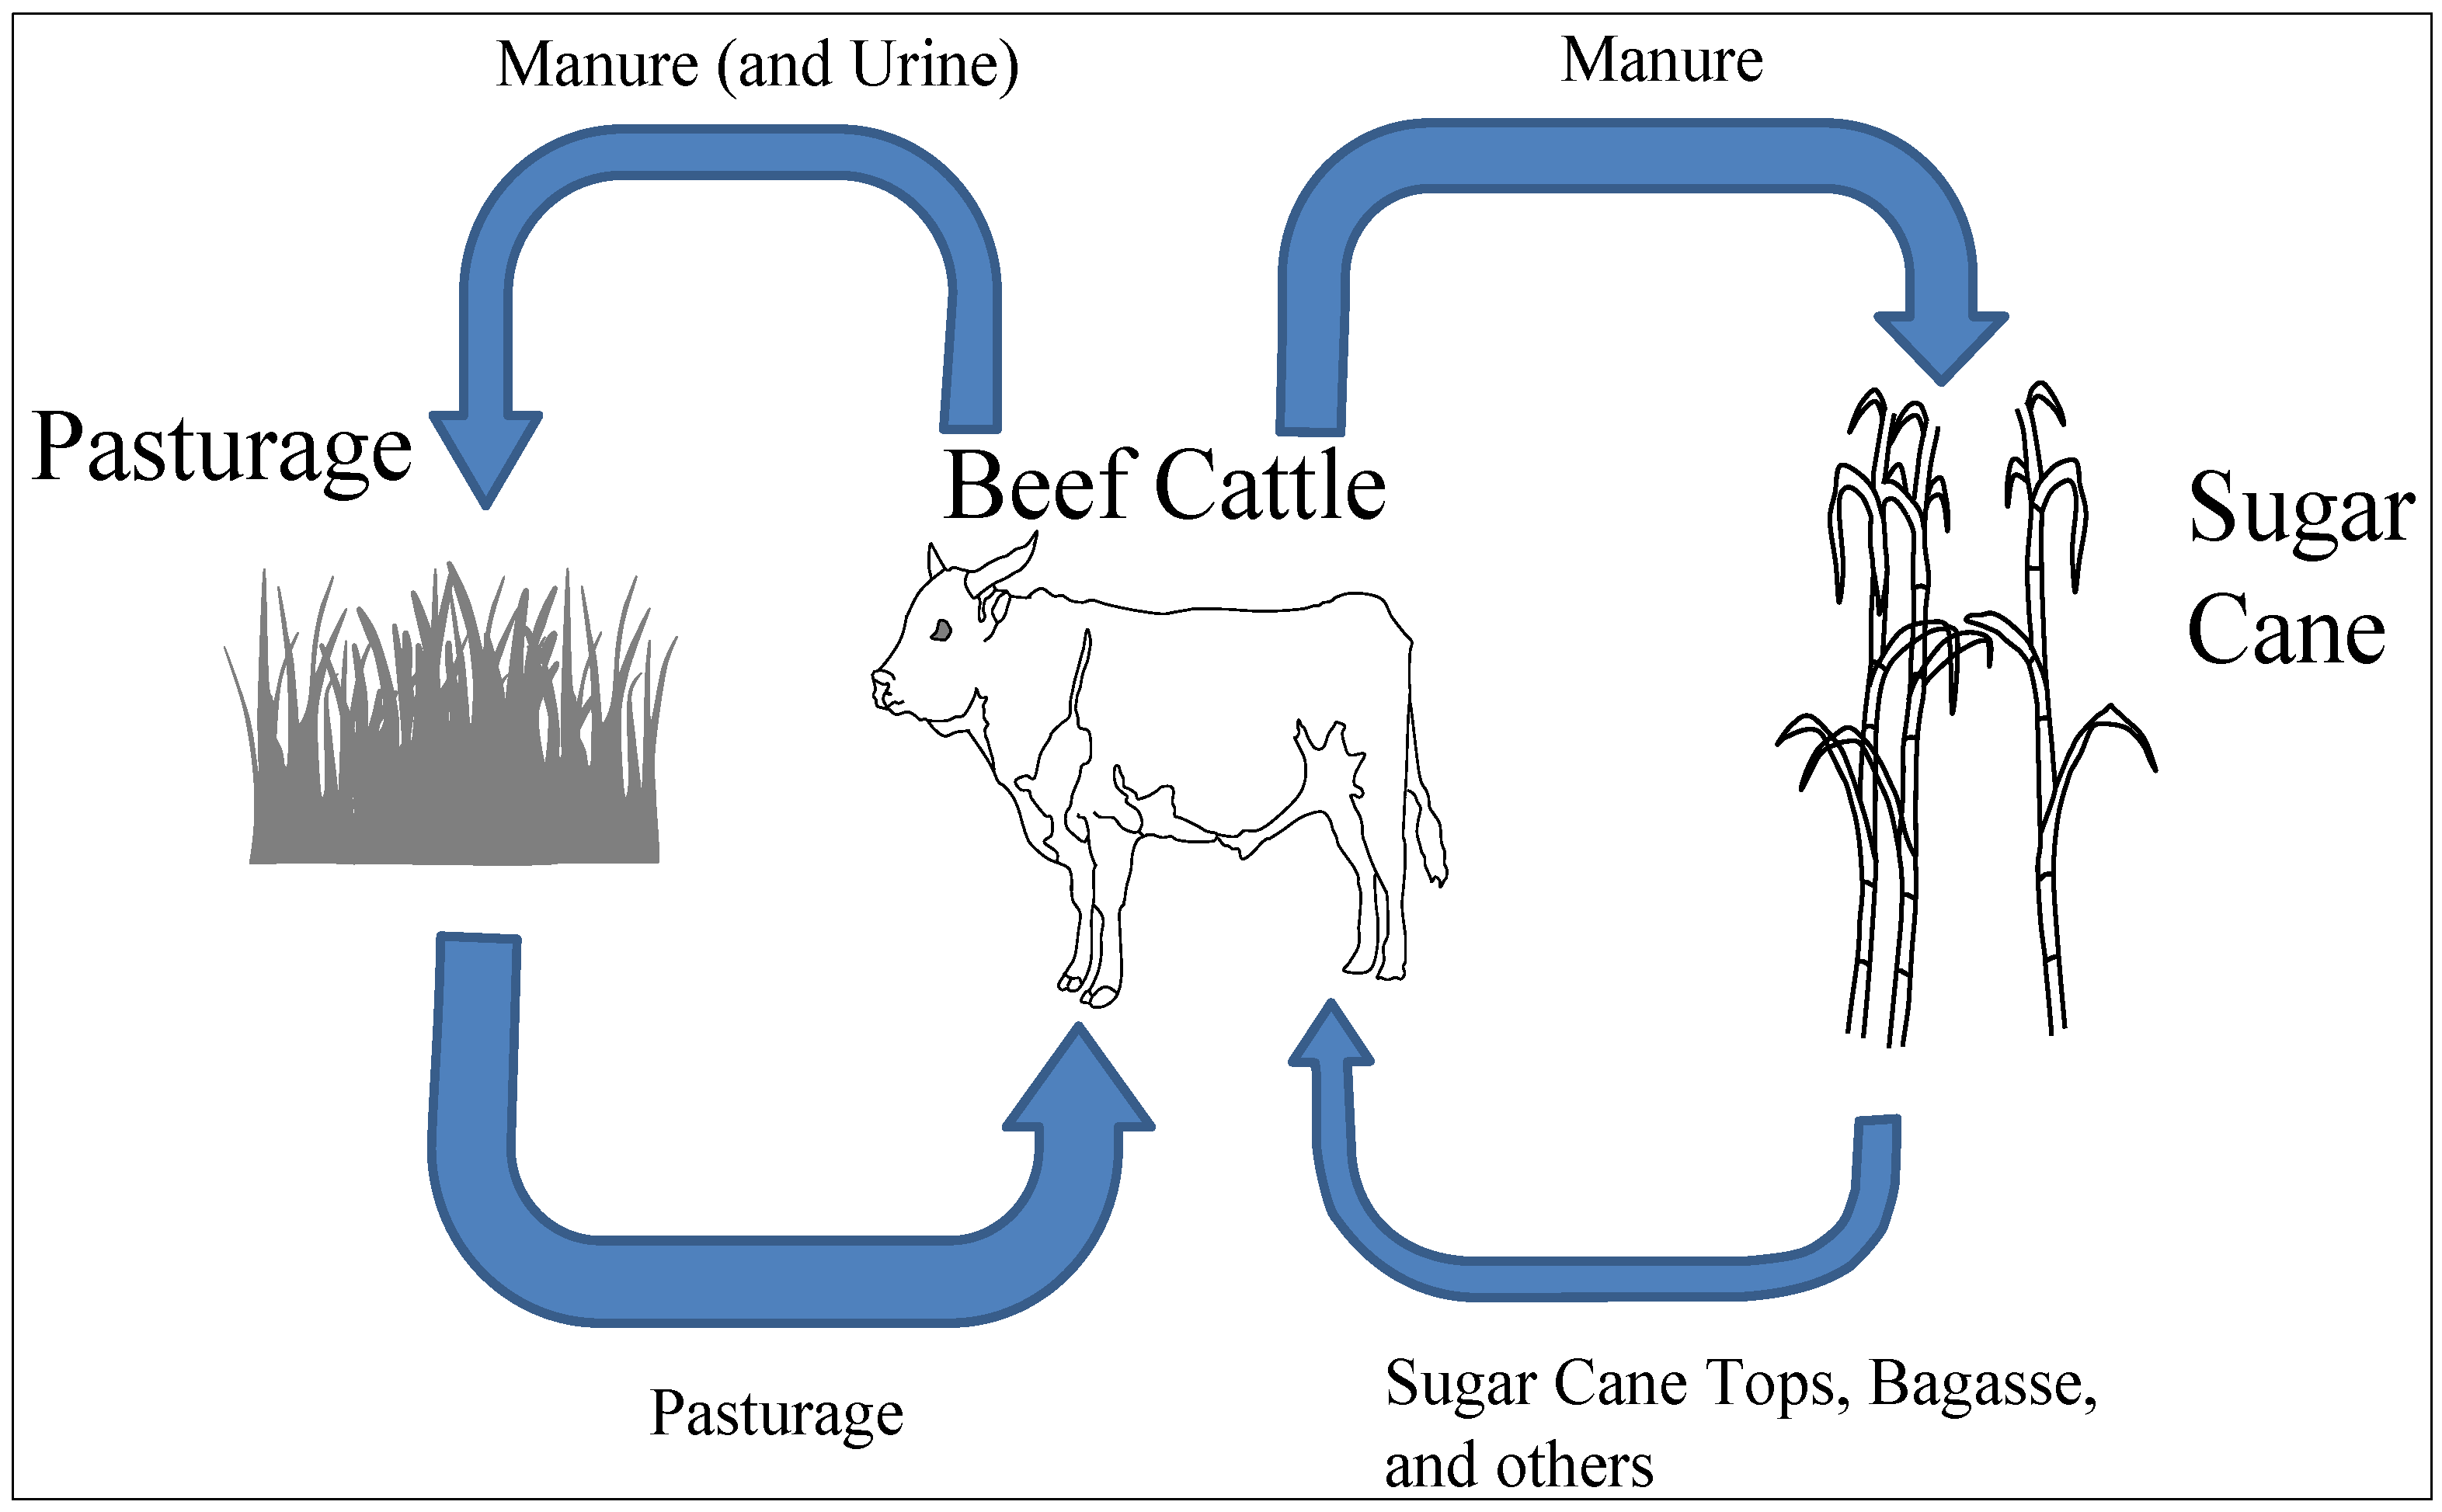
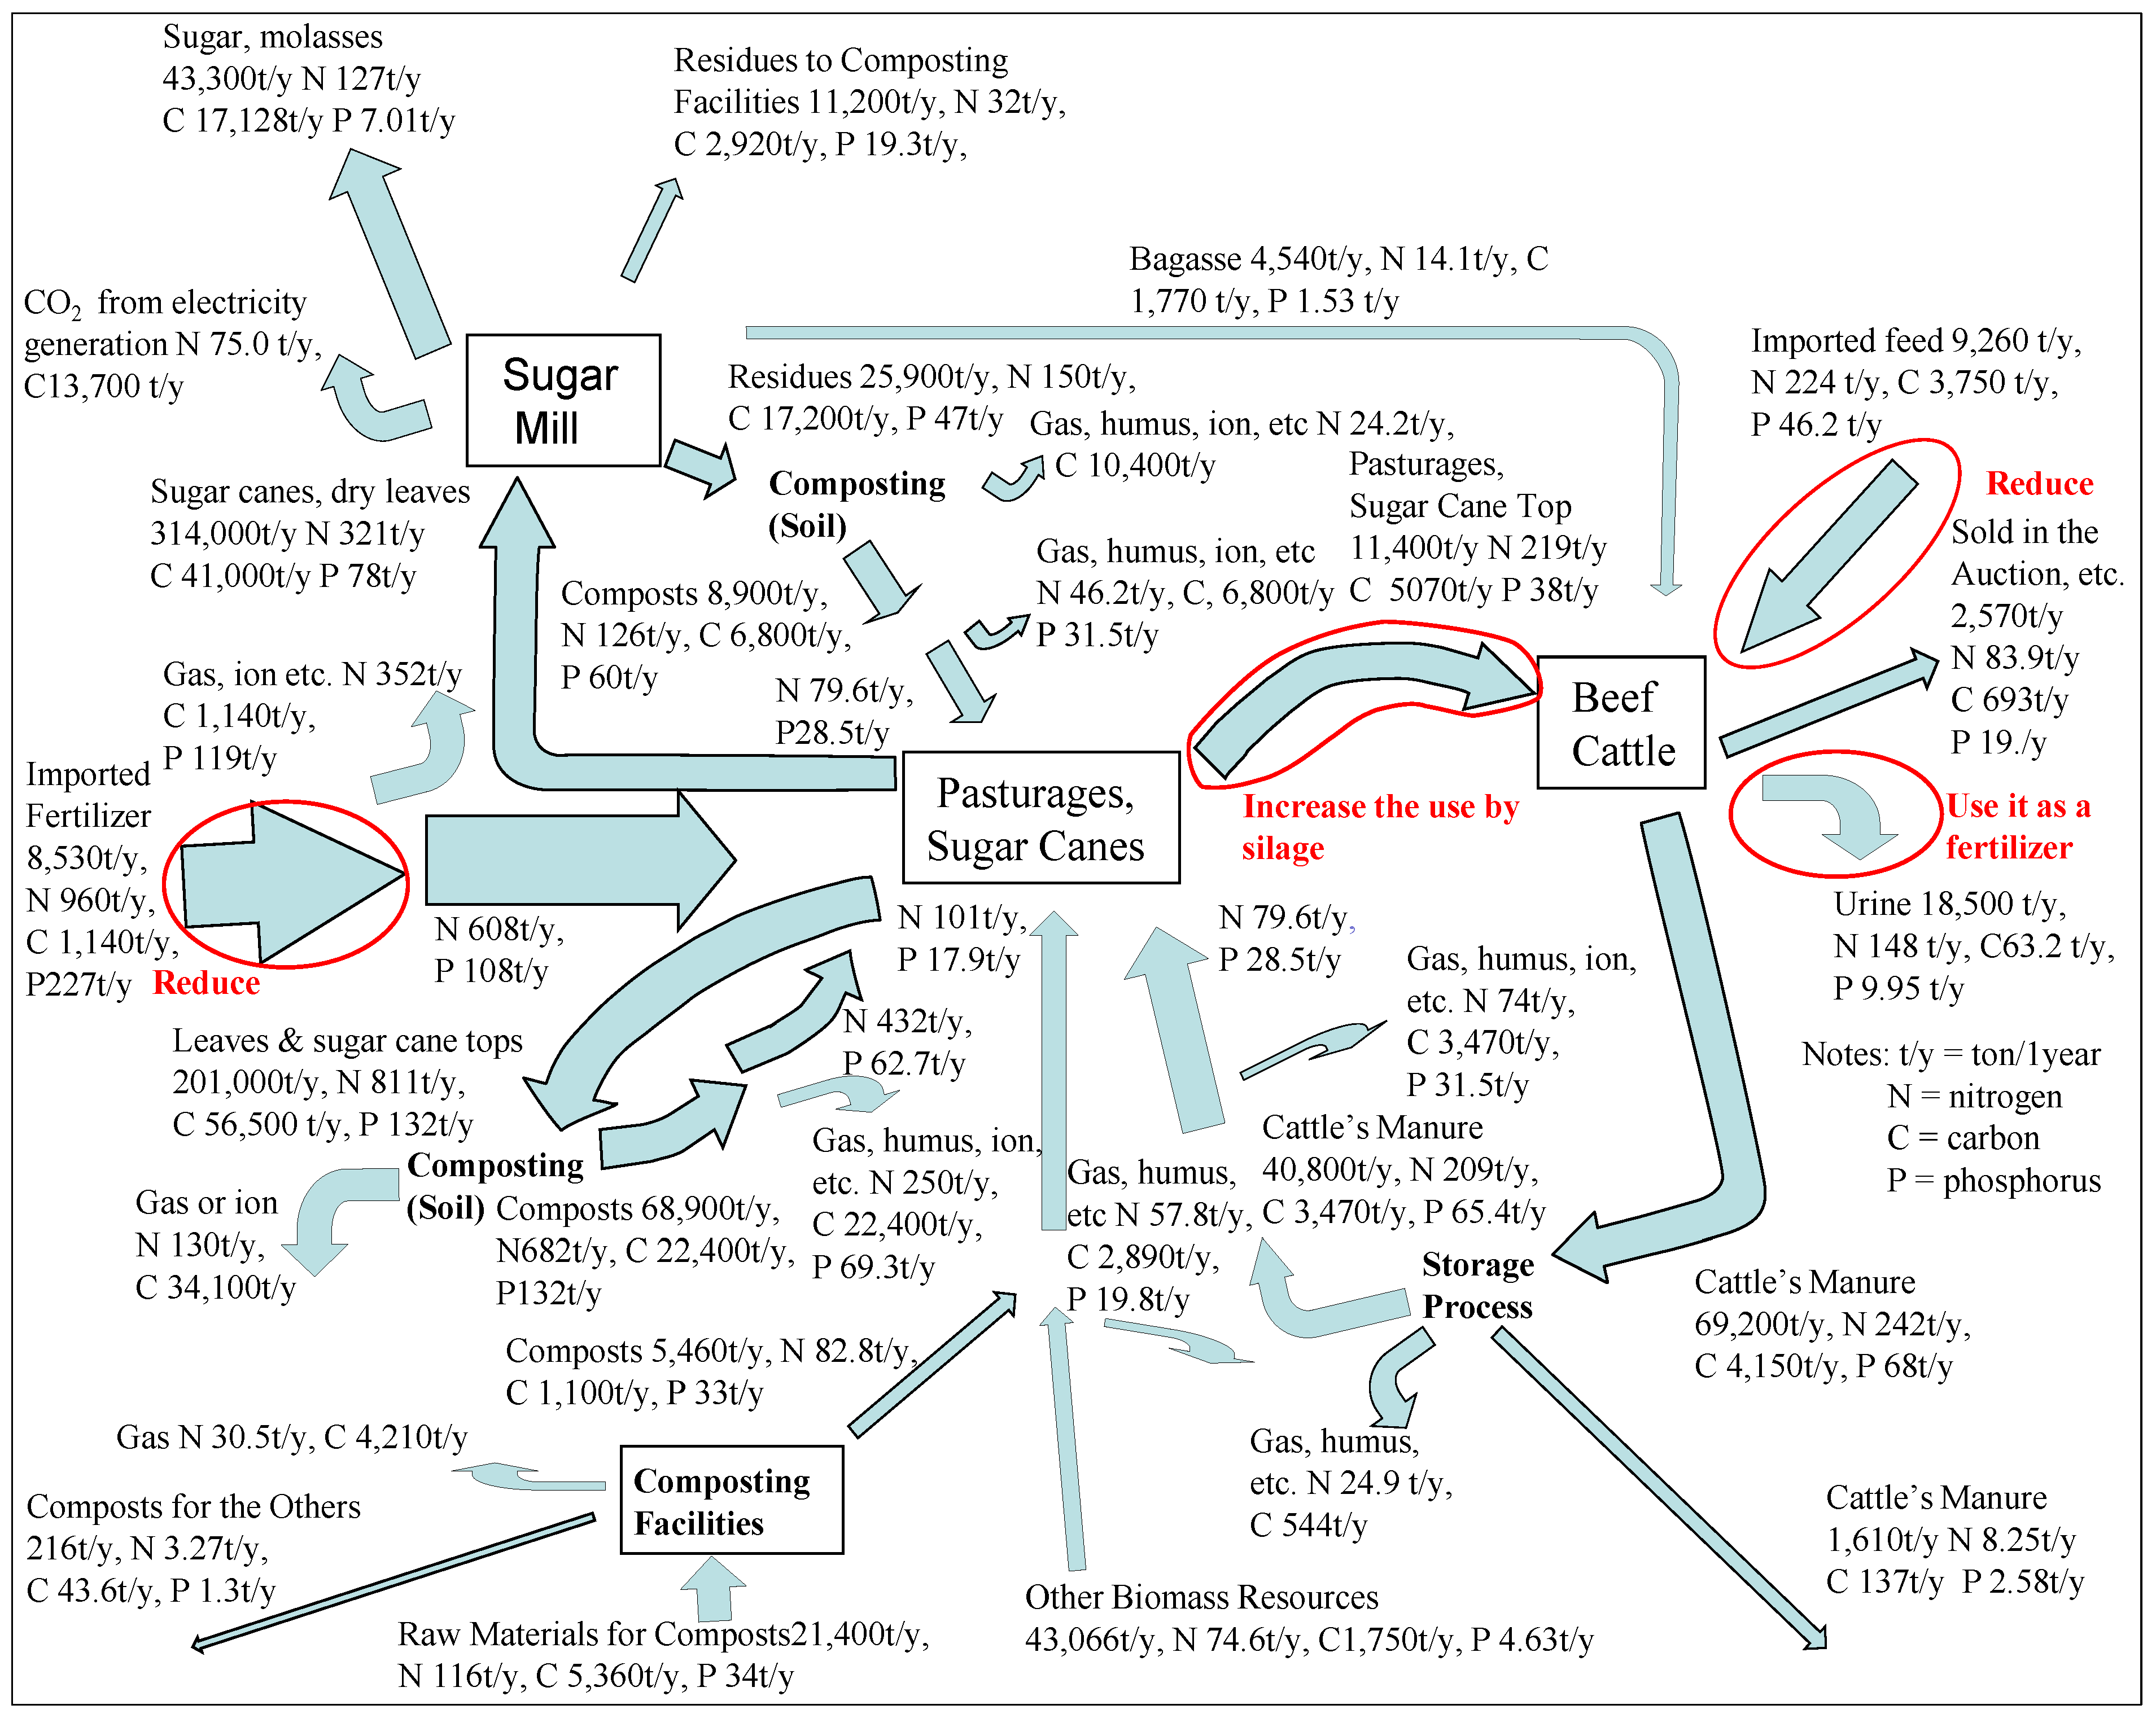
Based on the discussion in the previous section, this research demonstrates the material cycle between beef cattle, pasturage and sugar cane anticipated in
Figure 2 of Chapter 1.
In
Figure 8, four areas are enclosed by red circles that show our proposals for improvement in the MFA. The first proposal shown on the right side of the
Figure 8 is that urine should be substituted for imported fertilizers, thereby reducing the use of the imported fertilizer.
Figure 8.
MFA for the material cycle of beef cattle, sugar cane and pasturage.
Figure 8.
MFA for the material cycle of beef cattle, sugar cane and pasturage.
Three material cycles are shown in
Figure 8:
- (1)
One material cycle is made between sugar cane, pasturage, and the beef cattle. Pasturage and sugar cane are given as cattle feeds. Pasturage and sugar cane tops are fed directly to beef cattle. However, there is another material flow to feed beef cattle. That is, sugar cane goes to sugar mills and after crude sugars are created, they are given to cattle as residues from sugar mills. When pasturage and sugar cane are eaten and digested, they will become manure or urine. Urine may be evaporated into the air or seep into the solid and ground water. In a few cases, they are absorbed by bedding materials like bagasse and are used for the raw materials for composting. The quantity of the bagasse as bedding materials is judged to be negligible.
- (2)
The next material cycle is made between sugar cane and sugar mills. Sugar cane or manure from the beef cattle go to sugar cane and pasturage are used as material of composts in the facility. All of beef cattle’s manure is used as raw materials of composting. As the basal fertilizer, manure is plowed within one month prior to billet plantings for sugar cane.
- (3)
The other material cycle is made between sugar cane and its soil. A large amount of leaves and sugar cane tops are left in the field. In April, farmers plow under their sugar cane residues together with bagasse, ash, trash and filter cakes that are from sugar mills, in order to promote decomposition and to create composts. For that purpose, plowing is done 6 times during half of the year until farmers plant sugar cane billets in late August or in early September.
Sugar, and molasses are exportable commercial products derived from sugar cane, i.e., output from Miyakojima Island. Calves (beef cattle) and breeding cows (beef cattle) after are also exportable commercial products. Imported fertilizer and imported feed are input to the island and the present research would like to reduce these to enhance agricultural independence.
Substances in the material flow can be lost as gas (ex. CO2, CH4, NH3, etc.), as ion (ex. NH4+, etc.), as humus, or as inorganic substances in the soil or underground layers (ex. Ca3(P04)2, etc.), during power generation, the composting process, the storage process, and during cud-chewing, breathing and fertilization.
Here we address the differences among nitrogen, carbon and phosphorus from the perspective of agriculture. Much of nitrogen is imported from outside of the island and the agricultural plants and beef cattle depend on it. Regarding carbon, agricultural plants do not require it because they do carbon fixation by photo synthesis whereas beef cattle need imported carbon. Beef cattle like calves need concentrate feeds imported from outside of the island because of the demand for high quality meat. Carbon is an energy source for the bacteria in the soil. Regarding phosphorus, much of imported phosphorus is assumed to stay in the soil as calcium phosphate and may be discussed in the future research.
Cattle urine is a soil and groundwater pollutant on Miyakojima Island. When unused urine evaporates into the air, it also causes unpleasant odors. When the unused urine seeps in the ground water, it pollutes the ground water. The present research suggests that it should be applied to the pasturage as liquid fertilizer instead of chemical fertilizer imported from outside of the island. This practice will make agriculture more sustainable by not only reducing agriculture’s dependence on imported fertilizers, but it also has the added benefit of absorbing unused urine as fertilizer for pasturage to mitigate environmental impacts of soil and groundwater pollution and unpleasant odors.
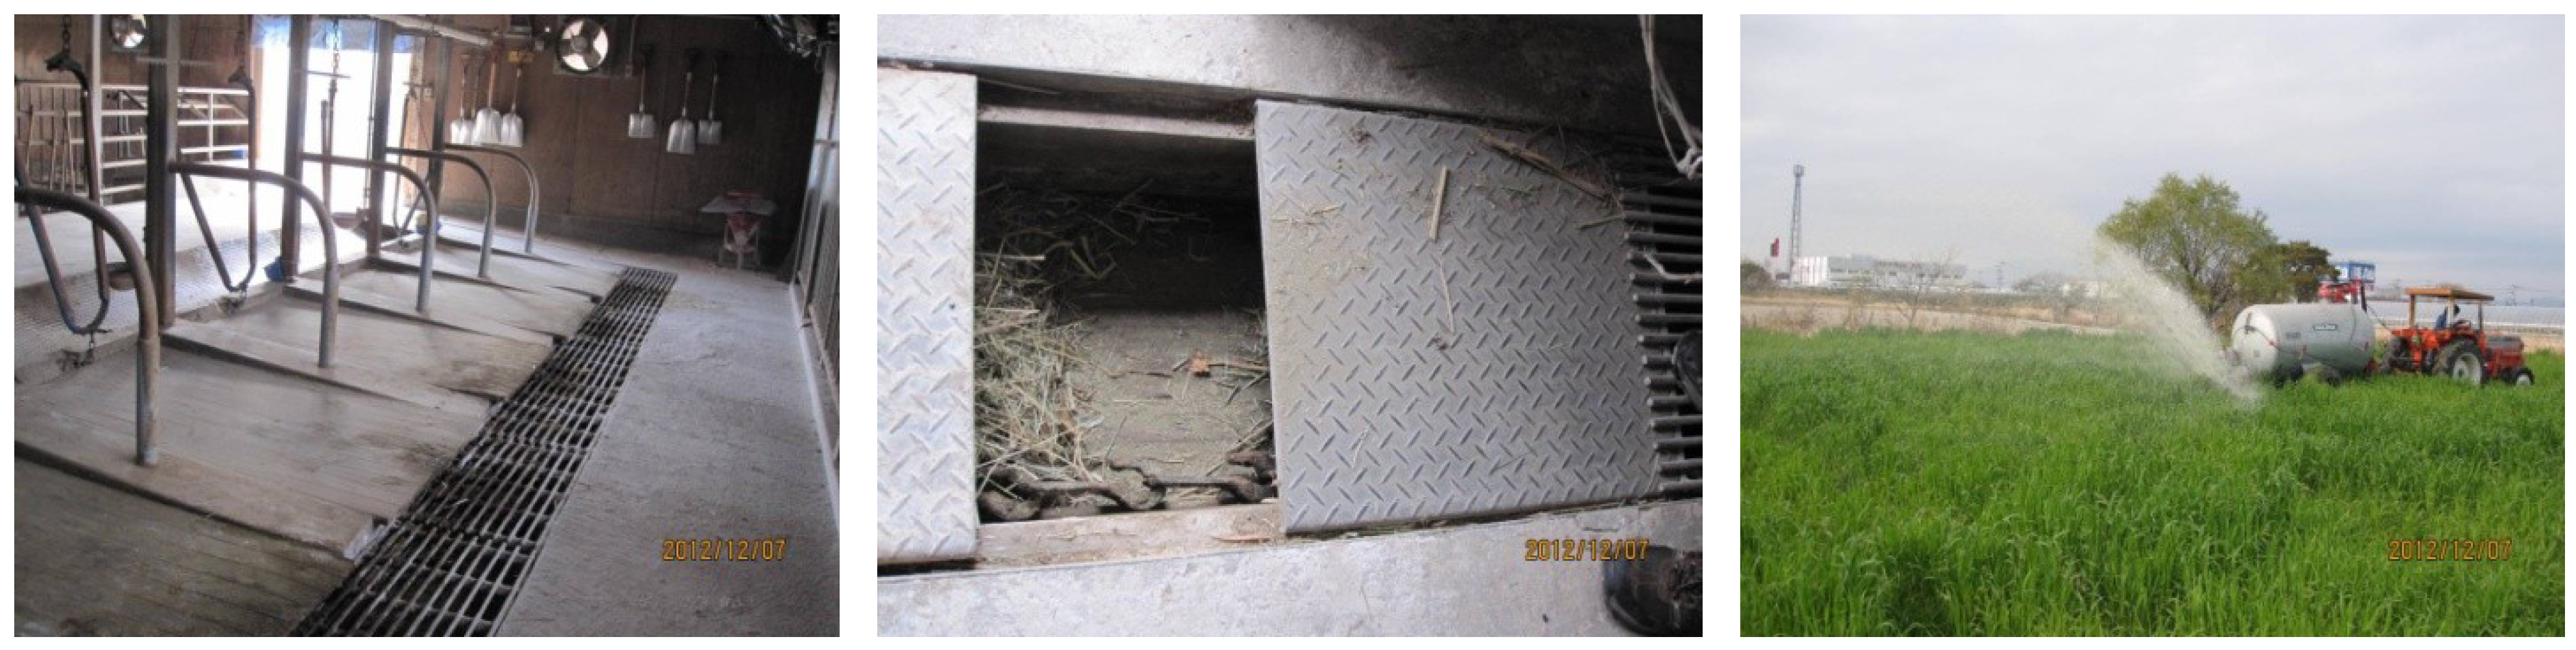
Figure 9 shows the actual example of stockbreeding urine utilization as liquid fertilizer in Saga prefecture. Beef cattle are kept in the livestock barn on the left side of
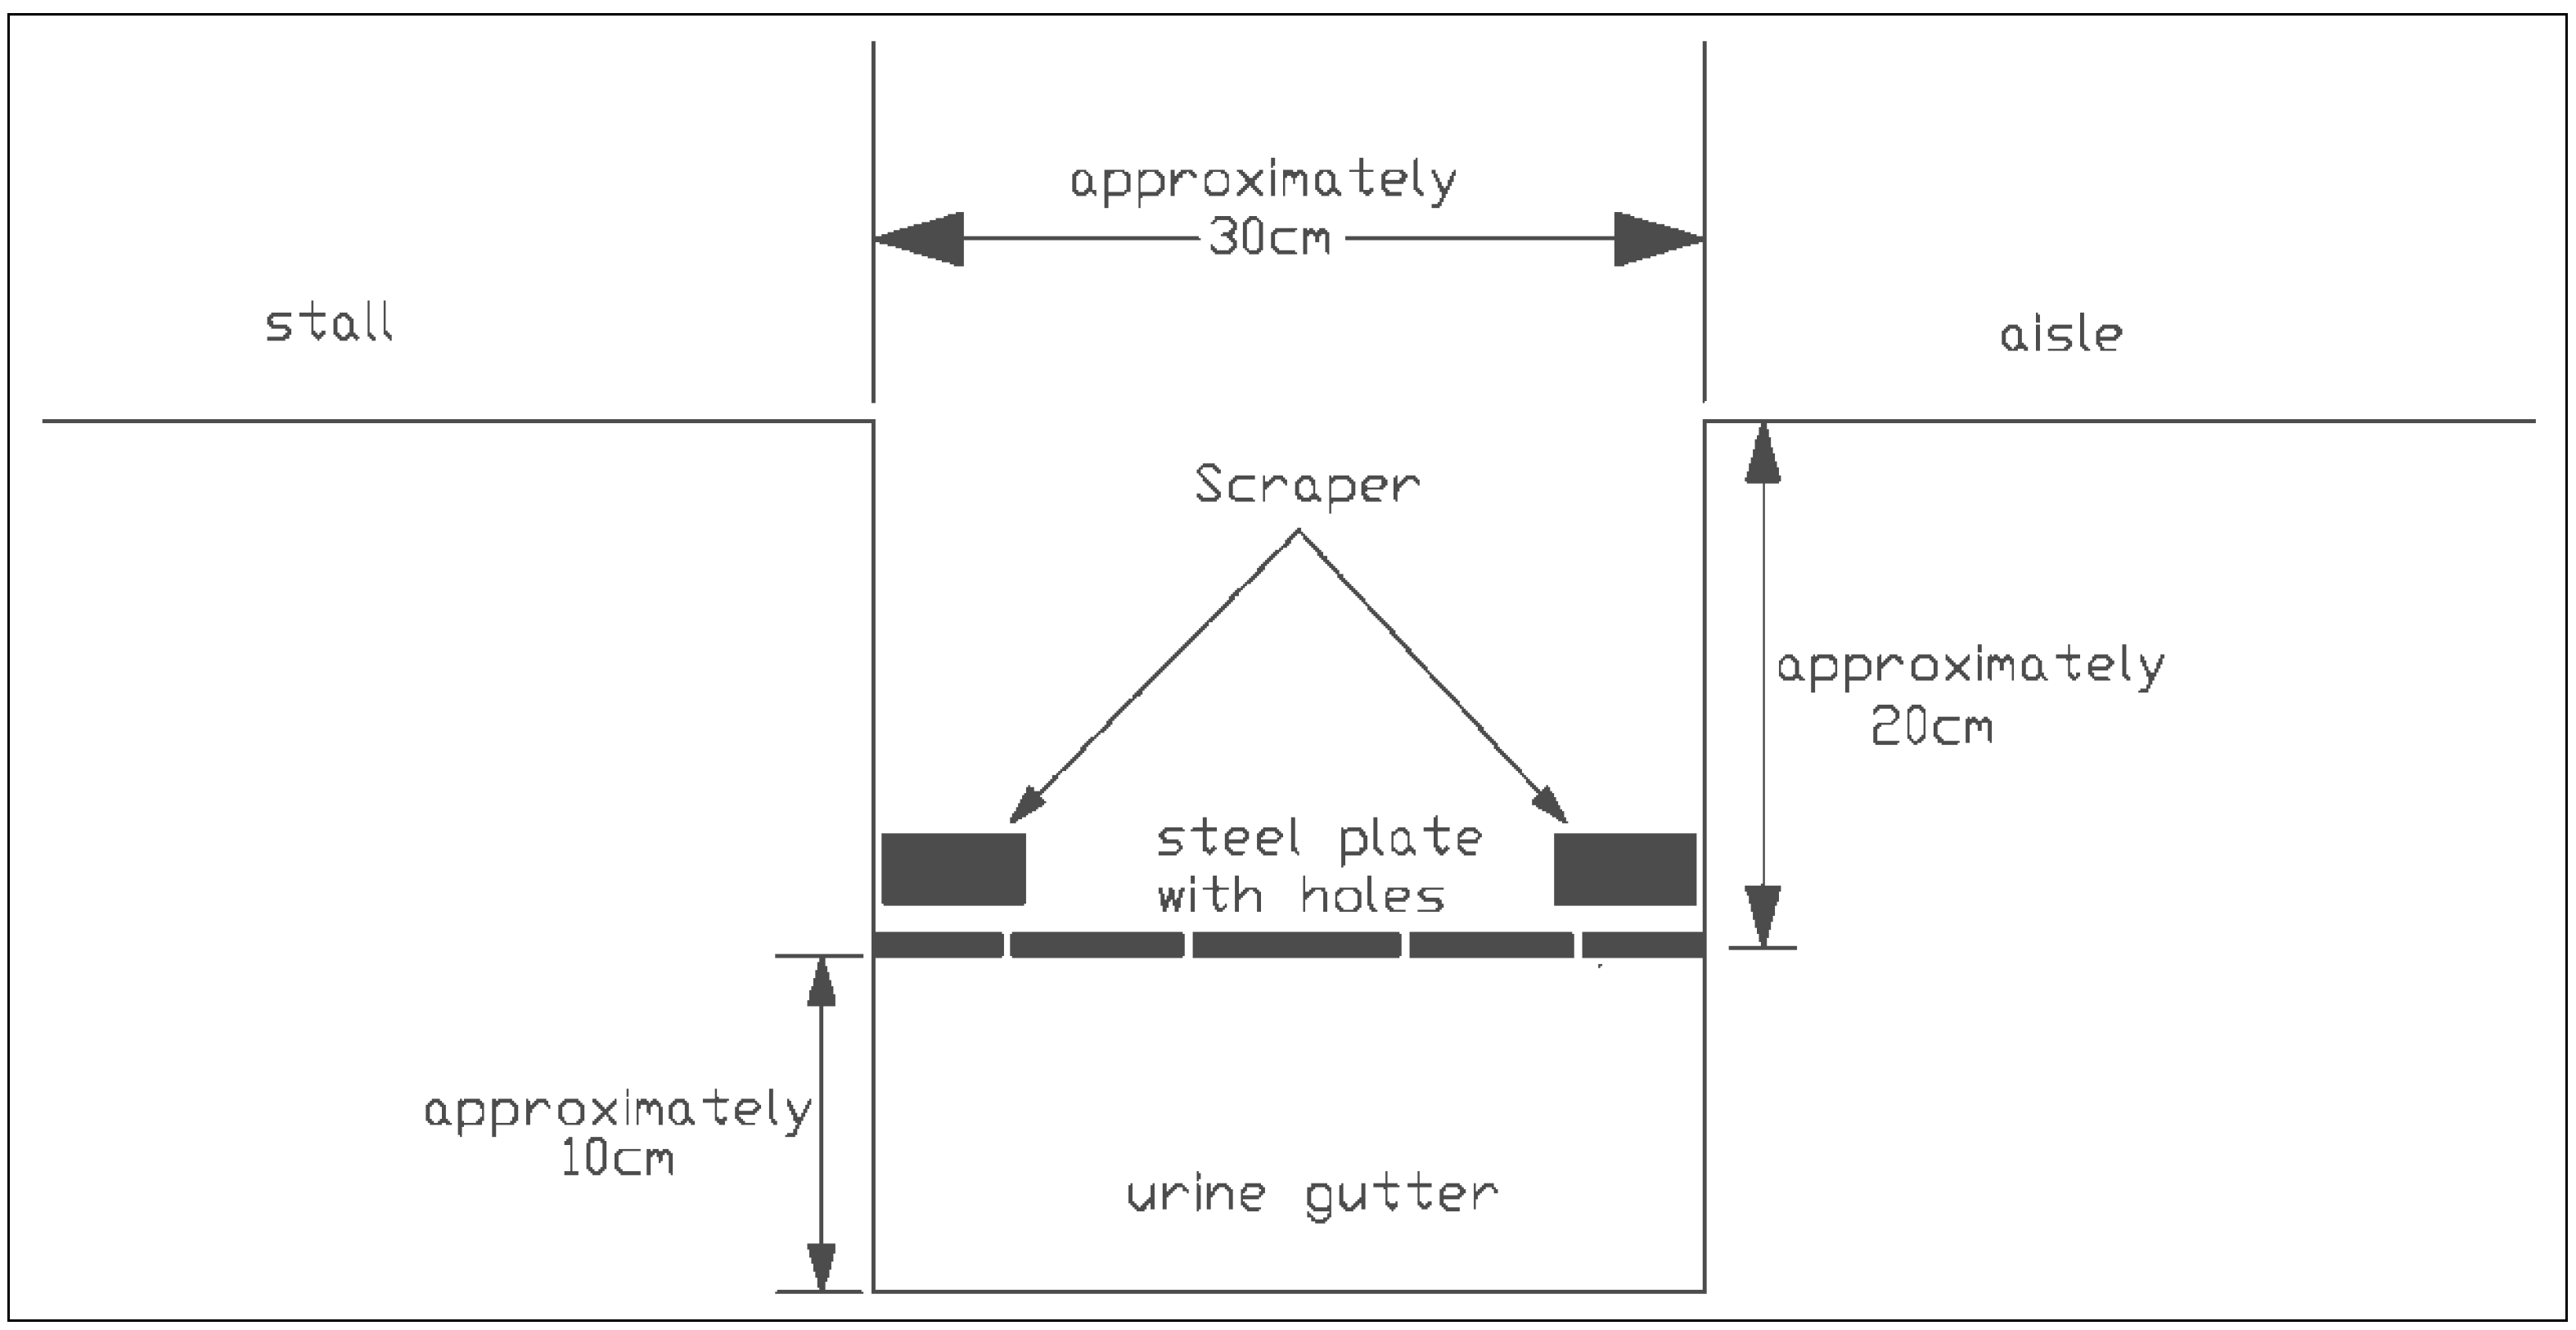
Figure 9. The gutter in the photo collects manure and urine. The photo also provides the inside view for the gutter. The gutter has two layers or sections: the upper section provides the space for manure whereas the lower section collects urine. The upper section is separated from the lower section by the steel plate or perforated grill. The urine collects in the lower section of the gutter and flows outside of the barn where it is stored in the reservoir. See
Figure 10 for the AutoCAD drawing of the gutter, which shows its structure. The photo on the right side shows that urine is applied to oats and Italian ryegrass as a liquid fertilizer. Saga prefecture has many examples of utilization of urine as fertilizer for to pasturage.
Figure 9.
Utilization of stockbreed urine as liquid fertilizer.
Figure 9.
Utilization of stockbreed urine as liquid fertilizer.
Advantages of using cattle urine are that the composting process is not required: losses in the storage process would be minimum. Moreover as previously discussed, the proper management and reuse of urine as pasturage fertilizer would help eliminate or reduce the negative environmental impacts of soil and groundwater pollution and odor problems associated with the current practices of urine. In the actual cases of urine application as liquid fertilizer in Saga prefecture, if bad odor issues arise, then the urine is diluted with water to mitigate the odor problems.
Figure 10.
Drawing of stock breeding’ gutter.
Figure 10.
Drawing of stock breeding’ gutter.
The photo on the left side of
Figure 11 shows the raw materials of silage feeds:
i.e., sugar cane tops and dried leaves. To cause lactic acid fermentation, the optimal water content is around 60%, which can be controlled with dried leaves to adjust the water content. Examine the water content of the silage feed in
Table 13: the water content of the silage is 61.5%, which is appropriate for lactic acid fermentation. The photo in the middle of
Figure 11 shows the actual appearance of silage feeds and the photo on the right side shows beef cattle eating silage feeds. The palatability of silage feeds seems to be good because the beef cattle readily ate all of the silage immediately.
Figure 11.
Silage feeds created from sugar cane tops and dried leaves.
Figure 11.
Silage feeds created from sugar cane tops and dried leaves.
As shown in
Table 13, the contents of the silage feeds created from the sugar cane residues are comparable to that of silage of Rhodes grass, which is one of the dominant grasses on Miyakojima Island. The compositions for silage of Rhodes grass are obtained from “Table of Feed Composition in Japan (2009)” [
2].
Table 13.
The composition comparison between silage feeds from sugar cane residues and silage rhodes grass [
2].
Table 13.
The composition comparison between silage feeds from sugar cane residues and silage rhodes grass [2].
| Silage Feeds Created from Sugar Cane Residues (%) | Silage Rhodes Grass (%) |
|---|
| Water Content | 61.5 | 74 |
| Crude Protein | 2.28 | 2.68 |
| Crude Fiber | 11 | 8.61 |
| Crude Fat | 0.89 | 0.57 |
| Nitrogen Free Extract | 22.8 | 10.6 |
| Sodium | 0.03 | 0.11 |
| Potassium | 0.54 | 0.93 |
| Magnesium | 0.06 | 0.06 |
| Calcium | 0.22 | 0.2 |
| Phosphorus | 0.09 | 0.25 |
Another task would be to figure out to what extent the silage can meet the demand for pasturage on Miyakojima Island. Pasturage such as Italian rye grass, timothy and Bermuda grass is imported from outside of Miyakojima Island. The quantity of pasturage, which is imported from the outside of Miyakojima Island, is 741 tons. These imported grasses contain 7.6 ton of nitrogen however this nitrogen is not mandatory for pasturage.
Note that some pasturage is considered difficult to replace with resources on Miyakojima Island. Pasturage is fed to calves as hay after they are dried in the sun for 1 day to 4 days. Unfortunately pasturage fed to beef cattle that are over 10 months old must be dried further to achieve the targeted 15% water content. The reason why low water content hay is fed to beef cattle that are over 10 month old is to assure the quality of the meat: the pasturage which is not in the low water content, in other words hay, may change the meat color to a slight green. Drying hay sufficiently takes at least seven days and needs to be protected from rain completely during that time. One unrealistic method is to use greenhouses to produce the lower water content hay. The quantity of pasturage for beef cattle over 10 months old cannot be replaced with resources on Miyakojima Island is estimated 106 tons. Therefore, the total quantity of pasturage that need to be replaced with resources on Miyakojima Island is 635 ton.
Note that raw materials for the silage feeds in the present research are plowed under and create nutrient substances that are used for sugar cane cultivation. The present research thinks that the use for the beef cattle feed should be prior to being used for the composting because more ingredients are lost until being absorbed by agricultural plants in the composting process and fertilization.


