Article

Improving the Effectiveness of a Nutrient Removal System Composed of Microalgae and Daphnia by an Artificial Illumination

Department of Environmental Science, Kangwon National University, 313 Natural Science Building 2, Chuncheon, 200-701, Kangwon-do, Korea
*
Author to whom correspondence should be addressed.
Sustainability 2014, 6(3), 1346-1358; https://doi.org/10.3390/su6031346
Submission received: 20 December 2013 / Revised: 27 February 2014 / Accepted: 5 March 2014 / Published: 12 March 2014

Abstract

:
For determining the effect of illumination on nutrient removal in an artificial food web (AFW) system, we launched a pilot continuous-flow system. The system consisted of a storage basin, a phytoplankton growth chamber, and a zooplankton growth chamber. A 25,000 Lux AFW-light emitting diode (LED) on system and an AFW-LED off system were separately operated for 10 days. In the AFW-LED on system, the maximum chlorophyll-a concentration of the phytoplankton chamber was four times higher than that of the AFW-LED off system. With artificial nighttime illumination, the microalgae became both smaller and more nutritious; the microalgae became high quality food for the zooplankton, Daphnia magna. Consequently, this zooplankton became more efficient at extracting nutrients and grew more densely than in the AFW-LED off system condition. In the LED-on condition, the amounts of total nitrogen (TN) and total phosphorus (TP) flowing into the system for 10 days were 84.7 g and 20.4 g, and the amounts flowing out were 19.5 g (23%) and 4.0 g (20%), respectively. In contrast, in the LED-off condition, 83.8 g and 20.6 g of TN and TP flowed into the system while 38.8 g (46%) and 6.8 g (33%) flowed out, respectively. Artificial illumination significantly improves the removal rate of nutrients in an AFW system.

1. Introduction

Worldwide, eutrophication (caused by high concentrations of nitrogen and phosphorus) poses a major water quality problem. To prevent eutrophication, nutrient removal is necessary, and several mechanical treatment methods, such as the activated sludge (AS) process [1], the advanced anaerobic-anoxic-oxic (A2O) process [2], and the sequencing batch reactor (SBR) [3] were developed. However, these treatments take up a lot of space and are economically expensive; also, they cannot be applied to non-point source pollution. To overcome these limitations, several ecological treatments for nutrient removal, such as artificial wetlands [4], floating islands [5], and constructed ponds [6] have been developed. Nevertheless, the nutrient removal efficiencies of these ecotechnologies are lower than that of mechanical treatment.
An AFW system composed of phytoplankton and zooplankton was used for nutrient removal from sewage and stream water, and its efficiency was similar to that of mechanical treatment systems (such as the A2O process) [7,8]. Because of its cost effectiveness and convenience of construction and management (compared to mechanical treatment systems), this ‘solar energy based’ ecotechnology provides a practical method of nutrient removal. Moreover, this ecotechnology has enough buffering capacity to account for fluctuations of nutrient concentration (within the target water) and also for variable climate conditions (including ambient temperature and light intensity fluctuations) [9].
Most of this AFW system operates under natural conditions. The sun is the basic energy source of this system. Without sunlight, phytoplankton photosynthesis stops; under these conditions, the overall nutrient removal rates of AFW systems would drop. Thus, if there is nighttime artificial illumination, chlorophyll-a concentrations would increase. To test this hypothesis, we measured the nutrient removal efficiency of an AFW system subjected to artificial illumination.
Artificial illumination has been applied to manipulate the growth of photosynthetic organisms; it has been applied to grow whole plants [10], control algal blooms [11], and elevate algal biomass productivity [12]. To evaluate artificial illumination’s impact on efficiency, an AFW system composed of phytoplankton and Daphnia magna was operated under both LED on and off conditions for 60 days. The biomass and removal efficiencies (of TN and TP), for both conditions, were subsequently analyzed.

2. Materials and Methods

2.1. Characteristics of Target Water

The target water was supplied from a domestic sewage treatment plant at Chuncheon, Republic of Korea (52º48′39.50″N, 127º42′40.73″N). The water’s characteristics are shown in Table 1.
Table 1. The mean values and range of water quality variables observed in the target waste water during the operation of the AFW system.
Item *MaxMinMean
Temp (°C)29.523.524.6
pH (mg/L)6.926.106.38
DO (mg/L)5.314.404.97
TN (mg/L)8.888.138.37
TP (mg/L)2.191.942.06
* DO the concentration of dissolved oxygen, TN total nitrogen, TP total phosphorus

2.2. Facilities for AFW-LED System

Artificial illumination was combined with the AFW system, which was composed of phytoplankton and Daphnia magna, to improve its nutrient removal efficiency. The AFW system was designed by adopting the basic aspects of a laboratory-scale AFW system [8] and an artificial aquatic food web system (AAFW) system for polluted stream water [7]. The system was a continuous-flow system, consisting of a storage basin, a phytoplankton chamber, and a zooplankton chamber. The storage basin was a cylindrical container of 3 m3 capacity (Ø = 1.48 m, d = 1.7 m). The target water was placed in a storage basin to dampen fluctuations in both the quality and quantity of input water. The phytoplankton chamber was a cylindrical tank of 3 m3 capacity (Ø = 2.6 m, d = 0.75 m). For optimum phytoplankton growth conditions, the water was circulated by a pump (100 L min−1). To collect sludge, the chamber floor had a 10 °C slope toward the center of the chamber bottom. The zooplankton chamber was a rectangular chamber of about 1.5 m3 capacity (w = 1.2 m × 2.4 m, d = 0.6 m); for sludge collection, this chamber had a 10° vertical slope from the inlet to the outlet. A shade was installed on the top side of the chamber to stop phytoplankton growth. To prevent the loss of Daphnia magna, sand and gravel layers were located at the end of the zooplankton chamber.
The LED was applied to the phytoplankton chamber to create optimal growth conditions (Figure 1). To install the LED system, four rectangular buttresses (w = 3 m × 0.1 m) were used. A total of 20 LEDs (w = 90 cm × 2.5 cm) were attached under the buttresses; these were then placed on the phytoplankton chamber. The distance between the LED system and the water surface was kept within 5 cm. The total luminous intensity and photosynthetic active radiation (PAR) were about 25,000 Lux and 300 µmol m−2, respectively.

2.3. Phytoplankton Culture Conditions

To prepare phytoplankton inoculum, 5 L of target water were mixed with the same volume of water from Lake Ui-am, Chuncheon, in a 15 L transparent glass bottle, and incubated under sunlight for one week. Ten liters of the inoculum were added to 2 m3 target water in the phytoplankton chamber of an AFW system. Then, the phytoplankton’s growth rate was analyzed by measuring the chlorophyll-a concentration of week-old batch culture. The water in the phytoplankton chamber was circulated using a water pump and artificial illumination with LED was provided during nighttime (from 18:00 to 6:00). A control was also performed without LED. The phytoplankton chamber’s optimum hydraulic retention time (HRT) for the continuous-flow AFW system was determined via the batch cultures’ phytoplankton growth curves.
Figure 1. Schematic diagram of the artificial food web (AFW)-light emitting diode (LED) system.
Sustainability 06 01346 g001

2.4. Zooplankton Culture Conditions

We used Daphnia magna, a cladoceran, as the herbivorous zooplankton that fed on the phytoplankton assemblages in the effluent from the phytoplankton chamber. To determine the optimum density of Daphnia magna in the continuous-flow AFW system, the growth curve of Daphnia magna in the zooplankton chamber was obtained. After the zooplankton chamber was filled with water taken from a three-day-old phytoplankton batch culture, Daphnia magna was added. The initial concentration of chlorophyll-a and the Daphnia magna density were 545 ± 6 mg m−3 and 107 ± 15 individual L−1, respectively. The culture was incubated in the dark at 20 °C for 10 days and supplied with 542 ± 45 mg m−3 of chlorophyll-a daily.

2.5. Continuous-Flow AFW-LED System

The continuous-flow AFW-LED system was operated with both LED-on and -off conditions. Each condition was applied for 10 days; in the subsequent period, the conditions were switched. For each condition, a total of three operations were completed. The waters from the phytoplankton and zooplankton chambers were renewed after each performance and the phytoplankton and Daphnia magna were subcultured for the next operation. The AFW-LED system was constructed inside of a greenhouse at the domestic sewage treatment plant. The target sewage water was supplied to storage basin by using water pump every two days, and it was moved to phytoplankton chamber and zooplankton chamber, sequentially. The HRT of the phytoplankton chamber was set to 3.0 days. Thirty percent of the Daphnia magna was harvested per day from the zooplankton chamber; this quantity was determined according to the growth curves of phytoplankton and Daphnia magna. For harvesting of Daphnia magna, the entire area of the zooplankton chamber was partitioned into 10 parts, and zooplankton biomass in three parts was removed by a net with nominal cut-off size of 5.5 µm. About 10 and 5 L of sludge at the bottom of the phytoplankton and zooplankton chambers, respectively, were drained out every 5 days. During the period of operation, water temperature was 19.5 °C ± 4.8 °C in the phytoplankton chamber, and 16.4 °C ± 3.5 °C in the zooplankton chamber.
To determine the efficiency, water samples were taken from the storage basin, the phytoplankton chamber, the zooplankton chamber, and the effluent at 13:00 of every day, and analyzed, triplicately, for chlorophyll-a, for the number of Daphnia magna, and for concentrations of TN and TP [13]. Chlorophyll-a concentration was measured by spectrophotometer (UV-1700, SHIMADZU, Japan) at 430, 665 and 750 nm after extraction with 90% acetone. TN and TP analyses followed standard procedures [13]. TN was measured by ultraviolet spectrophotometric screening method with spectrophotometer (UV-1700, SHIMADZU, Japan) at 220 nm. TP was analyzed by ascorbic acid method with spectrophotometer (Qvis cs-2000, Chemical mac, Korea) at 880 nm.

3. Results

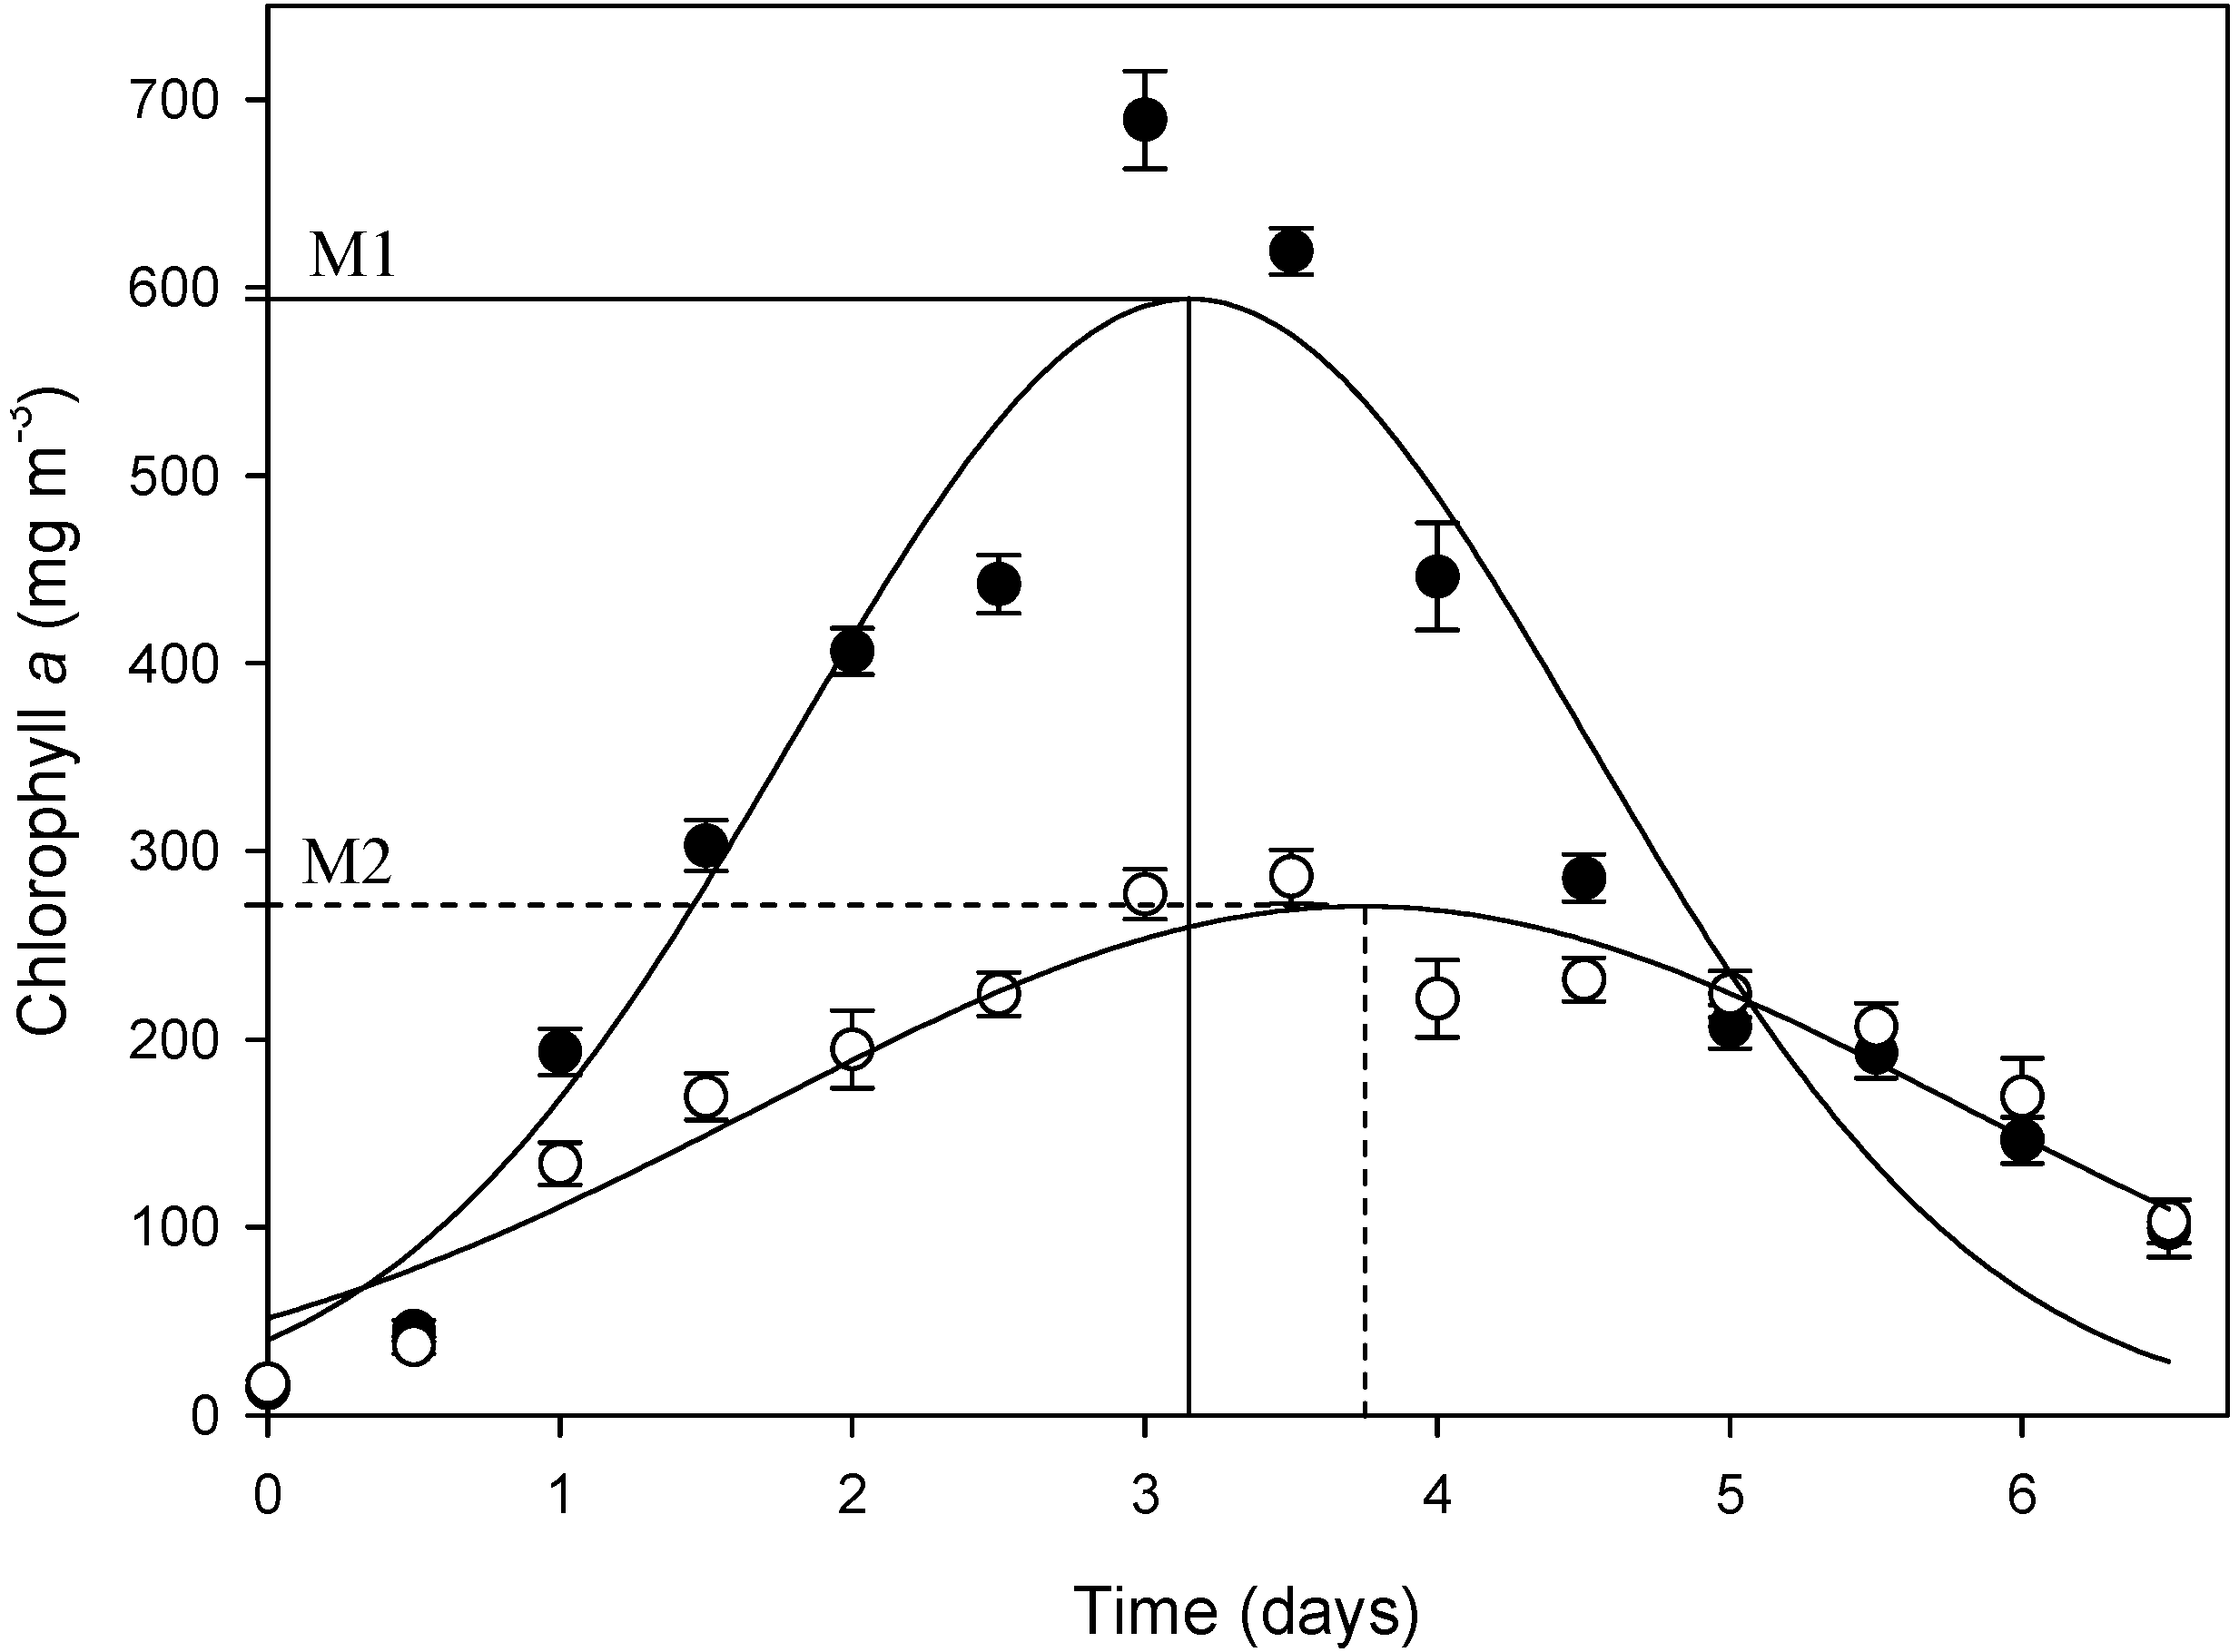
3.1. Growth of Phytoplankton

With the regression model of phytoplankton growth in batch culture, the maximum growth was determined to be 593 mg m−3 at 3.1 days under the LED-on condition and 270 mg m−3 at 3.7 days under the LED-off condition, respectively. Based on these results, the HRT in the phytoplankton chamber of the AFW system was set to three days (Figure 2).
Figure 2. Variation of chlorophyll-a concentration in the phytoplankton batch culture with LED-on and -off conditions. A non-linear regression on daily triplicate measurements (solid circles indicate LED-on and open circles indicate LED-off) with a Gaussian model yielded the regression line (solid line). The maximum growth determined by the regression model was 593 mg m−3 at 3.1 days (M1, solid line) under the LED-on condition and 270 mg m−3 at 3.7 days (M2, dotted line) under the LED-off condition.
Sustainability 06 01346 g002

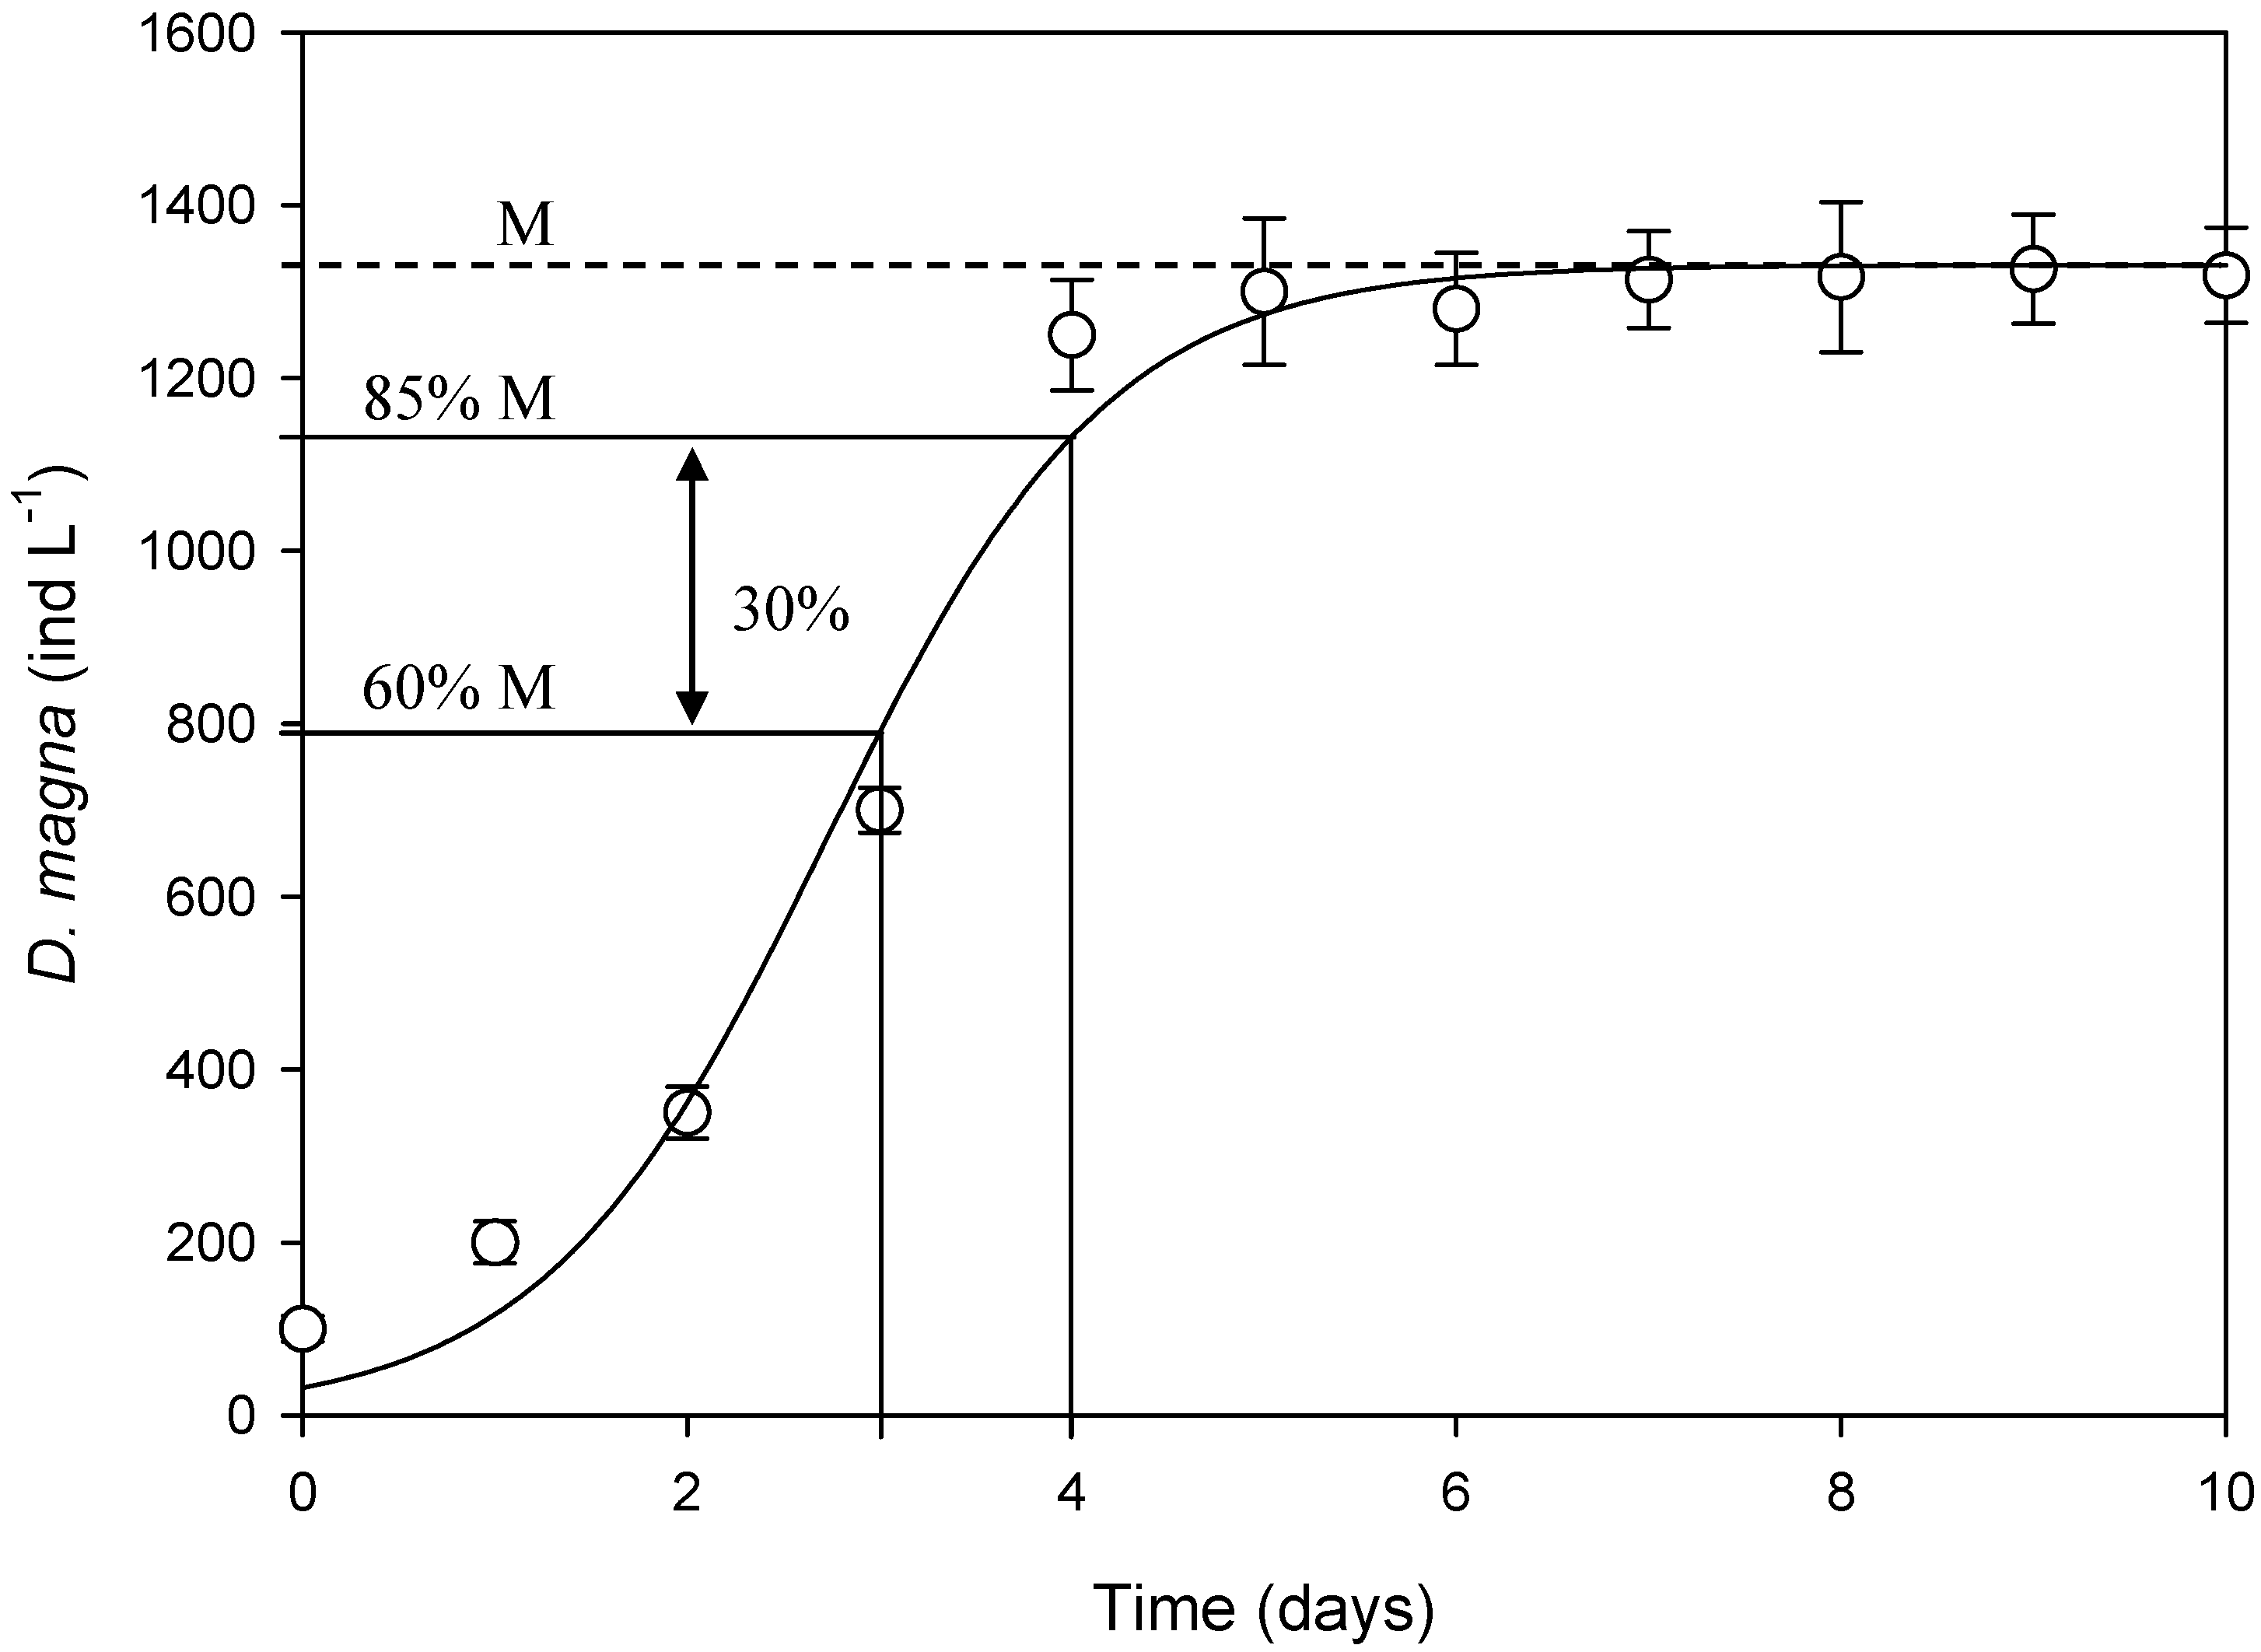
3.2. Growth of Zooplankton

The growth of Daphnia magna as a grazer of phytoplankton showed a typical growth curve in the batch culture (Figure 3). The number of Daphnia magna increased till the fourth day (at 1250 individual L−1). Then, the growth of Daphnia magna entered into a stationary phase; abundance was maintained at 1250–1326 individual L−1. The mean growth rate of the Daphnia magna population was 30% day−1. Based on this result, 30% of the Daphnia magna in the AFW system’s zooplankton chamber was removed every day.
Figure 3. Variation in the abundance of Daphnia magna in the batch culture. A non-linear regression on daily triplicate measurements (open circles) with a logistic growth model yielded the regression line (solid line). The maximum growth (M, dotted line) determined by the regression model was 1326 ± 65 individual L−1. When the Daphnia magna had both a high population and the fastest growth rate (3–4 days), the mean growth rate of the Daphnia magna population was 30% day−1.
Sustainability 06 01346 g003

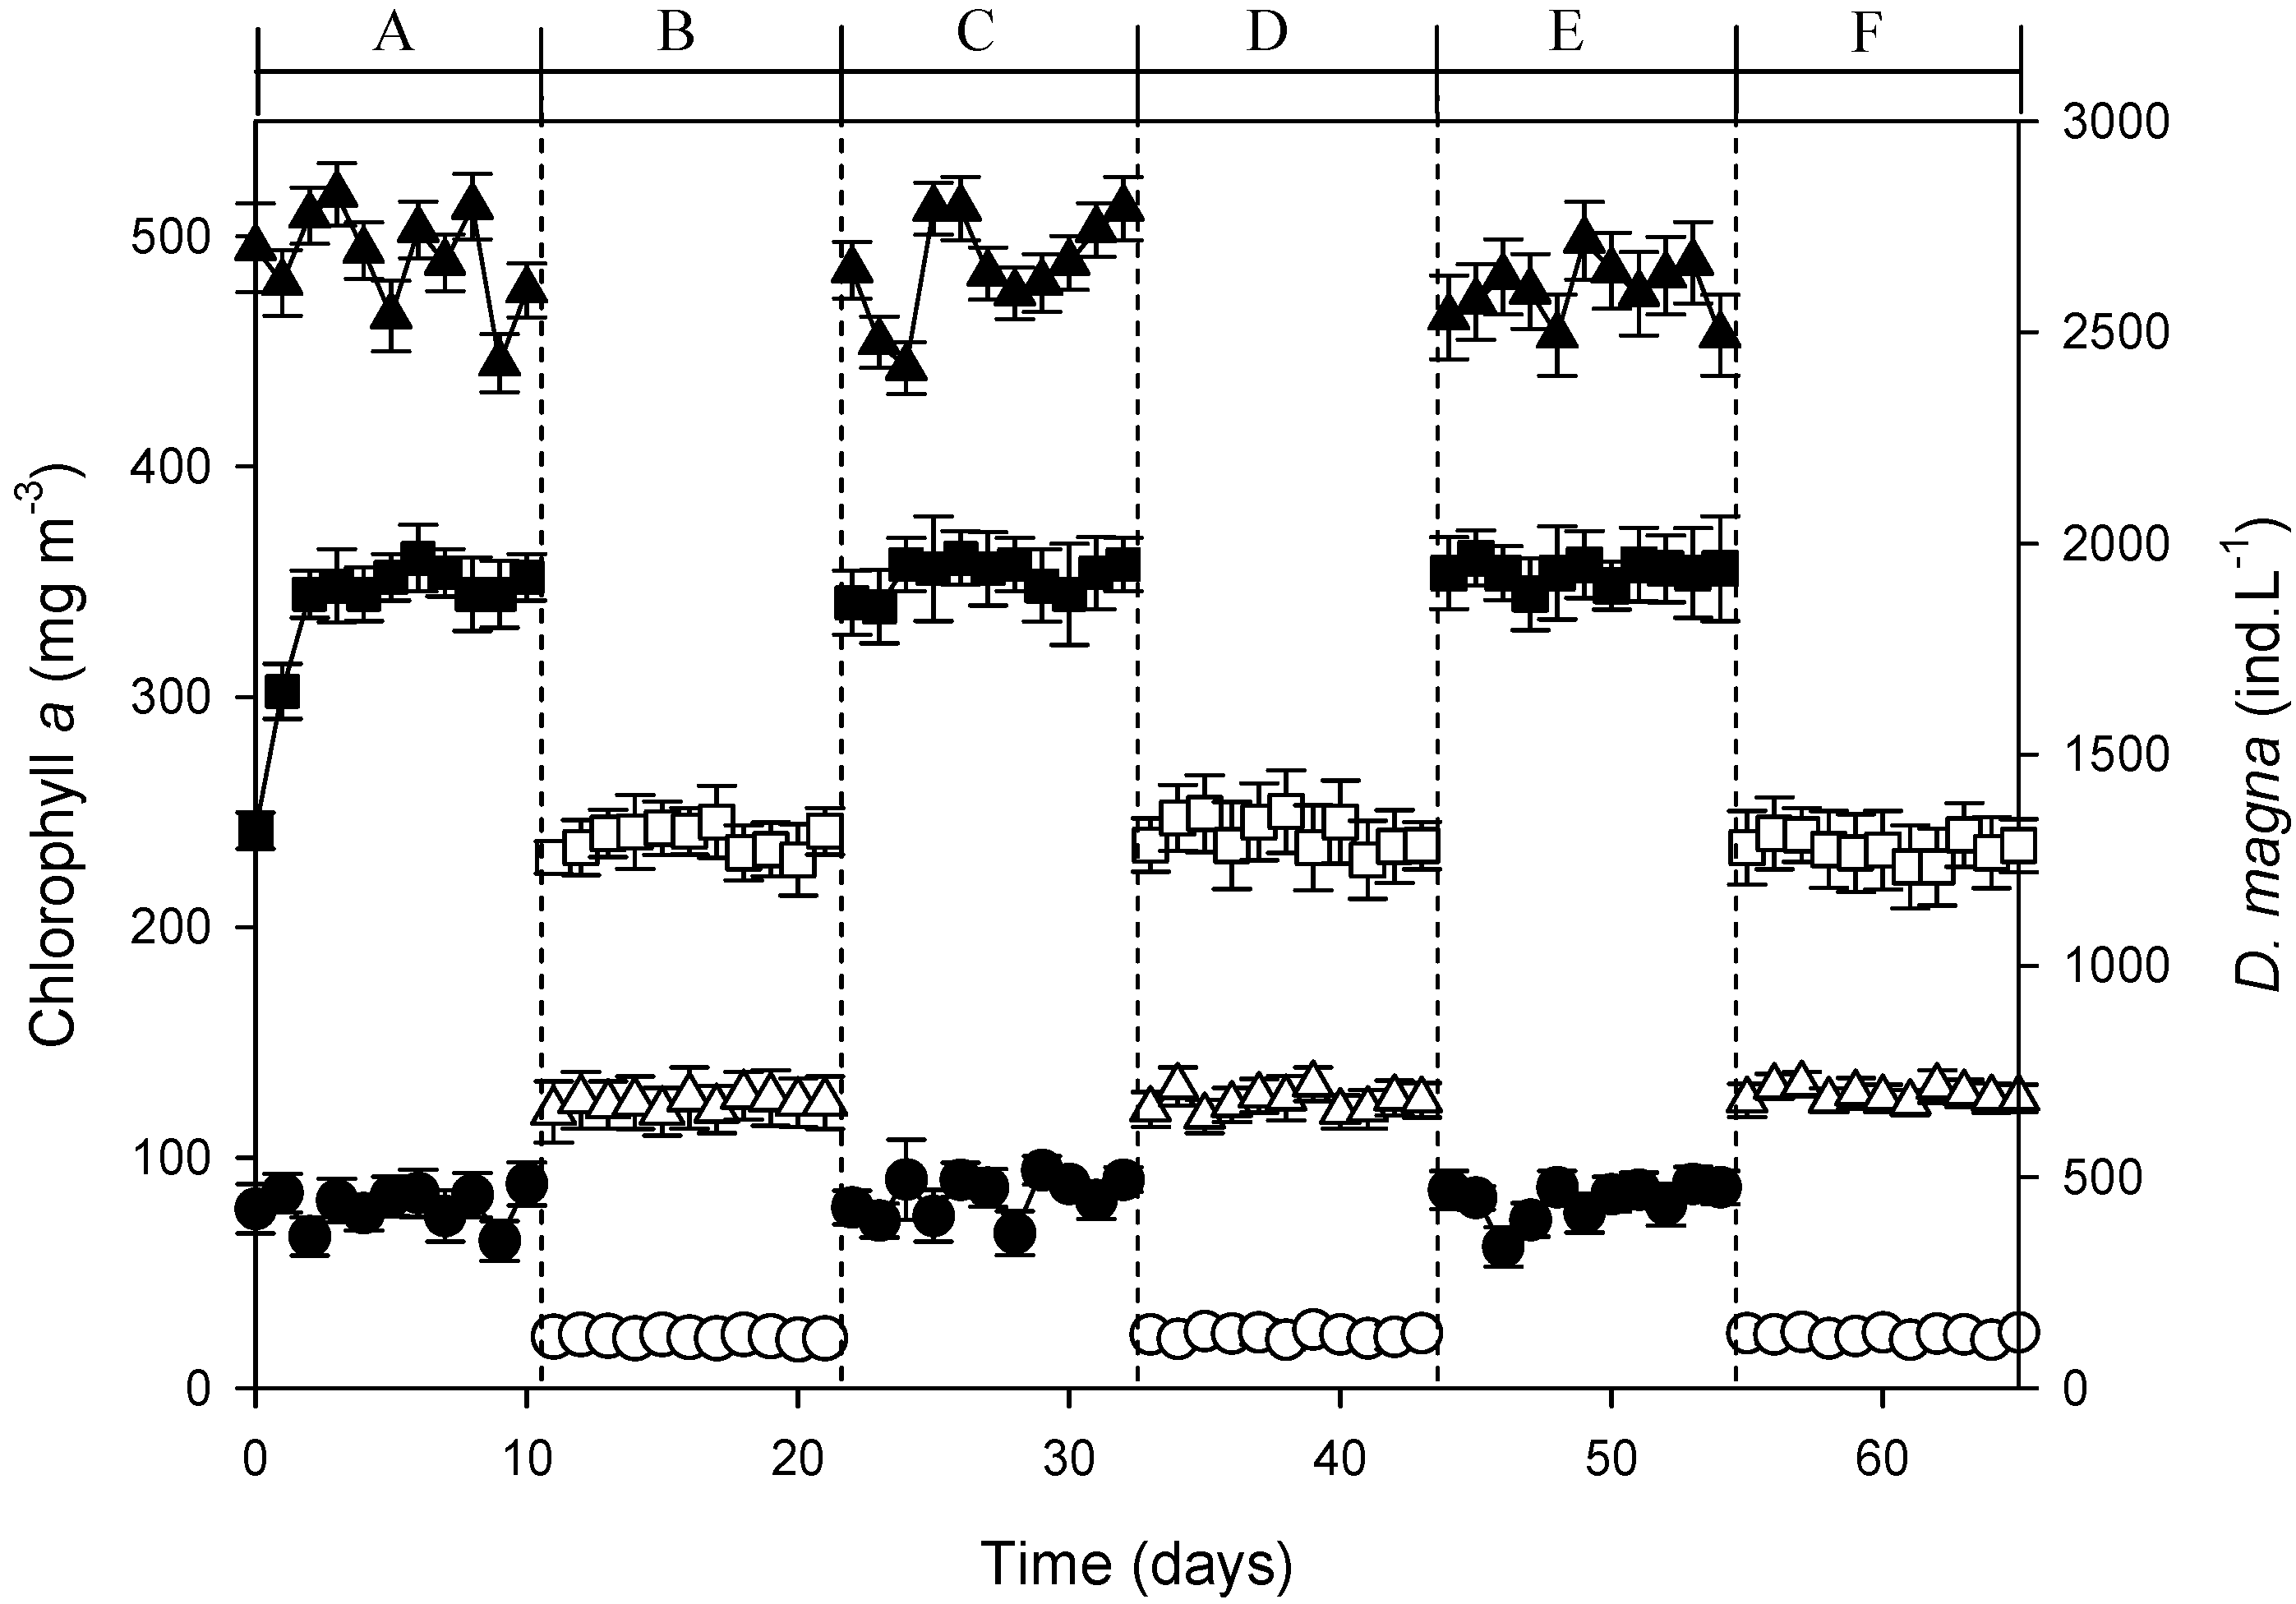
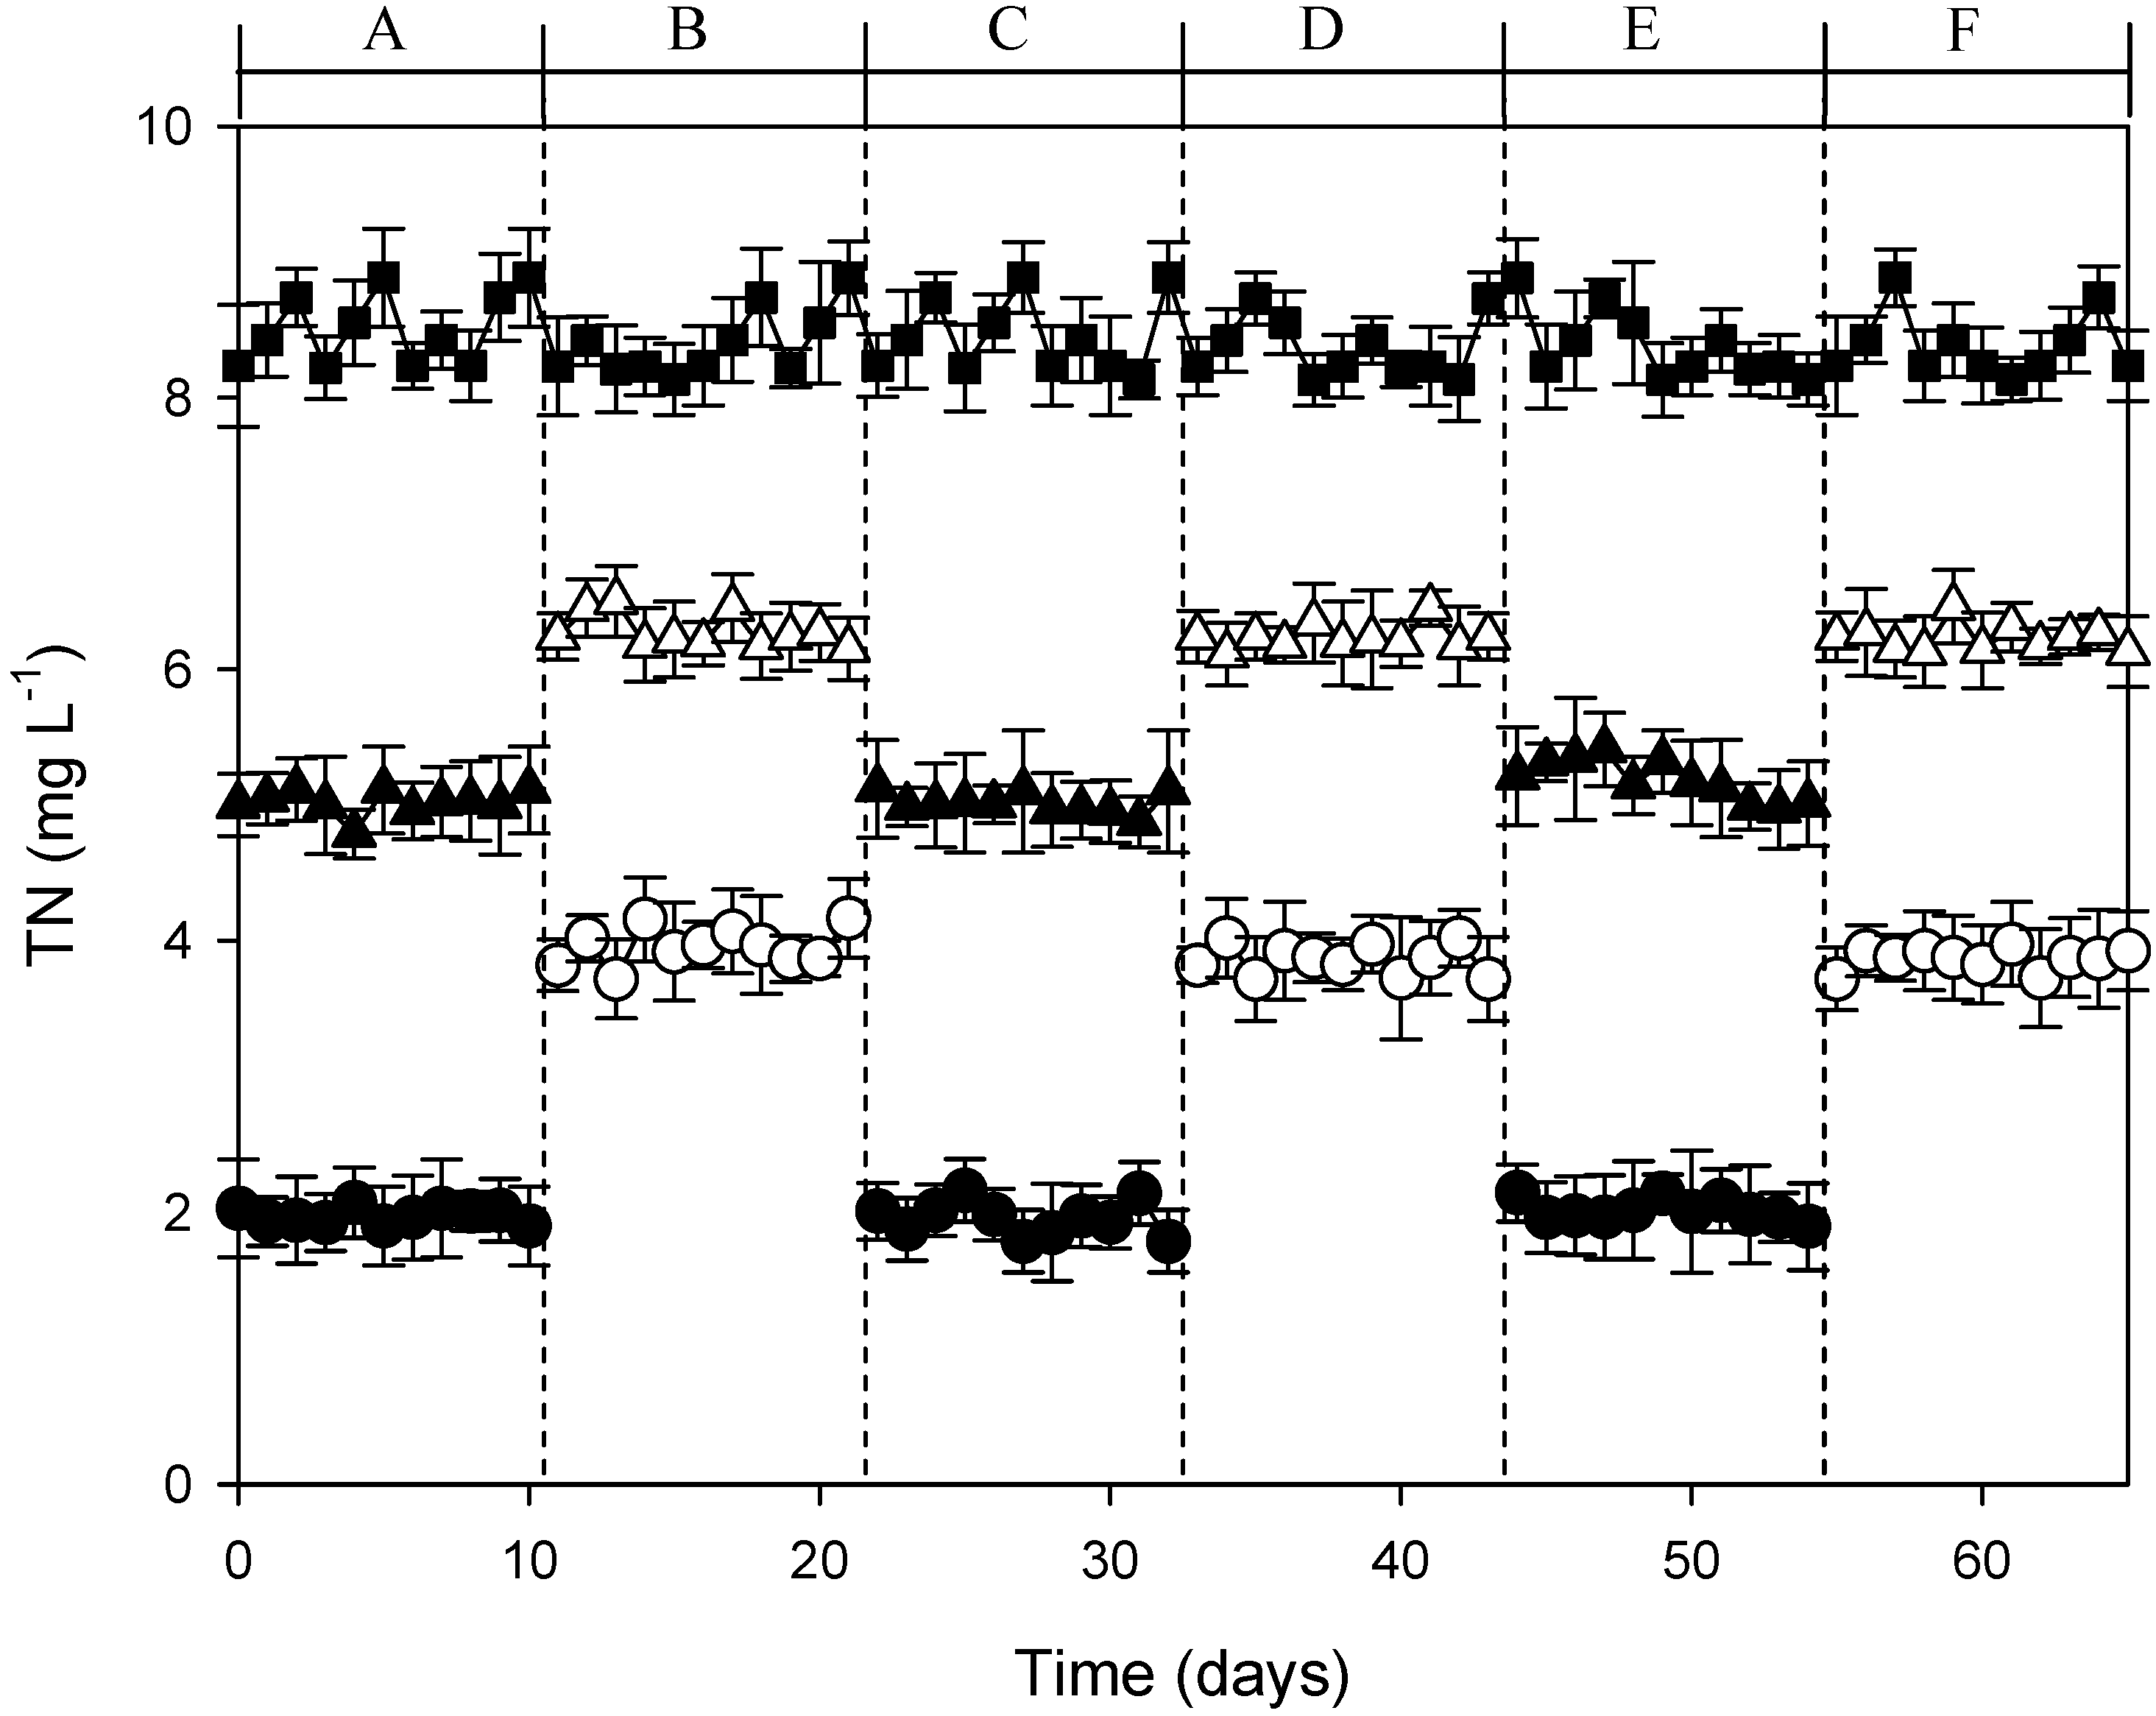
3.3. Continuous-Flow AFW-LED System

After incubating lake water mixed with sewage water, Scenedesmus was dominant and occupied 95% of the abundance in the phytoplankton chamber during the experiments. The mean value of chlorophyll-a in the AFW system’s phytoplankton chamber was 484 ± 20 mg m−3 under the LED-on condition, whereas it was 126 ± 4 mg m−3 under the LED-off condition (Figure 4). When the system was operated with artificial illumination, the maximum chlorophyll-a concentration of the phytoplankton chamber was four times higher than that of the system without LED. In the zooplankton chamber, the concentrations of chlorophyll-a decreased to 81 ± 8 mg m−3 and 23 ± 2 mg m−3 under the LED-on and -off conditions, respectively.
The density of Daphnia magna also increased during the LED-on condition (Figure 4). Under the LED-on condition, the population of Daphnia magna was maintained at 1922 ± 115 individual L−1; in contrast, it was 1295 ± 35 individual L−1 under the LED-off condition. Each Daphnia magna was harvesting 0.079 µg and 0.212 µg chlorophyll-a per day under the LED-on and -off conditions, respectively (see Figure 4).
With the LED-on condition, the concentration of TN in the storage basin averaged 8.5 ± 0.3 mg L−1, whereas in the effluent of the continuous-flow system, it was 1.95 ± 0.1 mg L−1. Under the LED-off condition, the concentration of TN in the storage basin was 8.4 ± 0.2 mg L−1 and was 3.90 ± 0.1 mg L−1 in the effluent (Figure 5).
In the case of TP, under the LED-on condition, the concentration in the storage basin was 2.04 ± 0.09 mg L−1, whereas that of the effluent was 0.40 ± 0.01 mg L−1. Under the LED-off condition, TP concentration in the storage basin was 2.06 ± 0.10 mg L−1, and was 0.68 ± 0.02 mg L−1 in the effluent (Figure 6). Based on these mean values, the mean removal efficiencies of TN and TP were calculated to be 77% and 80% under the LED-on condition and 54% and 67% under the LED-off condition, respectively.
Figure 4. Variations in chlorophyll-a concentration and the abundance of Daphnia magna during the operation of the AFW-LED system. A triangle represents chlorophyll-a in the phytoplankton chamber; a circle represents chlorophyll-a in the zooplankton chamber; a square represents the number of Daphnia magna in the zooplankton chamber. Sections A, C, and E show the LED-on condition data and B, D, and F show the LED-off condition data.
Sustainability 06 01346 g004
Figure 5. Variations of TN concentration during the operation of the AFW-LED system. A square represents the storage basin; a triangle represents the phytoplankton chamber; a circle represents the zooplankton chamber. The meanings of each section are the same as that of Figure 4’s sections.
Sustainability 06 01346 g005
Figure 6. Variations of TP concentration during the operation of the AFW-LED system. The symbols and meanings of each section are the same as those of Figure 5.
Sustainability 06 01346 g006
The pH and dissolved oxygen (DO) values had differences between the LED-on and -off conditions. While the mean pH value of the target water was 6.38 ± 0.3, those in the phytoplankton chamber were 12.0 ± 0.6 and 10.7 ± 0.4 under the LED-on and -off conditions, respectively. These values then dropped to 7.6 ± 0.3 and 7.9 ± 0.3, respectively, in the zooplankton chamber.
The mean DO of the target water was 5.31 ± 0.3 mg L−1 and in phytoplankton chamber, the means were 17.6 ± 0.5 mg L−1 and 12.1 ± 0.4 mg L−1 under LED-on and -off conditions, respectively. In the zooplankton chamber, these values were 8.3 ± 0.6 mg L−1 and 8.5 ± 0.2 mg L−1, respectively.
The material budget of the AFW-LED system was calculated and presented in Table 2. Nitrogen and phosphorus might be removed by ammonia stripping, sedimentation, and algae uptake in phytoplankton chamber and by elimination of Daphnia magna and sludge in zooplankton chamber. Under the LED-on condition, the amounts of TN and TP flowing into the system for 10 days were 84.7 g and 20.4 g, respectively, and the amounts flowing out were 19.5 g (23%) and 4 g (20%), respectively. Biologically, 34.3 g (40%) of TN and 11.1 g (54%) of TP were removed by phytoplankton and 30.9 g (37%) of TN and 5.3 g (26%) of TP by zooplankton.
Under the LED-off condition, a total of 83.8 g and 20.6 g of TN and TP flowed into the system for 10 days and 38.8 g (46%) and 6.8 g (33%) flowed out. Biologically, 21.5 g (26%) of TN and 8.9 g (43%) of TP were removed in the phytoplankton chamber and 23.5 g (28%) of TN and 4.9 g (24%) of TP in the zooplankton chamber.
Table 2. Material budget of TN and TP in the AFW-LED system. Numbers in parentheses indicate the proportions (%) relative to the amounts of nutrients in the target water.
LED-on/offItemInflowRemoval in phytoplankton chamberRemoval in Daphnia magna chamberEffluentTotal removal
LED-onTN (g)84.7
(100%)
34.3
(40%)
30.9
(37%)
19.5
(23%)
65.2
(77%)
TP (g)20.4
(100%)
11.1
(54%)
5.3
(26%)
4.0
(20%)
16.4
(80%)
LED-offTN (g)83.8
(100%)
21.5
(26%)
23.5
(28%)
38.8
(46%)
45.0
(54%)
TP (g)20.6
(100%)
8.9
(43%)
4.9
(24%)
6.8
(33%)
13.8
(67%)

4. Discussion

LED lighting treatment resulted in significant differences in the biomasses phytoplankton and Daphnia magna and in the removal efficiency of TN and TP in the AFW system. Microalgae are cultured for commercial purposes, such as foods [14], feeds [15], biodiesel [16], pharmaceutical products [17], and wastewater treatment [18]. Also, microalgae are good prey for the Daphnia magna, they are used as a key organism in the AFW system. With artificial nighttime illumination, the microalgal biomass was four times higher than under conditions without illumination. In the batch culture under the LED-on condition, the highest chlorophyll-a concentration was 593 mg m−3 at 3.1 days, while under the LED-off condition, it was 270 mg m−3 at 3.7 days. We set the HRT of the phytoplankton chamber at 3.0 days; thus, under the LED-off condition, the dilution rate (D) was higher than the growth rate of microalgae (µ); the chlorophyll-a concentration was shifted to about 126 mg m−3.
The increase of algal biomass via artificial illumination might be the major reason for better efficiency of nutrient removal. Phosphorus and nitrogen containing compounds, such as ATP and NADPH, are actively produced when microalgae undergo photosynthesis (i.e., when cells are illuminated). In contrast, microalgal biomass would be lost by respiration during nighttime [19]. In this study, artificial illumination maintained the growth of algae, even during nighttime, which had a positive influence on nutrient removal.
In addition, because pH and DO in the phytoplankton chamber increased under the LED-on condition, artificial illumination might help chemical activities, such as ammonia stripping and the precipitation of nutrients. Ammonia (high pH) is easily eliminated by shaking water, and phosphorus can be removed via precipitation as Ca–Mg-PO4 complexes. Moreover, at pH values greater than 10, algal cells tend to adhere to these complexes and algal flocculation occurs [20]. Under the LED-on condition, because pH value reached up to 12, chemical precipitation and algal flocculation can occur; the precipitate sinks as sludge.
Also, high amounts of DO provide a good environment for heterotrophic bacteria. Bacteria in the phytoplankton chamber might contribute to the overall efficiency of nutrient removal by converting organic forms of nutrients into dissolved inorganic forms that can be readily used by the phytoplankton for biosynthesis [7]. Under the LED-on condition, because the DO value was 45% higher than that that of the LED-off condition, more activities of heterotrophic organisms might affect the nutrient removal rate.
The Daphnia magna in the AFW system is another key player that can collect scattered phytoplankton and make fecal pellets, which contain high concentrations of both TN and TP. In general, Daphnia magna abundance is limited by shortages of food, space or oxygen, or by the accumulation of growth-inhibitory wastes [21]. In two previous AFW systems, the maximum Daphnia magna density in the zooplankton chamber was close to 1,400 individual L−1, regardless of prey abundance; the maximum was relatively stable even when chlorophyll-a concentrations ranged from 83–874 mg m−3 [7,8]. Therefore, researchers concluded that Daphnia magna abundance in AFW systems was limited by shortages of space [7]. However, under the LED-on condition, the maximum number of Daphnia magna was 44% more than those of previous AFW systems that lacked artificial illumination. We believe that the major factor for increasing the maximum density of Daphnia magna might be a change in food quality. For filter-feeding zooplankton, food quality is defined in terms of physical makeup, and concerns digestibility and particle size [22]. Also, the chemical composition, such as the C:P:N ratios, has been shown to be a major determinant of food quality for herbivores, such as Daphnia [23]. Light enhances microalgal growth [24], and also lowers the C:N and C:P ratios of algal biomass [19]. Therefore, we assumed the following possible explanations for the observed Daphnia magna density changes in our AFW-LED system. First, microbial cell size under light-dark cycle conditions would be bigger than those under continuous illumination conditions; this is because cells would not be able to divide under unfavorable conditions (such as dark conditions) [19]. Thus, the smaller-sized algae created by continuous illumination might be a higher quality food for Daphnia magna, which is a filter feeder. Secondly, under continuous illumination, microalgae contain low C:N and C:P ratios [25]. Low C:N and C:P ratios indicate good food quality for Daphnia magna; consequently, Daphnia magna density in the AFW-LED system increased. Because of these aforementioned reasons, it is likely that high quality food was supplied to Daphnia magna during the LED-on condition, which allowed the AFW-LED system to contain a higher density of Daphnia magna than that of other AFW systems. Because a high density of Daphnia magna can enhance the harvesting rate and production of fecal pellets and sludge, higher densities lead to higher nutrient removal efficiency in the zooplankton chamber.
Under the LED-on condition, the average chlorophyll-a concentration of the phytoplankton chamber increased to 285% higher than that of the system without LED. The removal efficiency for TN and TP was also enhanced by up to 43% and 20% (compared to those systems without artificial illumination), respectively. These results indicate that artificial illumination clearly improves nutrient removal efficiency and hence, provides a reasonable solution for overcoming its own disadvantages. Also, because several studies looking for optimal growth conditions of algae subjected to LED have been performed recently [12,26,27], the efficiency of the AFW-LED system for nutrient removal will be upgraded continuously in the future.

5. Conclusion

Artificial illumination promotes nutrient removal in AFWs. With LEDs, the nutrient removal rate of an AFW system was enhanced. In a phytoplankton chamber subjected to nighttime light, a pH value of 12 was reached because of the high photosynthetic activity and the chemical precipitation of nutrients. In addition, fresh and tiny phytoplankton can be high-quality food for Daphnia magna. Therefore, Daphnia magna overcame space-limitations and reached densities of 1922 ± 115 individual L−1. With these processes, in an LED-on system, the nutrients in target water were efficiently removed (compared to removal rates in an LED-off system). Artificial illumination can be applied to various conditions. For example, during winter, this system can be operated indoors. Since the LED can supply light in any direction, the system can be designed to be smaller than previous solar energy based AFW systems. This ecotechnology can be used for various purposes, such as post-treatment of sewage plant and livestock wastes.

Acknowledgments

This study was supported by the CAER (Center for Aquatic Ecosystem Restoration) of the Eco-STAR project, from the MOE (Ministry of the Environment, Korea).

Author Contributions

In-Ho Chang conducted the field work and performed most of the analyses. Dawoon Jung contributed to the analyses and manuscript processing. Tae Seok Ahn is principal investigator of this study and contributed to manuscript processing.

Conflicts of Interest

The authors declare no conflict of interest.

References

  1. Tawfik, A.; El-Gohary, F.; Ohashi, A.; Harada, H. Optimization of the performance of an integrated anaerobic-aerobic system for domestic wastewater treatment. Wat. Sci. Tech. 2008, 58, 320–328. [Google Scholar]
  2. Wu, C.-Y.; Peng, Y.-Z.; Wan, C.-L.; Wang, S.-Y. Performance and microbial population variation in a plug-flow A2O process treating domestic wastewater with low C/N ratio. J. Chem. Technol. Biotechnol. 2011, 86, 461–467. [Google Scholar] [CrossRef]
  3. Amini, M.; Younesi, H.; Najafpour, G.; Zinatizadeh-Lorestani, A.A. Application of response surface methodology for simultaneous carbon and nitrogen (SND) removal from dairy wastewater in batch systems. Int. J. Environ. Stud. 2012, 69, 962–986. [Google Scholar] [CrossRef]
  4. Li, Y.; Zhu, G.; Ng, W.J.; Tan, S.K. A review on removing pharmaceutical contaminants from wastewater by constructed wetlands: Design, performance and mechanism. Sci. Total Environ. 2012, 468, 908–932. [Google Scholar]
  5. Azza, N.; Denny, P.; Koppel, J.V.D.; Kansiime, F. Floating mats: Their occurrence and influence on shoreline distribution of emergent vegetation. Freshwater Biol. 2006, 51, 1286–1297. [Google Scholar] [CrossRef]
  6. Mohedano, R.A.; Costa, R.H.R.; Tavares, F.A.; Belli Filho, P. High nutrient removal rate from swine wastes and protein biomass production by full-scale duckweed ponds. Bioresour. Technol. 2006, 112, 98–104. [Google Scholar]
  7. Jung, D.; Cho, A.; Zo, Y.-G.; Choi, S.-I.; Ahn, T.-S. Nutrient removal from polluted stream water by artificial aquatic food web system. Hydrobiologia 2009, 630, 149–159. [Google Scholar] [CrossRef]
  8. Kim, S.-R.; Woo, S.-S.; Cheong, E.-H.; Ahn, T.-S. Nutrient removal from sewage by an artificial food web system composed of phytoplankton and Daphnia magna. Ecol. Eng. 2003, 21, 249–258. [Google Scholar] [CrossRef]
  9. Tam, N.F.Y.; Wong, Y.S. Wastewater nutrient removal by Chlorella pyrenoidosa and Scenedesmus sp. Environ. Pollut. 1989, 58, 19–34. [Google Scholar] [CrossRef]
  10. Bula, R.J.; Murrow, R.C.; Tibbitts, T.W.; Barta, D.J. Light-emitting diodes as a radiation source for plants. HortScience 1991, 26, 203–205. [Google Scholar]
  11. Oh, S.; Park, D.-S.; Yang, H-S.; Yoon, Y.; Honjo, T. Bioremediation on the benthic layer in polluted inner bay by promotion of microphytobenthos growth using light emitting diode (LED). J. Korean Soc. Mar. Sci. Eng. 2007, 10, 93–101. [Google Scholar]
  12. Lunka, A.; Bayless, D. Effects of flashing light-emitting diodes on algal biomass productivity. J. Appl. Phycol. 2013, 25, 1679–1685. [Google Scholar] [CrossRef]
  13. American Public Health Association. Standard Methods for the Examination of Water and Wastewater, 20th ed.; American Public Health Association: Washington, DC, USA, 2001. [Google Scholar]
  14. Kay, R.A.; Barton, L.L. Microalgae as food and supplement. Crit. Rev. Food Sci. Nutr. 1991, 30, 555–573. [Google Scholar] [CrossRef]
  15. Patil, V.; Källqvist, T.; Olsen, E.; Vogt, G.; Gislerød, H. Fatty acid composition of 12 microalgae for possible use in aquaculture feed. Aquacult. Int. 2007, 15, 1–9. [Google Scholar] [CrossRef]
  16. Mata, T.M.; Martins, A.A.; Caetano, N.S. Microalgae for biodiesel production and other applications: A review. Renew. Sust. Energ. Rev. 2010, 14, 217–232. [Google Scholar] [CrossRef]
  17. Van der Spiegel, M.; Noordam, M.Y.; Van der Fels-Klerx, H.J. Safety of Novel Protein Sources (Insects, Microalgae, Seaweed, Duckweed, and Rapeseed) and Legislative Aspects for Their Application in Food and Feed Production. Compr. Rev. Food Sci. F. 2013, 12, 662–678. [Google Scholar] [CrossRef]
  18. Ramos Tercero, E.A.; Sforza, E.; Morandini, M.; Bertucco, A. Cultivation of Chlorella protothecoides with urban wastewater in continuous photobioreactor: Biomass productivity and nutrient removal. Appl. Biochem. Biotechnol. 2014, 172, 1470–1485. [Google Scholar] [CrossRef]
  19. Lee, K.; Lee, C-G. Effect of light/dark cycles on wastewater treatments by microalgae. Biosci. Biotechnol. Biochem. 2001, 6, 194–199. [Google Scholar]
  20. Kawasaki, L.Y.; Tarifeňo-Silva, E.; Yu, D.P.; Gordon, M.S.; Chapman, D.J. Aquacultural approaches to recycling of dissolved nutrients in secondarily treated domestic wastewaters-I Nutrient uptake and release by artificial food chains. Water Res. 1982, 16, 37–49. [Google Scholar] [CrossRef]
  21. Persson, J.; Brett, M.T.; Vrede, T.; Ravet, J.L. Food quantity and quality regulation of trophic transfer between primary producers and a keystone grazer (Daphnia) in pelagic freshwater food webs. Oikos 2007, 116, 1152–1163. [Google Scholar] [CrossRef]
  22. Ahlgren, G.; Lundstedt, L.; Brett, M.; Forsberg, C. Lipid composition and food quality of some freshwater phytoplankton for cladoceran zooplankters. J. Plankton Res. 1990, 12, 809–818. [Google Scholar] [CrossRef]
  23. DeMott, W. Implications of element deficits for zooplankton growth. Hydrobiologia 2003, 491, 177–184. [Google Scholar] [CrossRef]
  24. Jacobi, A.; Steinweg, C.; Sastre, R.R.; Posten, C. Advanced photobioreactor LED illumination system: Scale-down approach to study microalgal growth kinetics. Eng. Life Sci. 2012, 12, 621–630. [Google Scholar] [CrossRef]
  25. Tennessen, D.; Singsaas, E.; Sharkey, T. Light-emitting diodes as a light source for photosynthesis research. Photosynth. Res. 1994, 39, 85–92. [Google Scholar] [CrossRef]
  26. Jeong, H.; Lee, J.; Cha, M. Energy efficient growth control of microalgae using photobiological methods. Renew. Energ. 2013, 54, 161–165. [Google Scholar] [CrossRef]
  27. Gris, B.; Morosinotto, T.; Giacometti, G.; Bertucco, A.; Sforza, E. Cultivation of Scenedesmus obliquus in photobioreactors: Effects of light intensities and light-dark cycles on growth, productivity, and biochemical composition. Appl. Biochem. Biotechnol. 2013, 172, 1–13. [Google Scholar]

