An Integrated Approach to Modelling the Economy-Society-Ecology System in Urbanization Process


Abstract
:1. Introduction
2. Literature Review
3. System Description
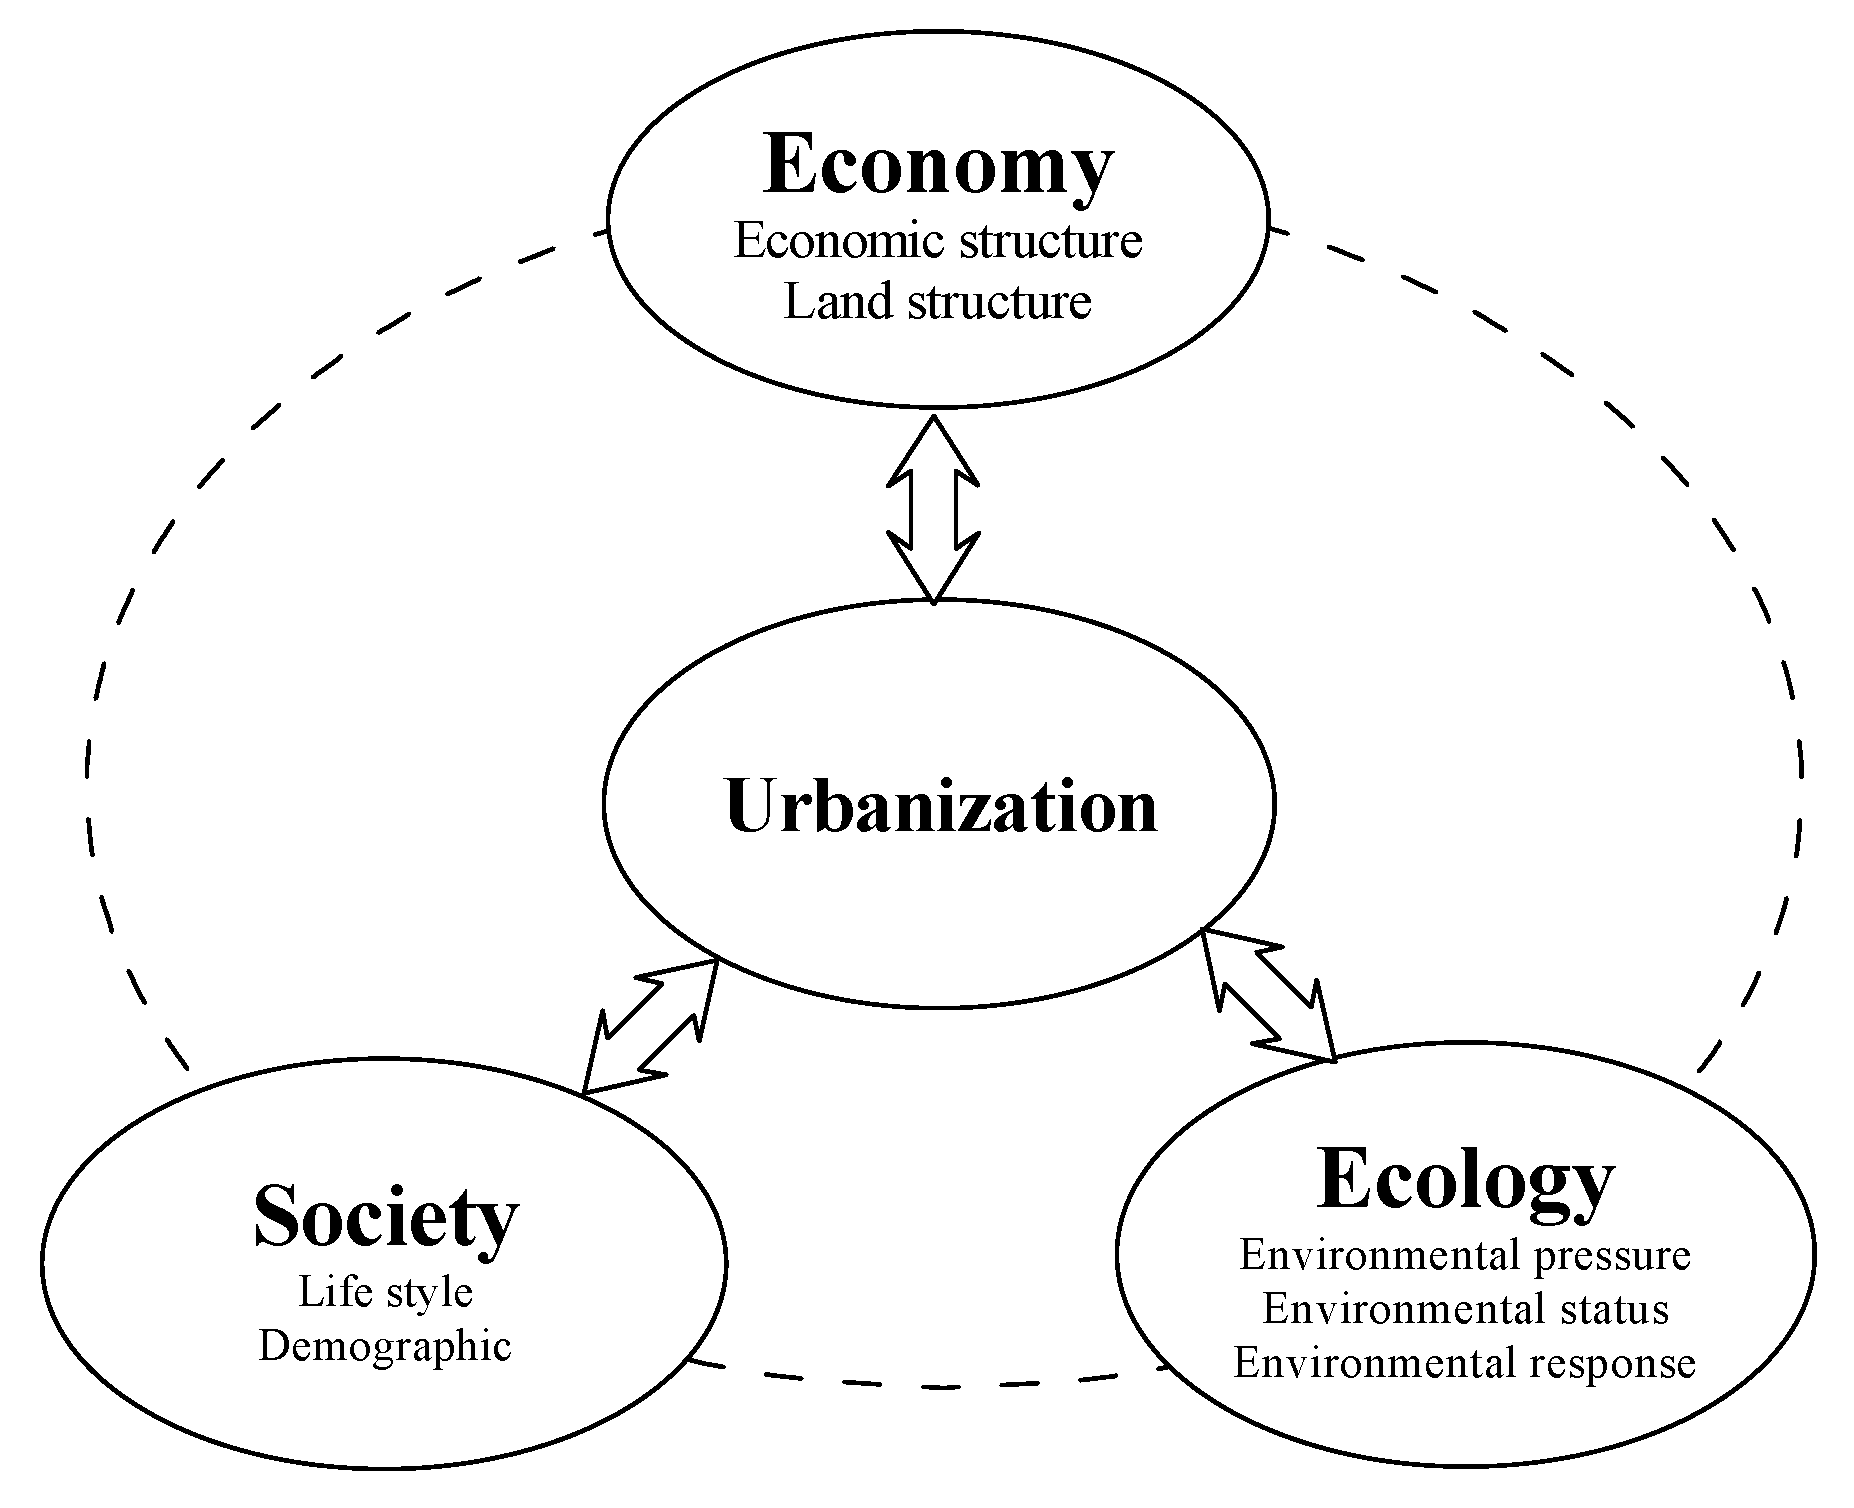
3.1. ESE Three-Dimensional System


3.2. Proposed Research Framework
4. Model Building
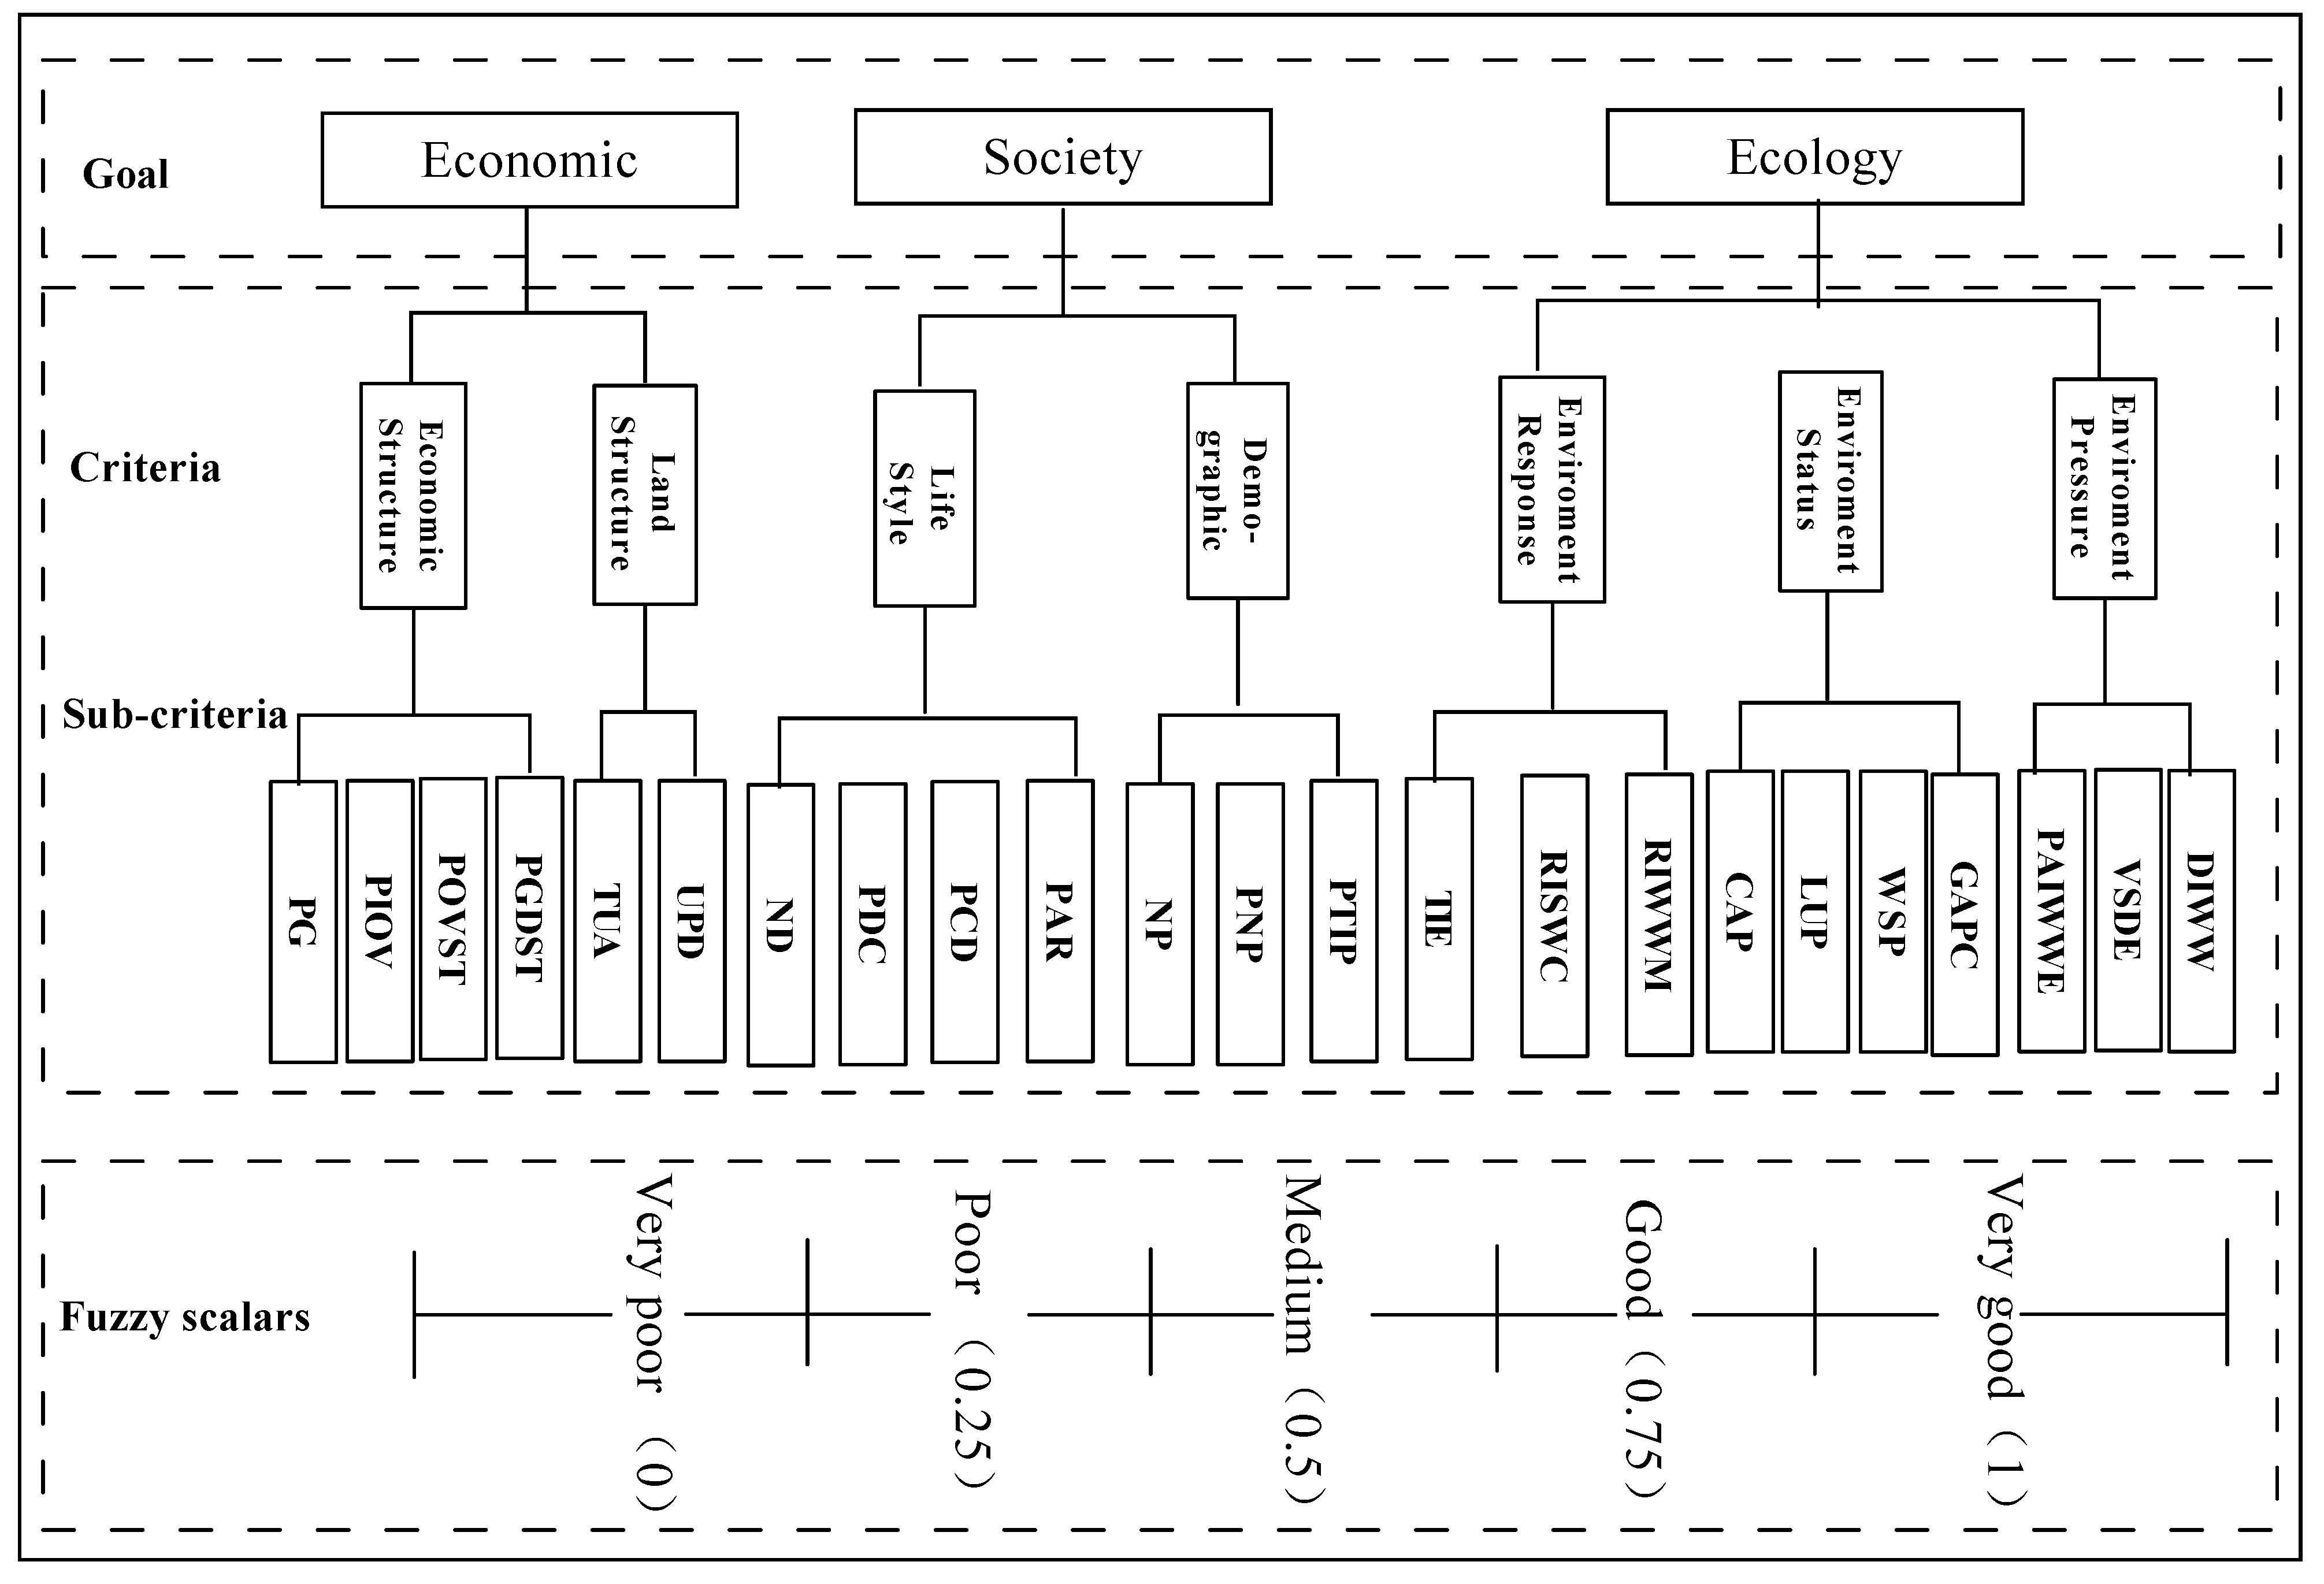
4.1. The Outside Representation and Indices for Evaluation of ESE

| Sub-system | Index&Direction | ||
|---|---|---|---|
| The integration value of Economic (E) | Economic structure | Per capita GDP (Yuan) + | |
| Per capita industrial output value (Yuan) + | |||
| The proportion of output value between | |||
| secondary industry and tertiary industry (%) | + | ||
| The proportion of GDP density between | |||
| secondary industry and tertiary industry(%) | + | ||
| Land structure | Total urban area (K m2 ) + | ||
| Urban population density (persons/sq · km) | - | ||
| The integration value of Society (S) | Life style | Number of doctors per 10,000 people + | |
| The per household electricity consumption (◦/person) -People with college degrees (per 10,000 people) + | |||
| Per capita area of roads (m2 /person) + | |||
| Demographic | The nonagricultural population (million persons) + | ||
| Percentage of nonagricultural population(%) + | |||
| The proportion of the third industry practitioners(%) + | |||
| The integration value of Ecology (E) | Environmental pressure | Discharge of industrial waste water (tons/capita) - | |
| Volume of sulfur dioxide emission by industry (t) - | |||
| The per unit area industrial waste water emissions (t/km2 ) - | |||
| Environmental status | Cultivated area per capita (hm2 /capita) + | ||
| Land use per capita (sq.m/capita) + | |||
| Water supply per capita (tons/capita) + | |||
| Green area per capita (sq.m) + | |||
| Environmental response | Ratio of industrial waste water meeting discharge standards (%) + | ||
| Ratio of Industrial solid waste comprehensive utilization (%) + | |||
| Total investment in the treatment of Environmental pollution as percent of GDP (Yuan) + | |||
4.2. ESE Evaluation Based on the ME Theory and EM
4.2.1. The FME and Complex FME
4.2.1.1. FME

4.2.1.2. Preferred Membership in FME


4.2.1.3. Classical Domain and Segmented Domain of ME

4.2.1.4. Correlation Degree Between Each ME Object and Standard Object
 . The correlation degree matrix between each matter-element object and a standard object is expressed as follows:

4.2.2. The Weight Determination Using the Hybrid Algorithm Along with EM and FAHP
4.2.2.1. EM


4.2.2.2. FAHP Method
4.2.2.3. Blend Weights


4.3. The Coupling Coordination Degree Model of ESE


5. Case Study
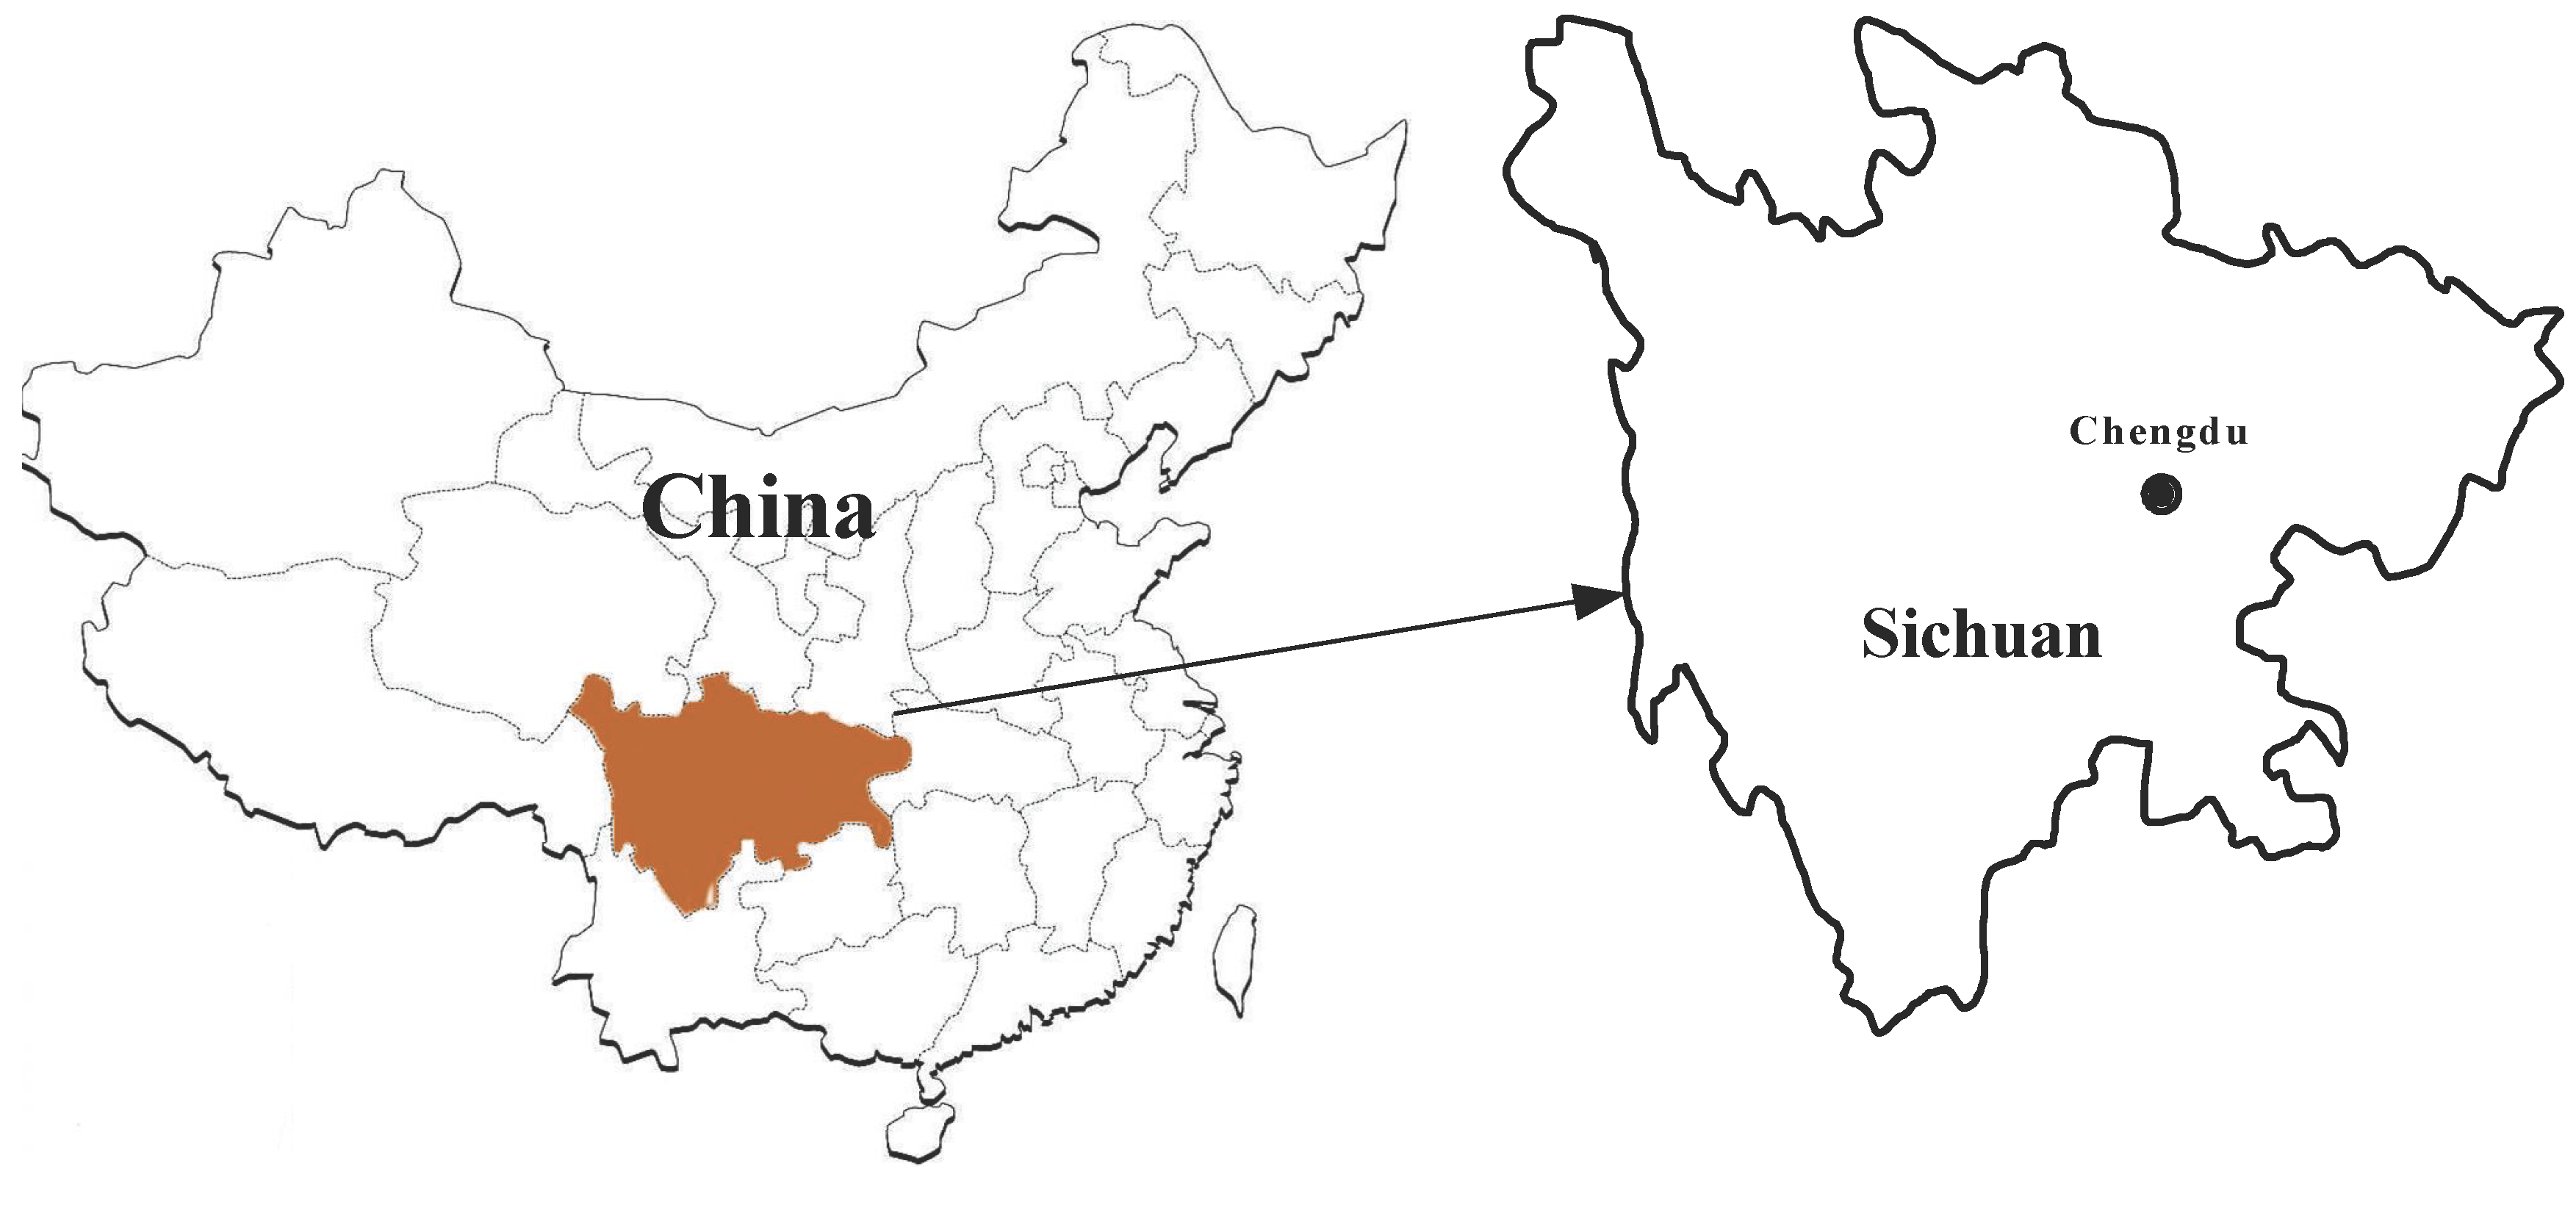
5.1. Study Area

5.2. Simulation
 ,
,  ,…,
,…,  } j = 1, …, m
 ,
,  ,…,
,…,  } j = 1, …, m


| Goal | Criteria | Sub-criteria | Local weights by FAHP | Local weights by ME | Comprehensive local weights | Comprehensive global weights |
|---|---|---|---|---|---|---|
| Economic subsystem | Economic structure | PG | 0.1916 | 0.2270 | 0.3254 | 0.1081 |
| PIOV | 0.1389 | 0.2564 | 0.2664 | 0.0885 | ||
| POVST | 0.1556 | 0.1364 | 0.1588 | 0.0527 | ||
| PGDST | 0.1830 | 0.1822 | 0.2494 | 0.0828 | ||
| Land Structure | TUA | 0.1178 | 0.1700 | 0.6079 | 0.0497 | |
| UPD | 0.0802 | 0.1610 | 0.3921 | 0.0321 | ||
| Society subsystem | Life style | ND | 0.1614 | 0.0595 | 0.1139 | 0.0239 |
| PDC | 0.1534 | 0.2305 | 0.4205 | 0.0881 | ||
| PCD | 0.1046 | 0.2255 | 0.2798 | 0.0586 | ||
| PAR | 0.1854 | 0.0845 | 0.1858 | 0.0389 | ||
| Demographic | NP | 0.1512 | 0.1305 | 0.3762 | 0.0490 | |
| PNP | 0.1289 | 0.1275 | 0.3133 | 0.0408 | ||
| PTIP | 0.1151 | 0.1415 | 0.3105 | 0.0405 | ||
| Environment subsystem | Environmental pressure | DIWW | 0.0993 | 0.0860 | 0.3190 | 0.0212 |
| VSDE | 0.1317 | 0.0678 | 0.3334 | 0.0222 | ||
| PAIWWE | 0.1023 | 0.0909 | 0.3476 | 0.0231 | ||
| Environmental status | CAP | 0.0413 | 0.1058 | 0.0995 | 0.0109 | |
| LUP | 0.0740 | 0.0678 | 0.1142 | 0.0125 | ||
| WSP | 0.0910 | 0.1950 | 0.4040 | 0.0441 | ||
| GAPC | 0.1270 | 0.1322 | 0.3823 | 0.0417 | ||
| Environmental response | RIWWM | 0.1227 | 0.1091 | 0.4719 | 0.0333 | |
| RISWC | 0.1140 | 0.0529 | 0.2126 | 0.0150 | ||
| TIE | 0.0967 | 0.0926 | 0.3155 | 0.0222 |


5.3. Results and Discussion
5.3.1. Comprehensive Trend Analysis


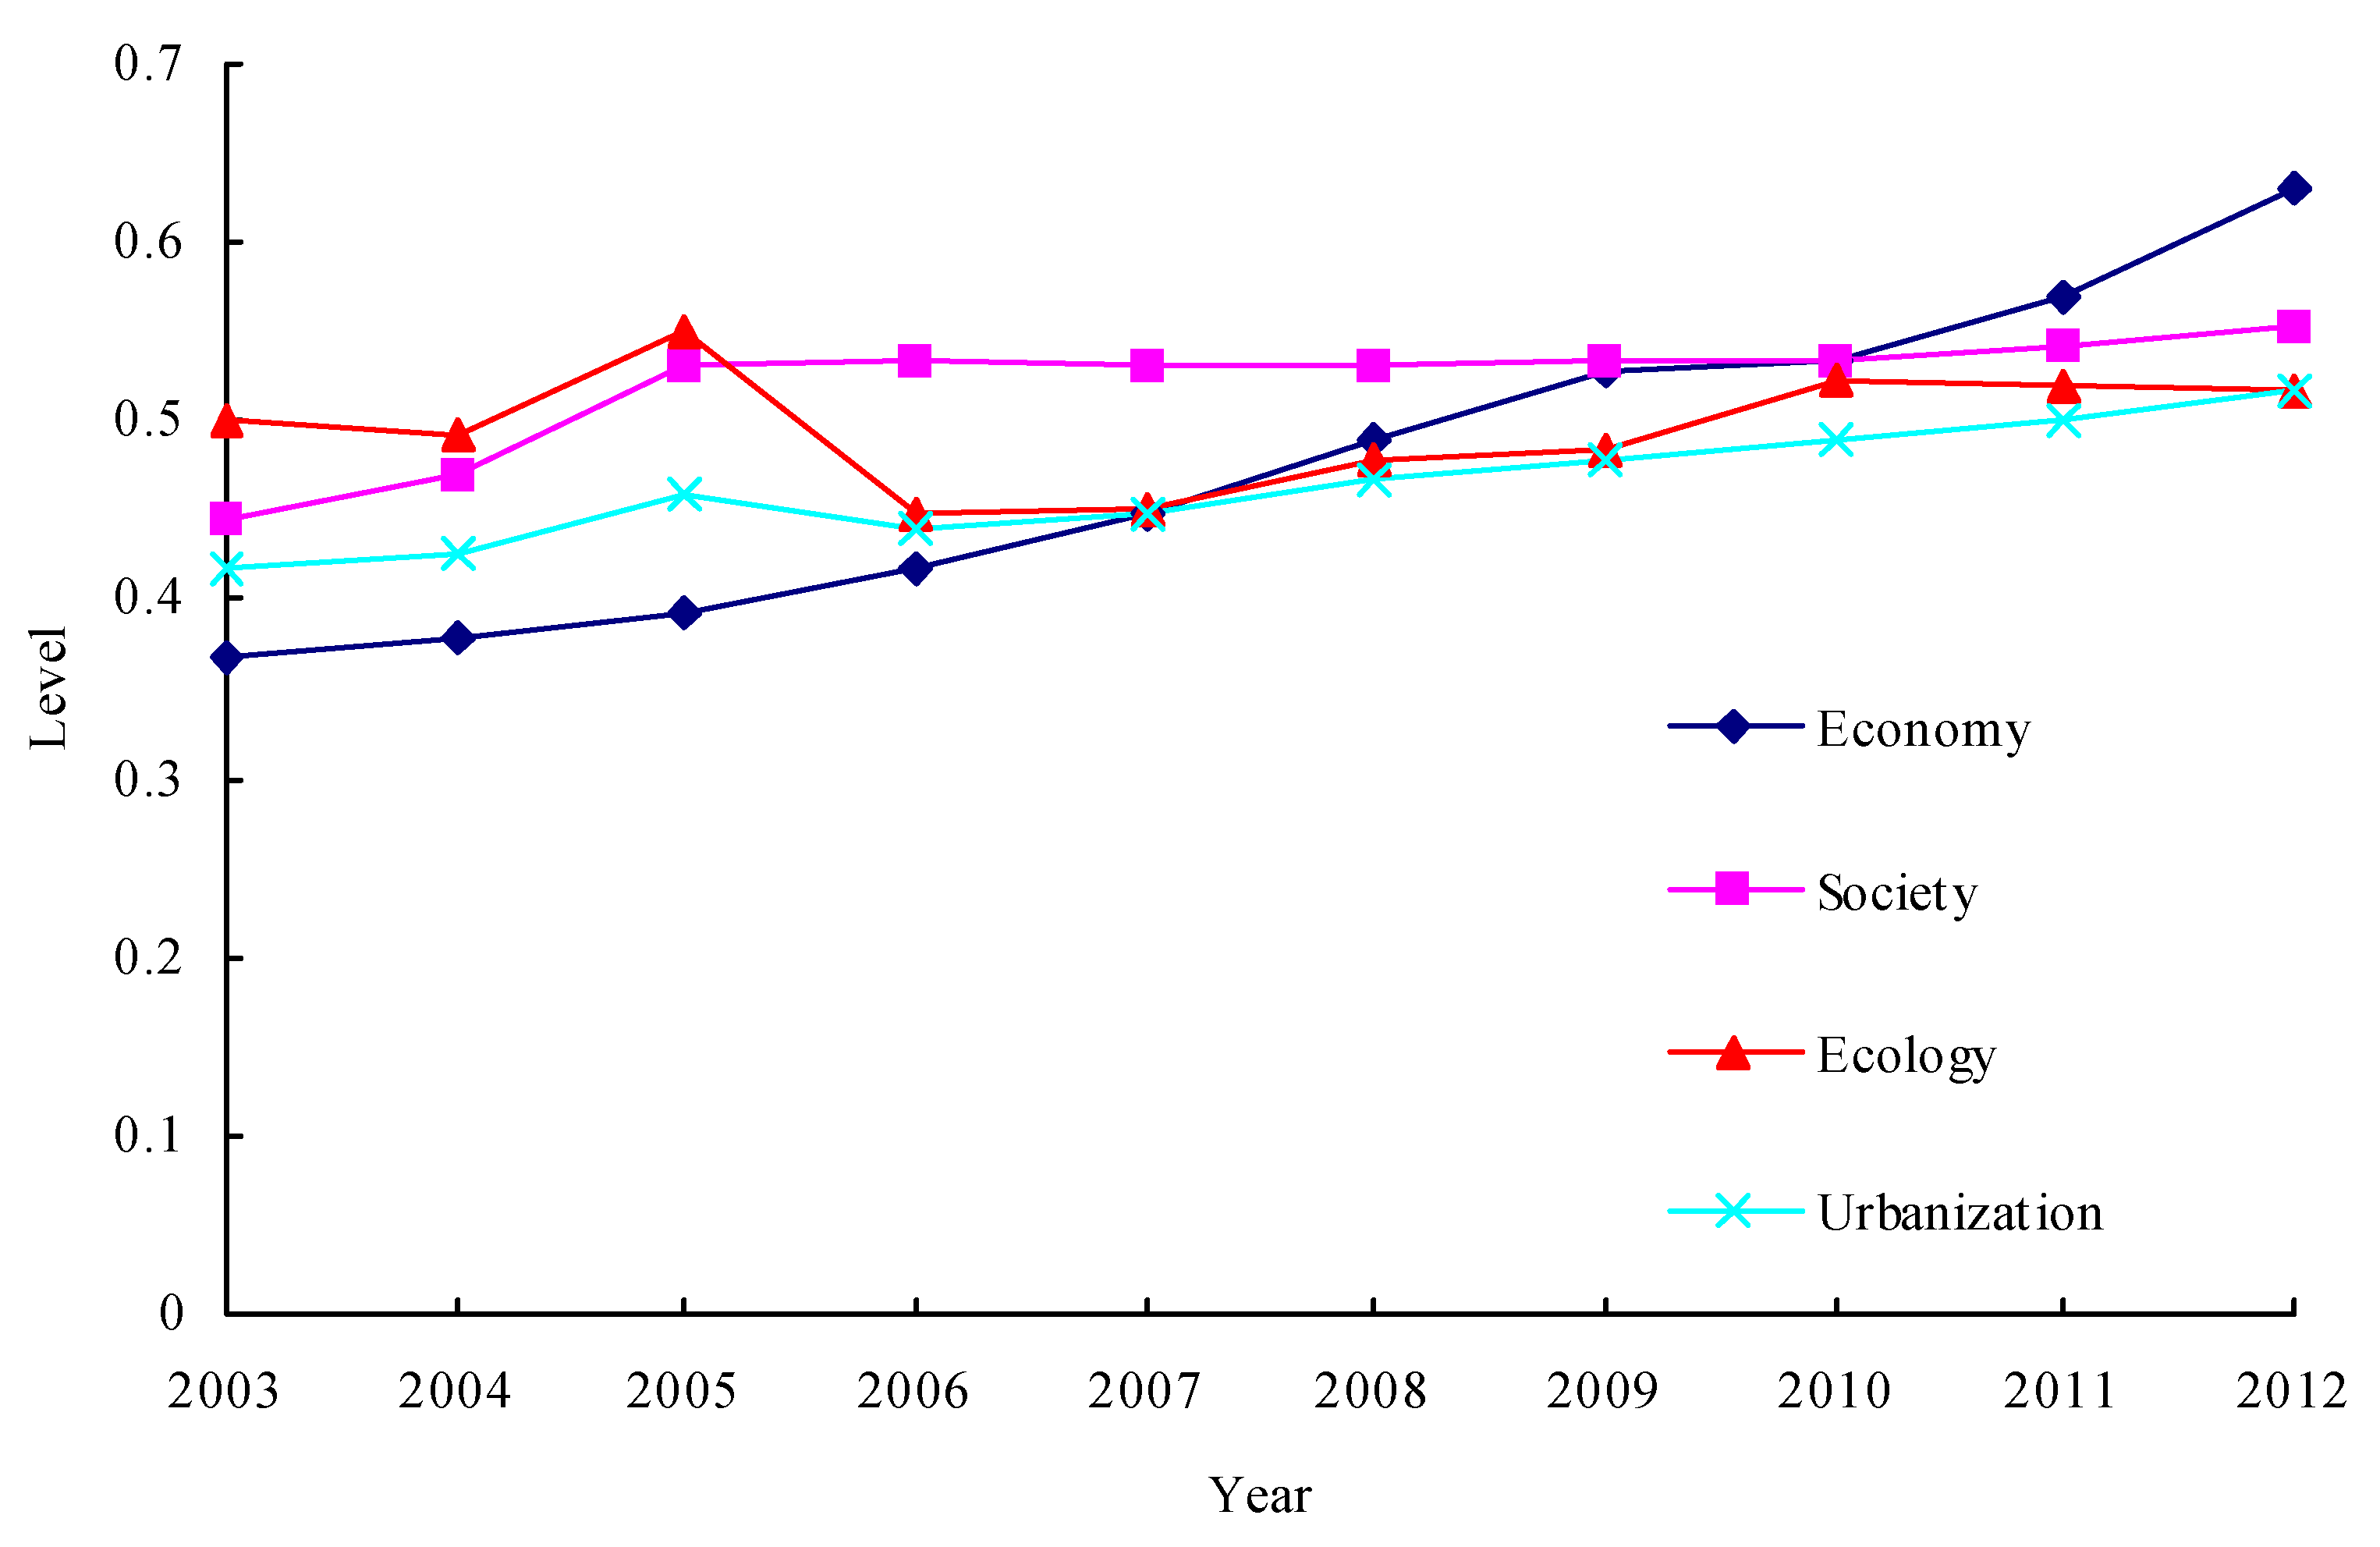
5.3.2. The Each Subsystem Development Level Analysis
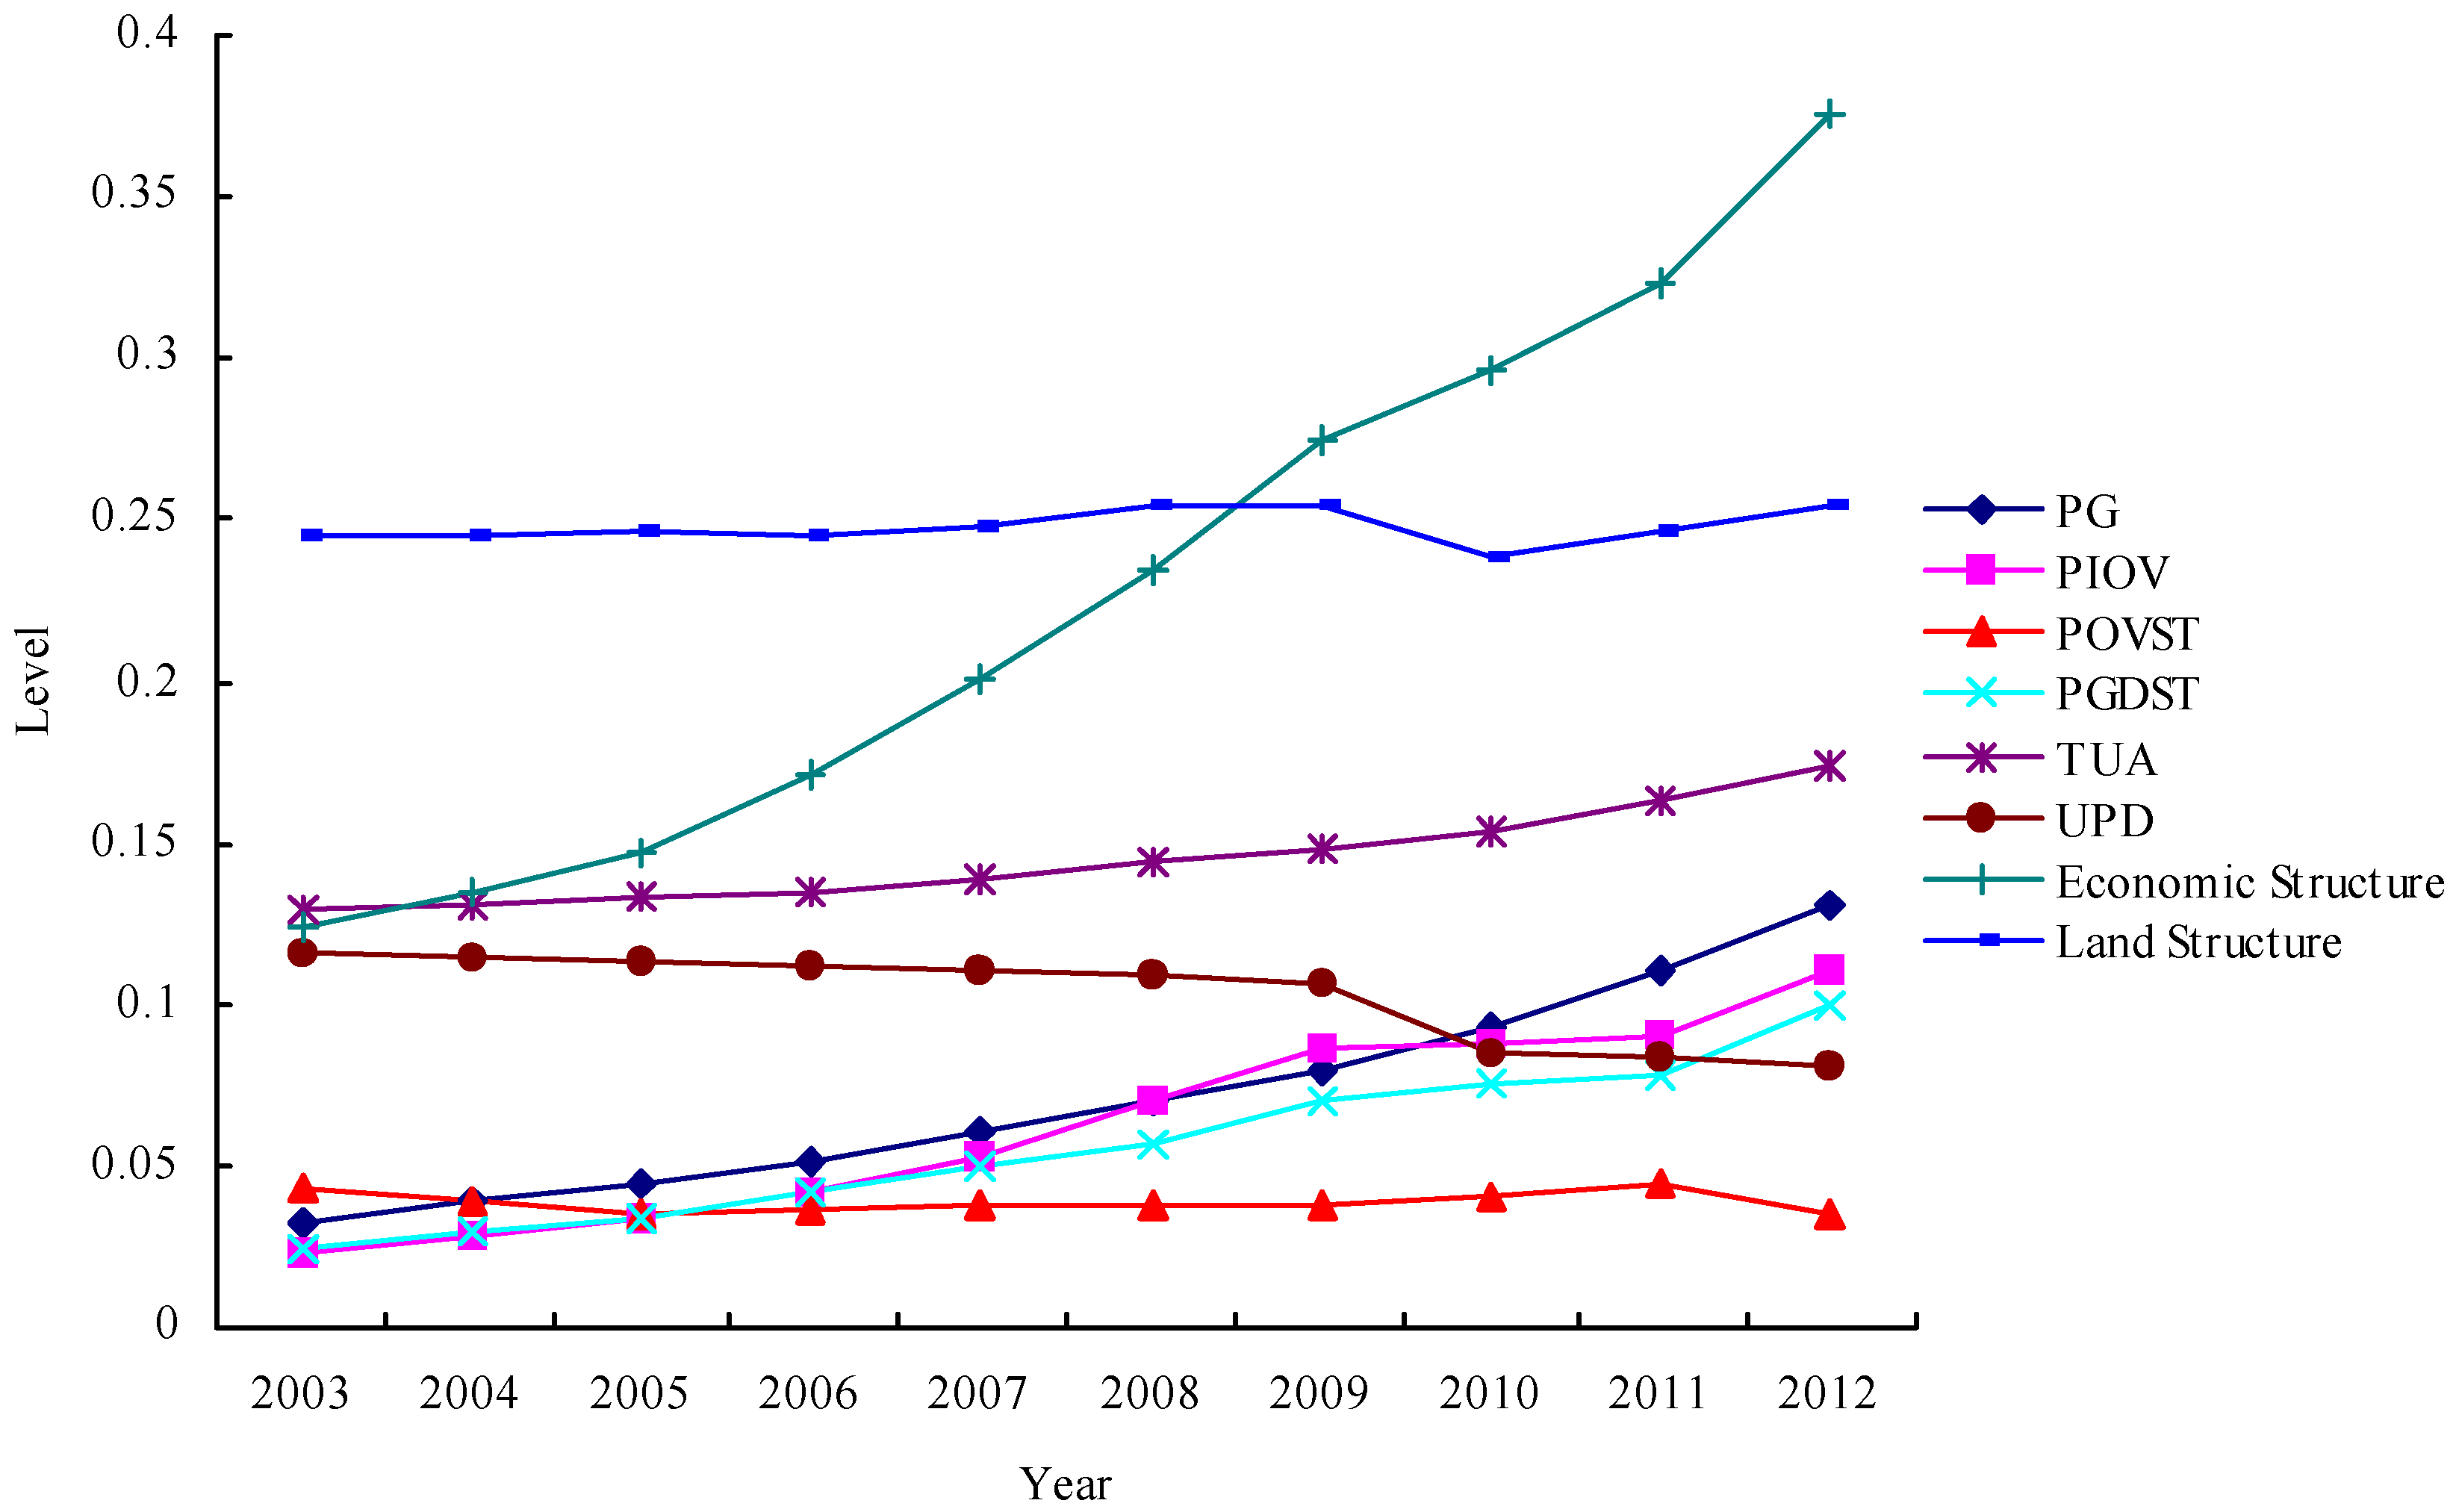
5.3.2.1. Economic Subsystem
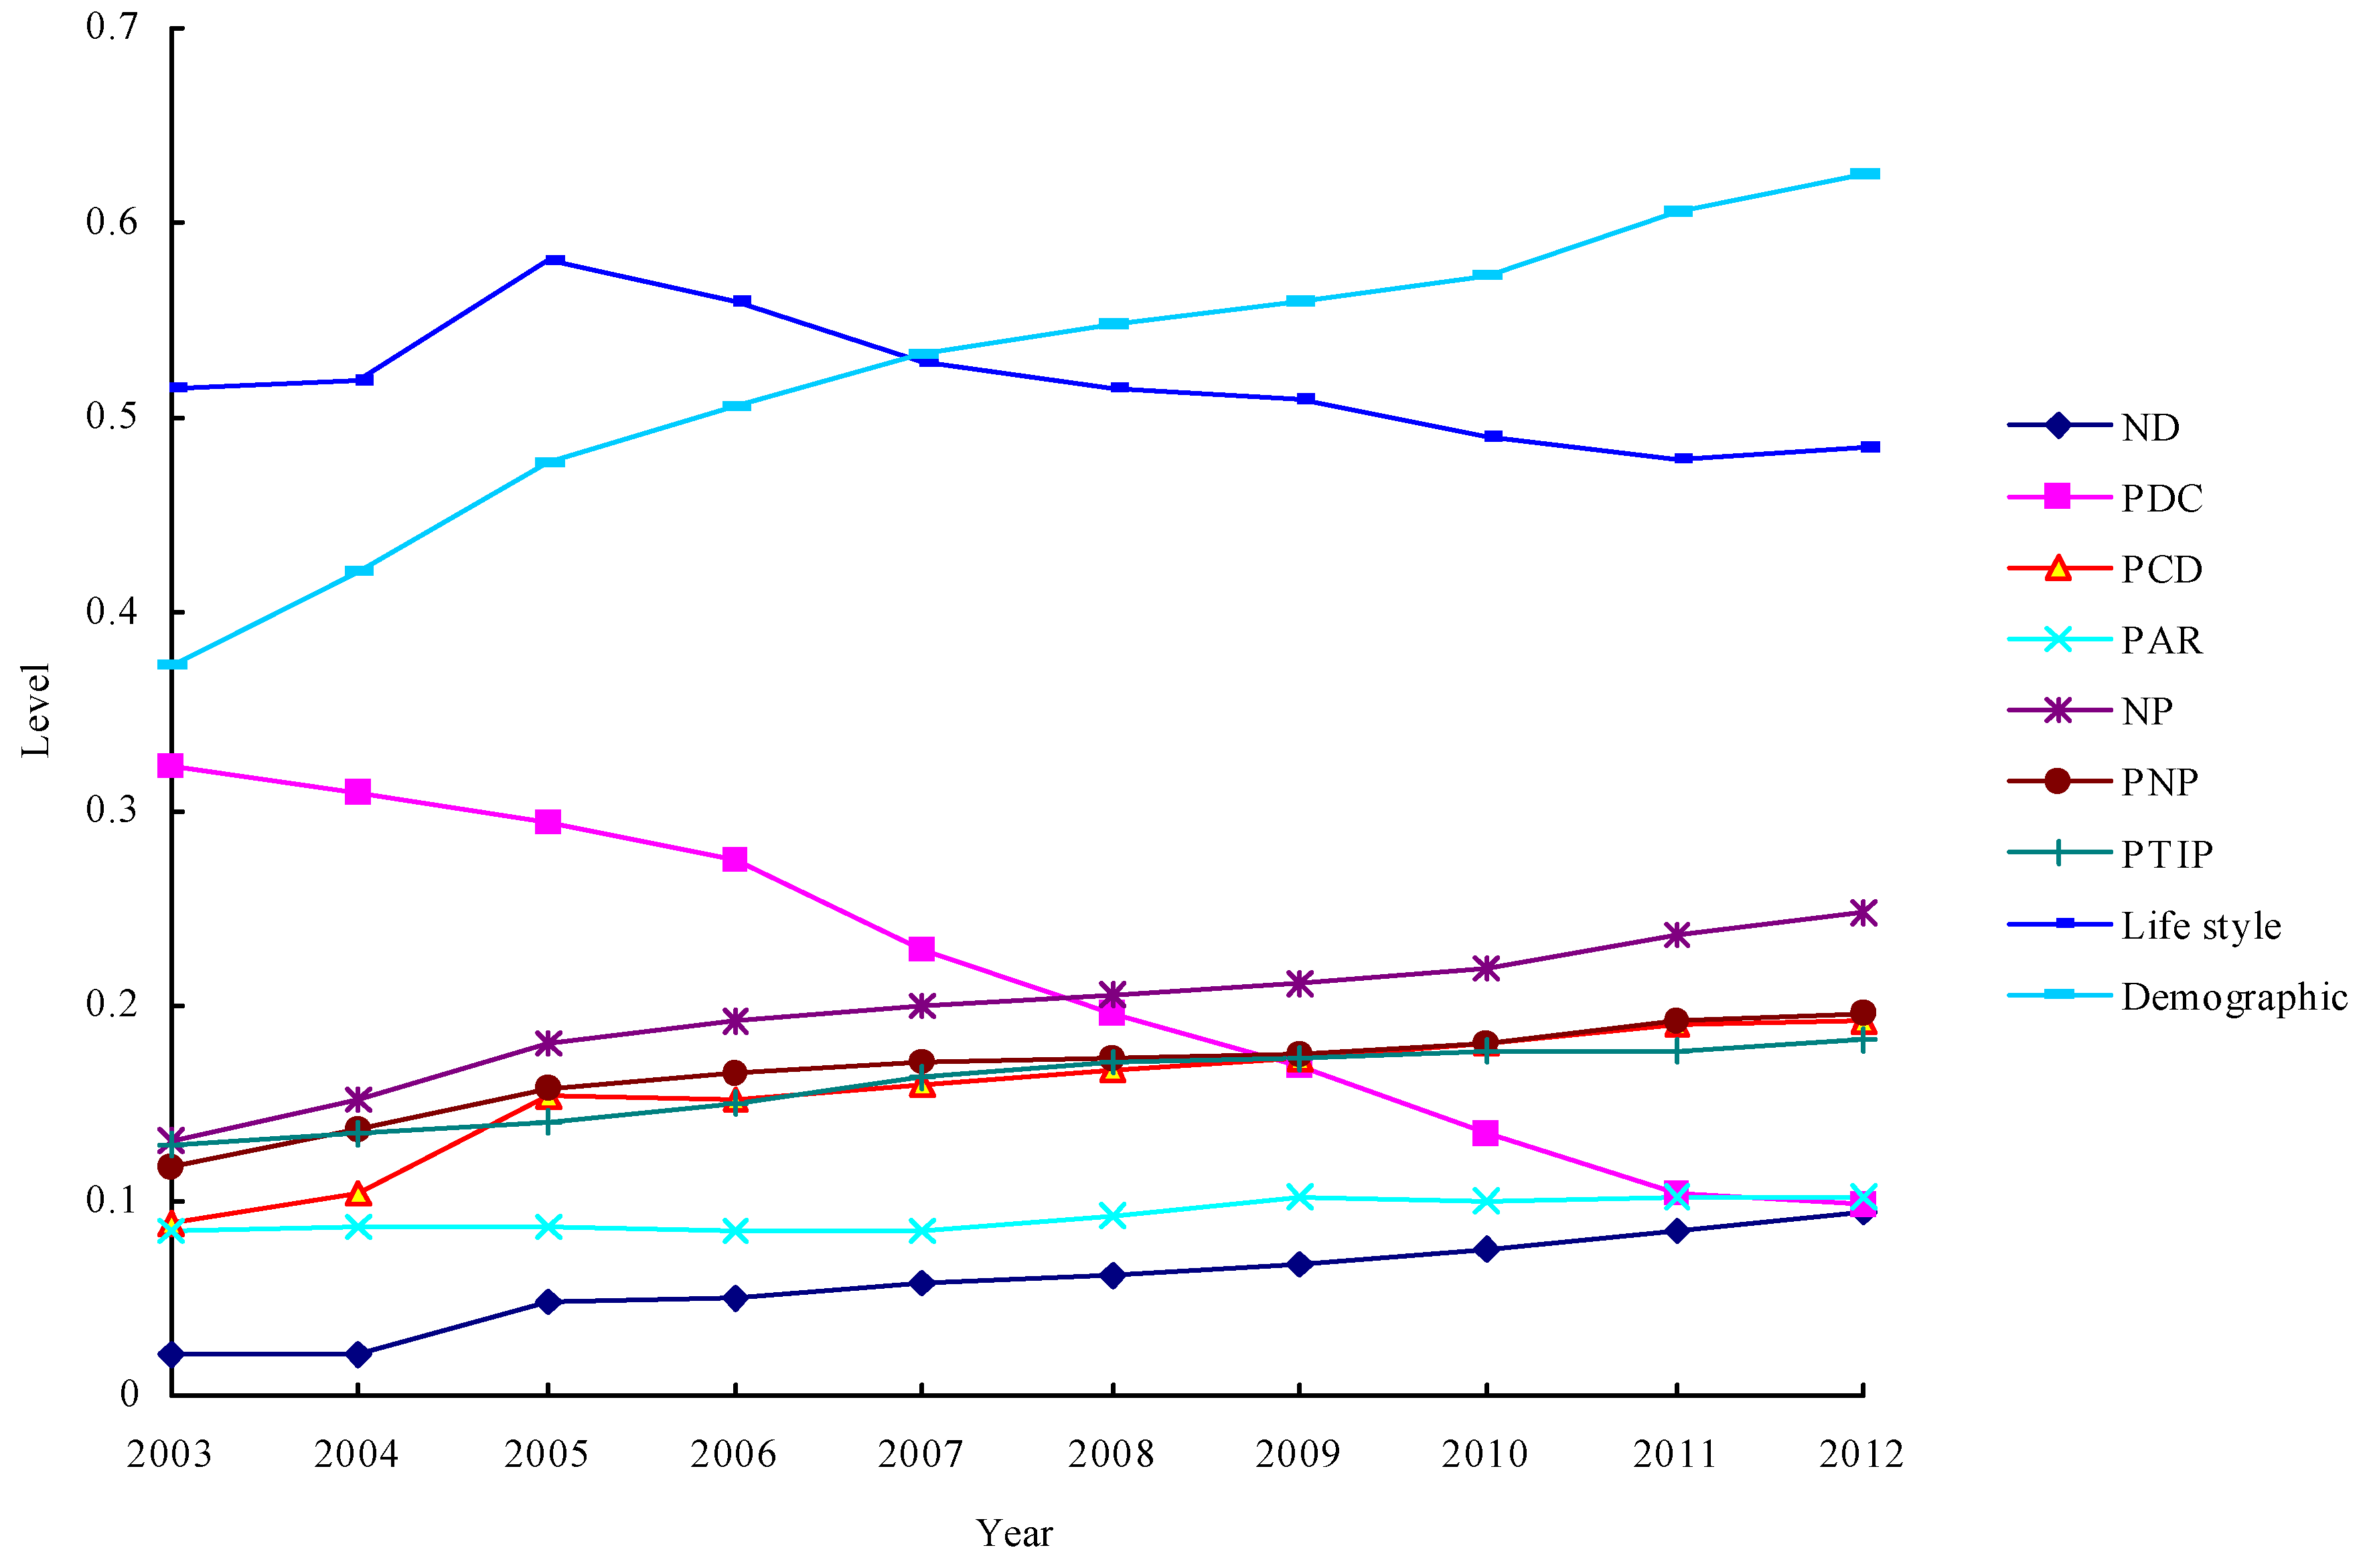
5.3.2.2. Society Subsystem
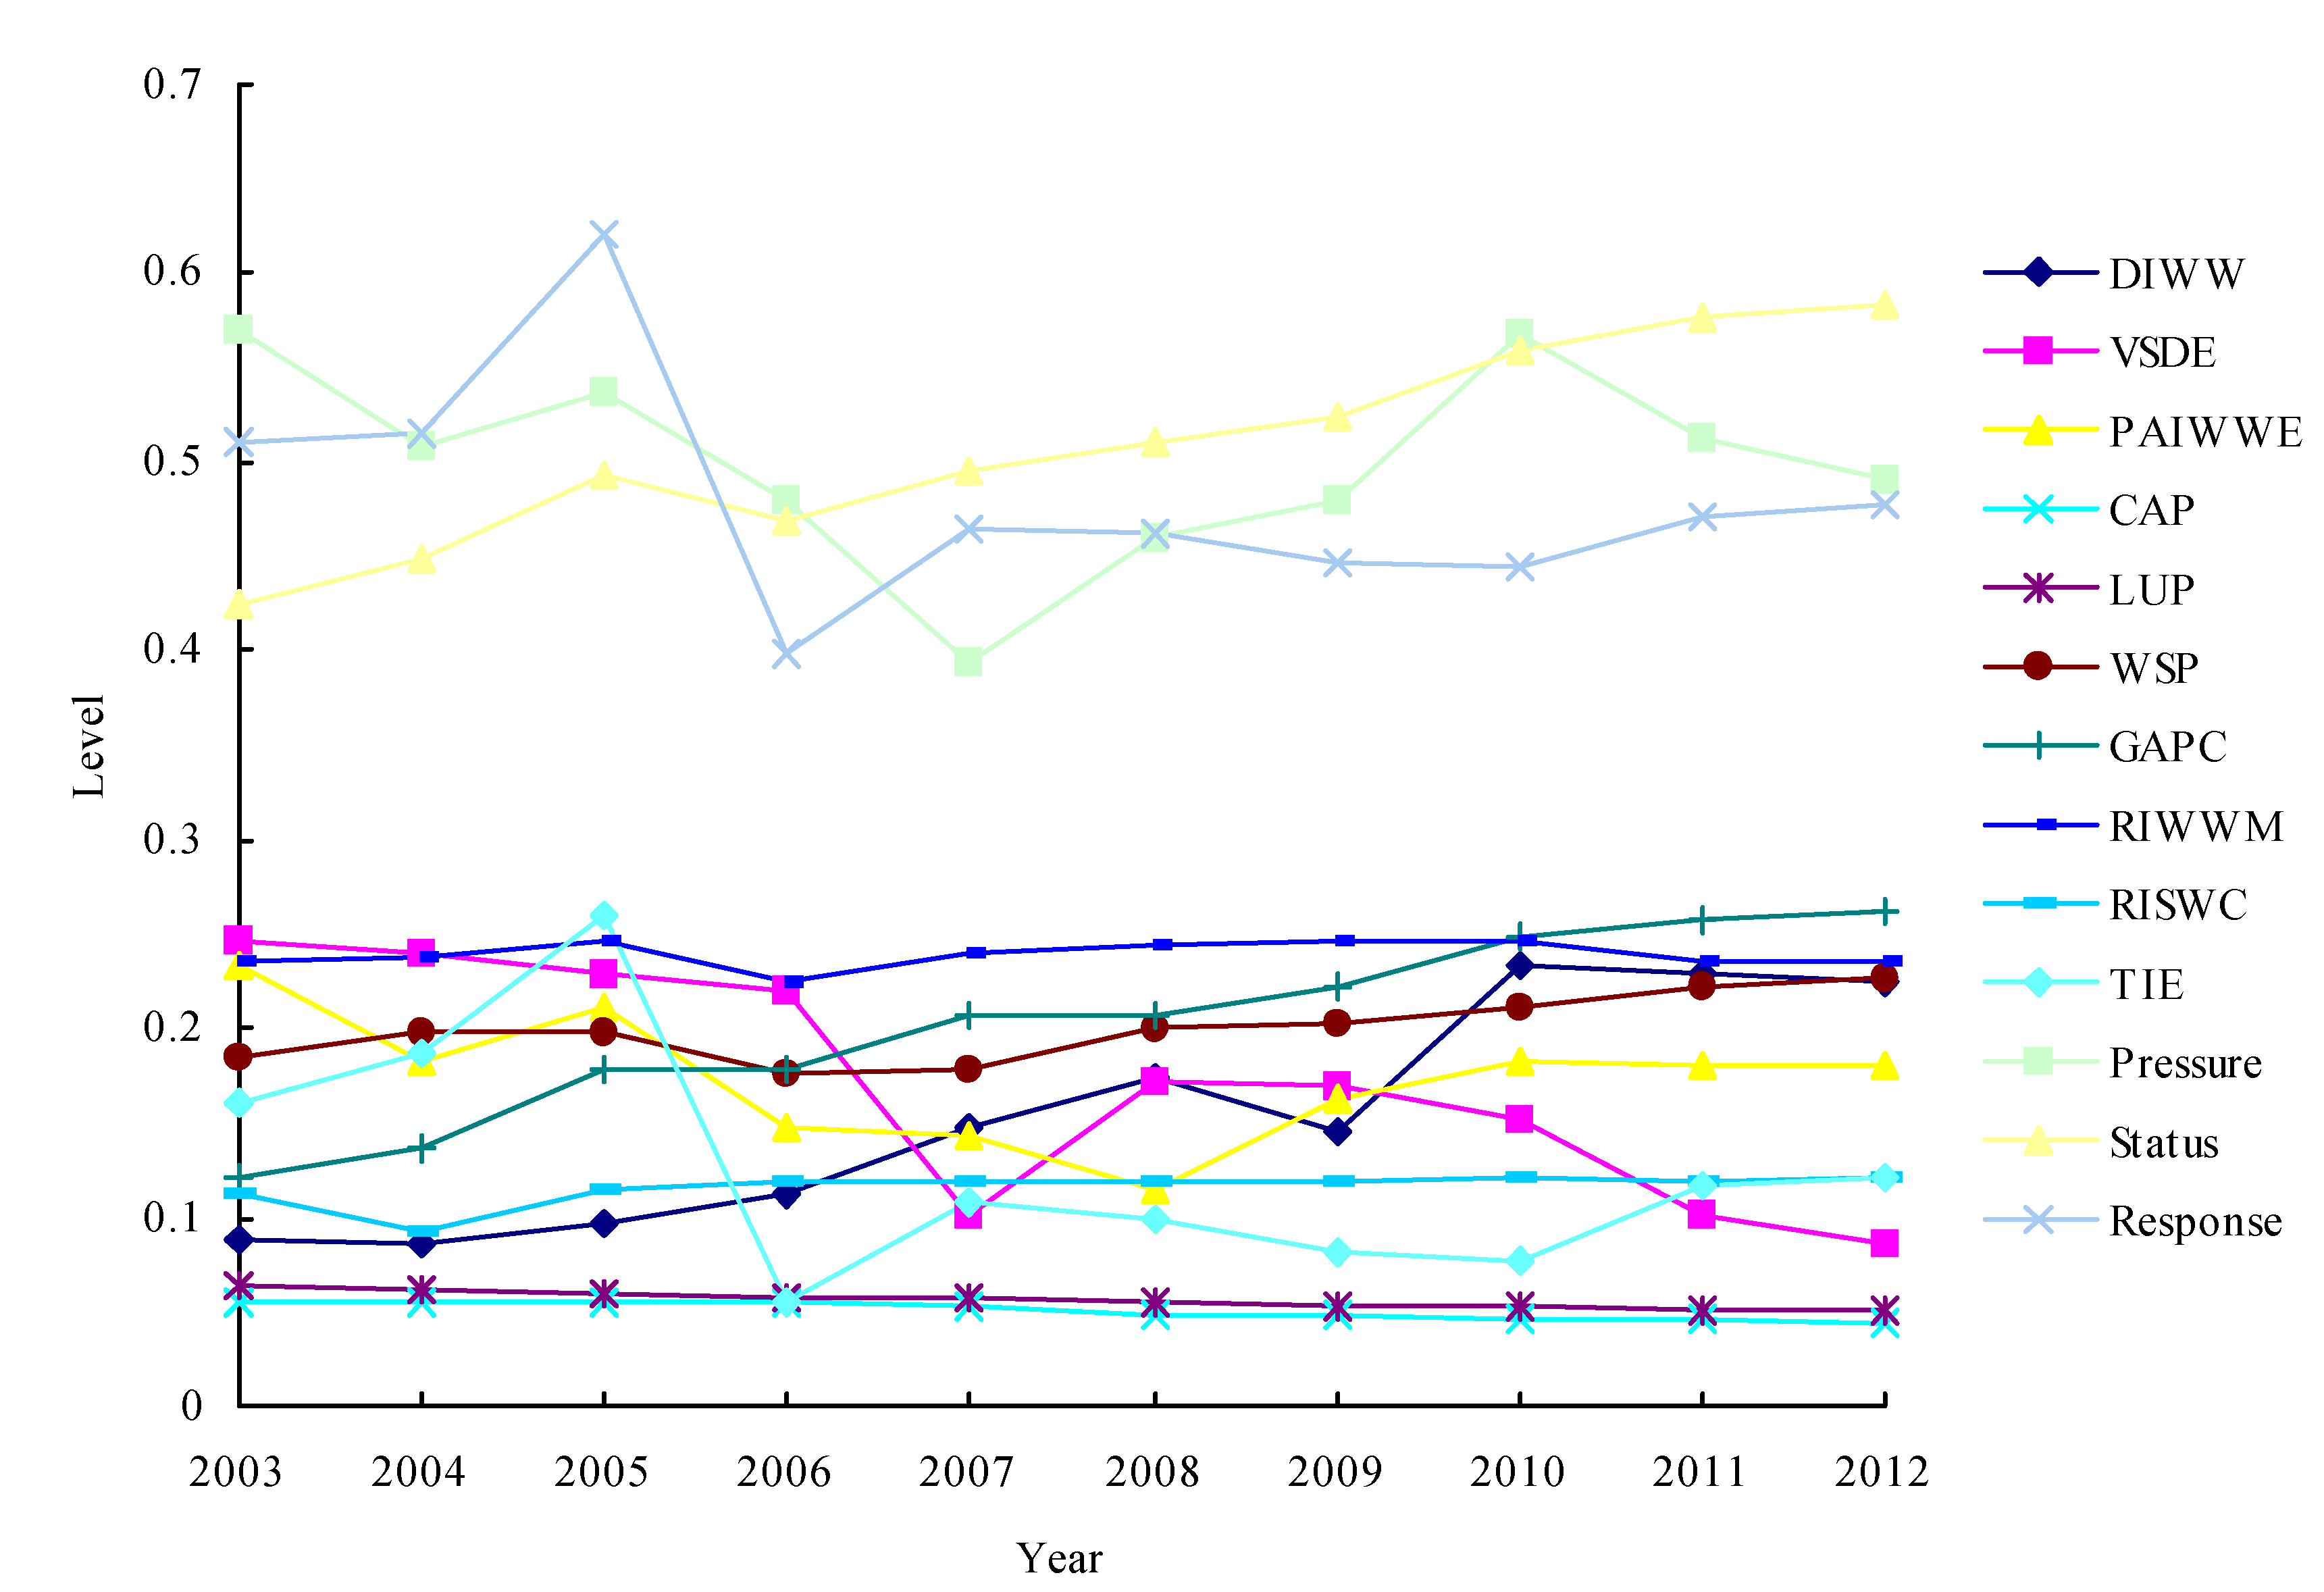
5.3.2.3. Ecological Subsystem

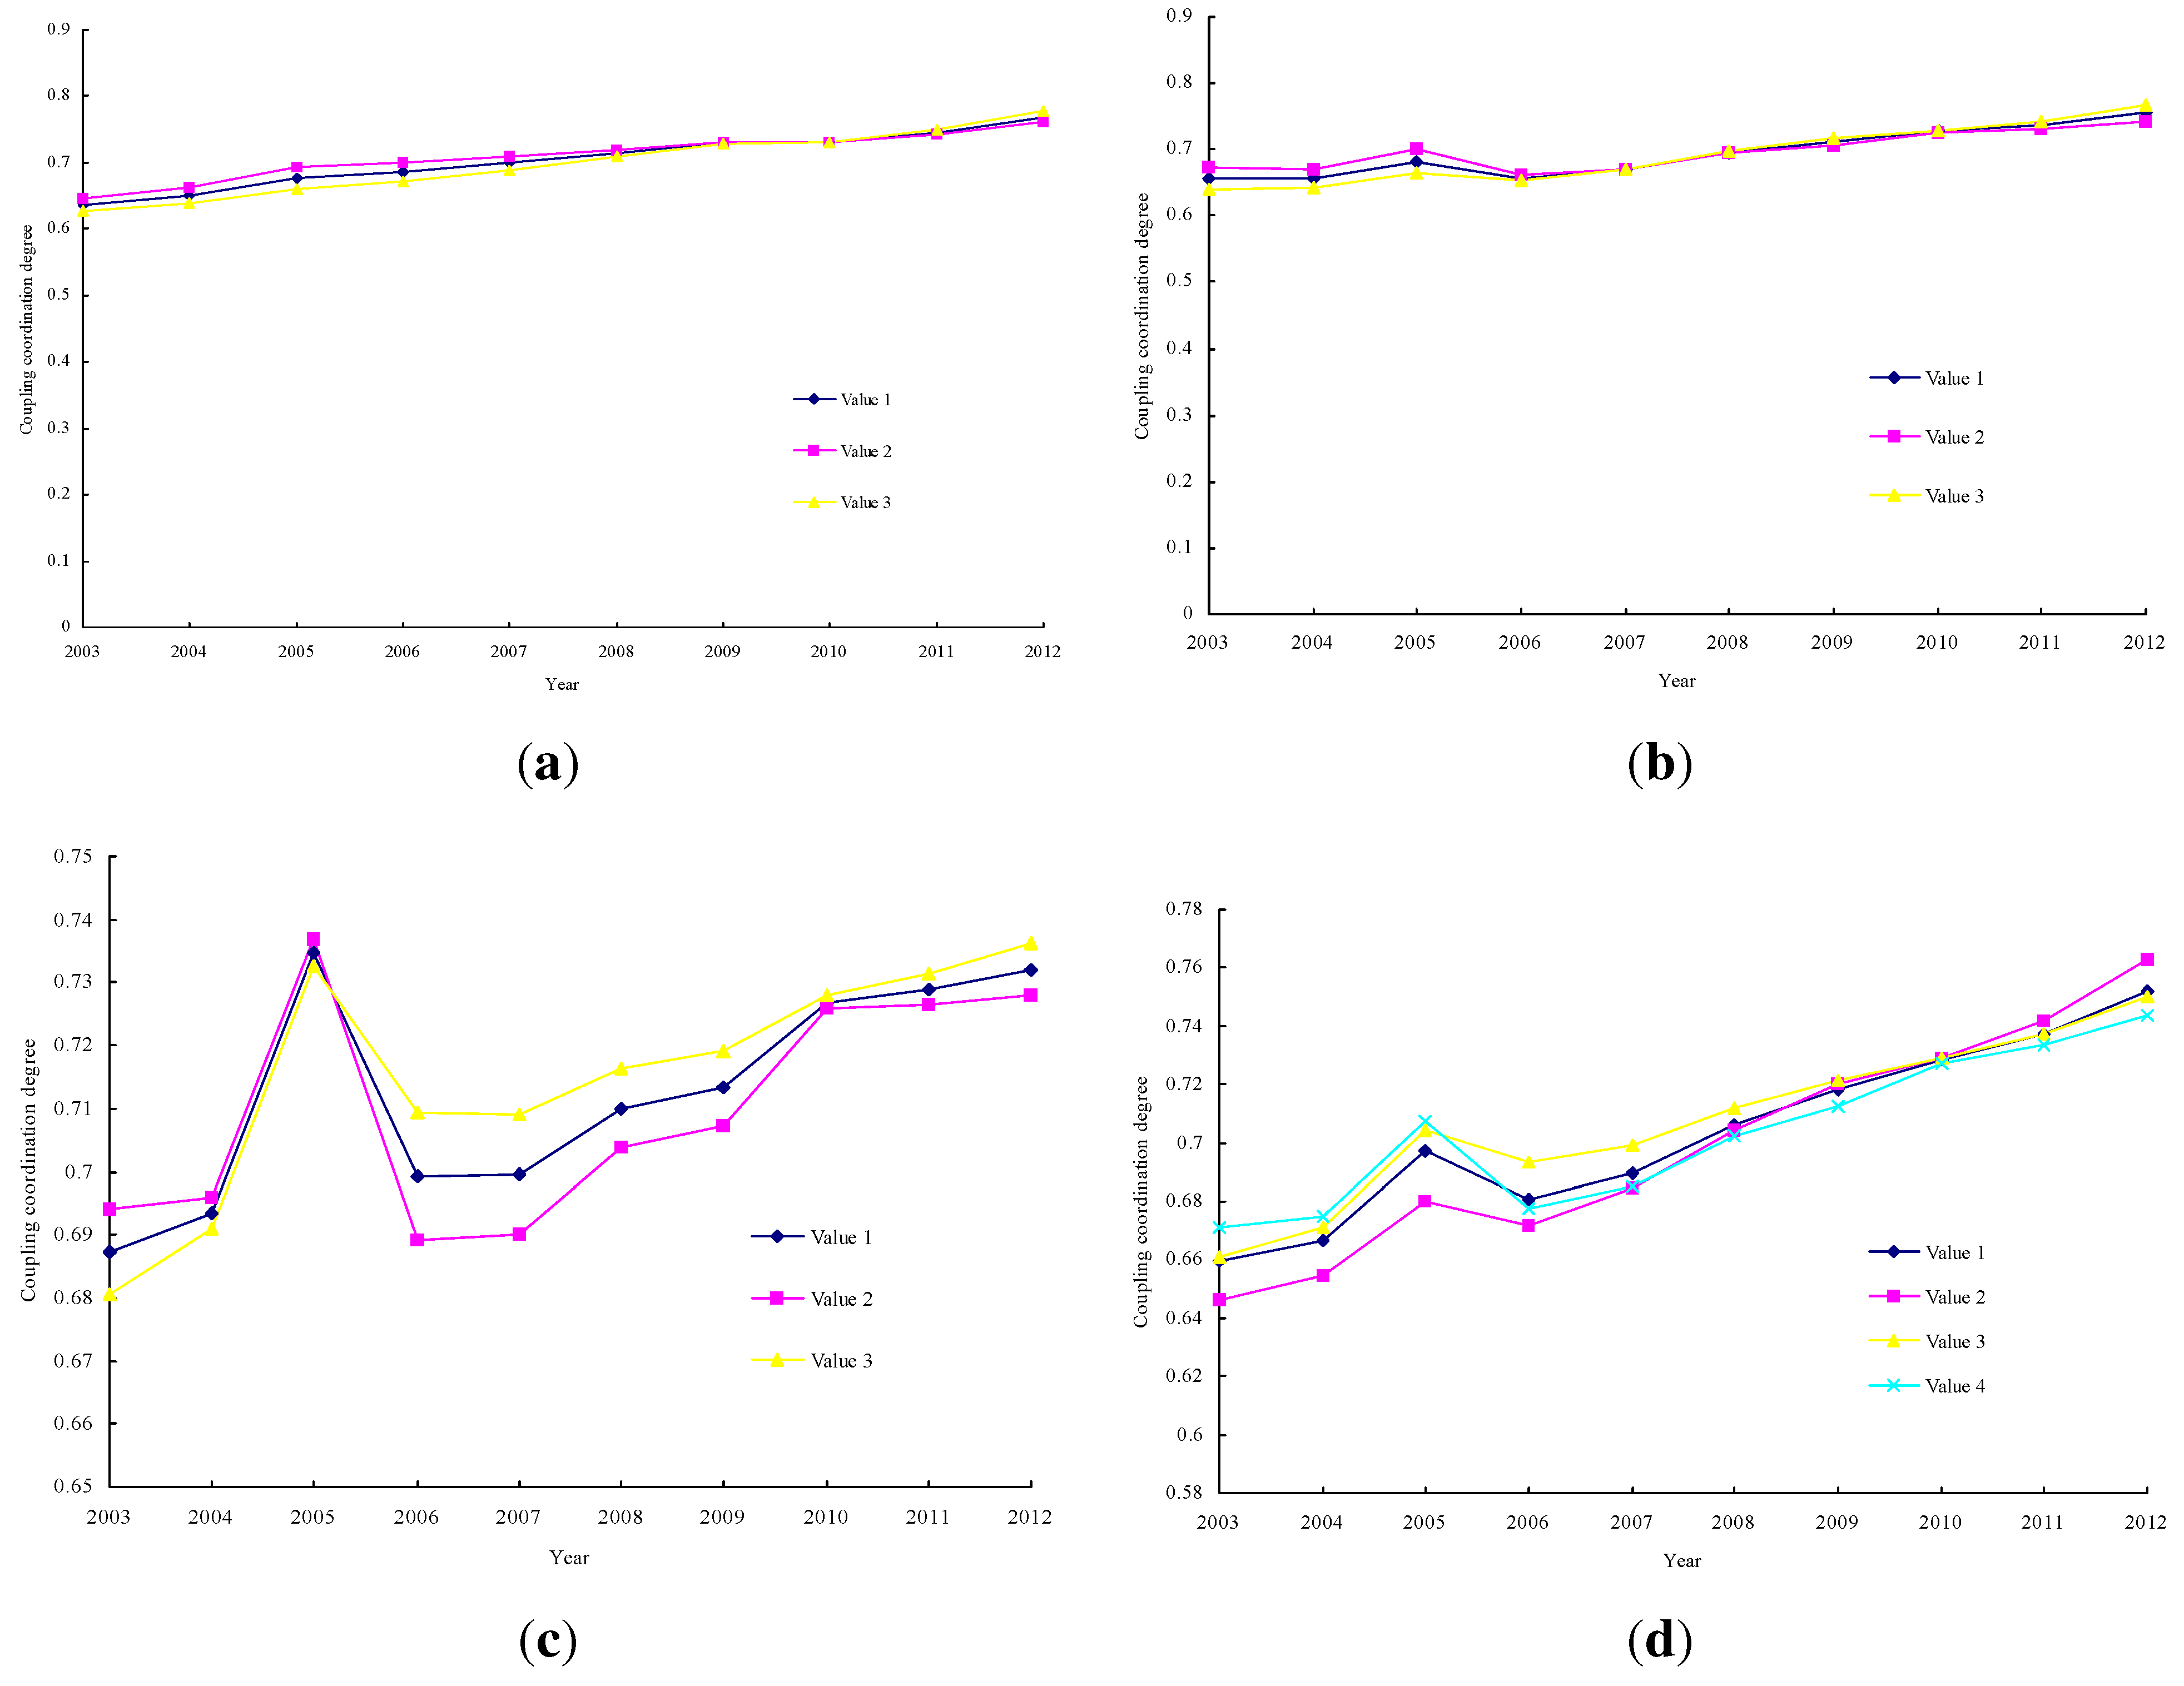
5.3.3. The Coupling Coordination Degree Evaluation and Analysis
 ; Value 2: α=β=
  and γ=
  ; Value 3: α=γ= and β= ; Value 4: β=γ= and α= .) were used respectively for three subsystem. Different α, β (Value 1: α=β= ; Value 2: α= and β=
  ; Value 3: α= and β= ) were also used respectively for two of the three. Every coupling coordination curve with different weight values shown a consistent overall trends, only slightly difference, which meant the coordinated coupling degree was not sensitivity to the weight of three subsystem. The previous research also comes to the same conclusion [39].
5.3.3.1. Economy-Society (ES) Analysis
5.3.3.2. Economy-Ecology (EE) Analysis
5.3.3.3. Society-Ecology (SE) Analysis
5.3.3.4. Economy-Society-Ecology (ESE) Analysis
5.3.4. Policy Suggestion
- Through this study, the proportion of GDP between secondary industry and tertiary industry change in Chengdu was small, which indicated that Chengdu’s economic growth is mainly driven by secondary industry and the increase of material resources consumption. Therefore, we need to strengthen the industrial structure adjustment to reduce investments in resources, and improve the efficiency of the economic development [58]. Moreover, the economy is developing too fast compared with society and ecology; the combination of a reasonable velocity and the quality and quantity development for the economy should be considered.
- In the society aspect, the household’s welfare level (i.e., number of doctors) and urban soft environmental construction (i.e., urban transportation and public utilities) should be improved. The investment proportion for production and social infrastructure should be increased, which could assist urban residents to fully appreciate the benefits of economic growth [77].
- Through the above analysis, ecological construction appears to be a key factor in the determination of the coordination degree of the EE, ES and ESE in Chengdu’s study. In our study, the change value of per unit area industrial water water in pressure was biggest, and the ratio of industrial solid waste comprehensive utilization was smallest, which suggested that there needs to be an increase in such guidance through the development of policies for economic investment, market mechanism stimulation and public awareness raising, to respond to potential ecological problem.
6. Conclusions
Acknowledgments
Author contributions
Conflicts of Interest
References
- Morikawa, H. Urbanization and Urban System; Damingtang Press: Tokyo, Japan, 1989. [Google Scholar]
- Friedmann, J. Four theses in the study of China’s urbanization. Int. J. Urban Reg. 2006, 30, 440–451. [Google Scholar] [CrossRef]
- McGee, T.G. Catalysts or cancers? The role of cities in Asian society. Urban. Natl. Dev. 1971, 1, 157–181. [Google Scholar]
- Pacione, M. Urban Geography: A Global Perspective; Routledge: London, UK and New York, NY, USA, 2003. [Google Scholar]
- Shen, J.F. Counting urban population in Chinese censuses 1953–2000: Changing definitions, problems and solutions. Popul. Space Place 2005, 11, 381–400. [Google Scholar] [CrossRef]
- Roger, C.K.; Yao, S.M. Urbanization and sustainable metropolitan development in China: Patterns problems and prospects. GeoJournal 1999, 49, 269–277. [Google Scholar] [CrossRef]
- Chen, M.X.; Lu, D.D.; Zha, L.S. The comprehensive evaluation of China’s urbanization and effects on resources and environment. J. Geogr. Sci. 2010, 20, 17–30. [Google Scholar] [CrossRef]
- Wang, H.J.; He, Q.Q.; Liu, X.J.; Zhuang, Y.H.; Hong, S. Global urbanization research from 1991 to 2009: A systematic research review. Landsc. Urban Plan. 2012, 104, 299–309. [Google Scholar] [CrossRef]
- Gu, C.L.; Wu, L.Y.; Lan, C. Progress in research on Chinese urbanization. Front. Archit. Res. 2012, 1, 101–149. [Google Scholar] [CrossRef]
- Brandon, P.S.; Lombardi, P. Evaluating Sustainable Development in the Built Environment; Blackwell: Oxford, UK, 2005. [Google Scholar]
- Singh, R.K.; Murty, H.R.; Gupta, S.K.; Dikshit, A.K. An overview of sustainability assessment methodologies. Ecol. Indic. 2009, 9, 189–212. [Google Scholar] [CrossRef]
- Bohringer, C.; Jochem, P.E.P. Measuring the immeasurable—A survey of sustainability indices. Ecol. Econ. 2007, 63, 1–8. [Google Scholar] [CrossRef]
- Georges, A.T.; Ajaonson, J.; Lefebvre, J.F.; Lanoie, P. Measuring the sustainability of cities: An analysis of the use of local indicators. Ecol. Indic. 2010, 10, 407–418. [Google Scholar] [CrossRef]
- Jochen, A.G.J.; Bertiller, R.; Schwick, C.; Kienast, F. Suitability criteria for measures of urban sprawl. Ecol. Indic. 2010, 10, 397–406. [Google Scholar] [CrossRef]
- Moussiopoulos, N.; Achillas, C.; Vlachokostas, C.; Spyridi, D.; Nikolaou, K. Environmental, social and economic information management for the evaluation of sustainability in urban areas: A system of indicators for Thessaloniki, Greece. Cities 2010, 27, 377–384. [Google Scholar] [CrossRef]
- Shen, L.Y.; Ochoa, J.J.; Shah, M.N.; Zhang, X.L. The application of urban sustainability indicators—A comparison between various practices. Habitat Int. 2011, 35, 17–29. [Google Scholar] [CrossRef]
- Organisation for Economic Co-operation and Development (OECD). OECD Key Environmental Indicators; OECD Environment Directorate: Paris, France, 2004. [Google Scholar]
- Eurostat. Sustainable Development in the European Union: 2009 Monitoring Report of the EU Sustainable Development Strategy; Office for Official Publications of the European Communities: Luxembourg, 2009. [Google Scholar]
- World Health Organization (WHO). Environmental Health Indicators: Framework and Methodologies; Protection of the Human Environment Occupational and Environmental Health Series; World Health Organization: Geneva, Switzerland, 1999. [Google Scholar]
- Li, F.; Liu, X.S.; Hu, D.; Wang, R.S.; Yang, W.R.; Li, D.; Zhao, D. Measurement indicators and an evaluation approach for assessing urban sustainable development: A case study for China’s Jining City. Landsc. Urban Plan 2009, 90, 134–142. [Google Scholar] [CrossRef]
- Alberti, M. The effects of urban patterns on ecosystem function. Int. Reg. Sci. Rev. 2005, 28, 168–192. [Google Scholar] [CrossRef]
- Kalnay, E.; Cai, M. Impact of urbanization and land-use change on climate. Nature 2003, 423, 528–531. [Google Scholar] [CrossRef]
- Liu, Y.B.; Yao, C.S.; Wang, G.X.; Bao, S.M. An integrated sustainable development approach to modeling the eco-environmental effects from urbanization. Ecol. Indic. 2011, 11, 1599–1608. [Google Scholar]
- Au, C.; Henderson, J.V. How migration restrictions limit agglomeration and productivity in China. J. Dev. Econ. 2006, 80, 350–388. [Google Scholar] [CrossRef]
- Poncet, S. Provincial migration dynamics in China: Borders, costs and economic motivations. Reg. Sci. Urban Econ. 2006, 36, 385–398. [Google Scholar] [CrossRef]
- Whalley, J.; Zhang, S. A numerical simulation analysis of (Hukou) labour mobility restrictions in China. J. Dev. Econ. 2007, 83, 392–410. [Google Scholar] [CrossRef]
- Hu, D. Trade rural-urban migration, and regional income disparity in developing countries: A spatial general equilibrium model inspired by the case of China. Reg. Sci. Urban Econ. 2002, 32, 311–338. [Google Scholar] [CrossRef]
- Sicular, T.; Yue, X.; Gustafsson, B.; Li, S. The urban-rural income gap and inequality in China. Rev. Income Wealth 2007, 53, 93–126. [Google Scholar] [CrossRef]
- Wang, Y.C. Spatiotemporal changes of landscape pattern in response to urbanization. Landsc. Urban Plan. 2007, 81, 341–353. [Google Scholar] [CrossRef]
- Tabuchi, T.; Thisse, J.F. Taste heterogeneity, labor mobility and economic geography. J. Dev. Econ. 2002, 69, 155–177. [Google Scholar] [CrossRef]
- Barbera, E.; Curro, C.; Valenti, G. A hyperbolic model for the effects of urbanization on air pollution. Appl. Math. Model. 2010, 34, 2192–2202. [Google Scholar] [CrossRef]
- Huang, H.; Ooka, R.; Kato, S. Urban thermal environment measurements and numerical simulation for an actual complex urban area covering a large district heating and cooling system in summer. Atmos. Environ. 2005, 39, 6362–6375. [Google Scholar] [CrossRef]
- Squires, G.D. Urban Sprawl and the Uneven Development of Metropolitan America. In Urban Sprawl: Causes, Consequences and Policy Responses; Gregory, D., Ed.; Urban Institute Press: Washington, DC, USA; pp. 1–22.
- Bao, C.; Fang, C.L. Water resources constraint force on urbanization in water deficient regions: A case study of the Hexi Corridor, arid area of NW China. Ecol. Econ. 2007, 62, 508–517. [Google Scholar] [CrossRef]
- Xian, G.; Crane, M.; Su, J. An analysis of urban development and its environmental impact on the Tampa Bay watershed. J. Environ. Manag. 2007, 85, 965–976. [Google Scholar] [CrossRef]
- Tang, Z.; Engel, B.A.; Pijanowski, B.C.; Lim, K.J. Forecasting land use change and its environmental impact at a watershed scale. J. Environ. Manag. 2005, 76, 35–45. [Google Scholar] [CrossRef]
- Chen, M.X.; Lu, D.D.; Zhang, H. Comprehensive evaluation and the driving factors of China’s urbanization. Acta Geogr. Sin. 2009, 24, 387–398. (In Chinese) [Google Scholar]
- Wang, X.H.; Yu, S.; Huang, G.H. Land allocation based on integrated GIS optimization modeling at a watershed level. Landsc. Urban Plan. 2004, 66, 61–74. [Google Scholar] [CrossRef]
- Li, Y.F.; Li, Y.; Zhou, Y.; Shi, Y.Z.; Zhu, X.D. Investigation of a coupling model of coordination between urbanization and the environment. J. Environ. Manag. 2012, 98, 127–133. [Google Scholar] [CrossRef]
- Jill, L.; Caviglia, H.; Dustin, C. Taking the “U” out of Kuznets: A comprehensive analysis of the EKC and environmental degradation. Ecol. Econ. 2009, 68, 1149–1159. [Google Scholar] [CrossRef]
- Kijima, M.; Nishide, K.; Ohyama, A. Economic models for the environmental Kuznets curve: A survey. J. Econ. Dyn. Control 2010, 34, 1187–1201. [Google Scholar] [CrossRef]
- Ding, G.; Jin, S.Y.; Huang, Z.Q. The research of coupling and coordination development degree between population development and economical society building in chinese provinces. J. Taiyuan Univ. Technol. (Soc. Sci. Ed.) 2010, 28, 7–12. (In Cinese) [Google Scholar]
- Tang, J.; Wang, C.Y.; Lin, N.F.; Li, Z.Y.; Li, H.Y.; Mao, Z.L. Application of matter-element model in soil nutrient evaluation of ecological fragile region. Chin. Geogr. Sci. 2009, 19, 168–176. [Google Scholar] [CrossRef]
- Brian, G.T.; Michael, R.J. Spatial extent and habitat context influence the nature and strength of relationships between urbanization measure. Landsc. Urban Plan 2009, 92, 47–52. [Google Scholar] [CrossRef]
- Ip, W.C.; Hua, B.Q.; Wong, H.; Xia, J. Applications of grey relational method to river environment quality evaluation in China. J. Hydrol. 2009, 379, 284–290. [Google Scholar] [CrossRef]
- Cheng, J.; Tao, J.P. Fuzzycomprehensive evaluation of drought vulnerability based on the analytic hierarchy process: An empirical study from Xiaogan city in Hubei province. Agric. Sci. Proc. 2010, 1, 126–135. [Google Scholar]
- Liu, Y.B.; Li, R.D.; Li, C.H. Scenarios simulation of coupling system between urbanization and eco-environment in Jiangsu province based on system dynamics model. Chin. Geogr. Sci. 2005, 15, 219–226. [Google Scholar] [CrossRef]
- Huang, Y.C.; Yang, H.T.; Huang, C.L. Developing a new transformer diagnosis system through evolutionary fuzzy logic. IEEE T. Power Deliv. 1997, 12, 761–767. [Google Scholar] [CrossRef]
- Wang, M.H.; Chung, Y.K.; Sung, W.T. Using thermal image matter-element to design a circuit board fault diagnosis system. Expert. Syst. Appl. 2011, 38, 6164–6169. [Google Scholar] [CrossRef]
- Gong, J.Z.; Liu, Y.S.; Chen, W.L. Land suitability evaluation for development using a matter-element model: A case study in Zengcheng, Guangzhou, China. Land Use Pol. 2012, 29, 464–472. [Google Scholar] [CrossRef]
- He, Y.X.; Dai, A.Y.; Zhu, J.; He, H.Y.; Li, F.R. Risk assessment of urban network planning in china based on the matter-element model and extension analysis. Int. J. Elec. Power 2011, 33, 775–782. [Google Scholar] [CrossRef]
- Ji, G. Logistics and matter-element models based on firm innovative supply chains. Int. J. Oper. Res. 2006, 1, 283–301. [Google Scholar]
- Saaty, T.L. The Analytic Hierarchy Process: Planning, Priority Setting, Resource Allocation; RWS Publications: Pittsburgh, PA, USA, 1980. [Google Scholar]
- Lee, W.B.; Lau, H.; Liu, Z.Z.; Tam, S. A fuzzy analytic hierarchy process approach in modular product design. Expert Syst. 2001, 18, 32–42. [Google Scholar]
- Fu, L.P.; Li, J.H.; He, Y.J. The empirical research of urbanization level measure from the spatial economics: On the data of Henan province. In The 19th International Conference on Industrial Engineering and Engineering Management: Management System Innovation; Qi, E., Shen, J., Dou, R., Eds.; Springer: Berlin and Heidelberg, Germany, 2013. [Google Scholar]
- Qiao, B.; Fang, C.Y. The dynamic coupling model and its application of urbanization and eco-environment in Hexi Corridor. J. Geogr. Sci. 2005, 15, 491–499. [Google Scholar] [CrossRef]
- Chen, A.M.; Gao, J. Urbanization in China and the coordinated development model. The case of Chengdu. Soc. Sci. J. 2011, 48, 500–513. [Google Scholar] [CrossRef]
- Bob, G.; Bill, H.; Geoff, O. Environment, economy and society: Fitting them together into sustainable development. Sustain. Dev. 2002, 10, 187–196. [Google Scholar] [CrossRef]
- Chen, J. Rapid urbanization in China: A real challenge to soil protection and food security. Catena 2007, 69, 1–15. [Google Scholar] [CrossRef]
- Cai, W. Matter-Element Model and Application; Science and Technology Literature Press: Beijing, China, 1994. (In Chinese) [Google Scholar]
- Cai, W. Extension theory and its application. Chin. Sci. Bull. 1999, 44, 1538–1548. [Google Scholar] [CrossRef]
- Thomas, S.L.; Kirti, P. Group Decision Making: Drawing out and Reconciling Differences; RWS Publications: Pittsburgh, PA, USA, 2007. [Google Scholar]
- Norman, D.; Olaf, H. An experimental application of the Delphi method to the use of experts. Manag. Sci. 1963, 9, 458–467. [Google Scholar] [CrossRef]
- Pearson, K. On lines and planes of closest fit to systems of points in space. Philos. Mag. A 1901, 2, 559–572. [Google Scholar] [CrossRef]
- Sakata, M.; Masumi, S. Accurate structure analysis by the maximum-entropy method. Acta Crystallogr. A 1990, 46, 263–270. [Google Scholar] [CrossRef]
- Athawale, V.M.; Kumar, R.; Chakraborty, S. Decision making for material selection using the UTA method. Int. J. Adv. Manuf. Tech. 2011, 57, 11–22. [Google Scholar] [CrossRef]
- Feng, Z.G.; Wang, Q. Research on health evaluation system of liquid-propellant rocket engine ground-testing bed based on fuzzy theory. Acta Astronaut. 2007, 61, 840–853. [Google Scholar] [CrossRef]
- Xu, J.P.; Xu, L. Integrated system health management-based condition assessment for manned spacecraft avionics. P. I. Mech. Eng. G-J. Aer. 2013, 227, 19–32. [Google Scholar] [CrossRef]
- Valerie, I. The Penguin Dictionary of Physics; Foreign Language Press: Beijing, China, 1996. [Google Scholar]
- Xu, J.P.; Yang, J.; Yao, L.M. Transportation structure analysis using SD-MOP in world modern garden city: A case study in China. Discr. Dyn. Nat. Soc. 2012. [Google Scholar] [CrossRef]
- Hwang, C.L.; Yoon, K. Multiple Attribute Decision Making: Methods and Applications; Springer-Verlag: New York, NY, USA, 1981. [Google Scholar]
- Zhujun, L.; Jiuping, X. An economic loss assessment framework of a region after Wenchuan earthquake. Disast. Adv. 2013, 6, 69–77. [Google Scholar]
- Xie, H.; Wang, P.; Yao, G. Exploring thedynamic mechanisms of farmland abandonment based on a spatially explicit economic model for environmental sustainability: A case study in Jiangxi province, China. Sustainability 2014, 6, 1260–1282. [Google Scholar]
- Rapport, D.J.; Friend, A. Towards a Comprehensive Framework for Environmental Statistics: A Stress-Response Approach; Statistics Canada: ottawa, Canada, 1979. [Google Scholar]
- Christopher, D. Health and urban living. Science 2008, 319, C766–C769. [Google Scholar] [CrossRef]
- Shen, L.; Peng, Y.; Zhang, X.; Wu, Y. An alternative model for evaluating sustainable urbanization. Cities 2012, 29, 32–39. [Google Scholar] [CrossRef]
- Giddings, B.; Hopwood, B.; O’brien, G. Environment, economy and society: Fitting them together into sustainable development. Sustain. Dev. 2002, 10, 187–196. [Google Scholar] [CrossRef]
© 2014 by the authors; licensee MDPI, Basel, Switzerland. This article is an open access article distributed under the terms and conditions of the Creative Commons Attribution license (http://creativecommons.org/licenses/by/3.0/).
Share and Cite
Liu, Y.; Xu, J.; Luo, H. An Integrated Approach to Modelling the Economy-Society-Ecology System in Urbanization Process. Sustainability 2014, 6, 1946-1972. https://doi.org/10.3390/su6041946
Liu Y, Xu J, Luo H. An Integrated Approach to Modelling the Economy-Society-Ecology System in Urbanization Process. Sustainability. 2014; 6(4):1946-1972. https://doi.org/10.3390/su6041946
Chicago/Turabian StyleLiu, Yunqiang, Jiuping Xu, and Huawei Luo. 2014. "An Integrated Approach to Modelling the Economy-Society-Ecology System in Urbanization Process" Sustainability 6, no. 4: 1946-1972. https://doi.org/10.3390/su6041946