Article

A Step towards Developing a Sustainability Performance Measure within Industrial Networks

1
Melbourne Academy for Sustainability and Society (MASS), Melbourne Sustainable Society Institute (MSSI), The University of Melbourne, Parkville VIC 3010, Australia
2
Department of Mechanical Engineering, Melbourne School of Engineering, The University of Melbourne, Parkville VIC 3010, Australia
3
Department of Computing and Information Systems, Melbourne School of Engineering, The University of Melbourne, Parkville VIC 3010, Australia
*
Author to whom correspondence should be addressed.
Sustainability 2014, 6(4), 2201-2222; https://doi.org/10.3390/su6042201
Submission received: 14 October 2013 / Revised: 5 March 2014 / Accepted: 25 March 2014 / Published: 16 April 2014

Abstract

:
Despite the plethora of literature in sustainability and supply chain management in the recent years, a quantitative tool that measures the sustainability performance of an industrial supply network, considering the uncertainties of existing data, is hard to find. This conceptual paper is aimed at establishing a quantitative measure for the sustainability performance of industrial supply networks that considers aleatory and epistemic uncertainties in its environmental performance evaluation. The measure is built upon economic, environmental and social performance evaluation models. These models address a number of shortcomings in the literature, such as incomplete and inaccurate calculation of environmental impacts, as well as the disregard for aleatory and epistemic uncertainties in the input data and, more importantly, the scarce number of quantitative social sustainability measures. Dyadic interactions are chosen for the network, while the network members have a revenue-sharing relationship. This relationship promotes sharing of the required information for the use of the proposed model. This measure provides an approach to quantify the environmental, social and economic sustainability performances of a supply network. Moreover, as this measure is not specifically designed for an industrial sector, it can be employed over an evolving and diverse industrial network.

1. Introduction

Efficient and effective management supply chain activities have always been critical for the overall business performance of an organization. In the last few decades, there has been a rapid development of supply chain management, which has been mainly driven by economic sustainability [1]. The development of supply chain management (SCM) through various efficiency initiatives has been enabled by the advancement of information and communication technologies (ICT) [2,3,4]. Recently, the sustainability concept within the SCM has been extended beyond the economic dimension to environmental and social dimensions [1,5]. As a result, the term sustainable supply chain management (SSCM) has been coined and used widely in the literature.
Consistent with previous studies [1,5,6], in this study, SSCM is defined as the management of a material/product and information flows across supply chain participants, taking into account the economic, environmental and social impacts. The three dimensions of sustainability are known as the triple bottom line (TBL), which basically addresses accountability for profit, planet and people [6]. To date, there is still a limited number of organizations who have implemented sustainability practices along the three dimensions. More organizations are engaged in environmental sustainable practices than in social sustainability practices. In the literature, the stream of studies addressing the environmental impacts of SCM, which is also known as green supply chain management, has been growing rapidly in number in the last decade [7,8,9]. More recently, a number of studies started to explore the social aspect of sustainability through the term corporate social responsibility [6,10,11].
Since addressing sustainability has been a global concern, planning, controlling and designing a sustainable supply chain as a whole is of strategic importance for an organization [12]. Sustainability performance measures are used to evaluate the organization’s success towards a sustainable supply chain. The dominance of qualitative studies in the literature has resulted in difficulties in identifying a quantitative tool measuring the social, environmental and economic sustainability performance of the supply chain [1]. For instance, according to Styles et al. [13], some organizations are attempting to improve their environmental performance by employing customized indicators. However, they are not able to incorporate their supply chain, as no inclusive method currently exists. Moreover, isolated attempts of organizations towards sustainability will not necessarily translate into a sustainable supply chain, because each organization is part of at least one supply chain, and the activities of supply chain parties affect the overall performance of the entire supply chain. Thus, concerted actions of all supply chain participants are required to achieve a sustainable supply chain [14,15].
A recent study [16] reported that more than 309 papers were published in the area of the green supply chain domain in the past 15 years. Of these, only 36 papers have applied quantitative methods to examine environmental or economic issues in the supply chain. Each paper only examines one specific aspect of the supply chain, such as energy consumption [12], transportation [17], single product supply [18] or supply chain profit [19]. Moreover, the examined environmental aspects in these methods merely include CO2 emission (green supply chain) and water/energy consumption [20,21]. Several other environmental impacts exist that should be included in these methods, such as toxicity, substances’ carcinogenic effects, resource depletion and chemical absorption [22]. The consideration for the economic sustainability also can be extended to include various perspectives of a supply chain, such as revenue sharing and revenue competition, for the total cost and net revenues [16].
In addition, Ashby et al. [1] reported on the few number of modeling studies in the integrated context of sustainability and the supply chain. The modeling studies reviewed by Ashby et al. [1] mainly were focused on the environmental management of a supply chain. In the last decade, a handful of works studied social sustainability, such as socially responsible purchasing [23], social responsibility [24] and social sustainability [25]. The only work that referred to the concept of “closed loop” (or sustainable) supply chains with an explicitly addressed output focuses on environmental sustainability [26]. Furthermore, as reported by Ashby et al. [1], 46% of their reviewed articles focused on the environmental aspects of sustainability. In fact, supply chain management and sustainability are both integrated holistic concepts, and therefore, there is a need for a holistic measurement of their performance.
A well-known and dominant tool in the context of supply chain and sustainability is lifecycle analysis/assessment (LCA). LCA is a tool to assess the potential environmental impacts and resources used throughout the product’s lifecycle [27]. According to Finnveden et al. [28], similar to many other decision support tools, uncertainties are not usually considered in LCA, even though they can be quite high. These uncertainties often outweigh the insight gained from LCA results. During recent years, hy-brid LCA proposals tried to eliminate some of LCA’s shortcomings. For instance, fuzzy integrations with LCA worked on considering the uncertainties regarding the lack of knowledge about the actual system or, as it is termed, “epistemic uncertainty” [29]. This approach provides a tradeoff between environmental and economic objectives when taking into account the epistemic uncertainty [30]. Pineda-Henson and Culaba [31] integrated LCA with AHP (analytical hierarchy programming) in the context of green production. However, their approach adds expert elicitation and, therefore, is more biased and uncertain according to Bi and Wang [32] and Sallak et al. [33]. The aleatory uncertainty or the uncertainty due to the potential stochastic behavior of the system is yet to be studied for supply chain sustainability. High data intensity and bias towards analyzing the environmental perspective of the organization and, consequently, its supply network are some of the other shortcomings of LCA mentioned by [1]. Currently, there is no formal and comprehensive method for the environmental performance evaluation of the broad supply chain [34].
The sustainability measure initiatives analyzed by Delai and Takahashi [35] (p. 438) further proved that not a single initiative “tackles all sustainability issues and in fact there is no consensus around what should be measured and how.” Moreover, Delai and Takahashi [35] showed that most initiatives measure sustainability performance by employing absolute indicators, and therefore, they are not suitable for embedding into performance measurement systems and decision-making. For this purpose, “result-oriented measures and ratio indicators are more adequate for internal decision making” Delai and Takahashi [35] (p. 438). Seuring and Muller [36] and Hassini et al. [37] also concluded that the few incomplete existing sustainability performance measures are based on the traditional definition of performance—time, cost and quality [38,39]—and therefore, the TBL (planet, people and profit) is not taken into account. Hence, the supply chain domain lacks a performance measure that considers all social, environmental and economic aspects of sustainability.
In short, our review of the literature indicated that there are significant knowledge gaps related to measuring sustainability performance within the supply chain context. In particular, the lack of a holistic environmental performance evaluation method for industrial processes [22,30], the lack of a suitable performance measure for the complete supply chain [13,40,41] and the necessity for a measure that considers cross-industry studies [42,43] reinforce the need for an inclusive and comprehensive sustainability performance measure. To address some of the knowledge gaps in this domain, in this paper, we develop an enhanced measure that considers the three dimensions of sustainability, taking into account inter-dependency between supply chain parties in an industry supply network. To ensure that the complexity is manageable, we limit the scope of the measure to pairs of organizations (dyads) within an industry supply network. Miemczyk et al. argued that a dyadic relationship is the first level of an organization in evaluating its supplier relationships and can be extended to supply chain and network levels [44]. Similarly, we argue that the dyadic measure that we develop in this study can also be easily extended to incorporate other parties within the supply chain. This measure is designed so that it can be employed within a supply network involving diverse industrial sectors.
In developing the proposed sustainability performance measure for industrial supply networks, we considered existing indicators in three areas of sustainability that are relevant for the study purpose. For example, the environmental sustainability part of the measure is built based upon an existing environmental performance evaluation model proposed by Shokravi et al. [22]. Furthermore, our proposed sustainability measure takes into account the inter-relationship between economic performance and both environmental and social performances. The economic performance uses the profit-sharing of dyadic members explained by Cachon and Lariviere [45] as the basis of its economic sustainability performance measure. This economic sustainability performance measure highlights the importance of a cooperative relation, as opposed to a competitive relation, between the industry supply network members to enable them to share information in their efforts to improve their overall sustainability performance. Social performance uses a modified set of indicators that were originally presented in the United Nation Guidelines and Methodologies as indicators of sustainable development [46]. This social performance models a novel quantitative social sustainability performance measure that can be customized to a given organization and its supply network.
Our proposed sustainability measure for industrial supply networks that considers three aspects of sustainability is novel, and it is arguably the only measure that includes the uncertainties involved in the supply network. It is also one of the few quantitative measures that contains all three pillars of sustainability to be addressed in a policy-making procedure when an organization is planning to manage its supply network to achieve a more sustainable industrial sector.
In the next section, we explain what the industrial supply network means, to set the study context. Then, we present the economic performance measure that is proposed for a supply network with revenue-sharing relations between dyads. Further, we review and synthesize existing performance measures of environmental and social aspects of sustainability and proposed relevant indicators to measure these two aspects. Then, based on the various indicators identified for each dimension of sustainability, we discuss the development of the proposed sustainability measure for industrial supply networks. Finally, we compare our proposed model with a number of existing models to highlight the study contributions and outline some limitations and future studies.

2. Experimental Modelling

2.1. Industrial Supply Network and Sustainability Performance Measure Development

An industrial supply network is a combination of interconnected industrial processes that adds value for customers through the manufacturing and delivery of products [47]. An example of a supply network is shown in Figure 1. A supply chain is a specific example of a supply network in which raw, intermediate and finished materials are procured as products via a chain of processes [42]. The focal points of supply chains are a firm and its upstream and downstream relationships [48], whereas a supply network investigates interconnected relationships shared between multiple supply chains [49]. These definitions might slightly differ across sectors or according to the members within the network [50,51].
Figure 1. A supply network example for the proposed measure-supplier-manufacturer and manufacturer-manufacturer dyads that are shown as Dyads i,j and k.
Sustainability 06 02201 g001
This paper breaks down interconnected relationships within an industrial supply network into dyads (as shown in Figure 1) that refer to relationships between the members in the network. The reasoning behind this break down is that as organizations seek to implement sustainability in their supply networks, “their the members of the network, as presented in Figure 1. The proposed sustainability measure for an industrial supply network is composed of economic, environmental and social performance measures.

2.2. Economic Performance

Economic evaluation happens at the beginning of the process design stage in order to validate its feasibility. The evaluation considers capital investment and manufacturing costs [52]. Capital investment includes all the expenses at the beginning of the plant, such as cost to build and start up the process. The total capital investment is given by fixed and working capitals. Manufacturing cost includes all the expenses that are made on a continuous basis over the life of the plant. The manufacturing costs considered in this paper are [52]:
  • The raw material costs that are used on a regular basis; which are not replaceable during the production and are generally purchased in bulk.
  • Credits that involve utility, by-products and usable purge gases that are generated on a regular basis; this can be counted as the positive cost for the process, which is greatly dependent on the type of by-product(s) or co-product(s).
  • Direct costs, including labor, supervision, payroll, utilities and maintenance. [53].
In this work, the individual profit function of each member in the supply network (e.g., supplier, manufacturer and customer) is shown in Equation (1). The capital costs and the value of the scrap equipment are not considered, and only manufacturing costs and the profit of selling the product have been taken into account. The objective of this performance measure is to create an opportunity to share information between members of the network and enable them to compare performances amongst each other. The inclusion of capital costs, that vary greatly based on the type of industries and processes, as well as scrap equipment values, which might not exist in some types of processes, would potentially change the economic performance of some processes, such that comparing their performances with other processes within the network would be meaningless.
Sustainability 06 02201 i001
In order to model the supply network consisting of supplier-manufacturer or manufacturer-customer dyads, it is assumed that the relationship between them is the one of revenue-sharing and does not consider competition between the members. Cachon and Lariviere [45] proved that other contracts or relationships are special cases of revenue-sharing; hence, revenue-sharing is more general and used in this model. For instance, the profit of a manufacturer and supplier in a revenue sharing relation is as shown in Equations (2)–(4) [45].
πm = 𝜙R(quan, price) − (cm + ws − 𝜙v) × quan
πs = (1 − 𝜙)R(quan, price) − (csws − (1 − 𝜙)v) × quan
πSN = πm + πs = R(quan, price) − (cv) × quan
where c = cm + cs. Supply network profitability (SNPR) is given by Equation (5).
Sustainability 06 02201 i005
PRSN is the PR for each member of the supply network and PRSNL is the PR for the links or the transportation between members. The transportation is measured separately in this model. As much as the transportation is part of the supply network, it has a different nature than a given industrial process. Hence, transportation is considered as a separate entity to incorporate this difference, especially when evaluating the environmental impacts of the supply network members.

2.3. Environmental Performance

The environmental performance of an industrial process evaluates the relationship between the process and the environment. For instance, it includes the environmental effects of the resources consumed, the environmental impacts of the process the environmental implications of its products and services, as well as the recovery and processing of products. Environmental performance evaluation (EPE) methods provide management with reliable information on whether the environmental performance of the organization is acceptable or not. This information is presented as environmental performance indices (EPIs) that partially reveal the harmful effects of the process and how to decrease these effects by altering the process’s operation [54]. The majority of these EPIs are based on scoring and ranking approaches, which have limitations and uncertainties due to biased expert judgments [55]. These rankings would vary if the expert opinion changes, even though some studies, for example those conducted by Zhu et al. [8,9], attempted to consider the biases with their rankings.
Moreover, EPIs lack inclusive hazard evaluations and uncertainty appraisal, which lead to unreliable results. Ranking- and scoring-based EPIs are capable of comparison between processes based on their environmental hazard, but it is not clear how complete and rigorous these comparisons are. An EPE method proposed by Shokravi et al. [22] provides an index called Environmental Performance Parameter (EPP), which encapsulates the harmful impacts of an industrial process on the environment, and how operation and maintenance policies can decrease such impacts. EPP is readily comprehensible by non-experts and is not computationally intensive when compared to other EPIs [56]. This index can be used to engage employees at all levels with associated environmental performance assessment programs and schemes [57].
Based on a dictionary definition, industrial processes convert raw materials into finished goods and involve chemical and mechanical steps for manufacturing item(s) or product(s). Hence, an integral part of an industrial process is manufacturing the products or finished goods. The raw materials and products are also important and have adverse environmental impacts based on their own characteristics. These two aspects should be included when designing a method for assessing the environmental performance of an industrial process. If the operational assessment part of the method deals with the manufacturing and operating characteristics of an industrial process, the environmental assessment part of the method deals with the environmental impact of products and raw materials.
The operational assessment of an industrial process is to predict if the process is in operation or out of operation. In other words, the operating and non-operating duration of the process time is estimated. The operating time is the time directly spent for manufacturing the products. The non-operating time is the time spent, for instance, repairing the equipment, preparing paper work and filling the fuel tank (if applicable). As these timings are based on a prediction, the knowledge about them is imperfect. This means an uncertainty exists with the operating and non-operating durations of the process. To deal with this uncertainty (this is called aleatory uncertainty, which is due to inherent variability or, potentially, the stochastic nature of the system/process [58]), the probability of a random variable, which is called the state of the process, should be taken into account. At every time step (for instance, every hour), the probability of a process being in operating mode or non-operating mode is estimated (termed µ(t)), and the larger probability determines the process’s status. The values of these probabilities are based on the failure rates and reliability of the equipment and the process, respectively. For instance, if the equipment fails, it has to transition to a non-operating mode, and it has to transition to an operating mode when the failed part is repaired and the associated reliability has been improved. Hence, by incorporating the mechanical steps and the operational aspects of the process in the operational assessment, the state of the process is identified. A Markov-like model is employed for this incorporation, as elaborated in [22,56].
Environmental assessment of an industrial process calculates the adverse impacts of every existing material within the process according to the indicators presented in Table 1. These indicators are collected from the literature and referenced appropriately. Other limited lists of indicators can also be used, for example the list presented by Zhu et al. [8]. The calculation of indicators in our paper is simple, as long as the required data are available, which are mostly about the quantity and inventory of the material. However, there are factors that intensify these impacts and that are not possible to calculate through approaches within the literature. These factors are the reasons that the impact might occur. For instance, if the considered environmental impact is the toxicity of methanol, the existence of methanol within the process does not necessarily cause adverse impacts on the environment. However, the release of the methanol is the source for causing an adverse impact on the environment. This release can be due to normal operating practices or due to an unpredicted mistake or incident. For instance, a human error causes spillage from a tanker full of methanol, which is an unpredictable mistake. A well-known example is the Piper Alpha tragic accident that caused 165 deaths out of 226 people on an oil platform in the north sea, which was due to a human error in filling out the maintenance form [59]. To consider these factors and the reasons for impact occurrence within the method, their probabilities are incorporated. This probability is different from the one included in the operational assessment part of the method. This probability is based on the process history about a similar incident with similar reasons that happened before. They are incorporated as weightings to the impact function (IFu) of the environmental assessment. These weightings incorporate the probability of chemical release to the environment and the associated target that the organization wants to achieve in a specific number of years regarding both the probabilities and the consequential environmental impacts. Hence, this environmental assessment not only considers the current situation by including the inventory of the process and its adverse environmental impacts, but also incorporates the future targets of the organization regarding these impacts.
If the process is a new process without history or the data about a similar incident has not been recorded, the information of a similar process can be used. There is an uncertainty about the value of this probability that can be decreased by collecting more information or conducting more studies (this type of uncertainty is termed epistemic uncertainty, which is due to imperfect knowledge and can be reduced if further data collection or studies are conducted [60]). However, this might not be the best use of time and resources. It is noteworthy to mention that conducting further studies is justified if, as a result, the reduction in the uncertainty is considered to be significant.
By combining these two parts, operational assessment and environmental assessment, together in the method, a comprehensive method that assesses the environmental impacts of an industrial process is born that considers the existing uncertainties and includes the operational aspects of the process without a need for any ranking or scoring. This method results in an environmental performance parameter (EPP). The EPP value is calculated through Equation (6) according to Algorithm 1 in Appendix A, by first initializing the process information and calculating the environmental impact for each subprocess. Then, the operating and non-operating probabilities of the process are estimated as µ(t) for every time step (every hour of the process). Finally the EPP for the whole process is calculated as Equation (6).
Sustainability 06 02201 i006
in which × is a vector multiplication, µu is a vector of probabilities that show that the subprocess is in operating or non-operating states, nu is the total number of these subprocess, t is the time and n is the total time of the process under study.
Table 1. The required equations for calculating the impact function (IFu) for each subprocess.
Impacts Sub-ImpactsEquationEquation Reference
Air pollutionToxicityX1ui = LD50i + TLVi × Ln(LCxi)[61]
PhotochemicalX2ui = (0.75/6) × [PropEquiv(i)](ozoneppb)[62]
Smog[PropEquiv(i)] = PEC (i) × Sustainability 06 02201 i011[62]
AcidX3ui = Sustainability 06 02201 i012[62]
Depositionrmi = Sustainability 06 02201 i013[63]
CLi = 1624.7rmi − 9.04[64]
GlobalX4ui = (Warming)i × Qi (years cm−2 atm−1)[65]
Warming(Warming)i = Sustainability 06 02201 i014[65]
OzoneX5ui = ODi × Sustainability 06 02201 i015[65]
DepletionODi = τ × (nCl + 30nBr) (years molecule−1)[65]
Water PollutionHeavy MetalsX6ui = Quantity of the metal used
NOXX7ui = Quantity of NOX emitted
Soil PollutionPesticidesX8ui = Quantity of pesticides used
FertilizersX9ui = Quantity of fertilizers used
Resource DepletionWaterX10ui = Quantity of water used
Physical MaterialX11ui = Quantity of material used
Chemical MaterialX12ui = Quantity of chemical used
Natural GasX13ui = Quantity of natural gas used
OilX14ui = Quantity of oil used
CoalX15ui = Quantity of coal used
By defining the complete supply network, as demonstrated in Figure 1, for the sake of simplicity, the supplier-manufacturer and manufacturer-manufacturer dyads are considered linear time invariant, which might not apply to the complex interactions among them, but is seeding a view that has not been approached before. Hence, the supply network EPP (SNEPP) is the summation of the processes’ EPPs and the EPPs for the transportation links, as given by Equation (7). Transportation is considered separately in this model, similar to economic performance measurement. This is due to the fact that the environmental impacts of the transportation are from specific categories of emissions and fuel consumption. By separating transportation in the calculation of EPP, the identification and inclusion of their impact become easier for the model users, as they are readily identifiable.
Sustainability 06 02201 i007
EPPSN is the EPP for each member of the supply network, and EPPSNL is the EPP for the links or the transportation between members.

2.4. Social Performance

Similar to the definition of environmental performance model, the social performance model calculates the social adverse effect of the process and, consequently, industrial supply networks; in other words, how much harm the process or industrial supply network is posing to the society and societal values. This model uses the list of social indicators (Table 2) according to the United Nation Guidelines and Methodologies for Indicators of Sustainable Development [46]. The list is modified so all indicators represent the adverse effect on the society. The higher value means more societal harm in this model. Hutchins and Sutherland [25] partially used an earlier version of this list in a social lifecycle assessment (SLCA) model. This SLCA model measures the corporate social responsibility [25]. It demonstrates that the higher is the social indicator values, the more social sustainability is achieved by the company. It uses a weighting for each indicator according to the management team at the given company to decide on the indicator importance.
Table 2. The social indicators considered in the developed model.
ThemeSub-ThemeIndicator
PovertyIncome poverty% of pop. living below the national poverty line
% of pop. below \$1 a day
Income inequalityThe ratio of the share in national income of the highest to lowest quintile
Sanitation% of pop. in need of an improved sanitation facility
Drinking water% of pop. in need of an improved water source
Access to energy% of pop. without electricity or other modern energy
% of pop. using solid fuel for cooking
Living conditions% of urban pop. living in slums
GovernanceCorruption% of pop. having paid bribes
HealthMortalityThe mortality rate for the families of direct and/or indirect employees
The mortality at birth for the families of direct and/or indirect employees
Healthcare delivery% of pop. without access to primary healthcare
Health status and riskThe morbidity of major diseases, such as HIV/AIDS, malaria, tuberculosis, between pop.
The prevalence of tobacco use and suicide rate within pop.
EducationEducation levelEducation level of the direct and indirect employees
% of the drop-out ratio for the last grade of primary education within pop.
% of not life long learning within pop.
Literacy% of adult illiteracy within pop.
pop.: the population of direct and/or indirect employees
In this paper, the social performance of a process (given by Equation (8)) is proposed as a multiplication of the social cost for each indicator (from Table 2) and the importance measure (Im) of that indicator. Im for each indicator is given by the information collected through social media and shared over the dyadic interactions of organizations within their supply network. Hence, it discloses the importance of the indicator from the perspectives of society and dyadic members. This enforces the use of the model over a supply network that promotes having a revenue sharing relationship instead of competition; because this leads to deep sharing of the required information between the members and, therefore, does not encourage secrecy and a lack of communications. This is aligned with the conclusion of Bernardes [23] that by achieving shared cognition within the relevant supply network, the organization is empowered with information and can learn to move towards sustainability instead of stagnating in isolation. The social performance of the respective industrial supply network is the summation of social performance associated with each member of the network according to their dyadic interactions, given by Equation (9).
Sustainability 06 02201 i008
Sustainability 06 02201 i009
In Table 2, the indicators are chosen from the third column, and they are adapted from the UNDSD (United Nations Division of Sustainable Development) [66] theme/sub-theme framework and modified to represent the social performance of a process within an industry supply network. This depends on the process need, dyadic relationships, industry sector and size. As mentioned earlier in this section, the indicator values indicate harm to the society and, therefore, the higher their values, the more harmful and undesirable from the sustainability perspective.
The importance measure (Im) is used in the maintainability and reliability context for finding the most crucial component to be fixed in order to achieve the highest increase in the reliability of the system [33,67]. In the context of this paper, the importance measure shows how urgent this indicator is in the public and network’s eye. Therefore, organizations can adjust their priorities for dealing with these indicators according to their importance measures. These measures are easily collectable by an online survey over a social media website and over the dyadic interactions in the respective supply network. This collects the general public’s view and network view at the same time. Aggregation of these measures is possible through a variety of methods, such as a pairwise comparison approach [68].

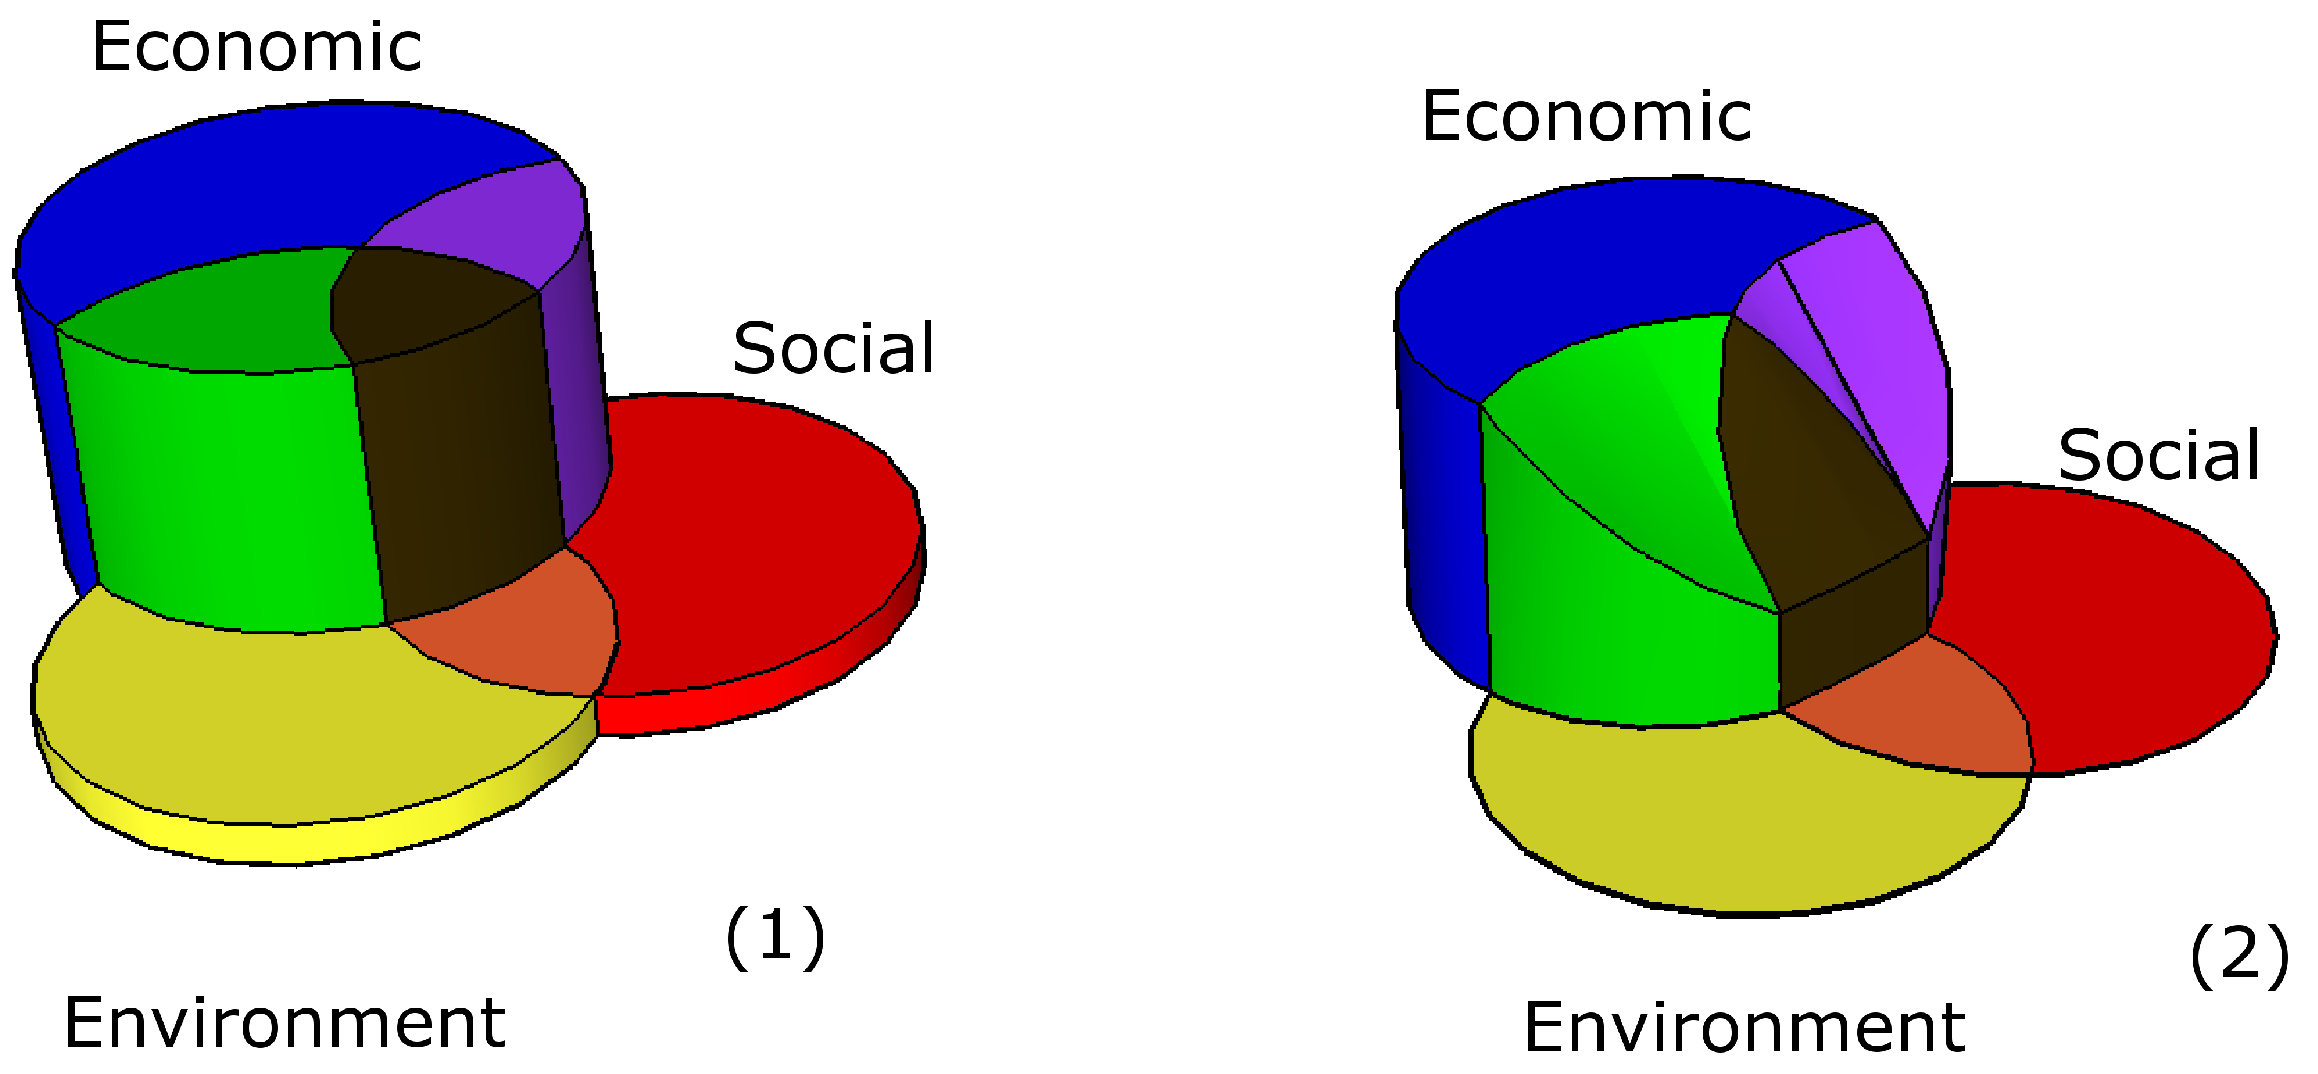
2.5. The Proposed Sustainability Measure

The proposed sustainability measure (SM) considers environmental, social and economic performance for a supply network. The economic performance focuses on the profit of the supply network, calculating it through the model proposed in Section 2.2. The environmental performance is measured through the model presented in Section 2.3. This environmental performance demonstrates the level of adverse effect that a supply network can have on the environment. It also contains the targets that a given organization is setting for decreasing its adverse impacts on the environment. The social performance has a similar approach as the environmental performance, and it is calculated through the model proposed in Section 2.4. Social performance demonstrates the societal values that are at harm, such as those indicators presented in Table 2. Social performance also models the importance of amelioration in these indicators from the public point of view and those of dyadic members within the supply network.
The sustainability measure (SM), given by Equation (10), demonstrates the social and environmental harm from the supply network that can be improved by every dollar of profit produced. Considering the variables involved in three performance measures, SM is a useful tool for measuring and managing sustainability, as it identifies the environmental and social impacts, their importance, their source and the target to achieve if the organization is planning on the continual improvement of its performance. It also identifies the resources that the organization and, in general, the supply network will require for amelioration. Logarithmic calculation for SM confines the range of numbers, and when an organization is trying various avenues for SM improvement, even small differences between current and future values are detectable by employees and management.
Sustainability 06 02201 i010

3. Results and Discussion

In this work, a sustainability measure (SM) for supply networks is presented. This unbiased and quantitative measure integrates the economic, social and environmental aspects of sustainability and demonstrates the amount of harm that the supply network can cause to the environment and society for every dollar of profit that it produces. The environmental measure is based on ratio indicators that facilitate the comparison between current and future performances. It considers the uncertainty of input data due to the incomplete data collection and the natural variability of the process. The economic measure considers the profit function, which is the most important aspect of the supply network as a business entity. It calculates the profit of the process, both as an individual and as a member of its associated supply network. The social performance is based on a social cost model that evaluates a number of social indicators according to indicators of sustainable development by the United Nations [46] and their importance in the eyes of the public and the dyads. It enables the dyads to share the information required for this measure and extends their cognitive knowledge within their associated supply networks. This social performance measure is one of the rare quantitative measures that relates the social performance of a process to its environmental and economic performances in a supply network.
Within the literature, quantitative measures that consider social, ecological and financial aspects of an organization are termed as “socio-eco-efficiency” measures. SM might seem like a socio-eco-efficiency measure. However, there are some distinctions that can be made between SM and socio-eco-efficiency measures within the literature. In a broad sense, eco- and socio-efficiency measures are employed to improve those ecological and social aspects that will benefit the economic measure [69]. These efficiency measures can contribute to economic sustainability, but not to environmental/ecological or social sustainability.
A representation of a socio-eco-efficiency measure is shown in Figure 2. In the best case, shown in Figure 2-1, the social and environmental aspects of the measure benefit the economic pillar; hence, causing its improvement. This only leads to economic sustainability improvement and the improvement of those social and environmental indicators that can be translated directly to financial measures. Hence, in most parts, the social and environmental sustainability are not improved. In Figure 2-2 however, it is shown that if the social and environmental aspects of sustainability suffer a drop in their performance, not only does it damage the total sustainability performance of the organization and, therefore, the supply network, but also it causes a drop in economic sustainability.
Figure 2. The three pillars of sustainability: (1) the case in which the socio-eco-efficiency measure led to an improvement in economic sustainability and, hence, the social and environmental sustainability, compensating for the economic pillar; (2) the environmental and social sustainability suffer from a lack of good performance and, hence, drag the economic sustainability down, as well.
Sustainability 06 02201 g002
One of the well-known socio-eco-efficiency measures in the literature is SEEbalance [69], which was proposed by the chemical company BASF for improving the performance of their product portfolio and processes and for marketing advantageous products [69]. In other words, SEEbalance was used to improve the profitability of the BASF company by identifying marketing advantages from social and environmental (green) perspectives. Many other eco-efficiency measures were proposed based on SEEbalance in other fields, for instance, in construction [70] and air transportation [71]. However, according to Shadiya and High [72], SEEbalance and methods based on it require extensive data and information, making them limited for the early stages of design, which is the stage that SEEbalance is targeting. In addition, Shadiya and High [72] reported that the social metrics considered within SEEbalance might not have any correlation with the process design parameters. Moreover, Burchart-Korol [73] reported that SEEbalance is only advantageous for an internal use, that is, within a company, and not for use across a supply network.
Overall, socio-eco-efficiency measures consider those aspects of sustainability that are readily translatable to financial measures, and their focus is on economic sustainability. This focus causes socio-eco-efficiency measures to fall short when an organization tries to manage the whole spectrum of its sustainability and not just its financial aspects. Moreover, an inclusive sustainability measure, such as the one proposed in this paper that considers uncertainty and acknowledges the incompleteness of gathered data, depicts a more realistic version of an organization sustainability performance that is reliable for inclusion in its policy-making procedures. Our proposed SM, on the other hand, considers the three pillars of sustainability in their own merits and uses the economic measure to provide improvement opportunities and resources for social and environmental performances. In addition, our proposed SM is a reliable measure for an organization, as the uncertainties associated with environmental impacts and the stochastic nature of the processes are considered and estimated, respectively. The focus of SM is beyond the efficiency measure; it considers the operational aspects of the processes within the supply network. SM also considers and estimates epistemic and aleatory uncertainties that were neglected within the environmental performance evaluation field [74]. Hence, it is more reliable and trustworthy for decision-making procedures.
Another dominant method for sustainability measurement within the literature is LCA, as reviewed in Section 1. LCA cannot take into account the existing uncertainty associated with the data or the system under analysis. Moreover, in social LCA, experts are divided in the choice of the indicators to be included in the analysis. Even LCA-based measures that are proposed for sustainability performance evaluation have high data intensity and are subject to the environmental perspective of the analysis instead of having a comprehensive approach towards the economic, environmental and social pillars of sustainability.
SM incorporate theories of imprecise probability and the Markov chain to consider and estimate the epistemic and aleatory uncertainties within the environmental performance measure, respectively. It also sets a number of indicators to be included in the measurement, even though other indicators can readily be included. The focus on the dyadic relations in the supply network emphasizes the importance of each and every member within their associated network. Hence, any company/organization/process using SM can easily incorporate its supply network and measures its SM as a member of the network. SM provides a process manager a clear idea about the environmental safety, the profit of the process and their social image as a part of a supply network. A quantitative measure for the sustainability performance of the process/company as part of its supply network provides a tangible target for policy-making and, therefore, facilitates a sustainable management system within the organization. This can lead to a more educated decision-making procedure for improving the environmental, social or economic aspects of the process and its associated supply network.
SM could initiate a cross-industry dialogue between companies that share a supply network. This leads to companies sharing their information and data about operations within the framework of the measure, which ameliorates the data gathering issues within the supply chain domain. SM is especially beneficial, as its application is simple and easy for industrial owners who have access to the relevant information. The importance of information sharing in the supply chain domain is also mentioned in [75]. Seuring [76] concluded that the problems with data collection in the supply chain domain reveal the necessity for more and better documentation and case studies.

4. Conclusions

The isolated attempts of single companies towards sustainability have heightened the interest of society with respect to this issue, but no substantial progress has been made so far for developing a qualitative measure that enables us to manage our sustainability issues. A common language for all members of the supply network is required in order to convert these individual attempts into an inclusive and combined movement. Therefore, a common measure should be employed across sectors and networks to initiate this language. SM could be a common ground for dialogue between companies and networks as a generic measure.
To examine SM suitability, to initiate the dialogue within the supply networks, we plan to collect an adequate level of data for a set of case studies. These case studies validate the applicability of SM to supply networks in chemical, mining and metal manufacturing industry sectors. The results of these case studies will be published as a part of our future work.
In this paper, a linear relation between the network’s members is assumed to simplify elaborating on the concept of SM. However, in reality, the complex relations between the networks’ members may not follow such linearity. Hence, we follow a graph theory-based model to expand SM and adapt it to more complicated supply networks (for more information about graph theory, see [77]).
In this paper, the relationship between the network’s members was set to a profit sharing relationship. This relationship might not be applicable to all members in various industries. Hence, another avenue to expand this work is to replace the profit sharing relationship with other types of relationships by simply altering the profit functions. Given an industrial sector that does not accept profit sharing as an adequate relationship for its members [45], this avenue for future contribution might be very well received by the industry.

Acknowledgments

The authors would like to acknowledge the support of Interdisciplinary Seed Funding that made this project possible for the first author.

Author Contributions

The first author has developed the models and the measures for three pillars of sustainability that are described in Section 2. The second author has contributed to the writing of the study context, highlighting the research gaps, the study contributions and improving the flow and structure of the paper. The discussion of the models and their implications are completed by both authors.

Nomenclature: Mathematical Notation

AuSS
Availability of the system
cm
The manufacturer’s cost per unit
cs
The supplier’s cost per unit
Cmain
Cost of maintenance (cost per unit)
COuti
Cost of utility while in operation (cost per unit)
Cstaff
Cost of staff (cost per unit)
CUuti
Cost of utility while out of operation (cost per unit)
Costsi
Social cots of every social indicator
EPP
Environmental Performance Parameter
EPPSN
EPP for each member of the supply network
EPPSNL
EPP for the supply network links or transportation between members of the supply network
nSN
Number of supply network members
IFu
Impact function
Imsi
Importance measure for every social indicator
n
Total process time
N
Total number of system states
nu
Total number of subprocesses
nsi
Total number of social indicators
nSN
Total number of members in a supply network
PR
Individual profit function for a process
PRSN
Profit function for each process as a member of the supply network
PRSNL
Profit function for the transportation links between supply network members
price
value of the product manufactured by a given process
price
Raw material price
R(quan, price)
The retailer’s revenue for a specified quantity and price
si
Number of social indicators
SM
Sustainability measure of the supply network
SN
Number of members in a supply network
SNEPP
Supply network environmental performance parameter
SNPR
Supply network profitability
SNSP
Supply network social performance
SP
Social performance of a process
SS
System state indicating if the system is in operating or non-operating state
t
Time
u
Number of subprocesses
v
The salvage price of the asset
ws
The wholesale price that manufacturer pays the supplier
µ(t)
State probability distribution vector at time t
πs
The supplier’s profit function
πm
The manufacturer’s profit function
𝜙
The revenue generated by the manufacturer
𝜙SN
The supply network generated revenue

Appendix A. The Algorithm for the Environmental Performance Evaluation Model
Algorithm 1: EPE method algorithm - EPP Calculation.
 Choose a process;
 Choose a design;
 Break the process into subprocesses;
 Read the number of subprocesses;
 Read the number of chemical material in each subprocess;
 Initialize the chemical material parameters;
 Initialize the operating unit parameters;
 Initialize the process time;
while number of subprocesses≠ 0 do
for t = 1 : processtime do
Sustainability 06 02201 i002Calculate µu(t)
for i = 1:number of the chemical material do
for S = 1:number of states do
case impact is (Table 2.1)
Sustainability 06 02201 i003Toxicity : X1ui Photochemical smog : X2ui;
Acid deposition : X3ui;
Global warming : X4ui;
Ozone depletion : X5ui;
Heavy metal : X6ui;
NOx : X7ui;
Pesticide : X8ui;
Fertilizer : X9ui;
Water : X10ui;
Physical material : X11ui;
Chemical material : X12ui;
Natural gas : X13ui;
Oil : X14ui;
Coal : X15ui;
while Xui ≠ 0 do
Sustainability 06 02201 i004Calculate weights (ωi)
Xi = Xui / Sx;
 Calculate IFuu = ∑ii ωi × Xi;
 Calculate EPPu = ∑t µu(t) × IFuu (using Equation 6)

Conflicts of Interest

The authors declare no conflicts of interest.

References

  1. Ashby, A.; Leat, M.; Hudson-Smith, M. Making connections: A review of supply chain management and sustainability literature. Supply Chain Manag. Int. J. 2012, 17, 497–516. [Google Scholar] [CrossRef]
  2. Auramo, J.; Kauremaa, J.; Tanskanen, K. Benefits of IT in supply chain management: An explorative study of progressive companies. Int. J. Phys. Distrib. Logist. Manag. 2005, 35, 82–100. [Google Scholar]
  3. Chae, B.; Yen, H.R.; Sheu, C. Information technology and supply chain collaboration: Moderating effects of existing relationships btween partners. Eng. Manag. IEEE Trans. 2005, 52, 440–448. [Google Scholar] [CrossRef]
  4. Damsgaard, J. The Diffusion of Electronic Data Interchange: An Institutional and Organizational Analysis of Alternative Diffusion Patterns. PhD Thesis, Aalborg University, Aalborg, Denmark, 1996. [Google Scholar]
  5. Ageron, B.; Gunasekaran, A.; Spalanzani, A. Sustainable supply management: An empirical study. Int. J. Prod. Econ. 2012, 140, 168–182. [Google Scholar] [CrossRef]
  6. Carter, C.R.; Easton, P.L. Sustainable supply chain management: Evolution and future directions. Int. J. Phys. Distrib. Logist. Manag. 2011, 41, 46–62. [Google Scholar] [CrossRef]
  7. Chien, M.K.; Shih, L.H. An empirical study of the implementation of green supply chain management practices in the electrical and electronic industry and their relation to organizational performances. Int. J. Environ. Sci. Technol. 2007, 4, 383–394. [Google Scholar]
  8. Zhu, Q.; Sarkis, J.; Lai, K.H. Confirmation of a measurement model for green supply chain management practices implementation. Int. J. Prod. Econ. 2008, 111, 261–273. [Google Scholar] [CrossRef]
  9. Zhu, Q.; Sarkis, J.; Lai, K.H. Examining the effects of green supply chain management practices and their mediations on performance improvements. Int. J. Prod. Res. 2012, 50, 1377–1394. [Google Scholar] [CrossRef]
  10. Andersen, M.; Skjoett-Larsen, T. Corporate social responsibility in global supply chains. Supply Chain Manag. Int. J. 2009, 14, 75–86. [Google Scholar] [CrossRef]
  11. Capaldi, N. Corporate social responsibility and the bottom line. Int. J. Soc. Econ. 2005, 32, 408–423. [Google Scholar] [CrossRef]
  12. Soylu, A.; Oruc, C.; Turkay, M.; Fujita, K.; Asakura, T. Synergy analysis of collaborative supply chain management in energy systems using multi-period MILP. Eur. J. Oper. Res. 2006, 174, 387–403. [Google Scholar] [CrossRef]
  13. Styles, D.; Schoenberger, H.; Galvez-Martos, J.L. Environmental improvement of product supply chains: A review of European retailers’ performance. Resour. Conserv. Recycl. 2012, 65, 57–78. [Google Scholar] [CrossRef]
  14. Carter, C.R.; Rogers, D.S. A framework of sustainable supply chain management: Moving toward new theory. Int. J. Phys. Distrib. Logist. Manag. 2008, 38, 360–387. [Google Scholar]
  15. Simchi-Levi, E.; Kaminsky, P. Designing and Managing the Supply Chain: Concepts, Strategies and Case Studies; McGraw-Hill: New York, NY, USA, 1999. [Google Scholar]
  16. Seuring, S. A review of modeling approaches for sustainable supply chain management. Decis. Support Syst. 2013, 54, 1513–1520. [Google Scholar] [CrossRef]
  17. Dekker, R.; Bloemhof, J.; Mallidis, I. Operations Research for green logistics—An overview of aspects, issues, contributions and challenges. Eur. J. Oper. Res. 2012, 219, 671–679. [Google Scholar] [CrossRef]
  18. Georgiadis, P.; Vlachos, D. The effect of environmental parameters on product recovery. Eur. J. Oper. Res. 2004, 157, 449–464. [Google Scholar]
  19. Bai, C.; Sarkis, J.; Wei, X.; Koh, L. Evaluating ecological sustainable performance measures for supply chain management. Supply Chain Manag. Int. J. 2012, 17, 78–92. [Google Scholar] [CrossRef]
  20. Kainuma, Y.; Tawara, N. A multiple attribute utility theory approach to lean and green supply chain management. J. Prod. Econ. 2006, 101, 99–108. [Google Scholar] [CrossRef]
  21. Georgiadis, P.; Besiou, M. Environmental strategies for electrical and electronic equipment supply chains: which to choose? Sustainability 2009, 1, 722–733. [Google Scholar] [CrossRef]
  22. Shokravi, S.; Smith, A.J.R.; Burvill, C.R.; Maheswararajah, S. Industrial Environmental Performance Evaluation—Comparison and Sensitivity Analysis. In Managing Resources of a Limited Planet: Pathways and Visions under Uncertainty, Sixth Biennial Meeting, Proceedings of the International Environmental Modelling and Software Society (iEMSs) 2012 International Congress on Environmental Modelling and Software, Leipzig, Germany, 1–5 July 2012; Seppelt, R., Voinov, A.A., Lange, S., Bankamp, D., Eds.; pp. 1037–1044.
  23. Bernardes, E. The effect of supply Management on aspects of social capital and the impact on performance: A social network Perspective. J. Supply Chain Manag. 2010, 46, 45–56. [Google Scholar] [CrossRef]
  24. Hahn, T.; Figge, F.; Pinkse, J.; Preuss, L. Trade-offs in corporate sustainability: You can’t have your cake and eat it. Bus. Strateg. Environ. 2010, 19, 217–229. [Google Scholar]
  25. Hutchins, M.; Sutherland, J.W. An exploration of measures of social sustainability and their application to supply chain decisions. J. Clean. Prod. 2008, 16, 1688–1698. [Google Scholar] [CrossRef]
  26. Defee, C.; Esper, T.; Mollenkopf, D. Leveraging closed-loop orientation and leadership for environmental sustainability. Supply Chain Manag. Int. J. 2009, 14, 87–98. [Google Scholar] [CrossRef]
  27. AS/NZS ISO 14040. Environmental Management—Life cycle assessment—Principles and framework. Available online: https://www.iso.org/obp/ui/iso:std:iso:14040:ed-2:v1:en (accessed on 9 April 2014).
  28. Finnveden, G.; Hauschild, M.; Ekvall, T.; Guinee, J.; Heijungs, R.; Hellweg, S.; Koehler, A.; Pennington, D.; Suh, S. Recent developments in life cycle assessment. J. Environ. Manag. 2009, 91, 1–21. [Google Scholar] [CrossRef]
  29. Pishvaee, M.; Razmi, J. Environmental supply chain network design using multi-objective fuzzy mathematical programming. Appl. Math. Model. 2012, 36, 3433–3446. [Google Scholar] [CrossRef]
  30. Shokravi, S. Reviewing environmental impact assessment methods for industrial processes. Traffic Interdiscip. Grad. J. 2013, 13, 175–199. [Google Scholar]
  31. Pineda-Henson, R.; Culaba, A. A diagnostic model for green productivity assessment of manufacturing processes. Int. J. Life Cycle Assess. 2004, 9, 379–386. [Google Scholar] [CrossRef]
  32. Bi, Z.; Wang, L. Manufacturing Paradigm Shift Towards Better Sustainability. In Cloud Manufacturing; Springer: London, UK, 2013; pp. 99–119. [Google Scholar]
  33. Sallak, M.; Schon, W.; Aguirre, F. Extended component importance measures considering aleatory and epistemic uncertainties. IEEE Trans. Reliab. 2013, 62, 49–65. [Google Scholar] [CrossRef]
  34. Bai, C.; Sarkis, J. Green supplier development: Analytical evaluation using rough set theory. J. Clean. Prod. 2010, 18, 1200–1210. [Google Scholar] [CrossRef]
  35. Delai, I.; Takahashi, S. Sustainability measurement system: A reference model proposal. Soc. Responsib. J. 2011, 7, 438–471. [Google Scholar]
  36. Seuring, S.; Muller, M. From a literature review to a conceptual framework for sustainable supply chain management. J. Clean. Prod. 2008, 16, 1699–1710. [Google Scholar] [CrossRef]
  37. Hassini, E.; Surti, C.; Searcy, C. A literature review and a case study of sustainable supply chains with a focus on metrics. Int. J. Prod. Econ. 2012, 140, 69–82. [Google Scholar] [CrossRef]
  38. Rusinko, C.A. Green manufacturing: an evaluation of environmentally sustainabile manufacturing practices and their impact on competitive outcomes. IEEE Trans. Eng. Manag. 2007, 54, 445–454. [Google Scholar]
  39. Cox, A. Power, value and supply chain management. Supply Chain Manag. Int. J. 1999, 4, 167–175. [Google Scholar] [CrossRef]
  40. Gunasekaran, A.; Kobu, B. Performance measures and metrics in logistics and supply chain management: A review of recent literature (1995–2004) for research and applications. Int. J. Prod. Res. 2007, 45, 2819–2840. [Google Scholar] [CrossRef]
  41. Olugu, E.; Wong, K.; Shaharoun, A. A comprehensive approach in assessing the performance of an automobile closed-loop supply chain. Sustainability 2010, 2, 871–889. [Google Scholar] [CrossRef] [Green Version]
  42. Akyuz, G.A.; Erkan, T. Supply chain peraformance measurement: A literature review. Int. J. Prod. Res. 2010, 48, 5137–5155. [Google Scholar] [CrossRef]
  43. Subic, A.; Shabani, B.; Hedayati, M.; Crossin, E. Performance analysis of the capability assessment tool for sustainable manufacturing. Sustainability 2013, 5, 3543–3561. [Google Scholar] [CrossRef]
  44. Miemczyk, J.; Johnsen, T.E.; Macquet, M. Sustainable purchasing and supply management: A structured literature review of definitions and measures at the dyad, chain and network levels. Supply Chain Manag. Int. J. 2012, 17, 478–496. [Google Scholar] [CrossRef]
  45. Cachon, G.P.; Lariviere, M.A. Supply chain coordination with revenue-sharing constracts: Strenght and limitations. Manag. Sci. 2005, 51, 30–44. [Google Scholar] [CrossRef]
  46. United Nations. Indicators of Sustainable Development: Guidelines and Methodologies; Number 3; The Department of Economic and Social Affairs of the United Nations Secretariat: New York, NY, USA, 2007. [Google Scholar]
  47. Ukidwe, N.; Bakshi, B. Flow of natural versus economic capital in industrial supply networks and its implications to sustainability. Environ. Sci. Technol. 2005, 39, 9759–9769. [Google Scholar] [CrossRef]
  48. Cachon, G.P. Coordination with Contracts. Supply Chain Management: Design, Coordination and Operation; Elsevier: Amsterdam, The Netherlands, 2003; pp. 229–339. [Google Scholar]
  49. Lockamy, A. Examining supply chain networks using V-A-T material flow analysis. Supply Chain Manag. Int. J. 2008, 13, 343–348. [Google Scholar]
  50. Lummus, R.R.; Krumwiede, D.W.; Vokurka, R.J. The relationship of logistics to supply chain management: Developing a common industry definition. Ind. Manag. Data Syst. 2001, 101, 426–432. [Google Scholar] [CrossRef]
  51. Van Hoek, R.I. “Measuring the unmeasurable”—Measuring and improving performance in the supply chain. Supply Chain Manag. Int. J. 1998, 3, 187–192. [Google Scholar] [CrossRef]
  52. Biegler, L.; Grossmann, I.; Westerberg, A. Systematic Methods of Chemical Process Design; Prentice Hall PTR: Upper Saddle River, NJ, USA, 1997. [Google Scholar]
  53. Perry, R. Perry’s Chemical Engineers’ Handbook; McGrow-Hill: New York, NY, USA, 2008. [Google Scholar]
  54. Palaniappan, C. Selection of inherently safer process routes: A case study. Chem. Eng. Process. Process Intensif. 2004, 43, 641–647. [Google Scholar] [CrossRef]
  55. Jia, X.P.; Han, F.; Tan, X. Integrated environmental performance assessment of chemical process. Comput. Chem. Eng. 2004, 29, 5. [Google Scholar]
  56. Shokravi, S. An Environmental and Economic Performance Measure for Industrial Supply Networks. In Proceedings of the 20th International Congress on Modelling and Simulation (MODSIM2013) Adapting to Change: The Multiple Roles of Modelling, Adelaide Convention Centre, SA, Australia, 1–6 December 2013.
  57. Voinov, A.; Seppelt, R.; Reis, S.; Nabel, J.E.; Shokravi, S. Values in socio-environmental modelling: Persuasion for action or excuse for inaction. Environ. Model. Softw. 2014, 53, 207–212. [Google Scholar] [CrossRef] [Green Version]
  58. Rinderknecht, S.L.; Borsuk, M.E.; Reichert, P. Bridging uncertain and ambiguous knowledge with imprecise probabilities. Environ. Model. Softw. 2012, 36, 122–130. [Google Scholar] [CrossRef]
  59. Kletz, T.A. Accident reports may not tell us everything we need to know. J. Loss Prev. Process Ind. 2009, 22, 753–756. [Google Scholar] [CrossRef]
  60. Refsgaard, J.C.; van der Sluijs, J.P.; Hojberg, A.L.; Vanrolleghem, P.A. Uncertainty in the environmental modelling process—A framework and guidance. Environ. Model. Softw. 2007, 22, 1543–1556. [Google Scholar] [CrossRef]
  61. Crowl, D.; Louvar, J.F. Chemical Process Safety: Fundamentals With Applications; Prentice Hall: Upper Saddle River, NJ, USA, 2001. [Google Scholar]
  62. Hatakeyama, S.; Akimoto, H.; Washida, N. Effect of temperature on the formation of photochemical ozone in a propene NOX air irradiation system. Environ. Sci. Technol. 1991, 25, 1884–1890. [Google Scholar] [CrossRef]
  63. Wesely, M.L. Parameterisation of surface resistances to gaseous dry deposition in regional-scale numerical models. Atmos. Environ. 1989, 23, 1293–1304. [Google Scholar] [CrossRef]
  64. Gunasekera, M.; Edwards, D. Estimating the environmental impact of catastrophic chemical releases to the atmosphere an index method for ranking alternative chemical process routes. Process Saf. Environ. Protect. 2003, 81, 463–474. [Google Scholar] [CrossRef]
  65. Verschueren, K. Handbook of Environmental Data on Organic Chemicals; Van Nostrand Reinhold: New York, NY, USA, 1996. [Google Scholar]
  66. UNDSD. Indicators of Sustainable Development: Guidelines and Methodologies; The United Nations: New York, NY, USA, 2007. [Google Scholar]
  67. Borgonovo, E. Epistemic uncertainty in the ranking and categorization of probabilistic safety assessment model elements: Issuesand findings. Risk Anal. 2008, 28, 983–1001. [Google Scholar] [CrossRef]
  68. Whitmer, C.; Olson, W.; Sutherland, J. Determination of design effort distribution for an environmentally conscious product using a pairwise comparison approach. ASME IMECE—Manuf. Sci. Eng. 1995, MED 2-2, 847–853. [Google Scholar]
  69. Schmidt, I.; Meurer, M.; Saling, P.; Kicherer, A.; Reuter, W.; Gensch, C. SEEbalance: Managing sustainability of products and processes with the socio-eco-efficiency analysis by BASF. Greener Manag. Int. 2004, 45, 79–94. [Google Scholar]
  70. Tatari, O.; Kurmapu, D. Sustainability assessment of highways: A Malmquist index of US states. In Proceedings of the 2011 IEEE International Symposium on Sustainable Systems and Technology (ISSST), Chicago, IL, USA, 16–18 May 2011.
  71. Weiss, M.; Gmelin, T.; Sun, X.; Dzikus, N. Enhanced Assessment of the Air Transportation System. In Proceedings of the 11th AIAA-ATIO Conference, 20–22 September 2011; German Aerospace Center: Virginia Beach, VA, USA, 2011; Volume 11, p. 13. [Google Scholar]
  72. Shadiya, O.; High, K. Sustainability evaluator: Tool for evaluating process sustainability. Environ. Prog. Sustain. Energy 2013, 32, 749–761. [Google Scholar] [CrossRef]
  73. Burchart-Korol, D. Application of life cycle sustainability assessment and scocio-eco-efficiency analysis in comprehensive evaluation of sustainable development. J. Ecol. Health 2011, 15, 107–110. [Google Scholar]
  74. Uhlman, B.; Saling, P. Measuring and communicating sustainability through eco-efficiency analysis. Am. Inst. Chem. Eng. (AIChE) 2010, 106, 17–26. [Google Scholar]
  75. Li, G.; Yan, H.; Wang, S.; Xia, Y. Comparative analysis on value of information sharing in supply chains. Supply Chain Manag. Int. J. 2005, 10, 34–46. [Google Scholar] [CrossRef]
  76. Seuring, S. Assessing the rigor of case study research in supply chain management. Supply Chain Manag. Int. J. 2008, 13, 128–137. [Google Scholar] [CrossRef]
  77. Deng, H. Multicriteria analysis with fuzzy pairwise comparison. In Proceedings of the Fuzzy Systems Conference—FUZZ-IEEE’99, IEEE Internation, Seoul, Korea, 22–25 August 1999; Volume 2.

