Integration of Wind Energy, Hydrogen and Natural Gas Pipeline Systems to Meet Community and Transportation Energy Needs: A Parametric Study


Abstract
:1. Introduction
Benefits of Power-to-Gas (P2G) with Wind Turbine (WT) Systems
2. Background
2.1. Wind Farms
- CAN/CSA-F416-87, Wind Energy Conversion Systems (WECS): Safety, Design and Operation Criteria;
- CAN/CSA-F417-M91, Wind Energy Conversion Systems (WECS): Performance;
- CAN/CSA-F429-M90, Recommended Practice for the Installation of Wind Energy Conversion Systems; and
- CAN/CSA-F418-M91, Wind Energy Conversion Systems (WECS): Interconnection to the Electric Utility.
- CAN/CSA-C61400-11, Wind Turbine Generator Systems, Part 11: Acoustic Noise Measurement Techniques;
- CAN/CSA-C61400-12-1, Wind Turbines, Part 12-1: Power Performance Measurements of Electricity Producing Wind Turbines;
- CAN/CSA-C61400-24, Wind Turbine Generator Systems, Part 24: Lightning Protection;
- CAN/CSA-C61400-1, Wind Turbines, Part 1: Design Requirements;
- CAN/CSA-C61400-2, Wind Turbines, Part 2: Design Requirements for Small Wind Turbines.
2.2. Mitigation Strategies
2.3. Hydrogen
2.4. Hydrogen Markets and Transportation Options
2.5. Power-to-Gas (P2G)
2.6. Mixing Hydrogen with Natural Gas and Implications for Infrastructure
- It is in place and available immediately.
- It is well-established with existing grid management and operation strategies.
- It is widely spread out and interconnected.
- It has very high capacity, e.g., nearly three billion cubic feet per day in Ontario and Quebec [22].
- It has well-established safety procedures and an excellent safety record, based on a well-developed maintenance and control structure.
- It has broad acceptance by the public.
- (a)
- In the case of the E.ON project, it was shown that up to 10% hydrogen by volume can be injected into the pipeline [19].
- (b)
- Other studies show that depending on the pipe material, only up to 6% is allowable [26].
- (c)
- In ICEs, the addition of a small amount of hydrogen to natural gas (5%–30% by volume) leads to many advantages, due to physical and chemical properties [27].
- (d)
- Below about 20% of hydrogen in natural gas, hydrogen has no adverse effect on natural gas combustion characteristics and renders the fuel cleaner burning [1].
2.7. Methanation
3. Problem Formulation and Analysis
3.1. Straw Man Model

| Parameter | Description | Units | Min. | Max. | Normal |
|---|---|---|---|---|---|
| P1 | Wind farm (WF) size | MW | 25 | 200 | variable |
| P2 | Maximum feed factor (input power to electrolyser as a % of WF size) | % | 25 | 100 | 50 |
| P3 | Average wind energy produced by WF (as a % of total size) | % | 10 | 60 | 30 |
| P4 | Battery feed rate (to provide short-term operational requirements of the electrolyser, as a % of electrolyser size) | % | 10 | 100 | 30 |
| P5 | Electrolyser full load supply duration | min | 10 | 60 | 30 |
| P6 | Battery charge range (% max charge–% min charge) | % | 50 | 90 | 70 |
| P7 | Battery efficiency | % | 80 | 95 | 90 |
| P8 | Battery utilization (percentage of daily energy produced by WF) | % | 5 | 30 | 25 |
| P9 | WF controller efficiency | % | 90 | 99 | 98 |
| P10 | WF transformer efficiency | % | 80 | 98 | 95 |
| P11 | Electrolyser rectifier efficiency | % | 70 | 95 | 85 |
| P12 | Electrolyser hydrogen losses from production | % | 5 | 20 | 10 |
| P13 | Hydrogen storage losses | % | 0 | 5 | 2 |
| P14 | Power to run hydrogen handling and metering system | kWh/day | 5 | 50 | 12 |
| P15 | Power to run hydrogen dispensing unit | kWh/day | 5 | 50 | 12 |
| P16 | Power to run water management system | kWh/m3 of H2 | 0.0001 | 0.001 | 0.0005 |
| P17 | Cost of water | $/m3 | 0.0001 | 0.001 | 0.0005 |
| P18 | Electrolyser maintenance cost | $/kg | 0.00001 | 0.0005 | 0.0001 |
| P19 | Compressor, purification and storage system maintenance cost | $/kg of H2 | 0.01 | 0.05 | 0.03 |
| P20 | Water management system maintenance cost | $/m3 | 0.00001 | 0.0005 | 0.0001 |
| P21 | Electricity cost | $/kWh | 0 | 0.12 | 0.00 |
| P22 | Natural gas cost | $/m3 | 0 | 0.325 | 0.12 |

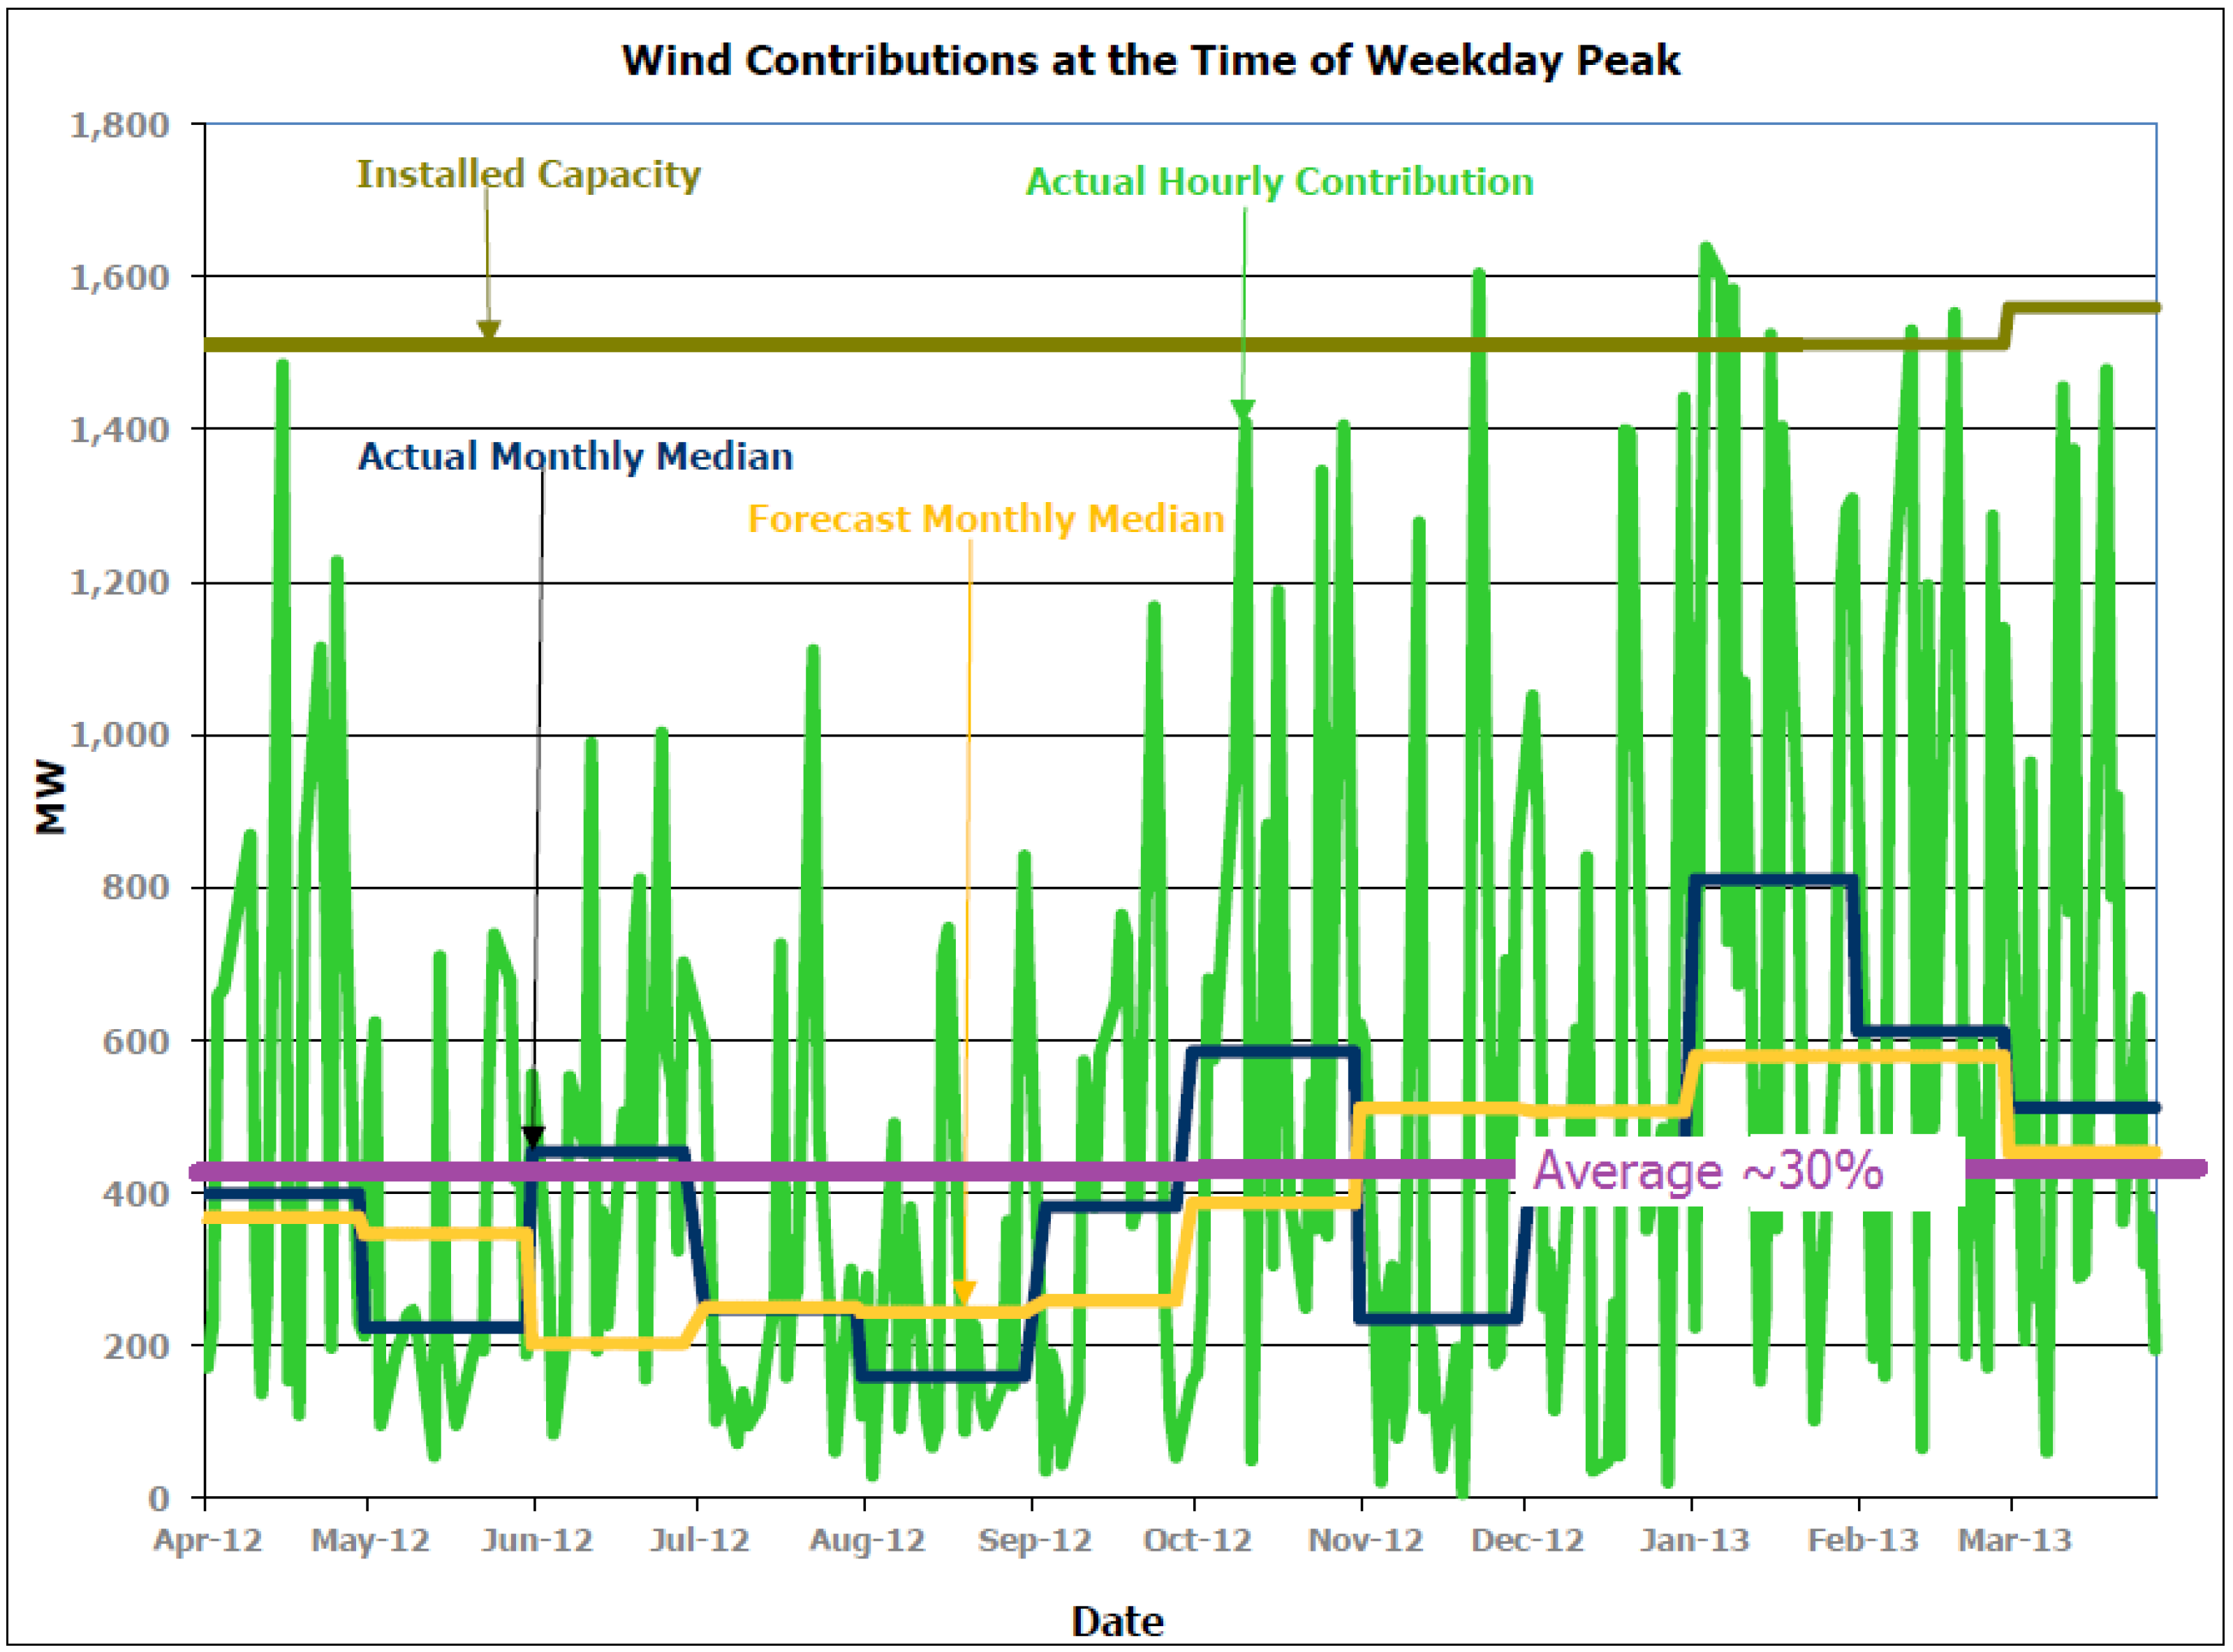
| Date | Actual monthly median power level (MW) |
|---|---|
| April 2012 | 400 |
| May 2012 | 220 |
| June 2012 | 450 |
| July 2012 | 250 |
| August 2012 | 180 |
| September 2012 | 390 |
| October 2012 | 590 |
| November 2012 | 220 |
| December 2012 | 440 |
| January 2013 | 800 |
| February 2013 | 600 |
| March 2013 | 500 |
| Average wind power generation level over the year | 420 |
| Total installed wind power generation capacity | 1500 |
| % of average wind power generation level compared to total installed wind power generation capacity | ~30% |
3.2. Sensitivity Analysis
- Testing the robustness of the model’s results;
- Understanding relationships between input and output variables in a model;
- Identifying model inputs that cause significant uncertainty in the output;
- Simplifying the model; inputs that have little or no effect can be removed.
4. Results and Discussion
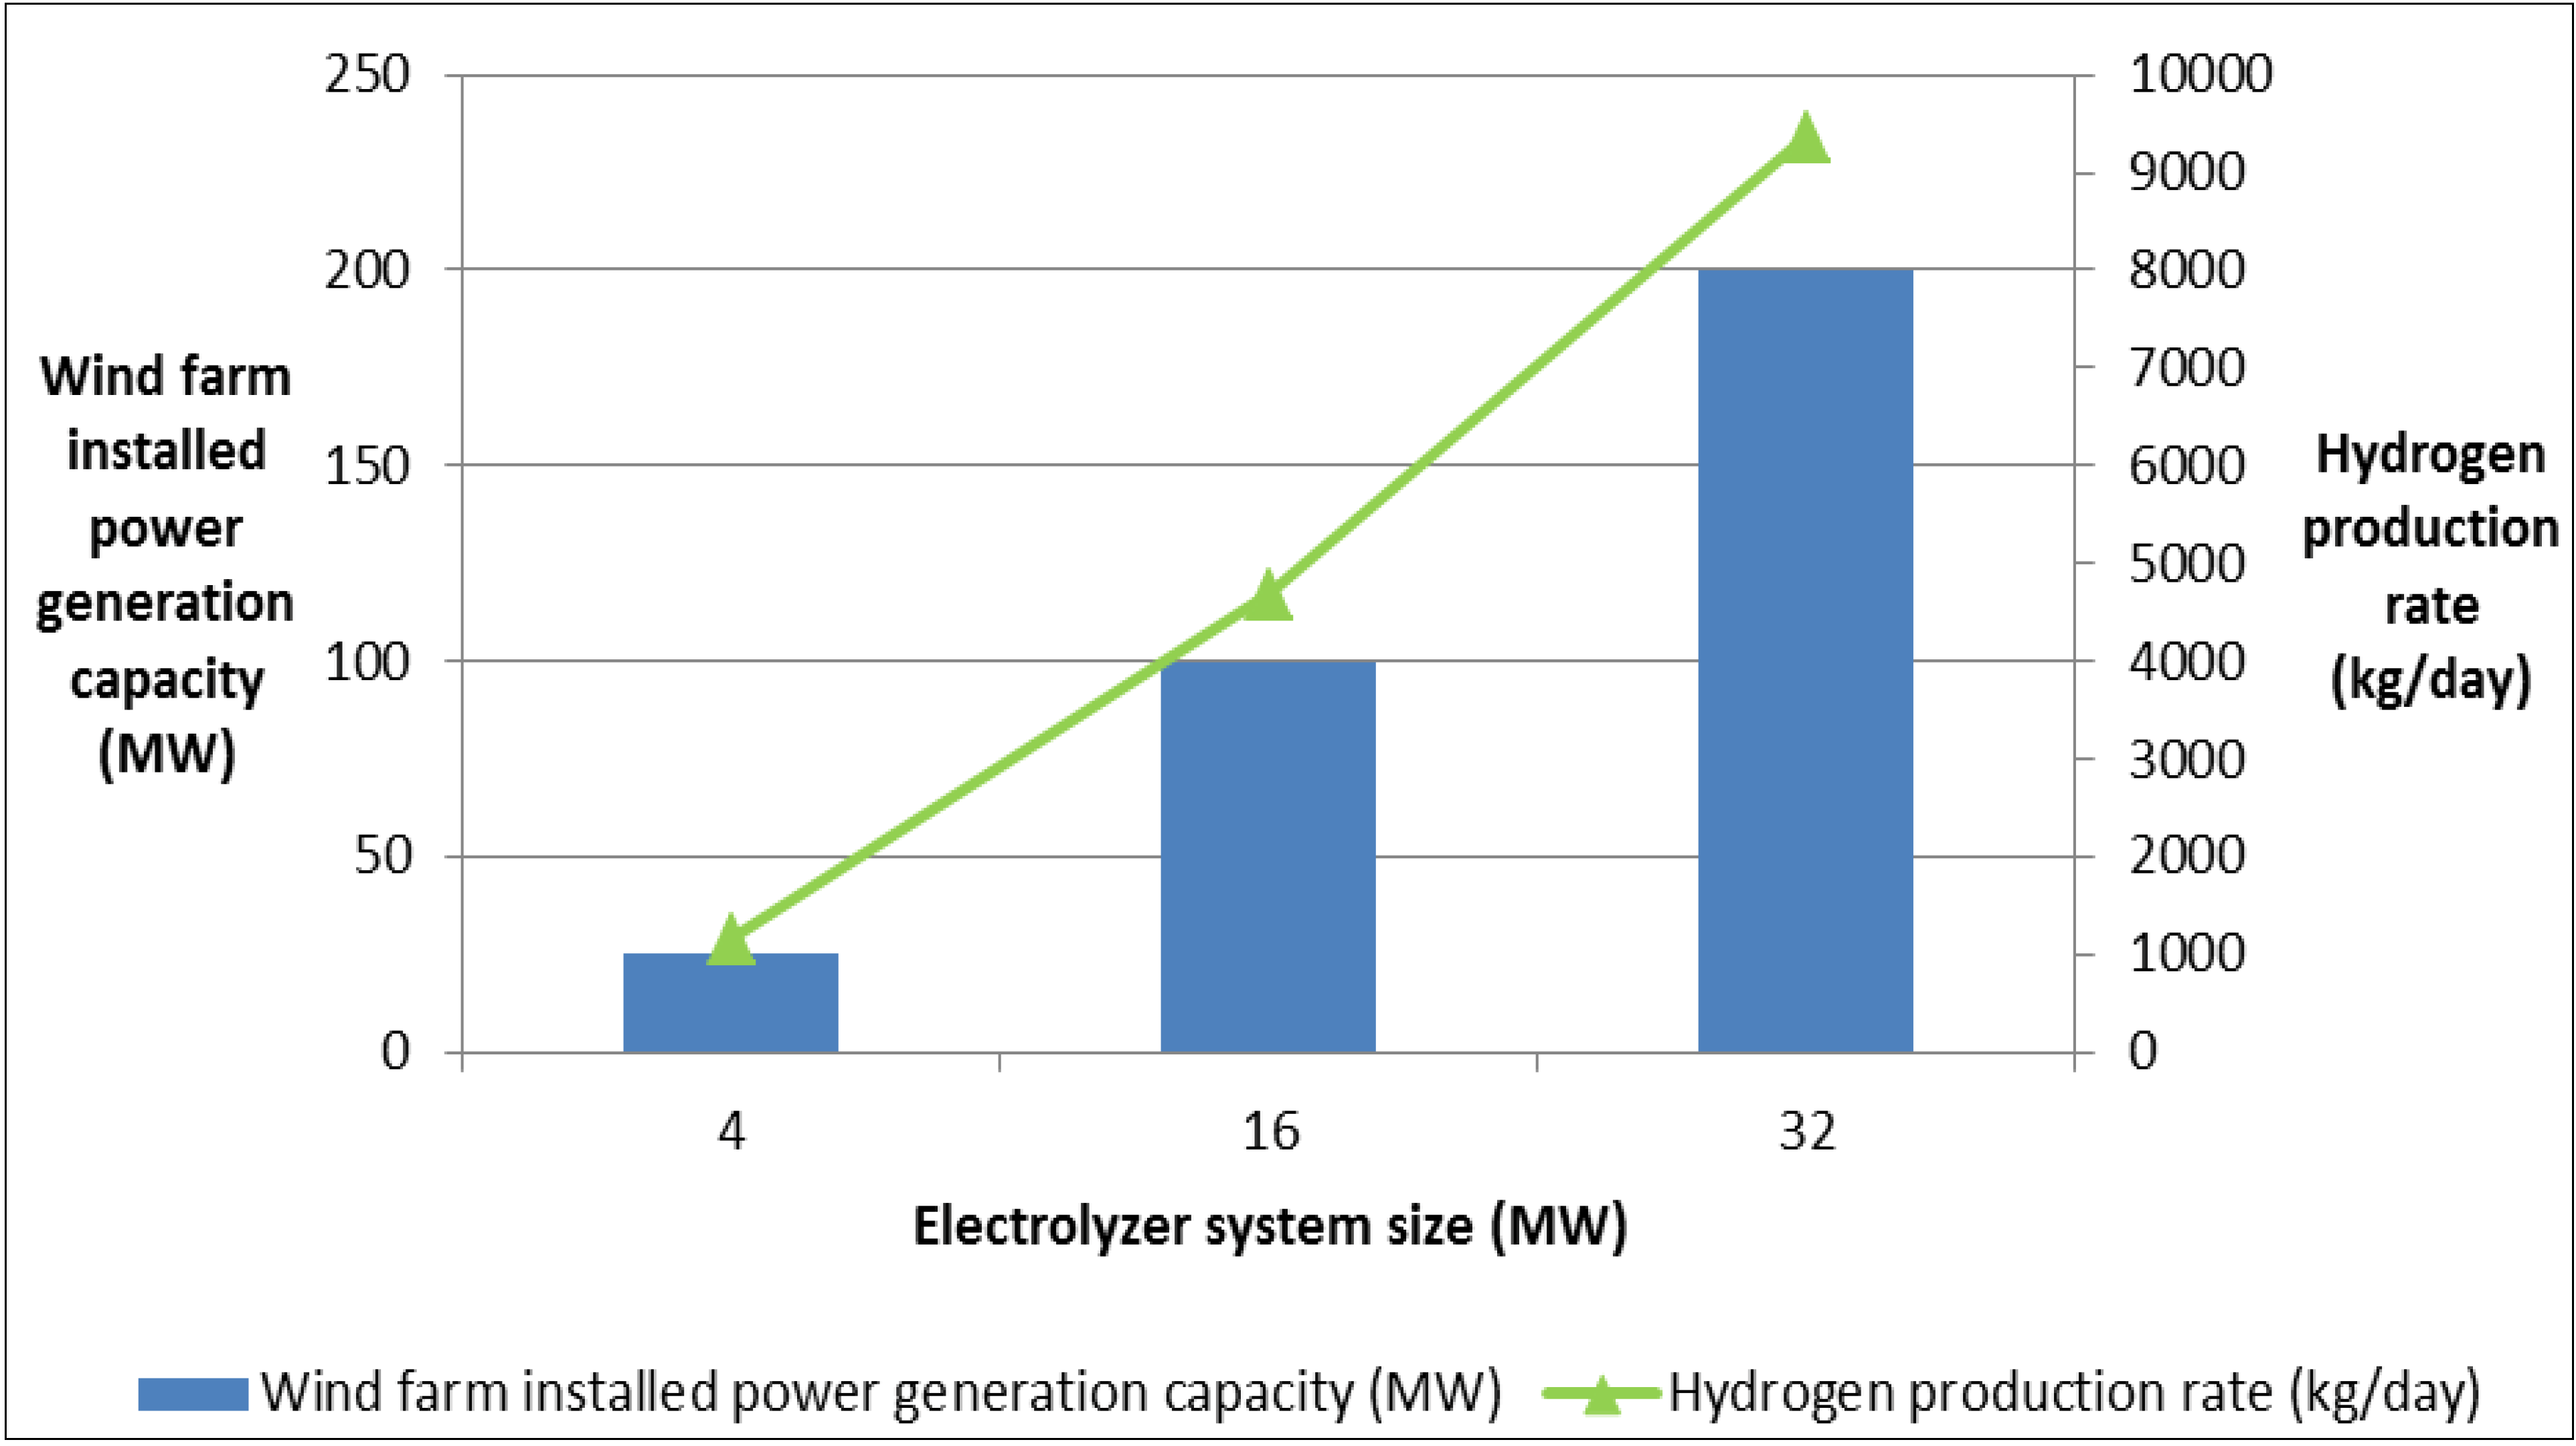
| Wind farm installed power generation capacity (MW) | Maximum energy available (MEA) (MWh/day) | Electrolysis system capacity (MW) | Daily rate of hydrogen production (kg/day) | Hourly rate of hydrogen production (kg/h) | Electrolyser energy consumption rate (EER) (MWh/day) |
|---|---|---|---|---|---|
| 25 | 99 | 4 | 1157 | 48.2 | 81 |
| 100 | 396 | 16 | 4672 | 194.7 | 327 |
| 200 | 792 | 32 | 9360 | 389.9 | 655 |

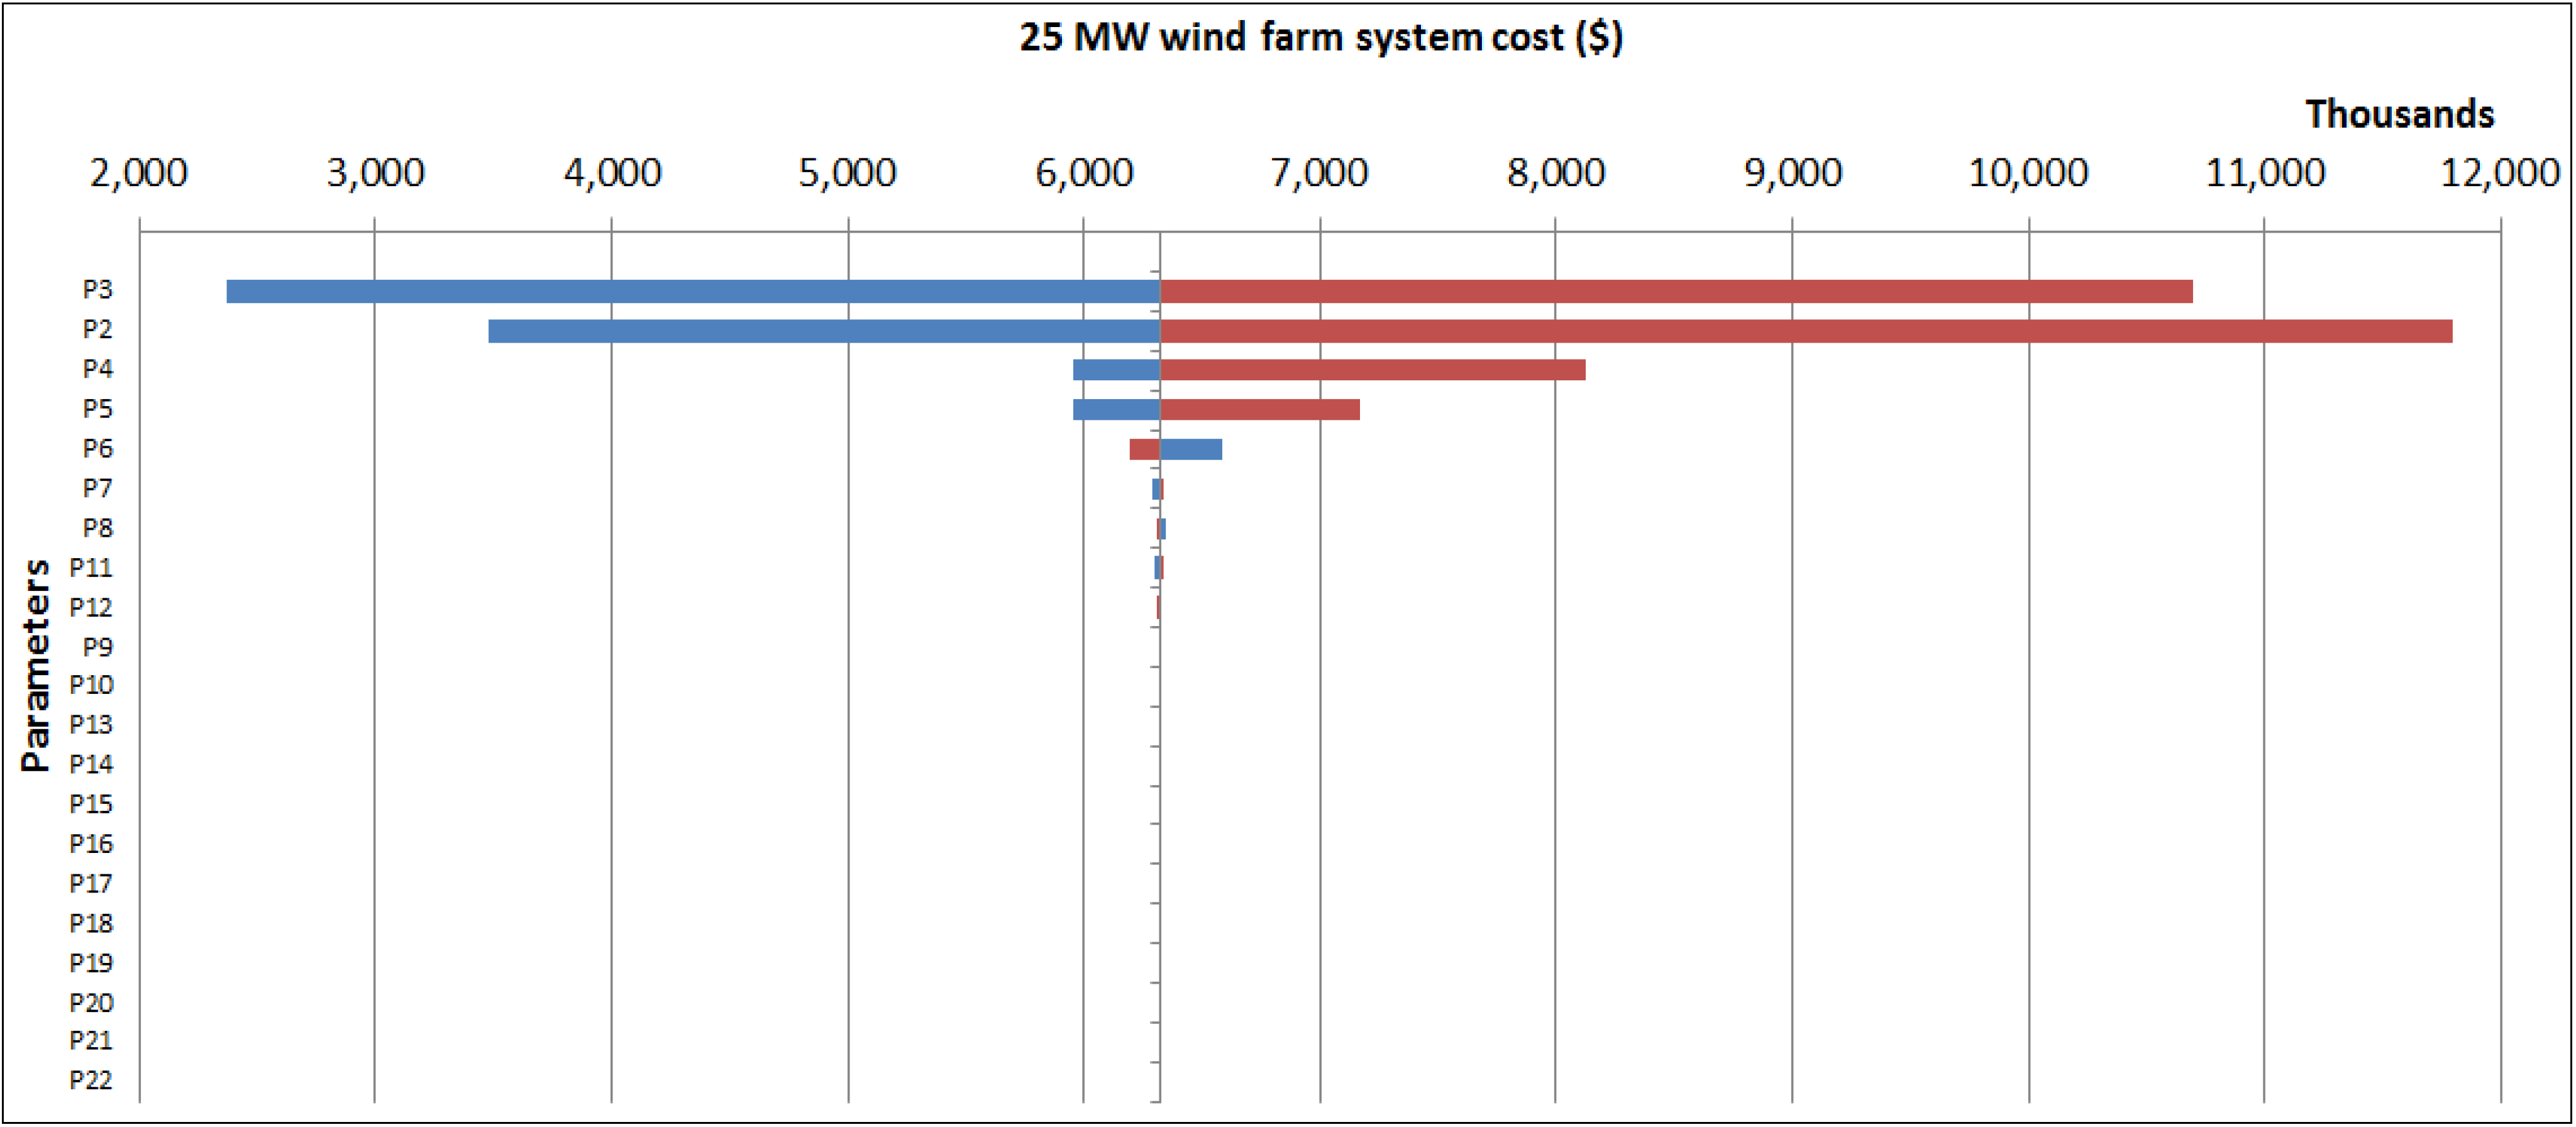
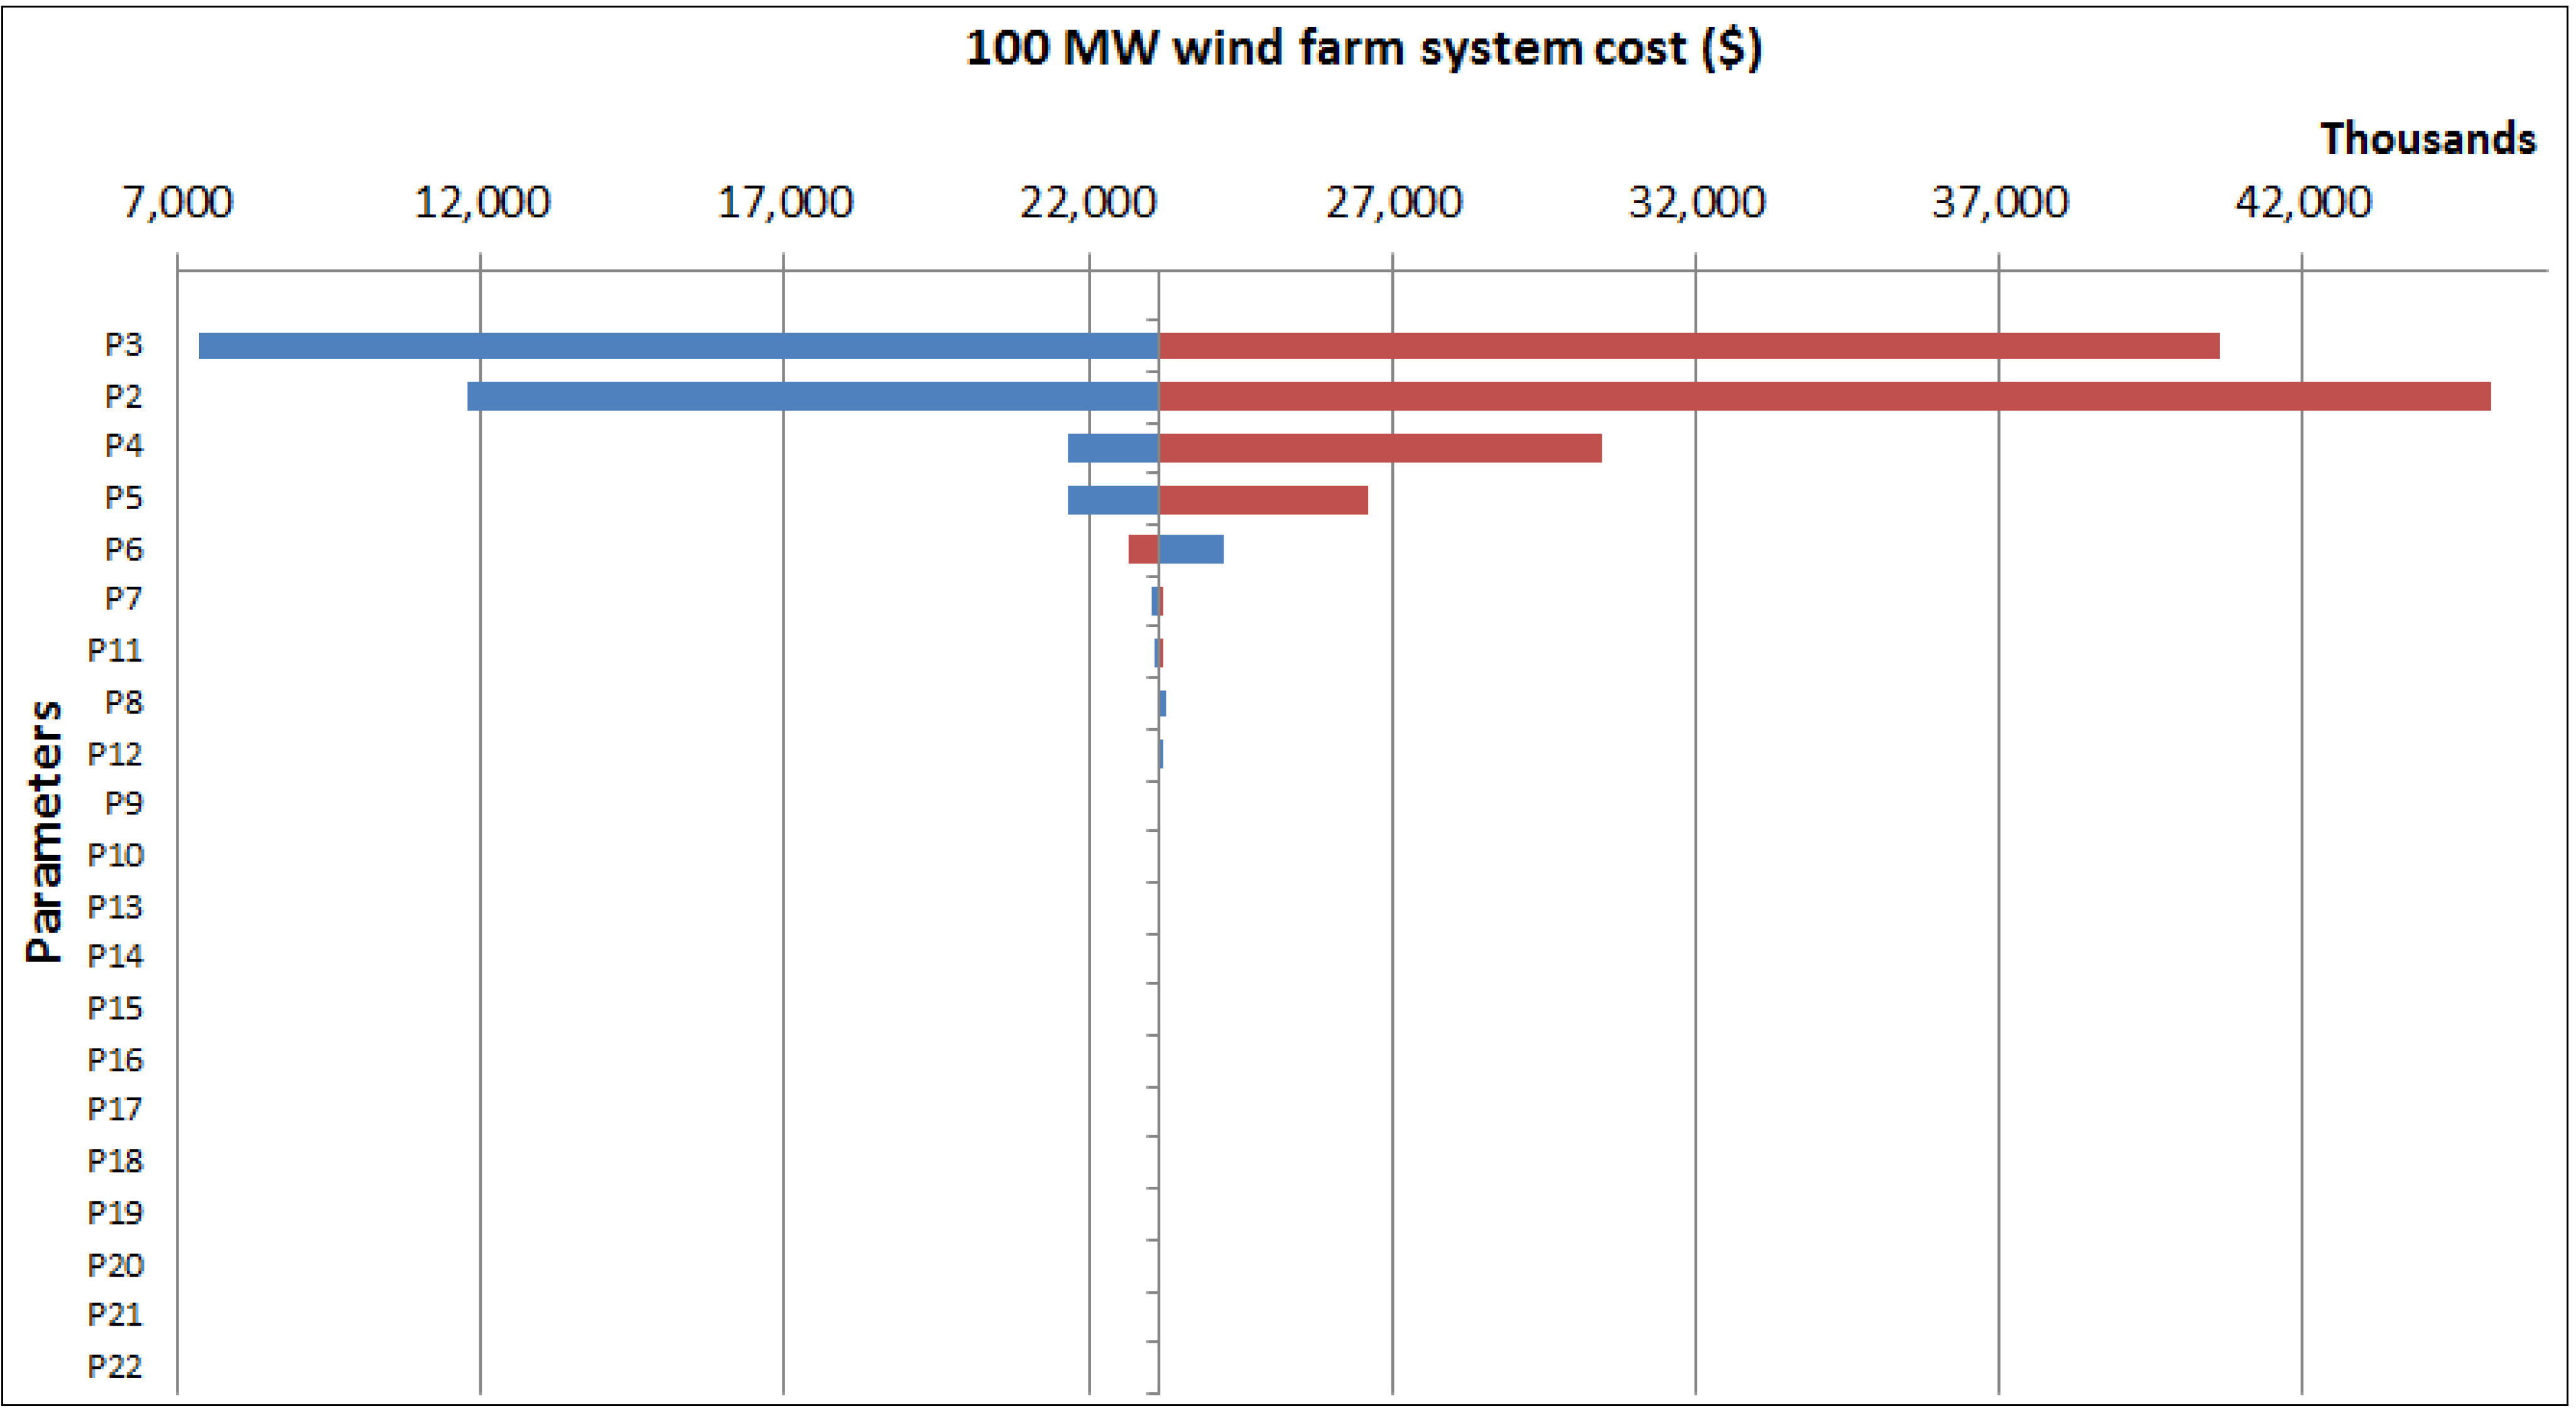
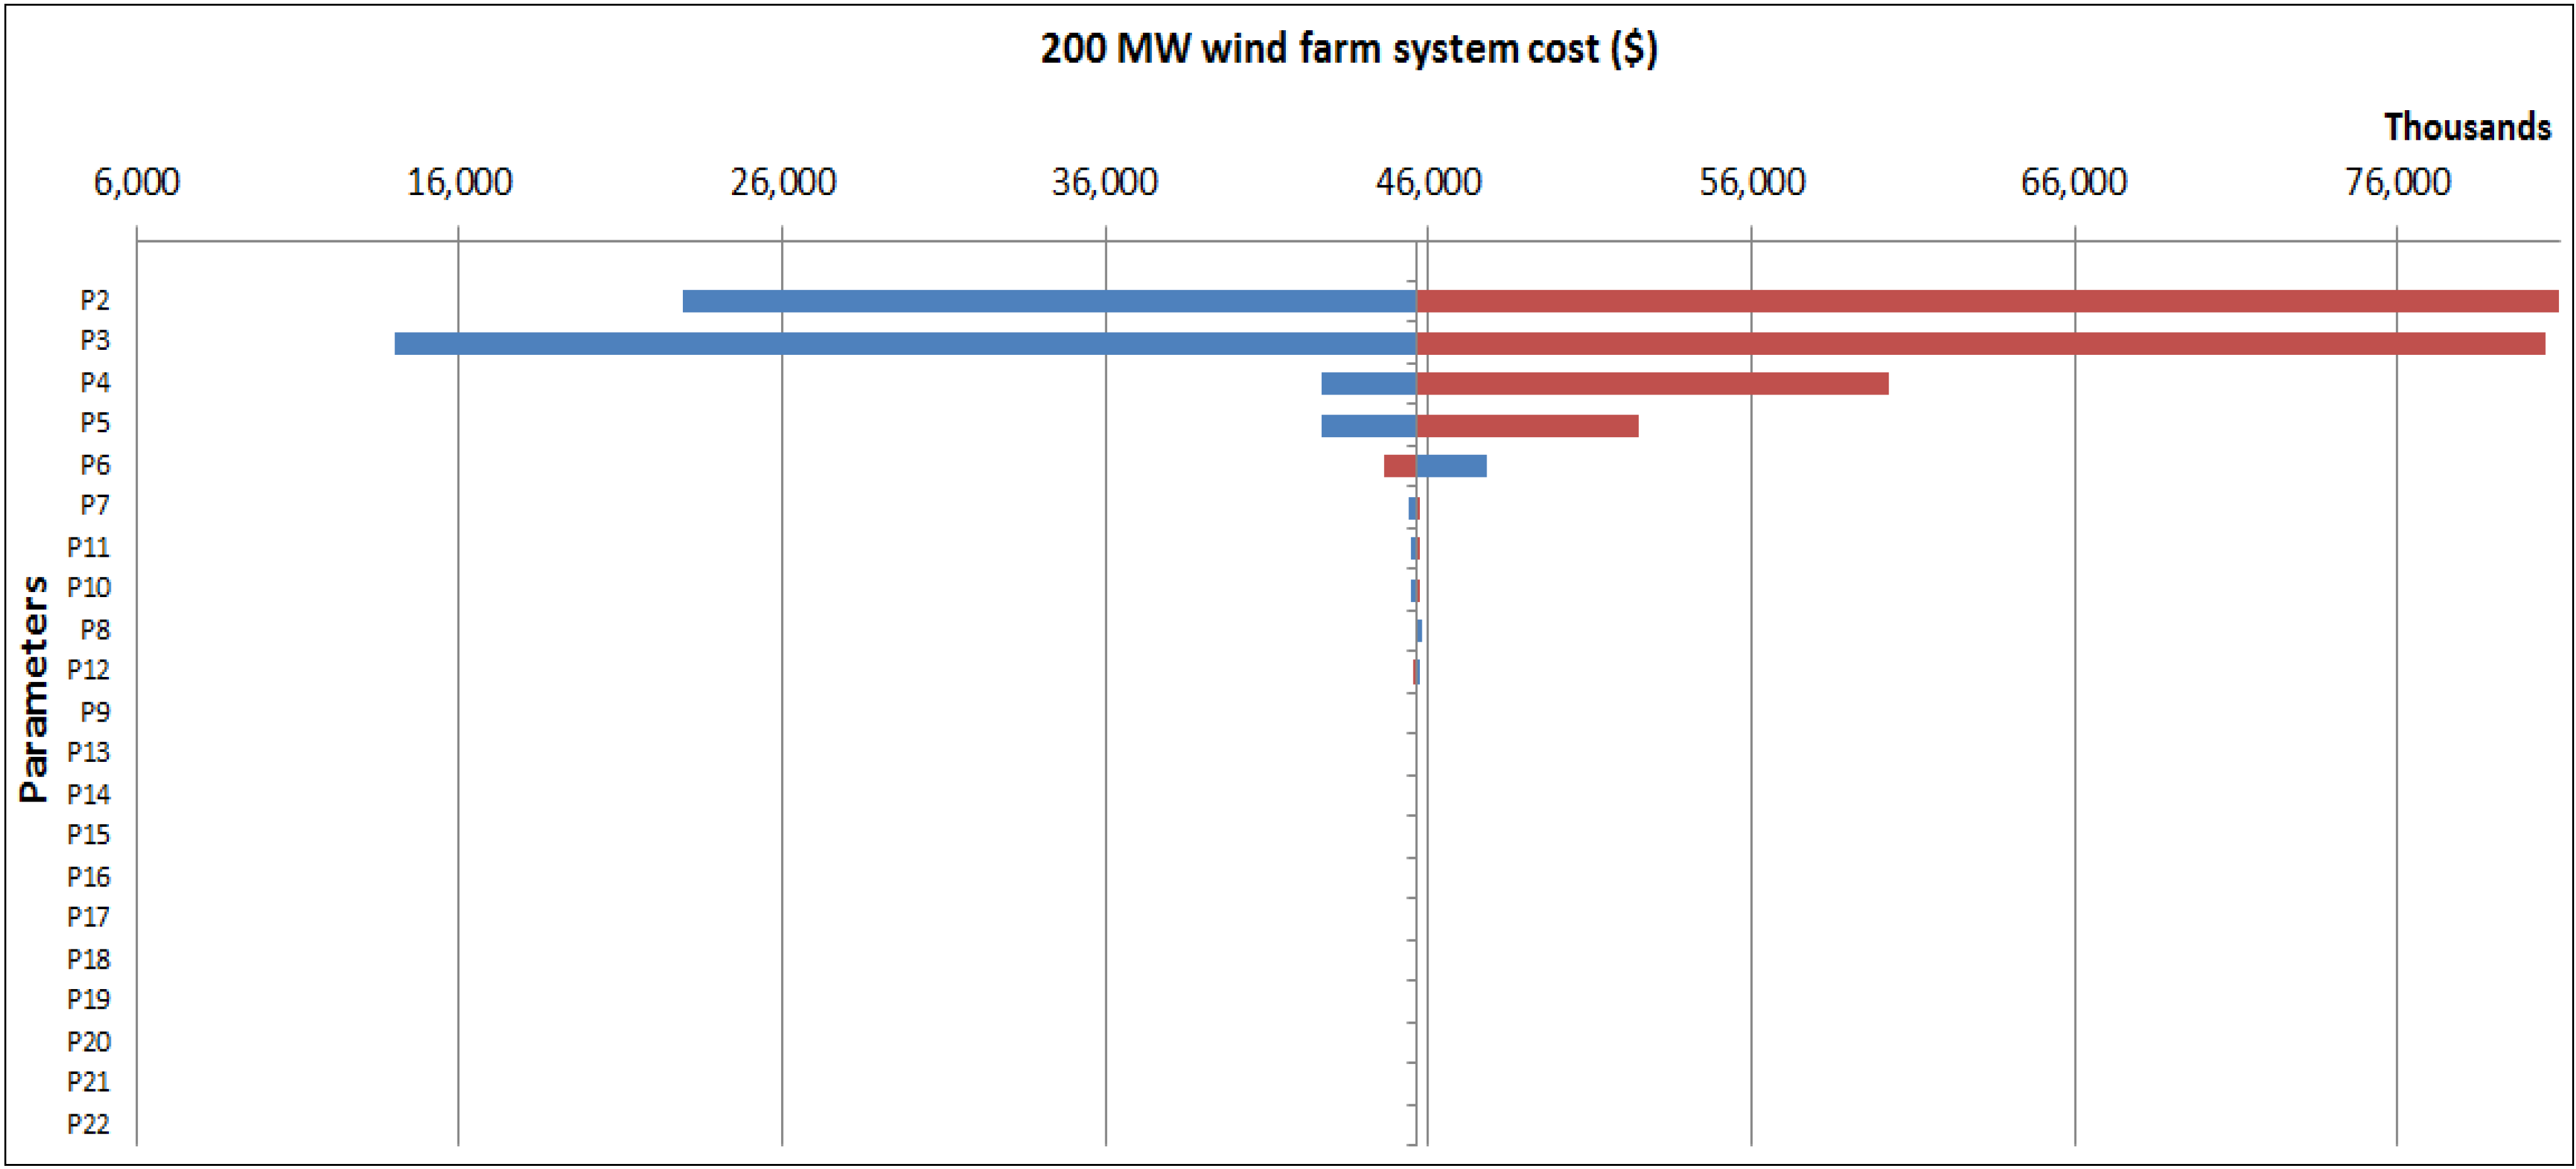
4.1. System Costs and Sensitivity Analysis
- P3, average energy produced by the wind farm;
- P2, maximum feed factor;
- P4, battery feed rate;
- P5, electrolyser full load supply duration;
- P6, battery charge range.


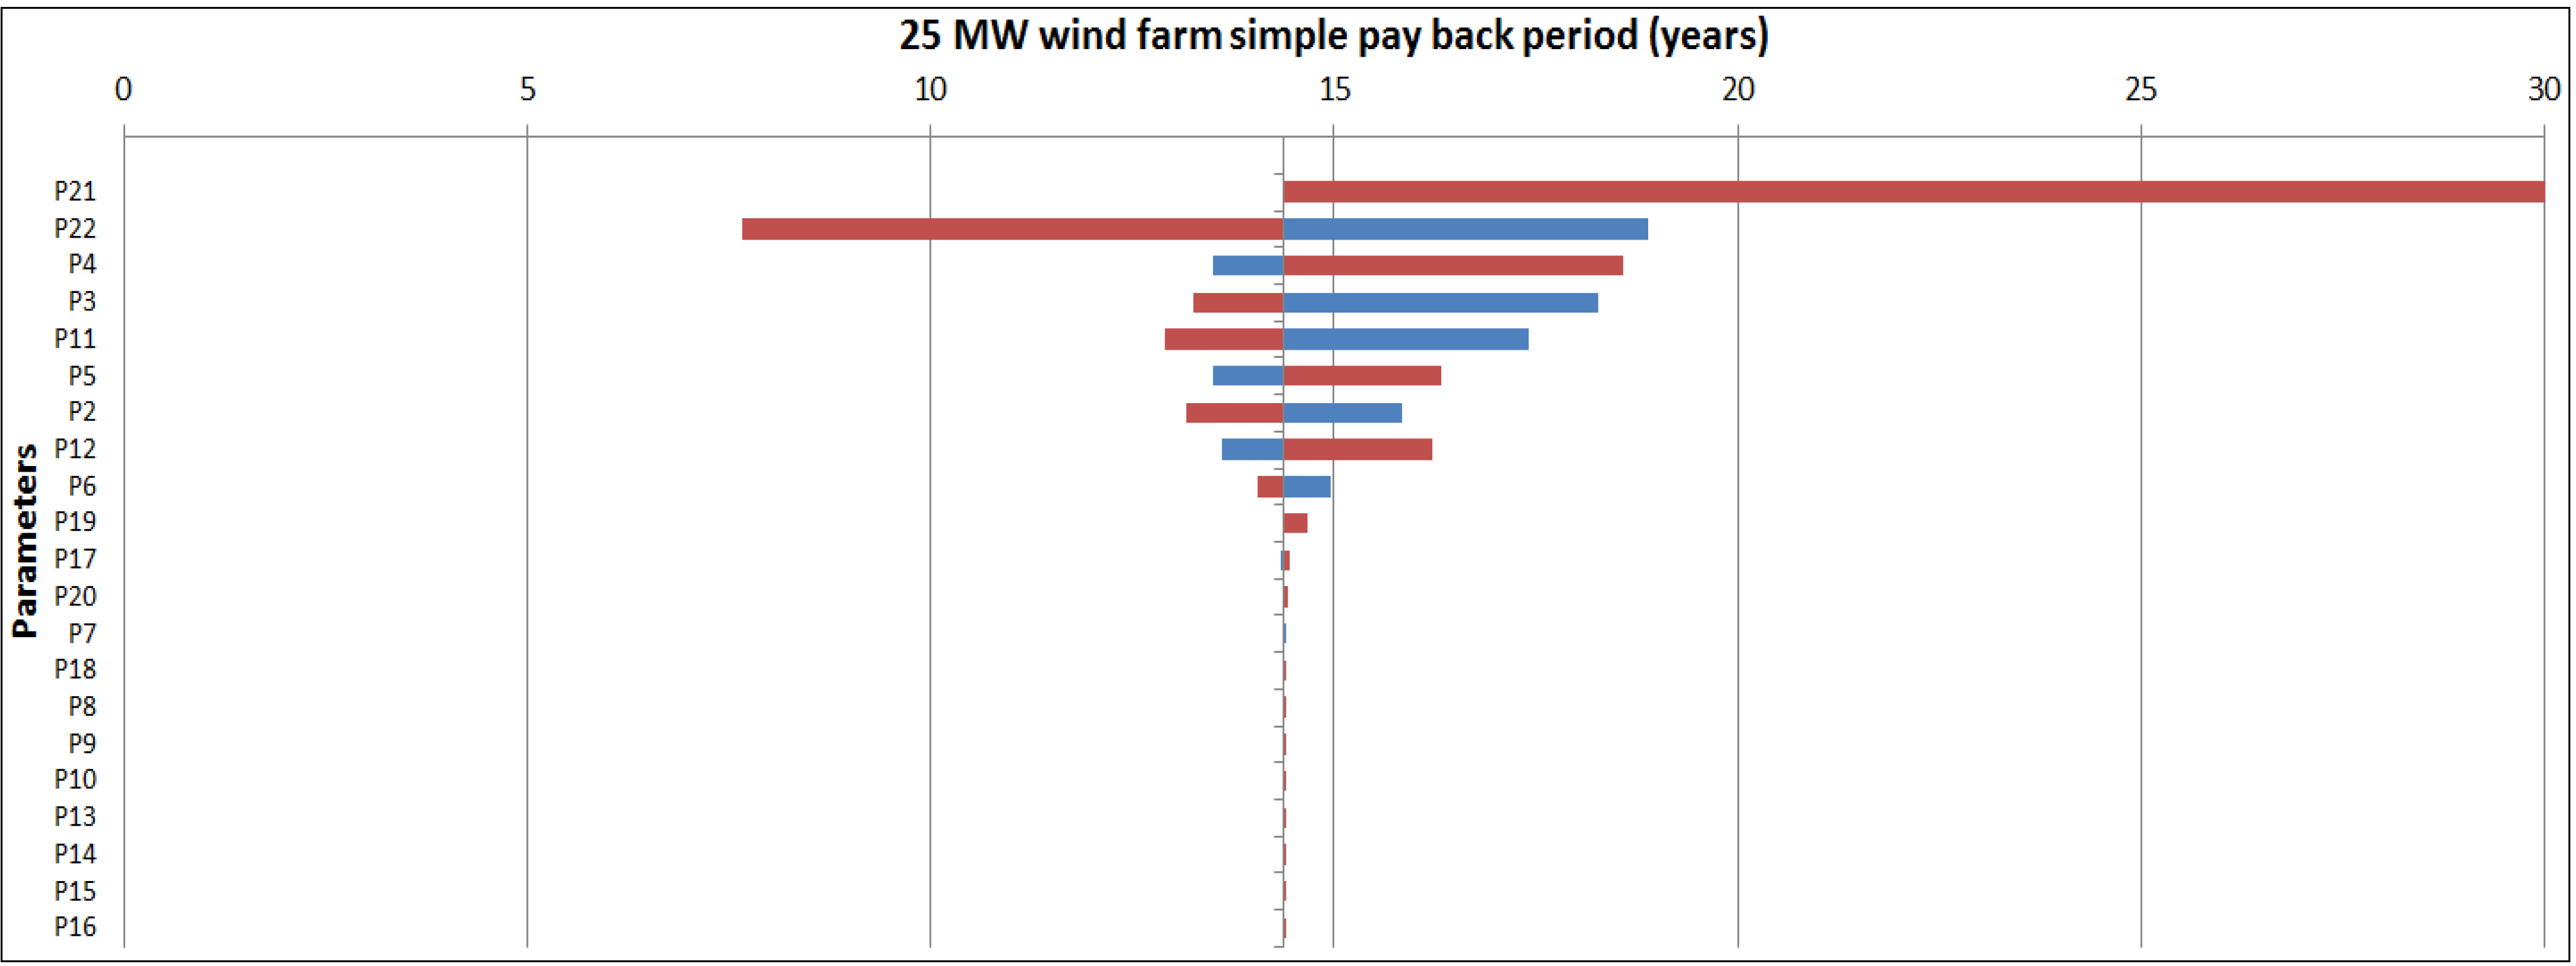
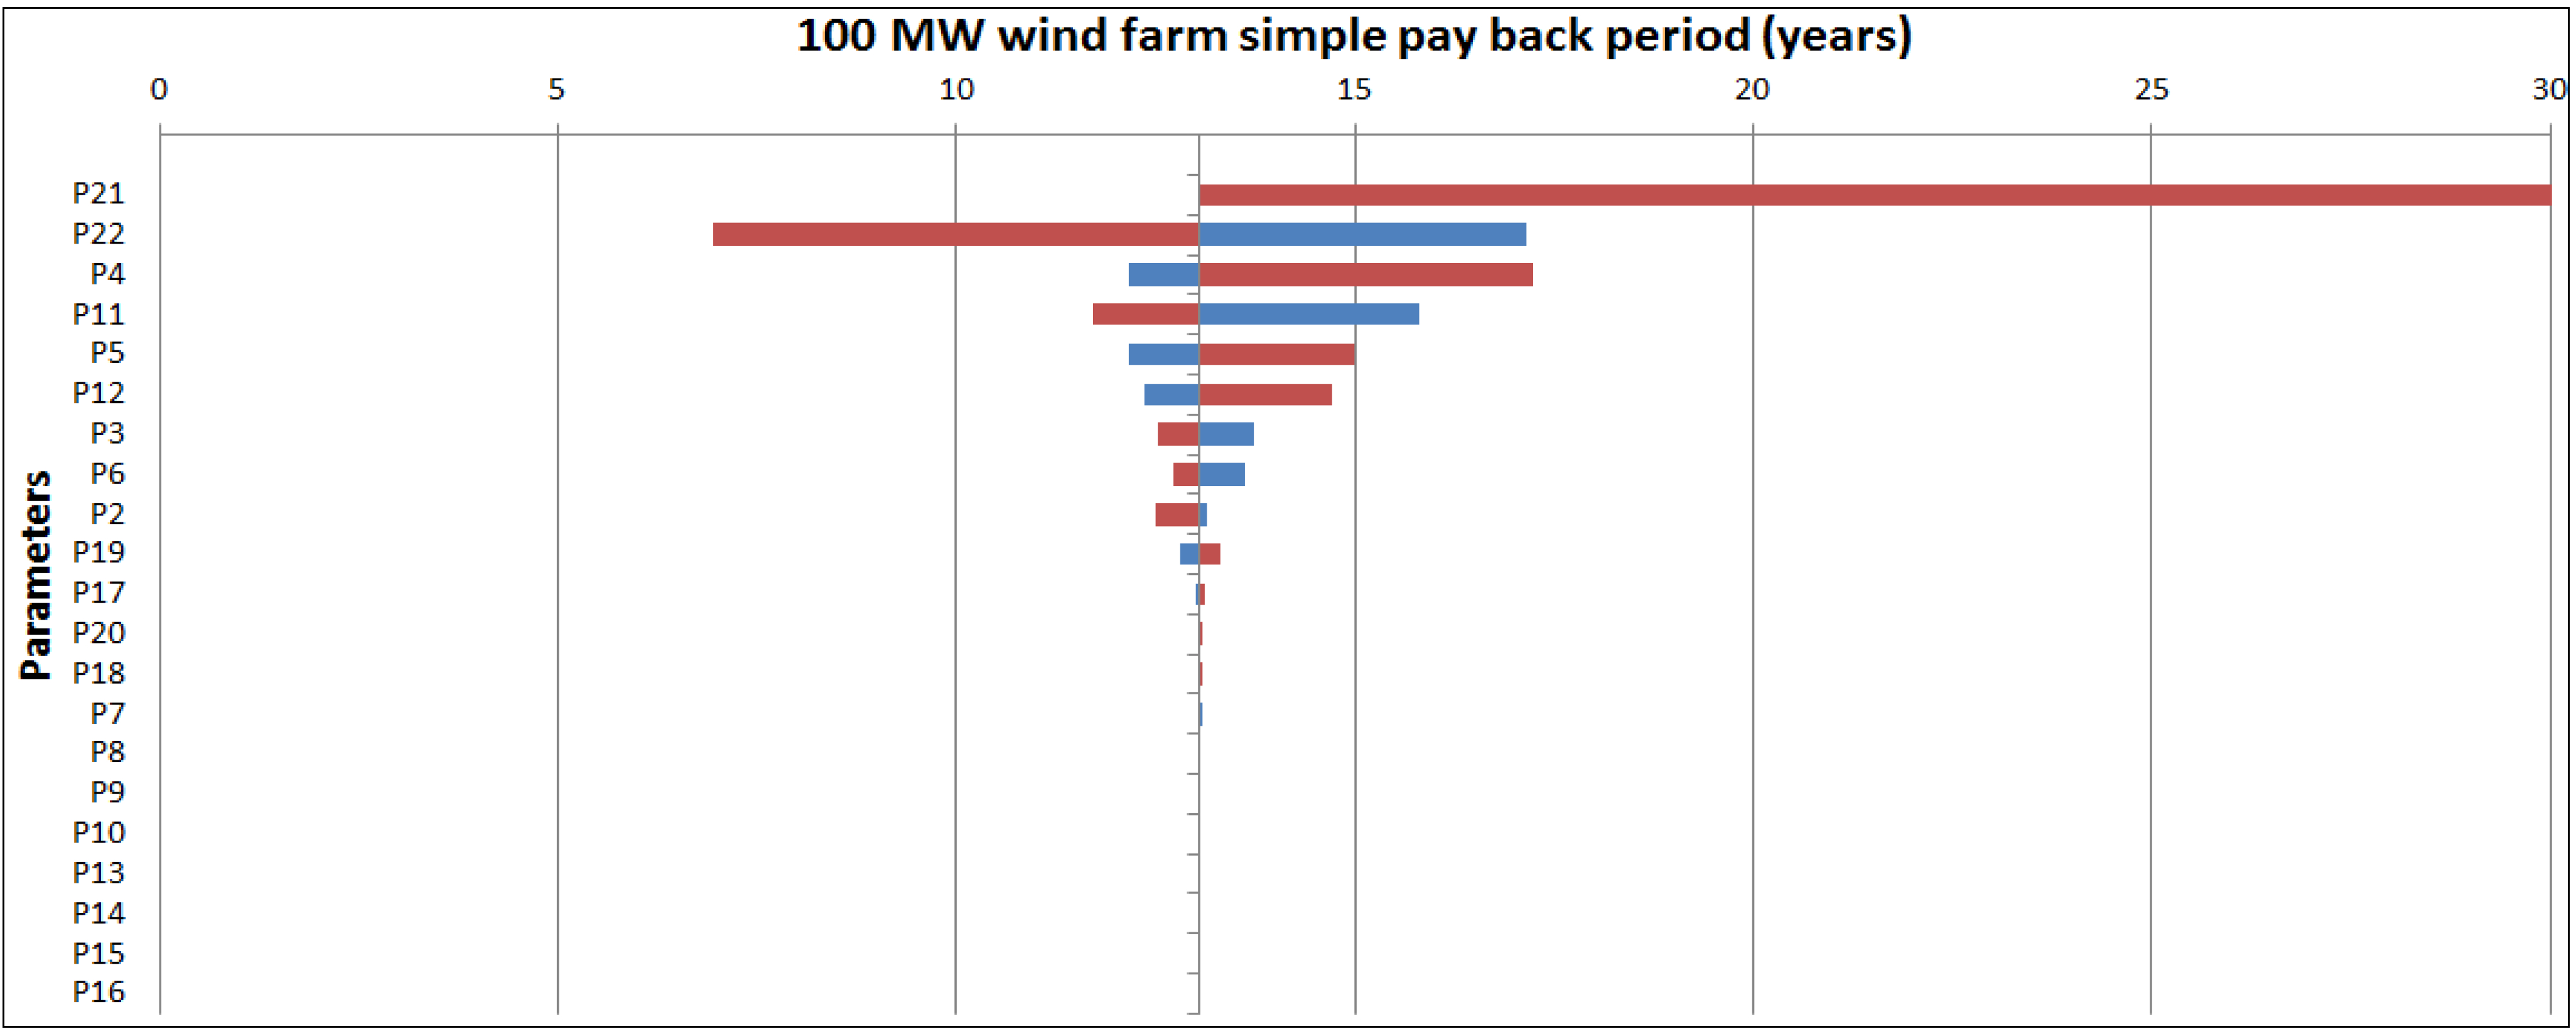
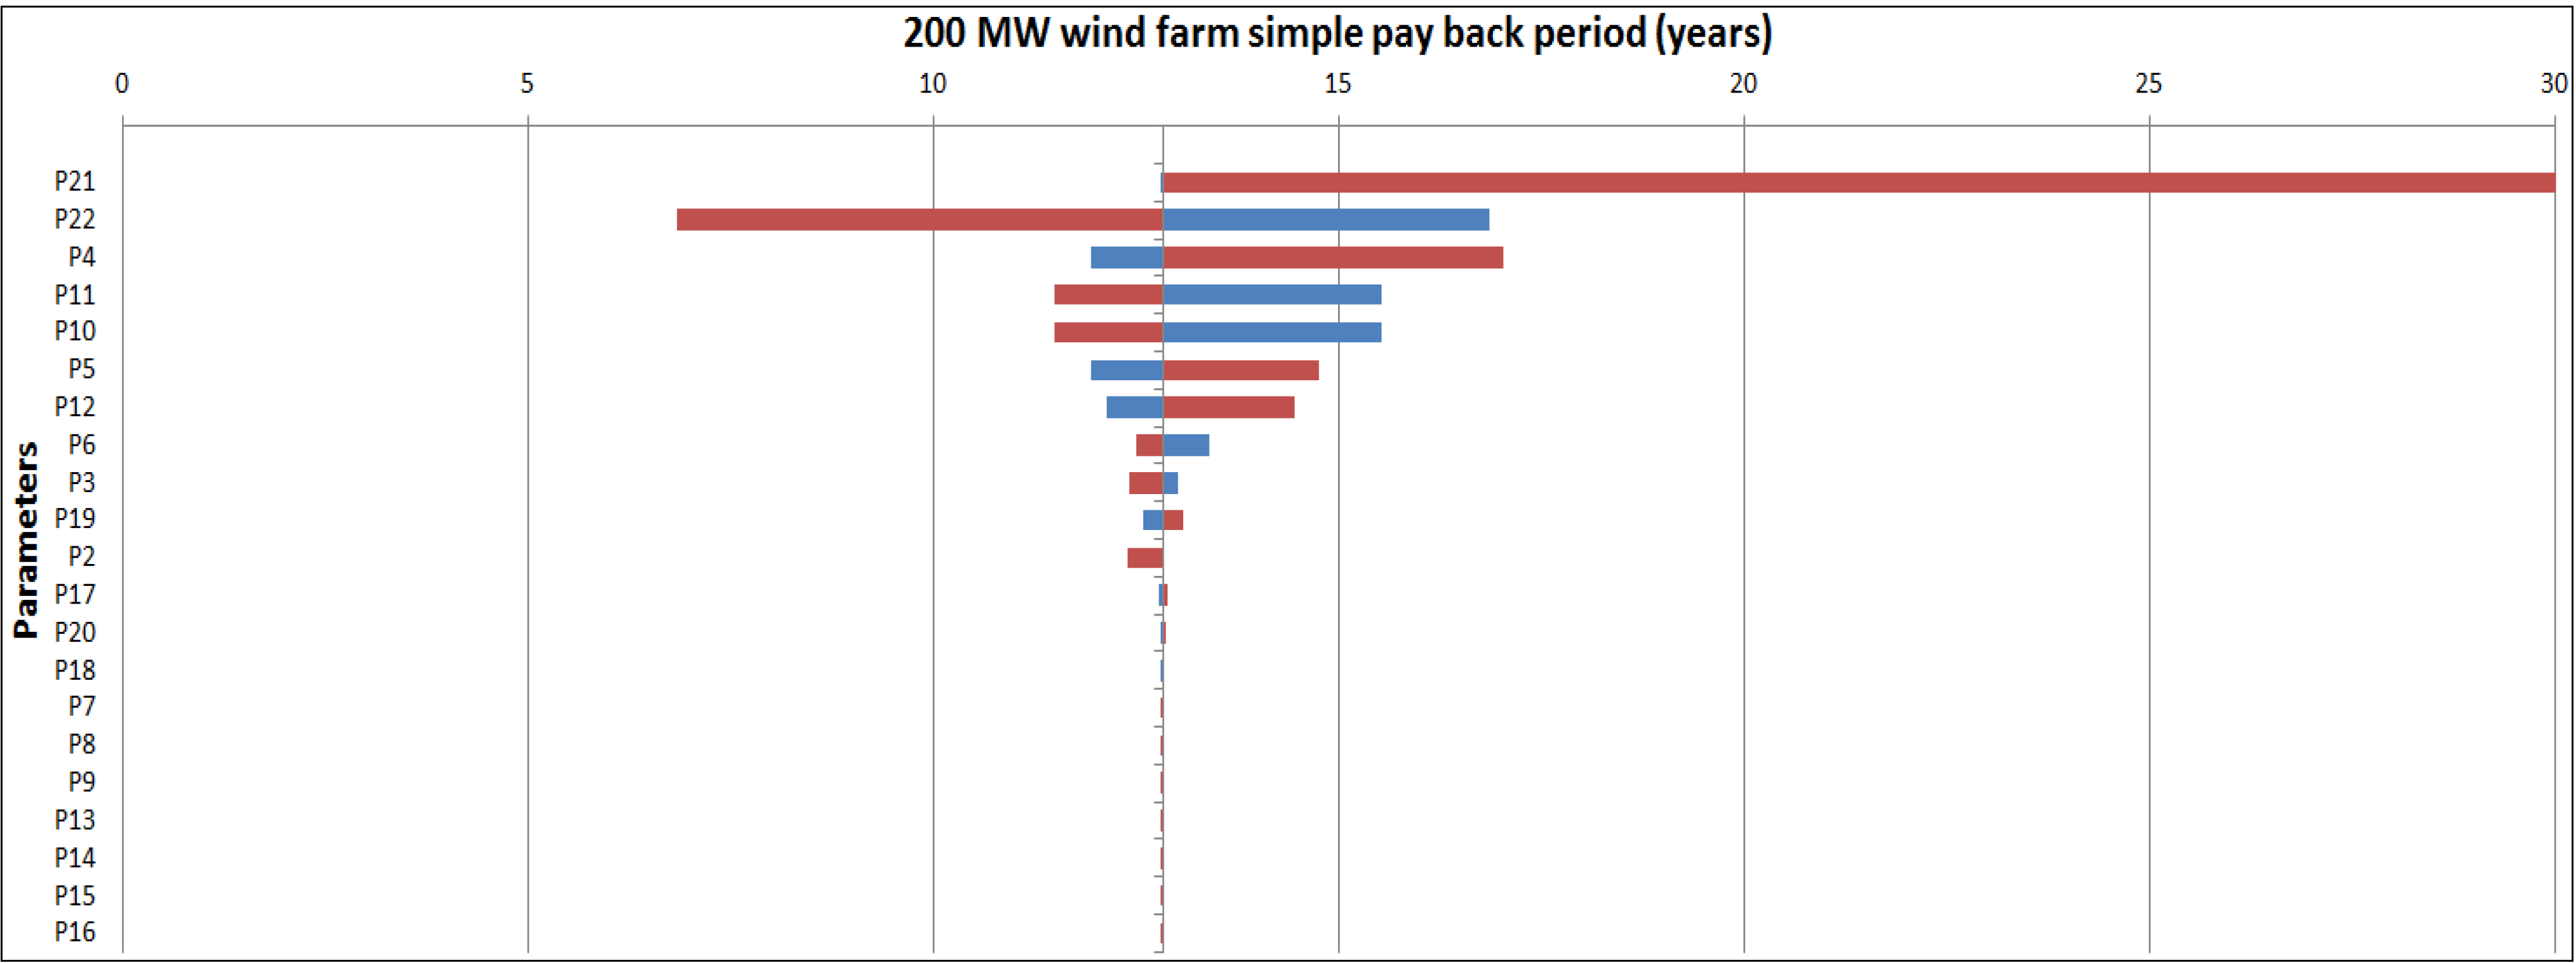
- P21, electricity cost;
- P22, natural gas cost;
- P4, battery feed rate;
- P3, average wind energy produced by wind farm;
- P11, electrolyser rectifier efficiency;
- P5, electrolyser full load supply duration;
- P2, maximum feed factor (to electrolyser);
- P12, electrolyser hydrogen losses from production;
- P6, battery charge range.


5. Conclusions
Acknowledgments
Author Contributions
Conflicts of Interest
References
- Kippers, M.J.; de Laat, J.C.; Hermkens, R.J.M. Pilot Project on Hydrogen Injection in Natural Gas on Island of Ameland in the Netherlands. In Paper presented at the International Gas Union Research Conference, Seoul, South Korea, 19 October 2011.
- Fthenakis, V.; Kim, H.C. Land use and electricity generation: A life-cycle analysis. Renew. Sustain. Energ. Rev. 2009, 13, 6–7. [Google Scholar]
- Castello, P.; Tzimas, E.; Moretto, P.; Peteves, S. Techno-Economic Assessment of Hydrogen Transmission & Distribution Systems in Europe in the Medium and Long Term; The Institute for Energy: Petten, The Netherlands, 2005. [Google Scholar]
- Teacher Geek. Type of Wind Turbines. Available online: http://www.teachergeek.org/wind_turbine_types.pdf (accessed on 2 July 2013).
- Meyers, B. Types of Wind Turbines. Available online: http://centurionenergy.net/types-of-wind-turbines (accessed on 5 July 2013).
- Hau, E. Wind Turbines: Fundamentals, Technologies, Application, Economics, 3rd ed.; Springer: Munich, Germany, 2013; p. 830. [Google Scholar]
- Canadian Wind Energy Association (CANWEA). Powering Canada’s Future. Available online: http://www.canwea.ca/pdf/Canada%20Current%20Installed%20Capacity_e.pdf (accessed on 20 June 2013).
- Independent Electricity System Operator (IESO). Ontario Renewable Energy (Grid Connected). Available online: http://www.ieso.ca/map/index.html (accessed on 24 April 2014).
- Jha, A.R. Wind Turbine Technology; CRC Press, Taylor and Francis Group: Boca Raton, FL, USA, 2011; pp. 238–240. [Google Scholar]
- Canadian Standards Association (CSA). CSA Guide to Canadian Wind Turbine Codes and Standards. Available online: http://www.csagroup.org/documents/codes-and-standards/standards/energy/CSAGuidetoCanadianWindTurbineCodes.pdf (accessed on 20 March 2014).
- Interseasonal Heat Transfer ICAX. Thermal Energy Storage—Seasonal Thermal Energy Storage using ThermalBanks™. Available online: http://www.icax.co.uk/thermal_energy_storage.html (accessed on 14 July 2013).
- Carmo, M.; Fritz, D.; Mergel, J.; Stolten, D. A comprehensive review on PEM water electrolysis. Int. J. Hydrogen Energ. 2013, 38, 4901–4934. [Google Scholar] [CrossRef]
- Pressure Chemical Company. Catalytic Hydrogenation Processes. Available online: http://www.presschem.com/hydrogenation.htm?sub_id=3 (accessed on 14 June 2013).
- Bromaghim, G.; Gibeault, K.; Serfass, J.; Serfass, P.; Wagner, E. Hydrogen and Fuel Cells: The U.S. Market Report. Available online: http://www.ttcorp.com/pdf/marketReport.pdf (accessed on 23 July 2013).
- Tubb, R. 2012 Pipeline Construction Report. Available online: http://www.undergroundconstructionmagazine.com/2012-pipeline-construction-report (accessed on 25 July 2013).
- Smith, R. Pipeline-on-Wheels: Sustainability for Off-Pipeline High Energy Operations. Presented at Bloom Sustainability Applied, Mississauga, ON, Canada, 1–2 October 2013; Available online: http://sustainabilityapplied.com/program.htm#panels-day2-pm (accessed on 6 February 2014).
- NATURALHY. A NATURALHY Project. Available online: https://www.coleurope.eu/content/studyprogrammes/eco/conferences/Files/Papers/Florisson_The_NATURALHY_Project.pdf (accessed on 24 April 2014).
- Ponec, V. Some aspects of the mechanism of methanation and Fischer-Tropsch synthesis. Catal. Rev. 1978, 18, 151–171. [Google Scholar] [CrossRef]
- Daily Fusion. Green Hydrogen Injected into Natural Gas System for the First Time. Available online: http://dailyfusion.net/2013/06/green-hydrogen-injected-into-natural-gas-system-for-the-first-time-11594 (accessed on 25 July 2013).
- E.ON, Power-to-Gas Unit Injects Hydrogen into Natural Gas System for First Time. Available online: http://www.eon.com/en/media/news/press-releases/2013/6/13/power-to-gas-unit-injects-hydrogen-into-natural-gas-system-for-f.html (accessed on 15 July 2013).
- GlobeNewswire. Photo Release—E.ON and Swissgas Begin Commercial Operations at Power-to-Gas Facility in Germany Using Hydrogenics Technology. Available online: http://globenewswire.com/news-release/2013/08/29/570028/10046484/en/Photo-Release-E-ON-and-Swissgas-Begin-Commercial-Operations-at-Power-to-Gas-Facility-in-Germany-Using-Hydrogenics-Technology.html (accessed on 3 October 2013).
- Energy Source Natural Gas. Midwest Route to Ontario New Threat to Western Gas. Available online: http://www.energysource.ca/our-company/latest-news-details.aspx?id=c33d3b3e-411e-4aa0-a6ec-f47ae22ed82d (accessed on 6 July 2013).
- Zhang, L.; Adey, R.A. Prediction of Third Party Damage Failure Frequency for Pipelines Transporting Mixtures of Natural Gas and Hydrogen. In Proceedings of the International Conference on Hydrogen Safety, Ajaccio-Corsica, France, 16–18 September 2009.
- World Energy. Hydrogen-Enriched Natural Gas Bridge to an Ultra-Low Carbon World. Paper by National Grid and Atlantic Hydrogen Inc. for Gas Industry Executives, Utility Regulators, Policy Makers and Energy Administrators. Available online: http://www.worldenergy.org/documents/congresspapers/225.pdf (accessed on 3 August 2013).
- Amrouche, F.; Benzaoui, A.; Erickson, P.; Mahmah, B.; Herouadi, F.; Belhamel, M. Toward hydrogen enriched natural gas “HCNG” fuel on the Algerian road. Int. J. Hydrogen Energ. 2010, 36, 4094–4102. [Google Scholar]
- Hernandez-Rodriguez, G.; Pibouleau, L.; Azzaro-Pantel, C.; Domenech, S. Impact of Hydrogen Injection in Natural Gas Infrastructures. In Proceedings of the 21th European Symposium on Computer-Aided Process Engineering (ESCAPE 21), Chalkidiki, Greece, 29 May–1 June 2011.
- Ma, F.; Liu, H.; Wang, Y.; Li, Y.; Wang, J.; Zhao, S. Combustion and emission characteristics of a port injection HCNG engine under various ignition timings. Int. J. Hydrogen Energ. 2008, 33, 816–822. [Google Scholar] [CrossRef]
- Zwart, R.W.R.; Boerrigter, H.; Deurwaarder, E.P.; van der Meijden, C.M.; van Paasen, S.V.B. Production of Synthetic Natural Gas (SNG) from Biomass. Report for Energy Research Center of the Netherlands. Available online: http://www.ecn.nl/docs/library/report/2006/e06018.pdf (accessed on 3 June 2013).
- Mignard, D.; Sahibzada, M.; Duthie, J.M.; Whittington, H.W. Methanol synthesis from flue-gas CO2 and renewable electricity: A feasibility study. Int. J. Hydrogen Energ. 2003, 28, 455–464. [Google Scholar] [CrossRef]
- Breyer, C.; Rieke, S.; Sterner, M.; Schmid, J. Hybrid PV-Wind-Renewable Methane Powerplants—A Potential Cornerstone of Global Energy Supply. In Proceedings of the 26th European Photovoltaic Solar Energy Conference, Hamburg, Germany, 5–9 September 2011.
- ETOGAS. Alpha Plant is in Operation. Available online: http://www.etogas.com/en/the-solution/the-alpha-plant-is-in-operation (accessed on 6 October 2013).
- Ali-Oettinger, S. Aster Capital Leads Financing Round for SolarFuel. Available online: http://www.pv-magazine.com/news/details/beitrag/aster-capital-leads-financing-round-for-solarfuel_100008735/#axzz2iTHd6pOJ (accessed on 7 October 2013).
- Rieke, S. Power-to-Gas Technology-the Missing Link in Renewable Energy Systems. Available online: http://ecosummit.net/uploads/eco12_230312_0930_stephanrieke_solarfuel.pdf (accessed on 5 October 2013).
- Saltelli, A.; Ratto, M.; Andres, T.; Campolongo, F.; Cariboni, J.; Gatelli, D.; Saisana, M.; Tarantola, S. Global Sensitivity Analysis: The Primer; John Wiley & Sons: Chichester, UK, 2008. [Google Scholar]
- Pannell, D.J. Sensitivity analysis of normative economic models: Theoretical framework and practical strategies. Agri. Econ. 1997, 16, 139–152. [Google Scholar] [CrossRef]
- Project Management Institute (PMI). A Guide to the Project Management Body of Knowledge (PMBOK Guide), 5th ed.; Project Management Institute: Newtown Squarel, PA, USA, 2013; p. 338. [Google Scholar]
- Kerzner, H. Project Management, A Systems Approach to Planning, Scheduling, and Controlling; John Wiley & Sons: Hoboken, NJ, USA, 2009; p. 614. [Google Scholar]
- Zittel, W.; Wurster, R. Production of hydrogen, from electricity by means of electrolysis. HyWeb: Knowledge—Hydrogen in the Energy Sector. Ludwig-Bölkow-Systemtechnik GmbH, Part 3.4. Available online: http://web.archive.org/web/20070207080325/http://www.hyweb.de/Knowledge/w-i-energiew-eng3.html#3.4 (accessed on 8 June 2013).
- Kruse, B.; Grinna, S.; Buch, C. Hydrogen—Status and Possibilities. Available online: http://www.bellona.org/filearchive/fil_Hydrogen_6-2002.pdf (accessed on 3 May 2013).
- Ontario Energy Board. Natural Gas Rate Updates, Natural Gas Rates at a Glance. Available online: http://www.ontarioenergyboard.ca/OEB/Consumers/Natural+Gas/Natural+Gas+Rates (accessed on 9 July 2013).
- Index Mundi. Russian Natural Gas Monthly Price, USD Per Million Metric British Thermal Unit. Available online: http://www.indexmundi.com/commodities/?commodity=russian-natural-gas (accessed on 9 July 2013).
© 2014 by the authors; licensee MDPI, Basel, Switzerland. This article is an open access article distributed under the terms and conditions of the Creative Commons Attribution license (http://creativecommons.org/licenses/by/3.0/).
Share and Cite
Garmsiri, S.; Rosen, M.A.; Smith, G.R. Integration of Wind Energy, Hydrogen and Natural Gas Pipeline Systems to Meet Community and Transportation Energy Needs: A Parametric Study. Sustainability 2014, 6, 2506-2526. https://doi.org/10.3390/su6052506
Garmsiri S, Rosen MA, Smith GR. Integration of Wind Energy, Hydrogen and Natural Gas Pipeline Systems to Meet Community and Transportation Energy Needs: A Parametric Study. Sustainability. 2014; 6(5):2506-2526. https://doi.org/10.3390/su6052506
Chicago/Turabian StyleGarmsiri, Shahryar, Marc A. Rosen, and Gordon Rymal Smith. 2014. "Integration of Wind Energy, Hydrogen and Natural Gas Pipeline Systems to Meet Community and Transportation Energy Needs: A Parametric Study" Sustainability 6, no. 5: 2506-2526. https://doi.org/10.3390/su6052506