Article

Low Carbon Supplier Selection in the Hotel Industry

1
Department of Travel and Eco-tourism, Tungnan University, New Taipei City 22202, Taiwan
2
Department of Industrial and Systems Engineering, Chung Yuan Christian University, 200 Chung Pei Road, Chung Li 32023, Taiwan
3
Institute of Environmental Engineering and Management, National Taipei University of Technology, Taipei City 106, Taiwan
*
Author to whom correspondence should be addressed.
Sustainability 2014, 6(5), 2658-2684; https://doi.org/10.3390/su6052658
Submission received: 29 January 2014 / Revised: 18 April 2014 / Accepted: 29 April 2014 / Published: 7 May 2014
(This article belongs to the Section Economic and Business Aspects of Sustainability)

Abstract

:
This study presents a model for evaluating the carbon and energy management performance of suppliers by using multiple-criteria decision-making (MCDM). By conducting a literature review and gathering expert opinions, 10 criteria on carbon and energy performance were identified to evaluate low carbon suppliers using the Fuzzy Delphi Method (FDM). Subsequently, the decision-making trial and evaluation laboratory (DEMATEL) method was used to determine the importance of evaluation criteria in selecting suppliers and the causal relationships between them. The DEMATEL-based analytic network process (DANP) and VlseKriterijumska Optimizacija I Kompromisno Resenje (VIKOR) were adopted to evaluate the weights and performances of suppliers and to obtain a solution under each evaluation criterion. An illustrative example of a hotel company was presented to demonstrate how to select a low carbon supplier according to carbon and energy management. The proposed hybrid model can help firms become effective in facilitating low carbon supply chains in hotels.

1. Introduction

With the increased consciousness on the issue of climate change, the implementation of energy conservation and carbon reduction in the hotel industry has become significant to address global warming [1,2,3,4,5]. The hotel industry, a major sub-sector of the tourism industry, consumes a significant amount of energy, which equates to the amounts of indirect greenhouse gas (GHG) emissions associated with the energy consumption of the hotel sector [6,7]. The Taiwan Green Productivity Foundation [8] reports that the top 50 most intensive energy users in Taiwan’s hospitality industry, mostly tourist hotels, produced 363,810 tons of carbon emissions in 2008. To achieve the target of low-carbon operations, hotel companies have adopted either ISO 50001 (energy management systems) or ISO 14064 (greenhouse gas systems) to increase energy efficiency and mitigate carbon emission. These companies include the Marriott Washington DC Hotel, Regal Airport Hotel in Hong Kong, NH Hotels, Miramar Garden Hotels, and Evergreen Hotels in Taiwan.
The World Business Council for Sustainable Development and the World Resources Institute indicate that at least 80% of carbon emissions are produced in the total supply chain [9]. This finding is consistent with that of Sundarakani et al. [10], who emphasized that carbon emission across stages in a supply chain constitutes a significant threat that warrants careful attention in the design phase of the supply chain. In controlling the carbon footprint across a supply chain, Wittneben and Kiyar [11] underlined that GHG emissions from suppliers need to be considered to adequately assess the contributions of businesses to climate change. The 2010 supply chain report of the Carbon Disclosure Project states that more than half of its surveyed members expressed that in the future, they will cease doing business with suppliers that do not manage their carbon emissions [12]. This finding implies that carbon footprint can affect the optimal choice on sourcing decisions [13,14], operations decisions in inventory management [15], and product development [16].
Low-carbon supplier management is clearly a critical activity in purchasing management to achieve low-carbon operations within the hotel industry. Bonilla-Priego et al. [17] pointed out that tour operators are required to measure and manage the carbon performance of their suppliers. Teng et al. [5] stated that selecting a supplier that adopts energy conservation and carbon reduction, working with local farmers or vendors to reduce food miles, and purchasing local or seasonal food and products/materials can facilitate low-carbon hotel operations. Accor launched Accor Procurement Charter 21 and integrated sustainable development criteria into all phases of its supplier relations, from specifications in its calls for bids to specific clauses integrated into supplier certification contracts. At the end of 2012, more than 2000 certified suppliers—60% of the total—signed Accor Procurement Charter 21. Accor Hotels requires their suppliers to evaluate the environmental impact that their sites, products, and services exert on the environment and to set objectives on the quantitative reduction of GHG emissions [18]. Reflecting these trends, companies in the hotel industry must therefore require their suppliers to oversee their GHG emissions and energy management for a long-term collaborative partnership in the low-carbon supply chain.
Recently, supplier selection and evaluation of carbon management has become important in making low carbon purchasing decisions [5,19,20,21,22,23,24]. Nevertheless, to the best of our knowledge, supplier selection that specifically considers carbon or energy management competence in the hotel industry is rarely found in previous literature. A few studies have attempted to incorporate carbon management into the process of supplier selection in specific manufacturer industries [20,25,26]. By incorporating the carbon performance into the supplier selection process, Hsu et al. [20] proposed a framework that develops a carbon management model with 13 criteria used to manage suppliers in the Taiwanese electronics industry. Their study used the Decision-making Trial and Evaluation Laboratory (DEMATEL) approaches to recognize the influential criteria of carbon management and improve the overall carbon performance of suppliers. Later, Shaw et al. [24] included the criterion of carbon emission in supplier selection to develop a low carbon supply chain in the Indian garment manufacturing. The fuzzy analytic hierarchy process was applied before analyzing the weights of criteria, and the fuzzy multi-objective liner programming was used for supplier selection. This formulation integrates carbon emission into the objective function and takes the carbon emission cap (Ccap) of sourcing as a constraint while selecting a supplier. Similarly, in terms of optimizing green suppliers, Peng [26] integrated the criterion of energy consumption into green supplier selection in a large manufacturing enterprise. The analytical hierarchy process (AHP) and grey relational analysis were used to evaluate green suppliers. To construct a green and low carbon supplier evaluation model, Lee et al. [25] used the fuzzy analytic network process to evaluate various aspects of suppliers. Goal programming was then applied to allocate the most appropriate amount of orders to each of the selected supplier. Choi [27] proposed a two-stage optimal supplier selection scheme in which phase one filters the inferior suppliers and phase two helps to select the best supplier among the set of non-inferior suppliers by multi-stage stochastic dynamic programming. The impacts brought by different formats of carbon emission tax are explored.
Supplier selection and evaluation is a multi-criteria decision-making (MCDM) problem [28,29] that provides an effective framework for comparing suppliers. In the current study, a hybrid MCDM model is proposed to identify the evaluation criteria of carbon performance using the Fuzzy Delphi Method (FDM). By considering the interrelationship between criteria, the decision-making trial and evaluation laboratory (DEMATEL) method is used to recognize cause-effect relationships and to construct the cognition map of the evaluation criteria. The DEMATEL based on an analytic network process (ANP), also called the DANP method, is used to calculate the influence weights of the criteria. Finally, the VIseKriterijumska Optimizacija I Kompromisno Resenje (VIKOR) with DANP weights is used for the evaluation of the carbon performance of suppliers and to determine performance scores and gaps. An illustrative example of a hotel firm in Taiwan is used to demonstrate the proposed framework for appropriate supplier selection in terms of carbon management.
The remainder of this paper is organized as follows. Section 2 reviews the literature on supplier selection based on carbon performance. Section 3 briefly describes the FDM method, the DEMATEL method, the DANP influential weights, and the VIKOR technique, which are used to build a hybrid MCDM model for selecting a low-carbon supplier. An empirical case of a hotel company is used to demonstrate the proposed model in Section 4. We present and discuss the results of proposed framework in Section 5. The conclusion and suggestion for future research are presented in Section 6.

2. Carbon Management Criteria in Supplier Selection

Several useful criteria associated with carbon management and their categories are pointed out in the literature. Information about them was utilized to construct a framework for competency in carbon management aware supplier selection in hotel supply chain. Twelve criteria were finally included.

2.1. Energy Efficiency of Products

In implementing energy management systems of ISO 50001-certified, organizations will require their suppliers to provide energy efficiency information on their products or equipment [30]. Green hotel associations and some government websites provide information on the energy efficiency of products, such as printing paper, toilet/tissue paper, computers, refrigerators, air conditioners, and employee uniforms [5]. With the availability of energy efficiency information on products, hotel operators can purchase highly efficient products and facilities instead of those with high-energy consumption to achieve low carbon operation.

2.2. Eco-labeling of Products

Hotel operators that adopt green purchasing can reduce energy consumption and simultaneously reduce operating costs [31]. For example, the Energy Star program has significantly reduced economic costs and CO2 emissions associated with electricity consumption [32]. The products of suppliers are qualified by eco-labels, such as the energy-saving label, green mark, and water-saving label, hotel operators can implement green purchasing to reduce energy consumption.

2.3. Carbon Accounting and Inventory

Carbon accounting and inventory is an essential step in developing strategies for controlling GHG emissions and evaluating its progress in the operations of a company, in products, and in supply chain, as companies need to know their current situation [33]. Cogan et al. [34] found that more than 60% of the evaluated companies conducted a GHG emissions inventory.

2.4. Energy Reduction of Food Processing

In the food industry, high levels of energy consumption are necessary for key operations, such as food preservation, sanitation, processing, and storage [35]. For example, the U.S. food industry consumes 7% of the total electricity used by the manufacturing sector. Therefore, about 15% of the total energy requirements of the food industry are from electricity [36]. To show an example of fictitious slaughter and meat processing, Fritzson and Berntsson [37] performed different energy efficiency measures, such as increasing the heat exchanger networks and heat pumps, to achieve the target reduction of 5% and 35% of the total CO2 emissions. Considering the low carbon supply of food available in the hotel industry, suppliers from food processing suppliers must embrace different measures to save energy and reduce carbon emissions.

2.5. Carbon Governance

Over 90% of Carbon Disclosure Project (CDP) members have tasked either a board committee or another executive body with the overall responsibility of climate change management to ensure that the strategy is effectively implemented [12]. Companies that integrate climate change into their board and executive structures, as well as their public reporting mechanisms, are far more likely to maintain long-term commitments and the comprehensive approaches necessary to effectively address climate change risks and opportunities across their entire business structure [34].

2.6. Carbon Policy

The CDP [10] reveals that its members have integrated carbon policies into their procurement departments and that majority of these companies (90%) have a carbon emission reduction plan in place. Accordingly, companies can facilitate carbon management practices by establishing a carbon policy as a manifestation of its position on carbon emissions disclosure, carbon reduction targets, and carbon emissions certification, among others. Moreover, by implementing the energy management systems standard ISO 50001, companies will be able to implement an energy policy [38].

2.7. Carbon Reduction Targets

In terms of the mitigation of climate change, Weinhofer and Hoffmann [39] argue that GHG reduction targets reflect a long-term need to decrease emissions. Setting targets to reduce GHG emissions has become the norm in corporate climate change strategies, which include quantitative emission reduction targets for their Scopes 1 and 2, and occasionally even Scope 3, GHG emissions [34]. A company must set its carbon reduction target at a sufficiently high level to enable authentic and measurable progress in addressing climate change.

2.8. Carbon and Energy Management Systems

To mitigate carbon emissions, firms attempt to acquire different certified standards associated with carbon and energy management systems. Recently, most companies have applied various standards on carbon management, such as ISO 14064-Parts I and II and PAS 2050, to conduct inventories and account for GHG emissions. Energy management is the combination of energy efficiency activities and techniques, and the management of related processes that result in lower energy costs and CO2 emissions [40]. Ates and Durakbasa [38] point out that the energy management system ISO 50001 is expected to compel industrial organizations to examine the systems and processes required to increase their energy performance, energy efficiency, and intensity.

2.9. Transport Efficiency

The energy efficiency and carbon emissions of transportation should be considered to facilitate the creation of a low carbon supply chain within the hotel industry, as transportation is required for the mass delivery of food, consistent with Teng et al. [5]. Their study argues that food and beverage operators should be aware of their carbon footprint and reduce it, as well as improve the energy efficiency of road freight transport. For example, the energy requirement contribution of transporting foodstuffs for breakfast is significant [2].

2.10. Collaboration of Suppliers

Working with suppliers to green supply chain in hotel sector, International Tourism Partnership [41] argued that hotel operators should encourage local businesses to cut down on transport energy by sourcing locally. Climate change is not a single issue that can be addressed by only one company or even one sector. Companies need to collaborate with their supplier to climate change of adaptation and mitigation. According to Scott and Becken [42], Carla Aguirre from VisitSweden reported on their experience to encourage and motivate potential suppliers, and show leadership on sustainability and climate change issues.

2.11. Carbon Reduction and Energy Conservation Measures

To mitigate carbon emissions, most companies no longer concentrate solely on influencing policy debates. Instead, they have begun to pursue various firm-specific practical actions against climate change within the framework of a corporate climate strategy [43]. Companies can take internal and external measures on their carbon dioxide emissions [33,44,45]. Internal measures are usually defined as activities within the business operations of the company, whereas external measures represent emission compensation measures [39].

2.12. Food Mile Management

Food miles are usually explicitly linked to carbon accounting and climate change [46]. Internationally, the demand of the tourism sector for food and its associated food miles have a significant impact on GHG emissions and thus have implications for climate change [47]. Through the tracking of food miles and associated sources, Pratt [48] concludes that ecotourism operations, such as those within the hotel industry, have identified and improved their sustainability and ecological footprint by minimizing GHGs.

3. Building a Hybrid MCDM Model of Low Carbon Supplier Selection

The methodology of constructing an evaluation framework for selecting a low carbon supplier in the hotel industry for this study has three phases. The first phase emphasizes the identification of criteria to evaluate the carbon management competence of suppliers. In this study, five managers from hotel firms and three university professors were invited to screen and fit the criteria using FDM techniques. In the second phase, after identifying the consistency of criteria, the DANP method was used to examine the interrelationship between and the influential weights among the criteria. Finally, VIKOR was used to rank the suppliers of an illustrative hotel company in terms of carbon management competence.

3.1. Recognizing the Evaluation Criteria by FDM Method

The Delphi Method has been widely used and recognized for making predictions and for decision-making since its introduction in 1963 by Dalkey and Helmer at the RAND Corporation [49]. The Delphi Method was conceived as a group technique that aims to obtain the most reliable consensus of a group of experts using a series of intensive questionnaires with controlled opinion feedback [50]. Despite its recognition as a valuable tool, it has some drawbacks. The tool is time consuming, and converging results through repetitive surveys is costly [51,52,53]. Further, the problems of ambiguity and uncertainty remain in the responses of experts [51,53,54]. To solve these defects, Murray et al. [55], combined the concepts of the traditional Delphi Method and the fuzzy set to alleviate the ambiguity of the Delphi Method. Kaufmann and Gupta [56] proposed a more complete FDM procedure, in which the fuzzy set theory is used by asking participants to give a three-point estimate (i.e., pessimistic, moderate, and optimistic values). Triangular fuzzy numbers (TFNs) were then formed, and their means were computed. This study applied paired TFNs to locate three points in the extent of importance (i.e., minimum, medium, and maximum values) on a scale of 0 to 10 points. Wei and Chang [57] adopted the same concept to calculate and represent these “group average” values. The paired TFNs were categorized into two, namely, the conservative TFN (CL, CM, CU) and the optimistic TFN (OL, OM, OU). The intersection of the fuzzy opinions of experts implies the convergence of consensus, as shown in Figure 1. Finally, the geometric means of conservative, moderate, and optimistic values (Ci, ai, Oi) were computed to acquire the consensus values (Gi) of each item. In view of the advantages of FDM in evoking expert-group opinion, various studies [57,58,59] have embraced FDM in the creation of performance indicators or evaluation criteria. Some essential FDM steps are as follows [57,60]:
Figure 1. TFNs formed in the FDM.
Sustainability 06 02658 g001
Step 1. The questionnaires are distributed. An appropriate panel group of experts is organized to express the experts’ most conservative (minimum) and optimistic (maximum) values for each item on a scale of 0 to 10.
Step 2. The most conservative (minimum) and optimistic (maximum) values from each expert for each item are gathered, and the geometric mean of the expert group’s opinions is computed. A group average is calculated for the pessimistic (optimistic) index of sub-criterion i, and the abnormal value, which is outside the two standard deviations, is eliminated. The rest of the values, namely, the minimum ( Sustainability 06 02658 i001), geometric mean ( Sustainability 06 02658 i002), and the maximum ( Sustainability 06 02658 i003) of the remaining conservative values; and the minimum ( Sustainability 06 02658 i004), geometric mean ( Sustainability 06 02658 i005), and maximum ( Sustainability 06 02658 i006) of the remaining optimistic values, are calculated.
Step 3. The two TFNs as the most conservative TFN ( Sustainability 06 02658 i001, Sustainability 06 02658 i002, Sustainability 06 02658 i003) and the most optimistic TFN ( Sustainability 06 02658 i004, Sustainability 06 02658 i005, Sustainability 06 02658 i006) are determined based on “group average” values.
Step 4. The expert opinions are examined to determine if they are consistent. The consensus significance value (Gi) for each item is calculated.
(1)
If the paired TFNs do not overlap (i.e., Sustainability 06 02658 i003 Sustainability 06 02658 i004), then a consensus for item i exists. The consensus significance value is calculated as follows:
Sustainability 06 02658 i007
(2)
If the paired TFNs overlap (i.e., Sustainability 06 02658 i003 > Sustainability 06 02658 i004) and the gray zone interval value (Zi = Sustainability 06 02658 i003 Sustainability 06 02658 i004) is less than the interval value of Ci and Oi (Mi = Sustainability 06 02658 i006 Sustainability 06 02658 i002), then the consensus significance value of each item is calculated as follows:
Sustainability 06 02658 i008
If the paired TFNs overlap (i.e., Sustainability 06 02658 i003 > Sustainability 06 02658 i004) and the gray zone interval value (Zi = Sustainability 06 02658 i003 Sustainability 06 02658 i004) is more than the interval value of Ci and Oi (Mi = Sustainability 06 02658 i006 Sustainability 06 02658 i002), then the expert opinions have discrepancies. Steps 1 to 4 should be repeated until each item converges and Gi is calculated.

3.2. Building a Network Relation Map Using DEMATEL

DEMATEL is a comprehensive tool for building and analyzing a structural model that involves causal relationships between complex factors [61]. Developed by the Science and Human Affairs Program of the Battelle Memorial Institute of Geneva from 1972 and 1976, DEMATEL has been used to research and solve a group of complicated and intertwined problems. DEMATEL was developed with the belief that pioneering scientific research methods and their appropriate use could improve the understanding of a specific problematic cluster of intertwined problems, thus contributing to the identification of workable solutions using a hierarchical structure. The methodology, according to the concrete characteristics of objective affairs, can confirm the interdependence among variables/attributes and restrict the relationship reflecting their characteristics using an essential system and a development trend [62,63]. The product of the DEMATEL process is a visual representation (i.e., an individual map of the mind) that the respondent uses to organize his/her own actions. The DEMATEL method is increasingly being used to determine the interrelationships between factors through a cause-effect relationship diagram, particularly to determine the critical factors of reverse supply chains [64], SaaS adoption [65], airline safety management systems [66], and performance evaluation in hotel industry [67]. Therefore, DEMATEL modeling fits the problem examined in the present study best and offers the advantage of providing a systematic approach to determine the relationships of low carbon supplier management in hotel industry.
The following steps show the DEMATEL process:
Step 1. The average matrix is calculated.
Suppose we have H experts in this study and n factors to consider. Each respondent is asked to indicate the degree to which he/she believes a factor, i, affects factor j. Pairwise comparisons between any two factors are denoted by xkij and are given an integer score of 0 to 4, representing “No influence (0)”, “Low influence (1)”, “Medium influence (2)”, “High influence (3)” and “Very high influence (4)” [68]. 
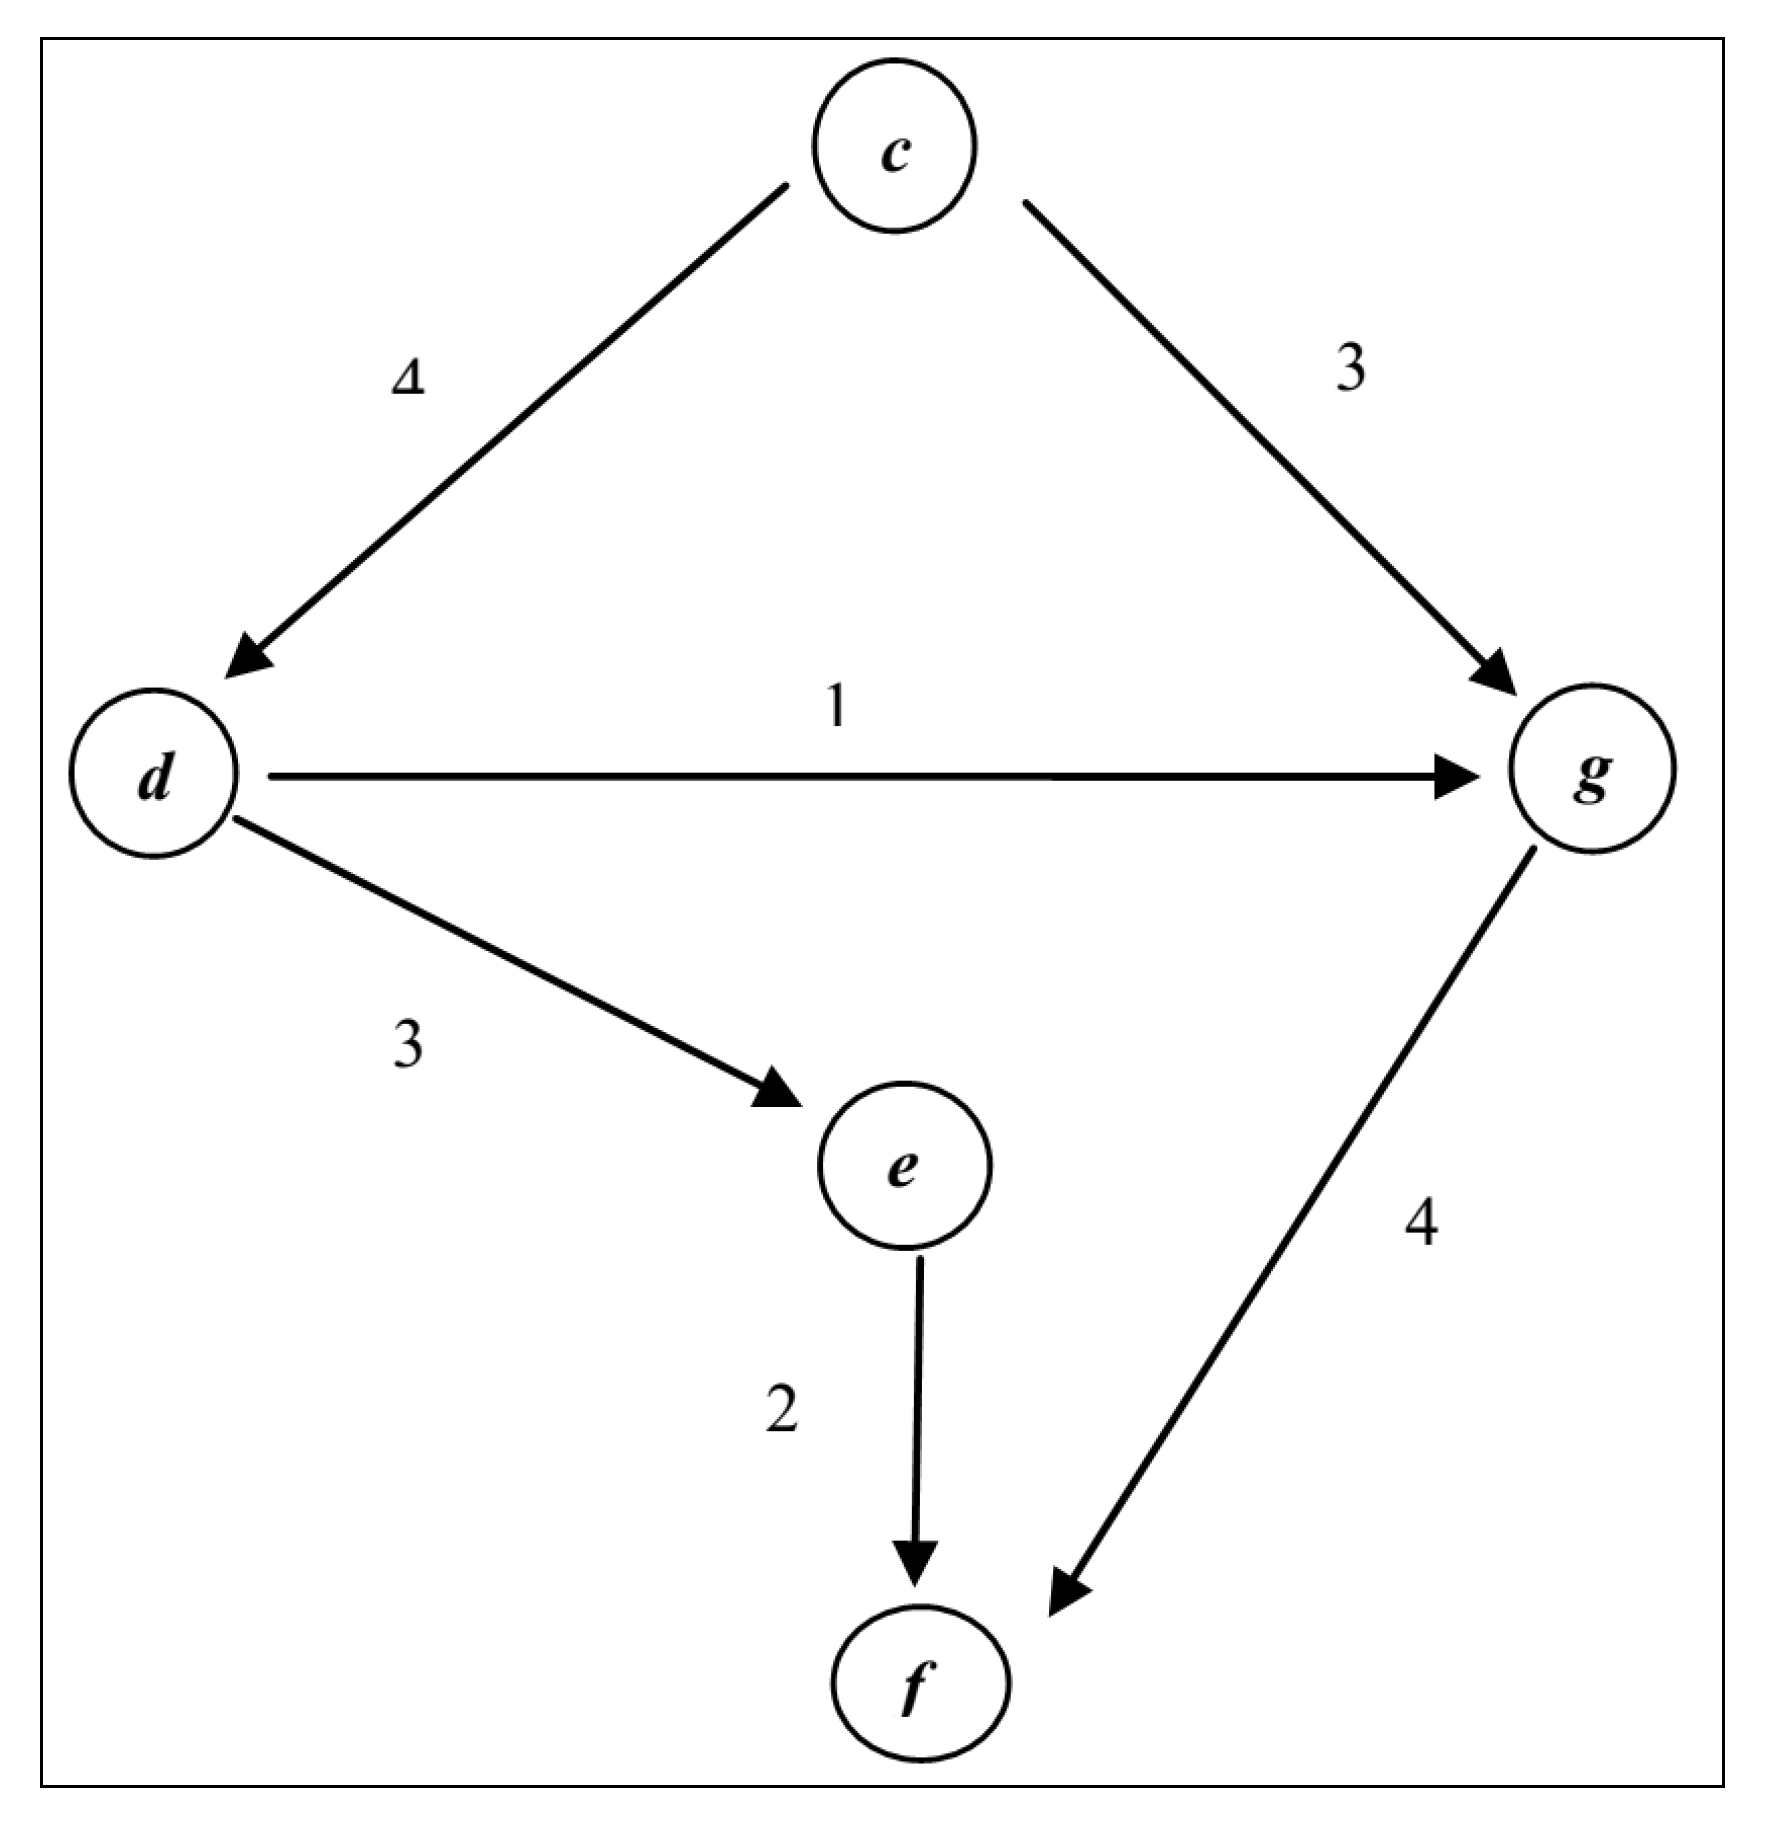
Figure 2 shows an example of an influence map. Each letter represents a factor in the system. An arrow from c to d shows the effect that c has on d; the strength of its effect is 4 (very high influence). DEMATEL can convert the structural relations between the factors of a system into an intelligible map of the system. The scores provided by each respondent provide an n×n non-negative answer matrix Xk = [ Sustainability 06 02658 i009], with k = 1,2, …, H. Therefore, X1, X2,…, XH are the answer matrices for each of the H experts, with each element of Xk = [ Sustainability 06 02658 i009]n×n being an integer denoted by Sustainability 06 02658 i009. The diagonal elements of each answer matrix Xk = [ Sustainability 06 02658 i009]n×n are all set to 0. The n×n average matrix A for all expert opinions can then be computed by averaging the scores of the H experts as follows:
Sustainability 06 02658 i010
The average matrix A = [aij]n×n is also called the original average matrix. A shows the initial direct effects a factor has on and receives from other factors. The causal effect between each pair of factors in a system can be outlined by drawing an influence map, as shown in Figure 2.
Figure 2. Example of an influence map.
Sustainability 06 02658 g002
Step 2. Calculate the direct influence matrix.
The normalized initial direct-relation matrix D is obtained by normalizing the average matrix A in the following method:
Sustainability 06 02658 i011
Thus,
Sustainability 06 02658 i012
As the sum of each row j of matrix A represents the direct effects of factor on others, Sustainability 06 02658 i013 represents the one with the highest direct influence. Likewise, as the sum of each column i of matrix A represents the direct effects received by factor i, Sustainability 06 02658 i014 represents the one most influenced by other factors. The positive scalar s is equal to the larger of the two extreme sums. Matrix D is obtained by dividing each element of A by the scalar. Note that each element dij of matrix D is between 0 and 1.
Step 3. Compute the total relation matrix.
Indirect effects between factors are measured by powers of D. Continuous decrease in the indirect effects of factors, including the powers of matrix D, namely, D2,D3, …, D, guarantees convergent solutions to the matrix inversion similar to an absorbing Markov chain matrix. Note that Sustainability 06 02658 i015 and Sustainability 06 02658 i016, where 0 is the n ×n null matrix and I is the n × n identity matrix. The total relation matrix T is an n ×n matrix and is defined as follows:
Sustainability 06 02658 i017
As Sustainability 06 02658 i045 where D = [dij]n × n, 0 ≤ dij < 1, and 0 ≤ (∑i dij, ∑j dij) < 1. At least one column sum ∑j dij or one row sum ∑i dij equals 1.
We also define r and c as n × 1 vectors representing the sum of the rows and the sum of the columns of the total relation matrix T as follows:
where superscript denotes transposition.
Sustainability 06 02658 i018
Sustainability 06 02658 i019
Let ri be the sum of the i-th row in matrix T. Therefore, ri shows the total effects, both direct and indirect, of the i-th factor on other factors. Let cj denote the sum of the j-th column in matrix T. The value cj shows the total effects, both direct and indirect, received by factor j from other factors. Therefore, the sum (ri + ci) gives an index (i.e., the position) representing the total effects both given and received by the i-th factor. In other words, (ri + ci) shows the degree of importance that the i-th factor plays in the system (i.e., total sum of effects given and received). Moreover, the difference (rici, also called the relation) shows the net effect; the i-th factor contributes to the system. When (rici) is positive, the i-th factor is a net causer; when (rici) is negative, the i-th factor is a net receiver [69,70].
Step 4. Set the Threshold Value and Obtain the Cognition Map.
To obtain the cognition map from the factors, a threshold value p should be established to extricate negligible effects from the total influence of matrix T [71]. Only some criteria, whose effect in matrix T is greater than the threshold value, should be chosen and shown in a network relationship map (NRM) for influence [70].

3.3. Combining DEMATEL and ANP to Calculate the Evaluation Weights by NRM

ANP is the general form of AHP, which is used in MCDM to address restrictions on hierarchical structures [72]. However, the survey questionnaire of ANP is too difficult for interviewees to accomplish [67,73]. Moreover, the traditional ANP assumption, that is, each cluster is of equal weight in obtaining a weighted supermatrix, is not reasonable [74,75,76]. To improve this shortcoming, we used a novel combination of DEMATEL and ANP technique called DANP to determine the influential weights of the criteria based on the NRM of DEMATEL. Recently, DANP has been widely applied in different areas of tourism policy [77], best vendor selection [75], performance evaluation for hot spring hotels [67], and web sites of national parks [78]. The DANP process has the following steps:
Step 1. Establishing an unweighted super matrix.
The total-influenced matrix is obtained from DEMATEL. Each column is summed up for normalization. The total-influenced matrix Tc =[tij]nxn is obtained by the criteria, and Sustainability 06 02658 i020 is obtained by the dimensions (clusters) from Tc . Next, the supermatrix Tc is normalized for the ANP weights of the dimensions (clusters) using the influence matrix TD.
Sustainability 06 02658 i021
After normalizing the total-influence matrix Tc through the dimensions (clusters), a new matrix Sustainability 06 02658 i022 is obtained, as shown in Equation (8).
Sustainability 06 02658 i023
The normalization Sustainability 06 02658 i024 is explained and that of the other Sustainability 06 02658 i025 is the same as above.
Sustainability 06 02658 i026
Sustainability 06 02658 i027
Let the total-influence matrix match and fall into the interdependence clusters. The result is the unweighted supermatrix, which is based on the transposition of the normalized influence matrix Sustainability 06 02658 i022 by the dimensions (clusters), that is, W = ( Sustainability 06 02658 i022)'.
Sustainability 06 02658 i028
If the matrix W11 is blank or 0 as shown as Equation (14), then the matrix between the clusters or the criteria is independent and has no interdependent. The other Wnn value are as above.
Sustainability 06 02658 i029
Step 2. Obtaining the weighted supermatrix
Each column is added for normalization.
Sustainability 06 02658 i030
The total-influence matrix TD is normalized, and a new matrix Sustainability 06 02658 i031 is obtained, where Sustainability 06 02658 i032.
Sustainability 06 02658 i033
Let the normalized total-influence matrix Sustainability 06 02658 i031 complete the unweighted supermatrix to obtain the weighted supermatrix.
Sustainability 06 02658 i034
Step 3. Limiting the weighted supermatrix.
The weighted supermatrix is limited by raising it to a sufficiently large power k until the supermatrix converges and becomes a long-term stable supermatrix to obtain the global priority vectors (called the DANP weights), such as Sustainability 06 02658 i035.

3.4. Ranking the Alternatives Using the VIKOR Method

The compromise ranking method (known as VIKOR) was introduced as an applicable technique to implement in MCDM [79]. It is based on the concept of the positive- and negative-ideal solution to evaluate the standard of different projects competing with the MCDM model [80]. The positive-ideal solution represents the alternative with the highest value, whereas the negative-ideal represents that with the lowest value. Similar to some MCDM methods, such as TOPSIS, VIKOR relies on an aggregating function that represents closeness to the ideal. In contrast to TOPSIS, however, VIKOR introduces a ranking index based on the particular measure of closeness to the ideal solution; this method uses linear normalization to eliminate units of criterion functions [80]. VIKOR ranks and selects from a set of alternatives, determines compromise solutions for a problem with conflicting criteria, and assists decision makers in generating the final decision [81]. Various studies regarded VIKOR as a suitable technique to evaluate each alternative for each criterion function [80,82]. The compromise ranking algorithm VIKOR has the following steps [81,82,83]:
Step 1. Determine the best and the worst values.
The best value is Sustainability 06 02658 i036 and the worst is Sustainability 06 02658 i037. These two values can be computed by Equations (18) and (19), respectively.
Sustainability 06 02658 i038
Sustainability 06 02658 i039
where, Sustainability 06 02658 i036 is the positive-ideal solution and Sustainability 06 02658 i037 is the negative-ideal solution for the jth criterion.
Step 2. Calculate the distance.
In this step, the distance from each alternative to the positive ideal solution is computed.
Sustainability 06 02658 i040
Sustainability 06 02658 i041
where wj represents the weights of the criteria from DANP, Si indicates the mean of group utility and represents the distance of the ith alternative achievement to the positive ideal solution; and Qi represents the maximal regret of each alternative.
Step 3. Calculate the values Ri by the relation [80].
Sustainability 06 02658 i042
where S* = Sustainability 06 02658 i043 Si, S* = Sustainability 06 02658 i043 Si, S = Sustainability 06 02658 i044 Si, Q* = Sustainability 06 02658 i043 Qi, Q = Sustainability 06 02658 i044 Qi.
Equation (22) can be rewritten as Ri = vSi + (1 − v)Qi, when S* = 0 and Q* = 0 (i.e., all criteria achieve the ideal level) and S = 1 and Q = 1 (i.e., the worst situation). In the equation, v is introduced as the weight for the strategy of maximum group utility, and 1-v is the weight of the individual regret. In Equation (22), when v = 1, it indicates the decision-making process that can use the strategy of maximum group utility. Conversely, when v = 0, it indicates the decision-making process that can use the strategy of minimum individual regret. In general, v = 0.5 will be used if the decision process involves both maximum group utility and individual regret [82,83]. The compromise solution is determined by VIKOR, and it can be accepted by the decision makers based on a maximum group utility of the majority and a minimum of the individual regret of the opponent.

4. A Hotel Company as an Example

In this section, an example demonstrates the proposed model for supplier selection in terms of carbon management competence. The M hotel, an ordinary tourist hotel with rooms priced accordingly, had its grand opening in 2006. It provides exceptional, high-quality facilities and services at reasonable prices to satisfy the demand for accommodations, food and beverages, and leisure services of local and foreign tourists. The M hotel also advocates three environmental visions, that is, “Environment, Energy Conservation, Carbon Reduction”, including sustainable development processes. To facilitate low carbon hotel operations, the M hotel launched various measures of energy conservation and carbon reduction, such as food mile management, electricity monitor systems, and energy efficiency improvement. In 2011, M hotel also acquired the certification of Energy Management Systems-ISO 50001 to mitigate carbon emission and to manage energy effectively. However, in achieving low carbon operations, M hotel encountered critical challenges in determining appropriate suppliers for long-term collaborative partnership in the low carbon supply chain. At least 80% of carbon emissions are produced in the total supply chain. The ISO 50001 requires suppliers to provide energy-efficient products. Thus, the M hotel used the proposed framework to select low carbon suppliers. In this study, five suppliers (S1, S2, S3, S4, and S5) of the hotel company in the case study were demonstrated to assess the carbon performance of the 10 criteria identified. Three managers in the case company conducting the assessment were responsible in the fields of supplier management, procurement management, and energy management. Managers used a five-point scale (i.e., 0 bad, 1 low, 2 moderate, 3 good, and 4 excellent performance) to evaluate the suppliers. After that, the authors evaluated these merchants using the hybrid MCDM model that combines DANP with VIKOR.

4.1. Identifying the Consistency of the Evaluation Criteria

Considering the situation of carbon management of suppliers in the Taiwanese hotel industry, a draft of the evaluation framework should be confirmed first by experts. Eight experts were invited in the FDM process to express their opinions on identifying the consistency of evaluation criteria for the selection of low carbon suppliers. Considering the practice experience in the field of carbon management in the hotel industry, the study identified five managers from hotel firms, who were responsible for the implementation of green procurement and energy management, and three university professors whose research were related to carbon and energy management in the hotel industry.
The 12 initial criteria were used as the basis for questionnaire development. The FDM technique was used to screen and fit the factors. First, the expert group average was calculated for the conservative and optimistic values of each measure i. Anything outside the two standard deviations was eliminated. Subsequently, the minimum ( Sustainability 06 02658 i001), geometric mean ( Sustainability 06 02658 i002), and maximum ( Sustainability 06 02658 i003) of the conservative values, as well as the minimum ( Sustainability 06 02658 i004), geometric mean ( Sustainability 06 02658 i005), and maximum ( Sustainability 06 02658 i006) of the optimistic values, were calculated (Table 1). The values of Mi and Zi were also calculated to determine the consistency of expert opinions. The differences were convergent, and the consensus value of Gi was calculated to screen the indicators [60,59]. The threshold value was set to 6.0. The agreed proportion of experts was more than 80%. Based on this principle, the two criteria, namely, “carbon governance” and “carbon management systems”, were excluded, as shown in Table 1. These criteria were used as the basis for selecting the 10 criteria for low carbon supplier selection in the hotel industry, as shown in Figure 3.
Table 1. Results of calculation of factors with FDM.
CriteriaPessimistic valueOptimistic valueGeometric meanMiZiConsensus value
Sustainability 06 02658 i001 Sustainability 06 02658 i003 Sustainability 06 02658 i004 Sustainability 06 02658 i006 Sustainability 06 02658 i002 Sustainability 06 02658 i005Gi
Energy efficiency of products397105.497.810.327.38 > 6.0
Eco-labeling of products 597106.508.520.027.76 > 6.0
Carbon accounting and inventory 375105.107.610.516.16 > 6.0
Energy reduction of food processing397106.368.910.557.84 > 6.0
Carbon governance173104.076.55−1.525.19 < 6.0
Carbon policy 597106.108.410.307.65 > 6.0
Carbon reduction targets375105.217.630.426.19 > 6.0
Carbon and energy management systems35594.326.922.595.62 < 6.0
Transport efficiency397106.438.790.367.82 > 6.0
Collaboration of suppliers397105.177.910.747.39 > 6.0
Measures of carbon reduction and energy conservation599106.939.492.568.21 > 6.0
Food mile management397105.848.500.667.64 > 6.0
Figure 3. The framework of low carbon supplier selection.
Sustainability 06 02658 g003

4.2. Determining the Relationships between Criteria by DEMATEL

The DEMATEL method was used to examine interdependent and influence relationships between 10 criteria using the results of FDM. The eight experts were asked to complete the questionnaires using a five-point scale (i.e., 0 for no influence, 1 for low, 2 for moderate, 3 for high, and 4 for very high) to indicate the influence of each criterion on another one in their respective organization. The average initial influence 10 × 10 matrix A (Table 2) was obtained by pairwise comparison in terms of influences and directions. The normalized initial direct-relation matrix D was calculated using Equations (3) to (5) (Table 3). The total influence matrix T (Table 4) was derived by Equation (6). The NRM of the influential relationship was constructed by vectors r and c (Table 5) using Equations (7) and (8), as shown in Figure 4.
Table 2. The initial influence matrix.
CriteriaC1C2C3C4C5C6C7C8C9C10
C10.0003.6002.4000.2002.4002.8002.6002.0002.8002.000
C23.6000.0003.2001.8003.2003.4003.0002.6003.0002.000
C33.0002.4000.0001.4003.6003.8003.0003.0003.2002.600
C41.4002.2001.0000.0001.6001.8001.2001.8001.8002.000
C53.0002.6003.0001.2000.0003.2003.4003.4003.8002.800
C63.2002.6003.0000.4003.6000.0003.4003.6003.4002.800
C71.6002.6002.8000.8003.0003.0000.0002.8003.0002.000
C82.6002.8003.0001.0002.8003.2002.2000.0002.6002.200
C93.0002.8003.6001.2003.4003.4002.8003.2000.0002.800
C101.8002.2002.6002.2002.8002.8002.2003.2002.8000.000
Table 3. The normalized direct-influence matrix.
CriteriaC1C2C3C4C5C6C7C8C9C10
C10.0000.1310.0880.0070.0880.1020.0950.0730.1020.073
C20.1310.0000.1170.0660.1170.1240.1090.0950.1090.073
C30.1090.0880.0000.0510.1310.1390.1090.1090.1170.095
C40.0510.0800.0360.0000.0580.0660.0440.0660.0660.073
C50.1090.0950.1090.0440.0000.1170.1240.1240.1390.102
C60.1170.0950.1090.0150.1310.0000.1240.1310.1240.102
C70.0580.0950.1020.0290.1090.1090.0000.1020.1090.073
C80.0950.1020.1090.0360.1020.1170.0800.0000.0950.080
C90.1090.1020.1310.0440.1240.1240.1020.1170.0000.102
C100.0660.0800.0950.0800.1020.1020.0800.1170.1020.000
Table 4. The total influence matrix.
CriteriaC1C2C3C4C5C6C7C8C9C10
C10.5410.6560.6550.2460.6860.7150.6420.6530.6950.554
C20.7580.6410.7850.3400.8220.8490.7580.7810.8140.646
C30.7480.7290.6900.3310.8440.8710.7670.8040.8300.673
C40.4260.4510.4370.1670.4770.4960.4290.4710.4820.408
C50.7560.7440.7980.3300.7370.8640.7870.8240.8560.686
C60.7590.7410.7950.3020.8500.7560.7840.8270.8410.683
C70.6120.6400.6840.2720.7220.7400.5710.6960.7190.570
C80.6580.6620.7050.2850.7320.7630.6610.6190.7230.589
C90.7540.7470.8130.3290.8450.8670.7670.8160.7310.684
C100.6250.6370.6850.3220.7240.7420.6520.7170.7210.509
Threshold value: 0.756, the values were marked when higher than the threshold value.
Table 5. The sum of influences giving and received.
Criteriariciri + ciri − ci
C16.0416.63812.680−0.597
C27.1946.64813.8420.546
C37.2877.04514.3320.242
C44.2442.9247.1681.320
C57.3827.44014.822−0.059
C67.3397.66315.002−0.323
C76.2256.81813.043−0.593
C86.3967.20613.603−0.810
C97.3537.41114.764−0.058
C106.3346.00212.3370.3320
Figure 4. The causal diagram.
Sustainability 06 02658 g004

4.3. Finding the Influential Weight of Criteria by DANP

This study used the DANP to obtain the weights of the 10 criteria based on the influence network of the total influence matrix T of DEMATEL. DANP was used to calculate an unweighted supermatrix (Table 6) and weighted supermatrix (Table 7). The limiting power of the weighted supermatrix to confirm the supermatrix was converged and became a long-term stable supermatrix, obtaining the weights of all criteria (Table 8). Each row represents the weights of each criterion.
Table 6. Unweighted supermatrix based on DANP.
CriteriaC1C2C3C4C5C6C7C8C9C10
C10.54090.65560.65480.24570.68570.71520.64220.65300.69460.5538
C20.75800.64100.78470.34000.82240.84950.75760.78090.81370.6464
C30.74800.72940.68980.33150.84430.87120.76660.80360.82960.6729
C40.42620.45110.43660.16680.47730.49590.42930.47060.48170.4084
C50.75600.74400.79810.32950.73740.86360.78650.82440.85610.6862
C60.75930.74070.79540.30250.85040.75560.78410.82700.84140.6830
C70.61220.64020.68360.27230.72180.73970.57130.69590.71860.5695
C80.65800.66220.70470.28480.73210.76270.66120.61860.72310.5889
C90.75440.74720.81290.32870.84530.86680.76660.81580.73150.6841
C100.62520.63710.68450.32190.72380.74240.65240.71670.72090.5093
Table 7. Weighted supermatrix based on DANP.
CriteriaC1C2C3C4C5C6C7C8C9C10
C10.08950.10540.10270.10040.10240.10350.09830.10290.10260.0987
C20.10850.08910.10010.10630.10080.10090.10280.10350.10160.1006
C30.10840.10910.09470.10290.10810.10840.10980.11020.11050.1081
C40.04070.04730.04550.03930.04460.04120.04370.04450.04470.0508
C50.11350.11430.11590.11250.09990.11590.11600.11450.11500.1143
C60.11840.11810.11960.11690.11700.10300.11880.11920.11790.1172
C70.10630.10530.10520.10120.10660.10680.09180.10340.10430.1030
C80.10810.10850.11030.11090.11170.11270.11180.09670.11090.1131
C90.11500.11310.11380.11350.11600.11460.11540.11300.09950.1138
C100.09170.08980.09230.09620.09300.09310.09150.09210.09300.0804
Table 8. Influential weights of stable matrix of DANP.
CriteriaC1C2C3C4C5C6C7C8C9C10
C10.10080.10080.10080.10080.10080.10080.10080.10080.10080.1008
C20.10120.10120.10120.10120.10120.10120.10120.10120.10120.1012
C30.10730.10730.10730.10730.10730.10730.10730.10730.10730.1073
C40.04440.04440.04440.04440.04440.04440.04440.04440.04440.0444
C50.11310.11310.11310.11310.11310.11310.11310.11310.11310.1131
C60.11640.11640.11640.11640.11640.11640.11640.11640.11640.1164
C70.10360.10360.10360.10360.10360.10360.10360.10360.10360.1036
C80.10940.10940.10940.10940.10940.10940.10940.10940.10940.1094
C90.11270.11270.11270.11270.11270.11270.11270.11270.11270.1127
C100.09120.09120.09120.09120.09120.09120.09120.09120.09120.0912
After the weights of the criteria were determined by DANP, the VIKOR method was used to evaluate the carbon performance of supplier selection (Table 9). In this study, five suppliers (S1, S2, S3, S4, and S5) of the hotel company in the case study were shown to assess carbon performance according to the 10 criteria identified. Three managers in the case company conducting the assessment were responsible for the fields of supplier management, procurement management, and energy management. Managers used a five-point scale (i.e., 0 = bad, 1 = low, 2 = moderate, 3 = good, and 4 = excellent performance) to evaluate the suppliers. Then, the authors evaluated these merchants by using the hybrid MCDM model, which combines DANP with VIKOR. The average performance scores of each merchant through the VIKOR method were used to obtain the performance and the ideal level gaps among the suppliers, as shown in Table 9. Given the ease of use of the proposed model in the case company, in this research, v value of VIKOR was set to 0.5 based on both maximum group utility and individual regret in the expert opinions. As Ri represents the gap between the alternative and the ideal solution, S3 contains the smallest gap in terms of the value of VIKOR, followed by S1, S2, S5, and S4. The sum of these values for each alternative is provided in Table 9, which shows that S3 is the best supplier.
Table 9. VIKOR results.
SupplierSiQiRiRanking
S10.536 0.0870.3122
S20.635 0.1130.3743
S30.474 0.0850.2791
S40.785 0.1160.4505
S50.641 0.1160.3794

5. Results and Discussion

We present the following results of our proposed MCDM model that can facilitate low carbon supplier selection in the hotel industry. First, the FDM method was used to identify the consistency of the selection criteria for low carbon suppliers through expert opinions. The threshold value was set to 6.0; the agreed proportion of experts was more than 80%. With this principle, the two criteria, namely, “carbon governance” and “carbon management systems” were excluded, as shown in Table 1. These criteria were used as the basis for selecting the 10 criteria for the selection of low carbon suppliers in the hotel industry, as shown in Figure 3.
Second, the NRM of the criteria was recognized by DEMATEL. The influential relationship within the 10 criteria was revealed. Considering the significance of carbon management in supplier selection, as presented in Table 5, the importance is identified as C6 > C5 > C9 > C3 > C2 > C8 > C7 > C1 > C10 > C4 according to the degree of importance (ri + ci). Contrary to the importance of criteria, energy reduction of food processing (C4), eco-labeling of products (C2), food mile management (C10), and carbon accounting and inventory (C3) are net causers in accordance with the value of difference (rici). As indicated in the causal relationships in Figure 4 and Table 5, C2 affects criteria C1, C3, C5, C6, C7, C8, and C9; C3 affects criteria C5, C6, C7, C8, and C9. Although C4 and C10 are net causers, they have no influence on other criteria in terms of the threshold value, which is less than 0.756. All relationships that met or exceeded the threshold were rendered in boldface, as shown in Table 4, matrix T. By following this principle, Figure 4 depicts the influence map of the 10 mutually interdependent criteria. One-way relationships are represented by dashed lines, while two-way relationships are represented by solid lines. By understanding these influential relationships, managers can focus on the two criteria of eco-labeling of products (C2) and carbon accounting and inventory (C3) to determine how green suppliers are exposed to carbon risk. By following the causal relationship of DEMATEL, managers can clearly understand the criterion to improve the management of low carbon suppliers.
Third, the influential weights of criteria were determined by DANP. In terms of the relative weights of criteria for evaluating carbon performance of suppliers, “carbon reduction targets (C6)” (0.1164), “carbon policy (C5)” (0.1131), and “measures of carbon reduction and energy conservation (C9)” (0.1127) are the top three significant evaluation criteria. To improve the low carbon supply chain, setting the targets of carbon emission reduction is important so suppliers can monitor authentic and measurable progress in addressing climate change. To achieve the targets of carbon reduction, suppliers should launch various climate strategies that include quantitative emission reduction targets for their scopes 1 and 2, and occasionally even scope 3, GHG emissions [34]. Subsequent results show that “measures of carbon reduction (C9)” is the third important criterion. The criterion of carbon policy (C5) is the second most important. While the supplier launches the carbon policy, the company can facilitate carbon management practices by establishing a carbon policy to show its position on carbon emission disclosure, reduction targets, and emission certification, among others [12]. Considering the significant weights of the criteria, managers should select the best and appropriate suppliers through the VIKOR method of the proposed MCDM model. Finally, S3 is selected as best carbon performance of five suppliers.

6. Conclusions and Future Research

To promote low carbon operations in the hotel industry, the selection of suppliers in the field of carbon and energy management is important in achieving the target of the low carbon supply chain. We presented a supply chain-based conceptual framework and an operational model to incorporate carbon management into supplier selection in the hotel industry. By identifying the related criteria of carbon management activities for the proposed framework, which is a hybrid MCDM model, an integration of FDM, DANP, and VIKOR methods was applied in the empirical analysis on a hotel company for selecting low carbon suppliers.
The proposed framework brings several contributes to the evaluation and selection of low carbon suppliers in the hotel industry. First, a new hybrid MCDM model for evaluating suppliers, with emphasis on carbon and energy management, was developed using the FDM method. Such framework with 10 criteria is rare in the previous literature. Second, the DEMATEL method was applied in selecting suppliers in terms of carbon management. DEMATEL proved to be an appropriate method to delineate the structure of a completely interdependent supplier selection problem model and to obtain the problem’s solution. Third, DANP was used to acquire considerable weights of the 10 criteria. The three important criteria, namely, carbon reduction targets, carbon policy, and measures of carbon reduction, were derived. Finally, an empirical study was conducted to demonstrate the application of hybrid MCDM model that combines DANP with VIKOR. The hybrid model also considers both maximum group utility and individual regret to measure the gaps between alternative and ideal solutions, which can enhance the assessment of carbon and energy management of suppliers when quantitative information is lacking. Based on the example, this model has potential advantage in selecting appropriate suppliers for carbon and energy management. A company in the hotel industry intending to facilitate a low carbon supply chain can adopt the presented model or align the suppliers’ carbon management to its needs.
After the findings are discussed with three managers of the case company, carbon and energy management for supplier selection, regarded as an emerging parameter to facilitate low-carbon hotels, is also discussed. Initially, a low-carbon supplier scorecard can be adopted, and this can further integrate supplier evaluation in terms of the 10 criteria within the proposed framework. By incorporating the carbon issue into procurement policies, suppliers will be required to perform a preliminary self-assessment throughout the carbon management questionnaire. The case company can then obtain information on the carbon management capability of its suppliers, and this information would in turn help the suppliers identify and prioritize specific carbon risks. Meanwhile, firms can pay attention to the three criteria on carbon reduction targets (C6), carbon policy (C5), and measures of carbon reduction and energy conservation (C9) to identify how their low-carbon supply chain suppliers are exposed to carbon risk. Finally, firms can launch collaborative training and capability building programs within their suppliers to mitigate carbon risk.
Although the results obtained from this research are satisfactory, there still a room for improvement. The outcome of the carbon performance model with the MCDM method conducted in this study was exclusively determined by eight experts. Increasing the number of participating experts from the hotel industry can give a more generalized model of suppliers’ carbon management, thus paving the way for the mastery of carbon risk. The proposed framework and criteria on low-carbon supplier selection are applicable to the Taiwanese hotel industry; they can also serve as bases for further research on developing carbon management criteria in hotels in different regions or countries. In response to the preference of decision makers in assigning precise numerical values, fuzzy DANP and fuzzy VIKOR can be used in future studies.

Acknowledgments

The authors would like to thank the National Science Council of Taiwan for financially supporting this research under grant NSC 101-2815-C-236-001-H.

Author Contributions

Chia-Wei Hsu is responsible for conducting this research and wrote the paper. Tasi-Chi Kuo contributed to MCDM method and the identification of criteria in the area of carbon management. Guey-Shin Shyu contributed to the revisions and results analysis of manuscript. Pi-Shen Chen contributed to questionnaire development and data analysis.

Conflicts of Interest

The authors declare no conflict of interest.

References

  1. Chan, W.W.; Mak, L.M.; Chen, Y.M.; Wang, Y.H.; Xie, H.R.; Hou, G.Q.; Li, D. Energy saving and tourism sustainability: Solar control window film in hotel rooms. J. Sustain. Tour 2008, 16, 563–574. [Google Scholar] [CrossRef]
  2. Filimonau, V.; Dickinson, J.; Robbins, D.; Huijbregts, M.A. Reviewing the carbon footprint analysis of hotels: Life Cycle Energy Analysis (LCEA) as a holistic method for carbon impact appraisal of tourist accommodation. J. Cleaner Prod. 2011, 19, 1917–1930. [Google Scholar] [CrossRef]
  3. Su, Y.P.; Hall, C.M.; Ozanne, L. Hospitality industry responses to climate change: A benchmark study of Taiwanese tourist hotels. Asia Pac. J. Tour Res. 2013, 18, 92–107. [Google Scholar]
  4. Wu, X.; Rajagopalan, P.; Lee, S.E. Benchmarking energy use and greenhouse gas emissions in Singapore’s hotel industry. Energy Policy 2010, 38, 4520–4527. [Google Scholar] [CrossRef]
  5. Teng, C.C.; Horng, J.S.; Hu, M.L.M.; Chien, L.H.; Shen, Y.C. Developing energy conservation and carbon reduction indicators for the hotel industry in Taiwan. Int. J. Hosp. Manag. 2012, 31, 199–208. [Google Scholar] [CrossRef]
  6. Stohl, A. The travel-related carbon dioxide emissions of atmospheric researchers. Atmos. Chem. Phys. 2008, 8, 6499–6504. [Google Scholar] [CrossRef]
  7. Chan, W. Energy benchmarking in support of low carbon hotels: Developments, challenges, and approaches in China. Int. J. Hosp. Manag. 2012, 31, 1130–1142. [Google Scholar] [CrossRef]
  8. Taiwan Green Productivity Foundation. (Taipei, Taiwan). The list of high-energy users in Taiwanese hospitality industry. Personal communication, 2010. [Google Scholar]
  9. The Greenhouse Gas Protocol Initiative—Scope 3 Accounting and Reporting Standard. Available online: http://www.ghgprotocol.org/files/ghgp/public/ghg-protocol-scope-3-standard-draft-for-stakeholder-review-november-2009.pdf (accessed on 29 January 2014).
  10. Sundarakani, B.; de Souza, R.; Goh, M.; Wagner, S.M.; Manikandan, S. Modeling carbon footprints across the supply chain. Inter. J. Prod. Econo. 2010, 128, 43–50. [Google Scholar] [CrossRef]
  11. Wittneben, B.F.; Kiyar, D. Climate change basics for managers. Manag. Decis. 2009, 47, 1122–1132. [Google Scholar] [CrossRef]
  12. Carbon Disclosure Project (CDP). Supply Chain Report 2010. Available online: https://www.cdp.net/CDPResults/CDP-Supply-Chain-Report_2010.pdf (accessed on 29 January 2014).
  13. Choi, T.M. Local sourcing and fashion quick response system: The impacts of carbon footprint tax. Transp. Res. Part E-Logist. Transp. Rev. 2013, 55, 43–54. [Google Scholar] [CrossRef]
  14. Choi, T.M. Carbon footprint tax on fashion supply chain systems. Int. J. Adv. Manuf. Technol. 2013, 68, 835–847. [Google Scholar] [CrossRef]
  15. Hua, G.; Cheng, T.C.E.; Wang, S. Managing carbon footprints in inventory management. Int. J. Prod. Econ. 2011, 132, 178–185. [Google Scholar] [CrossRef]
  16. Gemechu, E.D.; Butnar, I.; Llop, M.; Castells, F. Environmental tax on products and services based on their carbon footprint: A case study of the pulp and paper sector. Energy Policy 2012, 50, 336–344. [Google Scholar] [CrossRef]
  17. Bonilla-Priego, M.; Najera, J.J.; Font, X. Environmental management decision-making in certified hotels. J. Sustain. Tour. 2011, 19, 361–381. [Google Scholar] [CrossRef]
  18. Accor Procurement Charter 21. Available online: http://www.accor.com/fileadmin/user_upload/Contenus_Accor/Developpement_Durable/img/PLANET_21/docs/EN/procurement_charter_21.pdf (accessed on 29 January 2014).
  19. Dou, Y.; Sarkis, J. A joint location and outsourcing sustainability analysis for a strategic offshoring decision. Int. J. Prod. Res. 2010, 48, 567–592. [Google Scholar] [CrossRef]
  20. Hsu, C.W.; Kuo, T.C.; Chen, S.H.; Hu, A.H. Using DEMATEL to develop a carbon management model of supplier selection in green supply chain management. J. Cleaner Prod. 2013, 56, 164–172. [Google Scholar] [CrossRef]
  21. Le, T.P.N.; Lee, T.R. Model selection with considering the CO2 emission alone the global supply chain. J. Intell. Manuf. 2013, 24, 653–672. [Google Scholar] [CrossRef]
  22. Lee, K.H. Integrating carbon footprint into supply chain management: The case of Hyundai Motor Company (HMC) in the automobile industry. J. Cleaner Prod. 2011, 19, 1216–1223. [Google Scholar] [CrossRef]
  23. Schoenherr, T.; Modi, S.B.; Benton, W.C.; Carter, C.R.; Choi, T.Y.; Larson, P.D.; Leenders, M.R.; Mabert, V.A.; Narasimhan, R.; Wagner, S.M. Research opportunities in purchasing and supply management. Int. J. Prod. Res. 2012, 50, 4556–4579. [Google Scholar] [CrossRef]
  24. Shaw, K.; Shankar, R.; Yadav, S.S.; Thakur, L.S. Supplier selection using fuzzy AHP and fuzzy multi-objective linear programming for developing low carbon supply chain. Expert Syst. Appl. 2012, 39, 8182–8192. [Google Scholar] [CrossRef]
  25. Lee, A.M.I.; Kang, H.Y.; Lin, C.Y.; Wu, H.W. An evaluation model for green and low-carbon suppliers. In Proceedings of the 9th International Conference on Informatics in ControlAutomation and Robotics (ICINCO 2012), Rome, Italy, 28–31 July 2012; SciTePress: Odense, Denmark; pp. 604–608.
  26. Peng, J. Research on the optimization of green suppliers based on AHP and GRA. J. Inf. Comput. Sci. 2012, 9, 173–182. [Google Scholar]
  27. Choi, T.M. Optimal apparel supplier selection with forecast updates under carbon emission taxation scheme. Comput. Oper. Res. 2013, 40, 2646–2655. [Google Scholar] [CrossRef]
  28. Huang, S.; Keskar, H. Comprehensive and configurable metrics for supplier selection. Int. J. Prod. Econ. 2007, 105, 510–523. [Google Scholar] [CrossRef]
  29. Liaoa, Z.; Rittscherb, J. A multi-objective supplier selection model under stochastic demand conditions. Int. J. Prod. Econ. 2007, 105, 150–159. [Google Scholar] [CrossRef]
  30. ISO 50001:2011—Energy Management Systems—Requirements with Guidance for Use. Available online: http://www.iso.org/iso/catalogue_detail?csnumber=51297 (accessed on 29 January 2014).
  31. Butler, J. The compelling “hard case” for “green” hotel development. Cornell Hosp. Q. 2008, 49, 234–244. [Google Scholar] [CrossRef]
  32. Sanchez, M.C.; Brown, R.E.; Webber, C.; Homan, G.K. Savings estimates for the United States Environmental Protection Agency’s ENERGY STAR voluntary product labeling program. Energy Policy 2008, 36, 2098–2108. [Google Scholar] [CrossRef]
  33. Kolk, A.; Pinkse, J. Market strategies for climate change. Eur. Manag. J. 2004, 22, 304–314. [Google Scholar] [CrossRef]
  34. Cogan, D.; Good, M.; Kantor, G.; McAteer, E. Corporate Governance and Climate Change: Consumer and Technology Companies; Ceres: Boston, MA, USA, 2008. [Google Scholar]
  35. Lee, W.; Okos, M.R. Sustainable food processing systems—Path to a zero discharge: Reduction of water, waste and energy. Procedia Food Sci. 2011, 1, 1768–1777. [Google Scholar] [CrossRef]
  36. Okos, M.; Rao, N.; Drecher, S.; Rode, M.; Kozak, J. Energy usage in the food industry. Available online: http://www.aceee.org/research-report/ie981 (accessed on 29 January 2014).
  37. Fritzson, A.; Berntsson, T. Energy efficiency in the slaughter and meat processing industry-opportunities for improvements in future energy markets. J. Food Eng. 2006, 77, 792–802. [Google Scholar] [CrossRef]
  38. Ates, S.A.; Durakbasa, N.M. Evaluation of corporate energy management practices of energy intensive industries in Turkey. Energy 2012, 45, 81–91. [Google Scholar] [CrossRef]
  39. Weinhofer, G.; Hoffmann, V.H. Mitigating climate change—How do corporate strategies differ? Bus. Strateg. Env. 2008, 19, 77–89. [Google Scholar]
  40. Kannan, R.; Boie, W. Energy management practices in SMEs case study of a bakery in Germany. Energy Conv. Manag. 2003, 44, 945–959. [Google Scholar] [CrossRef]
  41. International Tourism Partnership. Going Green: Minimum Standards towards a Sustainable Hotel; International Tourism Partnership: London, UK, 2008. [Google Scholar]
  42. Scott, D.; Becken, S. Adapting to climate change and climate policy: Progress, problems and potentials. J. Sustain. Tour. 2010, 18, 283–295. [Google Scholar] [CrossRef]
  43. Okereke, C. An exploration of motivations, drivers and barriers to carbon management: The UK FTSE 100. Eur. Manag. J. 2007, 25, 475–486. [Google Scholar] [CrossRef]
  44. Boiral, O. Global warming: Should companies adopt a proactive strategy? Long Range Plan. 2006, 39, 315–330. [Google Scholar] [CrossRef]
  45. Jeswani, H.K.; Wehrmeyer, W.; Mulugetta, Y. How warm is the corporate response to climate change? Evidence from Pakistan and the UK. Bus. Strateg. Environ. 2008, 1, 46–60. [Google Scholar]
  46. Department for Environment, Food and Rural Affairs. The validity of food miles as an indicator of sustainable development. Available online: http://archive.defra.gov.uk/evidence/economics/foodfarm/reports/documents/foodmile.pdf (accessed on 29 January 2014).
  47. Gössling, S.; Garrod, B.; Aall, C.; Hille, J.; Peeters, P. Food management in tourism: Reducing tourism’s carbon “footprint”. Tour. Manag. 2011, 32, 534–543. [Google Scholar] [CrossRef]
  48. Pratt, S. Minimising food miles: Issues and outcomes in an ecotourism venture in Fiji. J. Sustain. Tour. 2013, 21, 1148–1165. [Google Scholar] [CrossRef]
  49. Landeta, J. Current validity of the Delphi method in social sciences. Technol. Forecast. Soc. 2006, 73, 467–482. [Google Scholar] [CrossRef]
  50. Dalkey, N.; Helmer, O. An experimental application of the Delphi method to the use of experts. Manag. Sci. 1963, 9, 458–467. [Google Scholar]
  51. Hwang, C.L.; Lin, M.J. Group Decision Making under Multiple Criteria: Methods and Applications; Springer-Verlag: Berlin/Heidelberg, Germany, 1987. [Google Scholar]
  52. Ishikawa, A.; Amagasa, M.; Shiga, T.; Tomizawa, G.; Tatsuta, R.; Mieno, H. The max-min Delphi method and fuzzy Delphi method via fuzzy integration. Fuzzy. Set Syst. 1993, 55, 241–253. [Google Scholar] [CrossRef]
  53. Shen, Y.C.; Chang, S.H.; Lin, G.T.R.; Yu, H.C. A hybrid selection model for emerging technology. Technol. Forecast. Soc. 2010, 77, 151–166. [Google Scholar] [CrossRef]
  54. Chang, P.T.; Huang, L.C.; Lin, H.J. The fuzzy Delphi method via fuzzy statistics and membership function fitting and an application to the human resources. Fuzzy Set Syst. 2000, 112, 511–520. [Google Scholar]
  55. Murray, T.J.; Pipino, L.L.; van Gigch, J.P. A pilot study of fuzzy set modification of Delphi. Human Sys. Manag. 1985, 5, 76–80. [Google Scholar]
  56. Kaufmann, A.; Gupta, M. Fuzzy Mathematical Models in Engineering and Management Science; Elsevier: New York, NY, USA, 1988. [Google Scholar]
  57. Lee, A.H.I.; Wang, W.M.; Lin, T.Y. An evaluation framework for technology transfer of new equipment in high technology industry. Technol. Forecast. Soc. 2010, 77, 135–150. [Google Scholar] [CrossRef]
  58. Kuo, Y.F.; Chen, P.C. Constructing performance appraisal indicators for mobility of the service industries using Fuzzy Delphi Method. Expert Syst. Appl. 2008, 35, 1930–1939. [Google Scholar] [CrossRef]
  59. Hu, A.H.; Chen, L.T.; Hus, C.W.; Ao, J.G. An evaluation framework for scoring corporate sustainability reports in Taiwan. Environ. Eng. Sci. 2011, 28, 843–858. [Google Scholar] [CrossRef]
  60. Wei, W.L.; Chang, W.C. Analytic network process based model for selecting an optimal product design solution with zero-one goal programming. J. Eng. Design 2008, 19, 15–44. [Google Scholar] [CrossRef]
  61. Wu, W.W.; Lee, Y.T. Developing global managers’ competencies using the fuzzy DEMATEL method. Expert Syst. Appl. 2007, 32, 499–507. [Google Scholar] [CrossRef]
  62. Chiu, Y.J.; Chen, H.C.; Tzeng, G.H.; Shyu, J.Z. Marketing strategy based on customer behaviour for the LCD-TV. Int. J. Manag. Decis. Making 2006, 7, 143–165. [Google Scholar]
  63. Hori, S.; Shimizu, Y. Designing methods of human interface for supervisory control systems. Control Eng. Pract. 1999, 7, 1413–1419. [Google Scholar]
  64. Rahman, S.; Subramanian, N. Factors for implementing end-of-life computer recycling operations in reverse supply chains. Int. J. Prod. Econ. 2012, 140, 239–248. [Google Scholar] [CrossRef]
  65. Wu, W.W.; Lan, W.L.; Lee, Y.T. Exploring decisive factors affecting an organization’s SaaS adoption: A case study. Int. J. Inform. Manag. 2011, 31, 556–563. [Google Scholar] [CrossRef]
  66. Hsu, Y.L.; Li, W.C.; Chen, K.W. Structuring critical success factors of airline safety management system using a hybrid model. Transp. Res. Part E-Logist. Transp. Rev. 2010, 46, 222–235. [Google Scholar] [CrossRef]
  67. Chen, F.H.; Hsu, T.S.; Tzeng, G.H. A balanced scorecard approach to establish a performance evaluation and relationship model for hot spring hotels based on a hybrid MCDM model combining DEMATEL and ANP. Int. J. Hosp. Manag. 2011, 30, 908–932. [Google Scholar] [CrossRef]
  68. Gabus, A.; Fontela, E. World Problems, an Invitation to Further Thought within the Framework of DEMATEL; Batelle Geneva Research Center: Geneva, Switzerland, 1972. [Google Scholar]
  69. Liou, J.H.; Tzeng, G.H.; Chang, H.C. Airline safety measurement using a novel hybrid model. J. Air Transp. Manag. 2007, 13, 243–249. [Google Scholar] [CrossRef]
  70. Tzeng, G.H.; Chiang, C.H.; Li, C.W. Evaluating intertwined effects in elearning programs: A novel hybrid MCDM model based on factor analysis and DEMATEL. Expert Syst. Appl. 2007, 32, 1028–1044. [Google Scholar] [CrossRef]
  71. Yang, J.L.; Tzeng, G.H. An integrated MCDM technique combined with DEMATEL for a novel cluster-weighted with ANP method. Expert Syst. Appl. 2011, 38, 1417–1424. [Google Scholar] [CrossRef]
  72. Huang, J.J.; Tzeng, G.H.; Ong, C.S. Multidimensional data in multidimensional scaling using the analytic network process. Pattern Recognit. Lett. 2005, 26, 755–767. [Google Scholar] [CrossRef]
  73. Hung, Y.H.; Huang, T.L.; Hsieh, J.C.; Tsuei, H.J.; Cheng, C.C.; Tzeng, G.H. Online reputation management for improving marketing by using a hybrid MCDM model. Knowl.-Based Syst. 2012, 35, 87–93. [Google Scholar] [CrossRef]
  74. Chiu, W.Y.; Tzeng, G.H.; Li, H.L. A new hybrid MCDM model combining DANP with VIKOR to improve e-store business. Knowl.-Based Syst. 2013, 37, 48–61. [Google Scholar] [CrossRef]
  75. Hsu, C.H.; Wang, F.K.; Tzeng, G.H. The best vendor selection for conducting the recycled material based on a hybrid MCDM model combining DANP with VIKOR. Resour. Conserv. Recycl. 2012, 66, 95–111. [Google Scholar] [CrossRef]
  76. Ou Yang, Y.P.; Shieh, H.M.; Leu, J.D.; Tzeng, G.H. A novel hybrid MCDM model combined with DEMATEL and ANP with applications. Int. J. Oper. Res. 2008, 5, 160–168. [Google Scholar]
  77. Liu, C.H.; Tzeng, G.H.; Lee, M.H. Improving tourism policy implementation—The use of hybrid MCDM models. Tour. Manag. 2012, 33, 413–426. [Google Scholar]
  78. Tsai, W.H.; Chou, W.C.; Lai, C.W. An effective evaluation model and improvement analysis for national park websites: A case study of Taiwan. Tour. Manag. 2010, 31, 936–952. [Google Scholar] [CrossRef]
  79. Opricovic, S. Multicriteria Optimization of Civil Engineering Systems; Faculty of Civil Engineering, Belgrade: Belgrade, Serbia, 1998; pp. 5–21. [Google Scholar]
  80. Opricovic, S.; Tzeng, G.H. Compromise solution by MCDM methods: A comparative analysis of VIKOR and TOPSIS. Eur. J. Oper. Res. 2004, 156, 445–455. [Google Scholar] [CrossRef]
  81. Opricovic, S.; Tzeng, G.H. Extended VIKOR method in comparison with outranking methods. Eur. J. Oper. Res. 2007, 178, 514–529. [Google Scholar] [CrossRef]
  82. Liou, J.J.; Chuang, Y.T. Developing a hybrid multi-criteria model for selection of outsourcing providers. Expert Syst. Appl. 2010, 37, 3755–3761. [Google Scholar] [CrossRef]
  83. Tzeng, G.H.; Teng, M.H.; Chen, J.J.; Opricovic, S. Multicriteria selection for a restaurant location in Taipei. Int. J. Hosp. Manag. 2002, 21, 171–187. [Google Scholar]

