A Benchmarking System for Domestic Water Use

Department of Civil Engineering, College of Engineering and Physical Sciences, University of Birmingham, Birmingham, West Midlands B15 2TT, UK
*
Author to whom correspondence should be addressed.
Sustainability 2014, 6(5), 2993-3018; https://doi.org/10.3390/su6052993
Submission received: 30 January 2014
/
Revised: 7 May 2014
/
Accepted: 9 May 2014
/
Published: 19 May 2014
(This article belongs to the Special Issue Towards Sustainability: Selected Papers from the Third World Sustainability Forum (2013))
Abstract
:The national demand for water in the UK is predicted to increase, exacerbated by a growing UK population, and home-grown demands for energy and food. When set against the context of overstretched existing supply sources vulnerable to droughts, particularly in increasingly dense city centres, the delicate balance of matching minimal demands with resource secure supplies becomes critical. When making changes to “internal” demands the role of technological efficiency and user behaviour cannot be ignored, yet existing benchmarking systems traditionally do not consider the latter. This paper investigates the practicalities of adopting a domestic benchmarking system (using a band rating) that allows individual users to assess their current water use performance against what is possible. The benchmarking system allows users to achieve higher benchmarks through any approach that reduces water consumption. The sensitivity of water use benchmarks are investigated by making changes to user behaviour and technology. The impact of adopting localised supplies (i.e., Rainwater harvesting—RWH and Grey water—GW) and including “external” gardening demands are investigated. This includes the impacts (in isolation and combination) of the following: occupancy rates (1 to 4); roof size (12.5 m2 to 100 m2); garden size (25 m2 to 100 m2) and geographical location (North West, Midlands and South East, UK) with yearly temporal effects (i.e., rainfall and temperature). Lessons learnt from analysis of the proposed benchmarking system are made throughout this paper, in particular its compatibility with the existing Code for Sustainable Homes (CSH) accreditation system. Conclusions are subsequently drawn for the robustness of the proposed system.
1. Introduction
The World Economic Forum’s Risk 2014 identified “water supply crisis” as the third highest risk impact (behind fiscal crises and structurally high unemployment) facing the world over the next twenty years [1]. Within this time period national UK demand for potable (i.e., drinkable quality) domestic mains water, ultimately requiring wastewater treatment, will increase as the population grows from 63.7 million in mid-2012 to a projected figure of 73 million in 2035 [2]. With unabated domestic demands (estimated currently to be 150 L/person/day) an extra 10 million customers would increase daily UK supply requirements by at least 1.5 billion litres. This would reduce to 1.3 billion litres if the demands were reduced to 130 l/d, as proposed in UK Water policy [3]. When set against the context of overstretched existing supply sources, the water-energy-food nexus, vulnerability to droughts and leakage (exacerbated by an ageing water infrastructure system) the delicate balance of matching minimal demands with resource secure supplies within a Sustainable Water Management (SWM) plan, particularly in increasingly dense city centres, becomes critical. (SWM is defined here simply as “The ability of current generations to responsibly manage water resources without detrimentally impacting upon the planet whilst taking account of the needs of both present and future users.”).Clearly water demand reduction is one strategy within SWM to help reduce the 1.5 billion litre daily deficit and one fully endorsed by UK Sustainability rating systems such as British Research Environmental Assessment Method (BREEAM) and the Code for Sustainable Homes (CSH)—the later, being aimed specifically at domestic buildings [4]. Each of these systems requires use of sustainability indicators and metrics, of which there are many, to define and measure performance moving us steadily towards a more sustainable future [5,6,7]. Here, the performance indicator is “potable mains water use” and typically for domestic properties two water-use metrics are adopted; one specifies how many litres are consumed per person (L/person) while the other specifies litres required per square metre of property per year (L/m2). A benchmark sets a target and thereby allows us to move from where we are now to where we want to be (in terms of sustainable water-use performance). In terms of domestic water benchmarking an appropriate indicator would also show how much water is being consumed (Litres) by whom (person) and a specified time period (day). The benchmarks set currently in Code for Sustainable Homes (CSH), the UK’s premier benchmarking system for domestic water use, go beyond the 130 L/person/day by 2030 set by Defra (Department for Environment, Food and Rural Affairs), they are:
- <80 L/person/day for Levels 5 and 6 (the best performing benchmarks);
- <105 L/person/day for Levels 3 and 4 (mid-range benchmark);
- <125 L/person/day for Levels 1 and 2 (lowest performing benchmarks).
These are appropriate levels for urban city living and the use of a “per person” measure instead of a “per m2” measure is appropriate given the human element of water use—after all an empty city property does not of its own consume water (unless leaks ensue). Unfortunately strict criteria are given for how these levels are achieved in the short-term through adoption of water efficient appliances. They do not however consider long-term use once this level has been assigned. Moreover, Hunt et al. have suggested that the amount of water resources consumed within the home are equally influenced by the technologies that are adopted (i.e., their technological efficiency) and how they are used (i.e., user behaviour) [8]. Therefore a better understanding of these influences with respect to water benchmarking should be considered. If we pose two questions this highlights very quickly the shortfall of existing benchmarking systems like CSH and the thinking behind this paper; Q1. Which of (A) to (D) uses least water? Q2. Which one is accredited under the benchmarking system “code for sustainable homes”?
- A.
- 8 min in a highly water efficient shower;
- B.
- 4 min in a standard shower;
- C.
- 2 min in a power shower;
- D.
- 30 min in a quarter filled 230 L bath.
The answer is they all use the same volume of water, however, only A receives accreditation in CSH. Therefore benchmarking and accreditation in the UK is more readily focused on technology adoption as opposed to water use per se. This paper questions whether this goes far enough and whether it subsequently provides a robust platform for future city water considerations.
CSH also provides accreditation for complementing supply-side flows with alternative locally available supply sources such as Rainwater Harvesting systems (RWH—collection of rainwater from impermeable surfaces for use in WC flushing and washing machines [9]) and Grey water recycling systems (GW—water collected from baths, showers and basins for use in WC flushing and first rinse on washing machines [10,11]). In CSH, achievement of Levels 5 and 6 requires adoption of GW recycling (for WC flushing) and/or RWH. Some well-known UK examples (e.g., The Lighthouse, [12]) in an aim to reduce potable demands further have adopted both. Unfortunately, within current benchmarking systems like CSH no consideration is made for factors that can affect current and future performance. This means that two systems adopted in the same (or different) locations may perform very differently over time and yet receive the same amount of credits.
It has been reported also that households who enjoy a “green” environment, display high interest in gardening, and as a consequence use more water externally [13]. In CSH these demands are specified as 5 L/person/day [4]. Unfortunately, as an average figure, this takes no account of influencing factors such as time of year; garden size (e.g., the average garden size in the UK is estimated to be anywhere between 50 m2 and 100 m2—although considerably lower in new build in dense urban areas). Neither does it consider water supply (i.e., mains and/or GW and/or RW) and geographical location—that could impact considerably on water performance. All of these examples go some way toward building a case that there could be a significant shortfall within the existing ‘performance’ measuring systems for water. Given the context of increasing demands perhaps a re-conceptualized approach is required.
In the energy sector in a drive to reduce energy demands the EU introduced an energy consumption labelling scheme EU Directive 92/75/EC in 1992 [14], superseded in 2010 by the Energy Performance of Buildings Directive 2010/31/EU (EPBD) [15]. These directives utilize band ratings (A best to G worst) to categorize energy use performance (i.e., energy efficiency) of electrical appliances and “in-use” yearly energy consumption of buildings. A legal requirement exists for all UK domestic properties to have an Energy Performance Certificate (EPC) when sold, built or rented [16]. However, this considers only the heating requirements of the dwelling which is dependent upon the insulating quality of the building structure (e.g., loft and wall insulation, window glazing) and its heating system (e.g., radiators, pumps and boiler). The certification does not consider other energy using technologies (e.g., cold and general household appliances) or user behaviour (how hot the house is kept) and takes no cognizance of actual household energy use (i.e., from a domestic bill), which may be significantly different. This is understandable, as these will vary dramatically with household. Moreover a new band rating would be required when the household structure changes (e.g., children move away) or when new tenants/owners move in. It is difficult therefore to perceive of its feasibility beyond how it is currently applied. The same arguments could be used for water and therefore it is not surprising that a band rating approach has not been considered. Although a more inclusive assessment which aims to reduce resources use further should consider the individual and their energy (or water) use.
This paper investigates the practicalities of adopting a domestic benchmarking system (using a band rating) that allows individual users to assess their current water use performance against what is possible. The benchmarking system allows users to achieve higher benchmarks through any approach that reduces water consumption. This includes user behaviour, technology (in isolation and combination) and use of localised water supplies (i.e., RWH and GW). Section 2 describes the overarching methodology and outlines any assumptions made. The results of a sensitivity analysis are presented in Section 3 where the impact on RWH systems of roof size, location (rainfall), occupancy and garden demands on the band rating system are considered. A broader discussion is then given within Section 4. Lessons learnt from analysis of the proposed benchmarking system are made throughout this paper, in particular its compatibility with the existing code for sustainable homes accreditation system. Conclusions are subsequently drawn for the robustness of the proposed system.
2. Methodology
The four-step methodology is listed below.
- Step 1: Define a benchmarking system (using a band rating approach) for domestic mains water use performance of an individual (Section 2.1);
- Step 2: Five design cases (high to low water use) are developed for an “individuals” domestic demand (Section 2.2):
- The role of “Technological efficiency” and “User behaviour” is identified;
- The respective performance of an individual is plotted within the proposed band rating system and used as the baseline against which the sensitivity analysis (Step 3) is performed.
- Step 3: Sensitivity analysis (Results in Section 3):
- By using the five design cases, the influence on mains water demand and water band rating from using mains, Grey water (GW) and Rainwater harvesting RWH (in isolation and combination) is assessed;
- This includes investigating the influence of changes to:
- i.
- Rainfall in 3 Geographical locations (Midlands, South East, North West);
- ii.
- Roof size (12.5 to 100 m2);
- iii.
- Occupancy rates (1 to 4);
- iv.
- Garden size (25 to 100 m2).
- Step 4: Discussion in light of results (Section 4).The following additional assumptions are made for the domestic property (unless stated otherwise):
- Internal demands only are included;
- 2.4 occupants per household [17];
- Potable demands are met through mains water alone;
- Non-potable demands (including gardening) can be met in four different ways as listed below:
- i.
- Option 1—Mains only supply, for all non-potable needs (i.e., no RWH and/or no GW);
- ii.
- Option 2—GW for WC flushing, first rinse on washing machine and gardening;
- iii.
- Option 3—RWH for WC flushing, washing machine and gardening;
- iv.
- Option 4—GW for WC flushing & RWH for washing machine and gardening.
- A pitched roof for rainwater collection with a 90% runoff coefficient [11];
- Tank(s) are sized according to British Standard BS 8515, 2009 [18]—this uses the lesser of 5% annual rainfall and non-potable demands. It is assumed that an empty tank is installed in January, it has been in operation for at least 12 months, and is filled/emptied assuming a “yield before spillage” approach [19,20,21];
- Rainfall and Temperature data are taken directly from the UK met-office [22] and use average monthly values of rainfall over 25 years (up to 2012) to calculate a daily average supply of rainwater. (n.b. stored water dictates available supply whilst spare capacity dictates flash flood protection, the influences of which can are reported by Hunt et al. [23,24] Consideration of the RWH supplies in July is adopted—this being the driest average month within the UK;
- Garden watering demand is based upon a generic model developed by Food and Agriculture Organization (FAO) [25] by which monthly climatic data are translated into a soil water balance for a given month [26,27]. The availability of water for any given plant type (assumed here to be grassland, flowers and shrubs) is a function of available soil water (root zone for grass is relatively shallow, i.e., <50 mm), rainfall and evapo-transpiration (ET) for each plant type (calculated according to Blaney Criddle method, see Doorenbos and Pruit [28]. ET is influenced by temperature which is, as rainfall, location specific.
2.1. Step 1: Define a Benchmarking System (Using a Band Rating Approach)
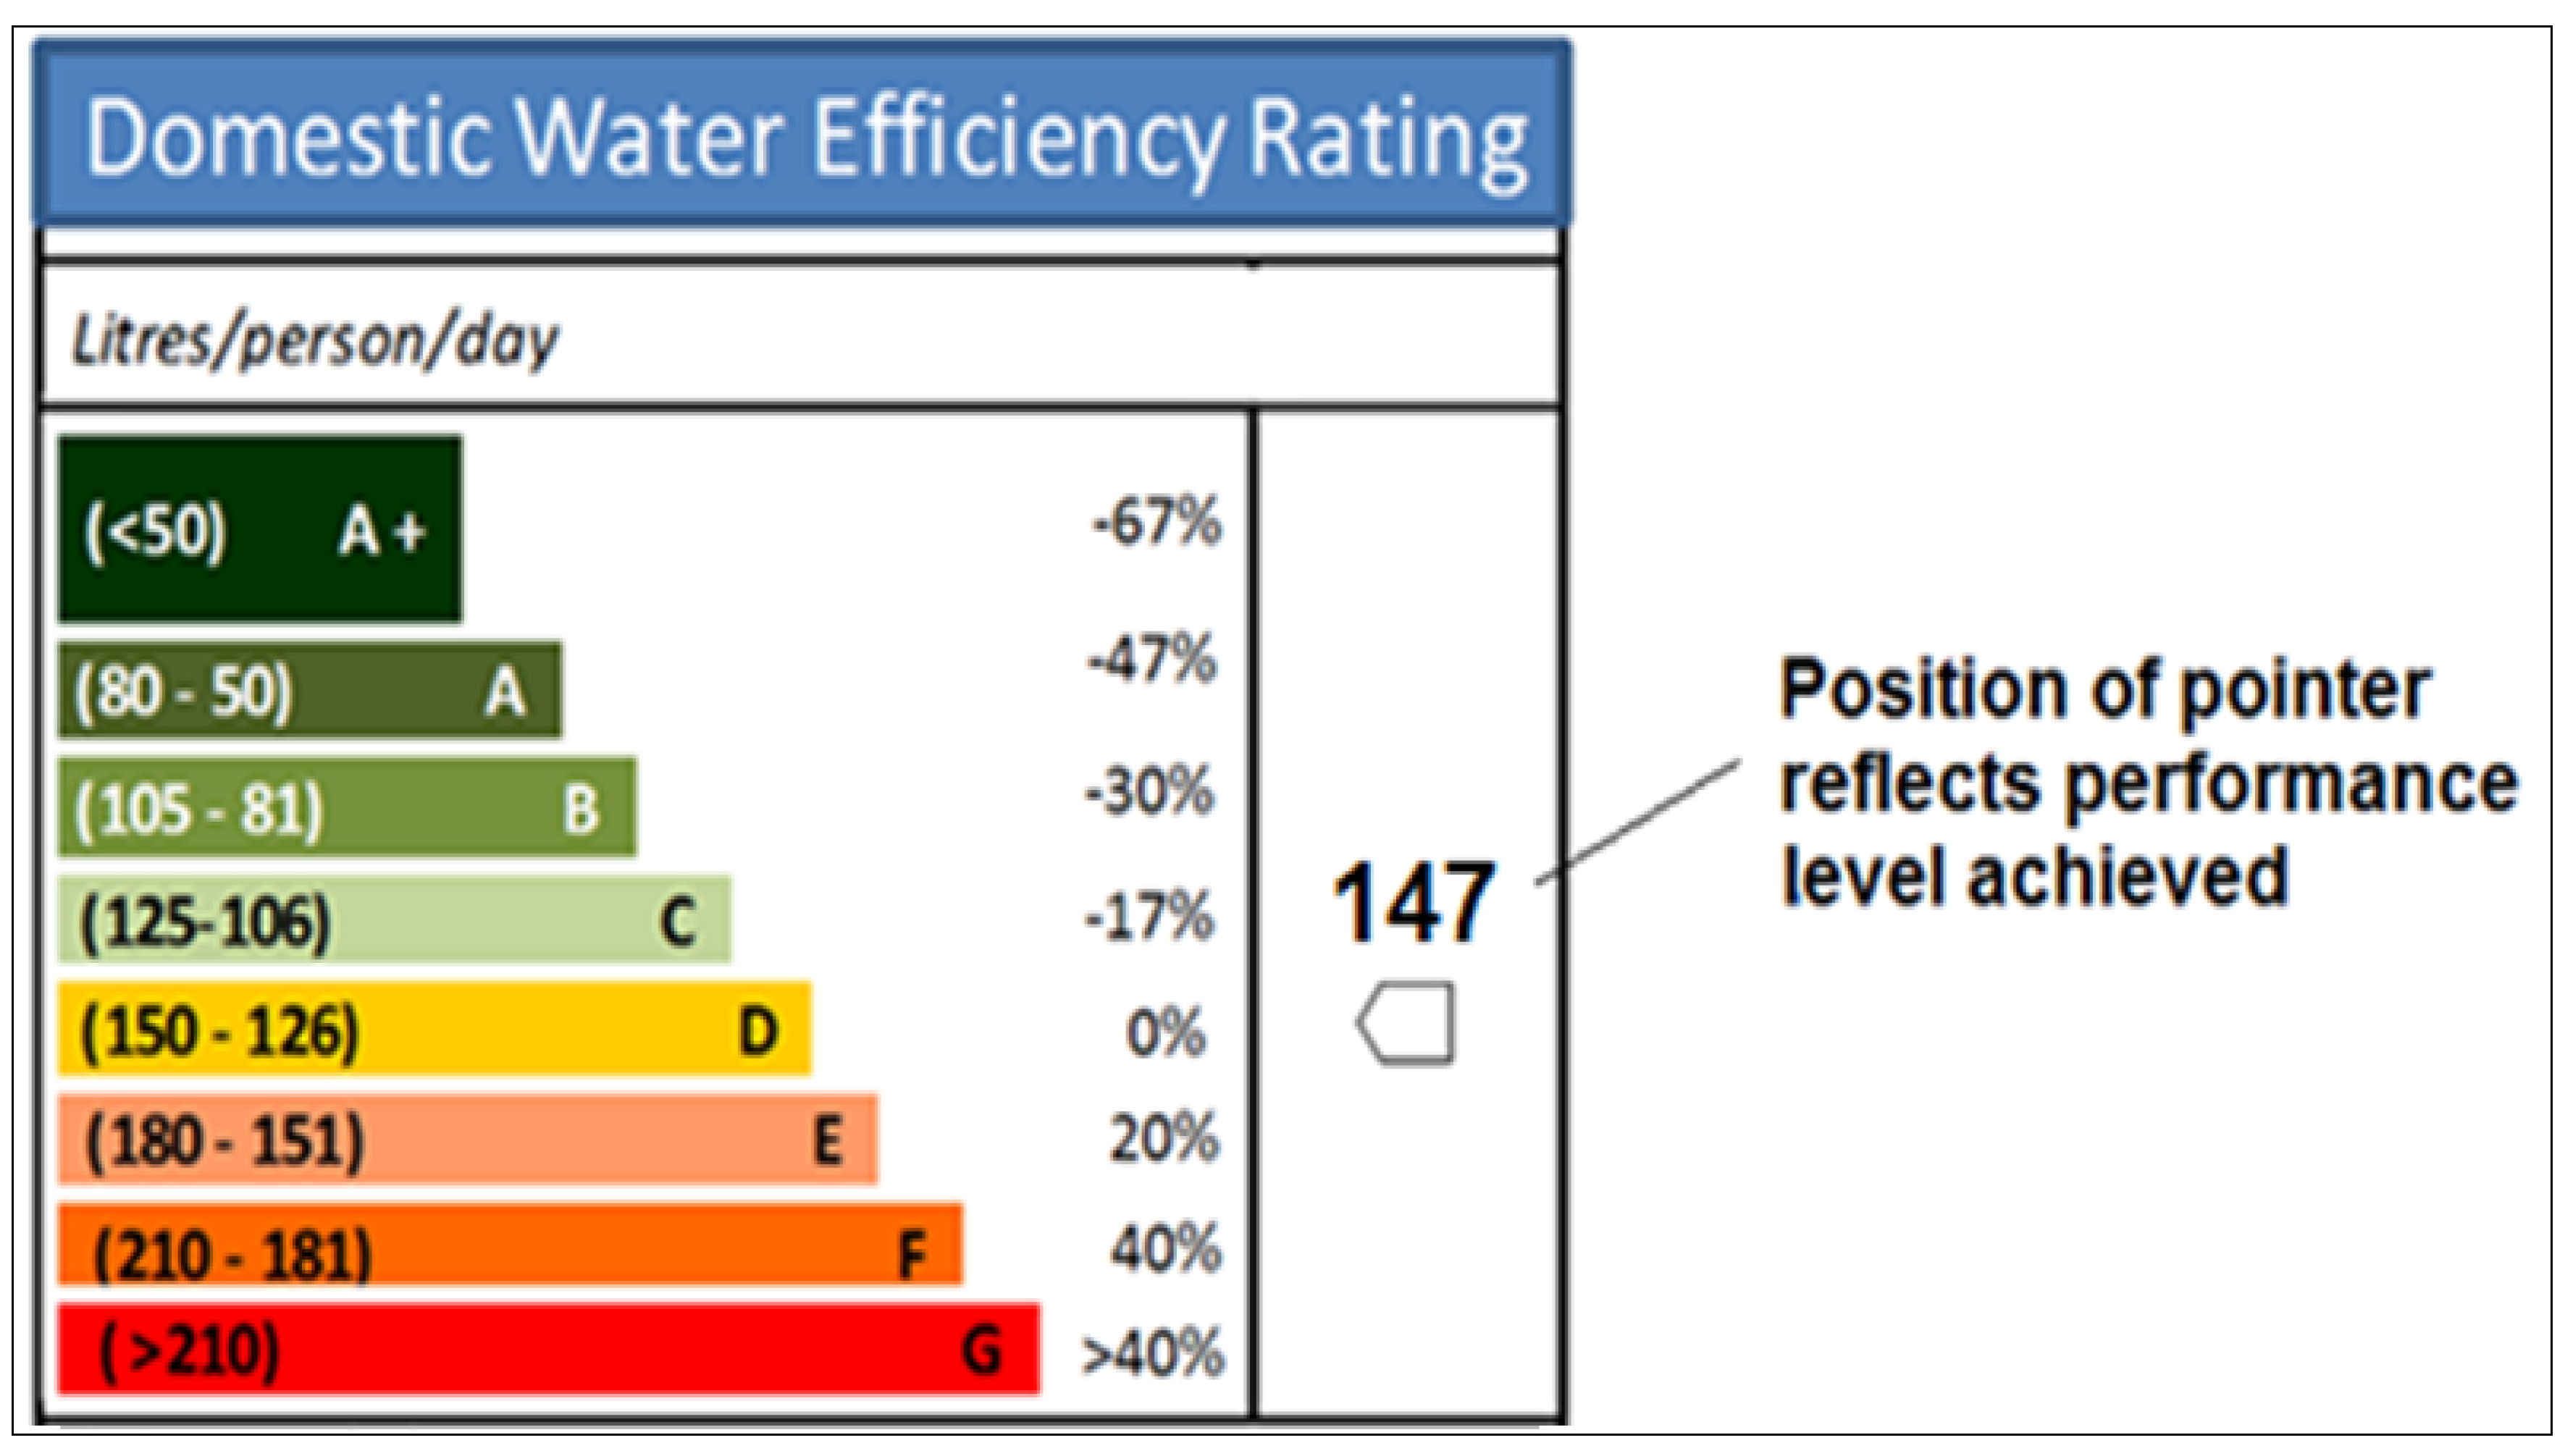
In this step an appropriate benchmarking system (using a band rating approach) is proposed (Figure 1). The band ratings relate to the total daily volume of mains water consumed per person and range from A + (i.e., best performance, up to 67% reduction compared to average UK demand) to G (i.e., worst performance, >40% increase compared to average UK demand). The position of the marker (Level D = 147 L/person/day) shown represents the current UK average. Band ratings A, B and C (and associated performance levels) are aligned directly with levels adopted within CSH, ensuring full compatibility with an accreditation system now widely recognised and accepted by builders and end-users within the UK [7]. For example, the best performing CSH levels (i.e., 5 and 6) require 80 litres (or less) daily consumption per person—this is represented by band A in the proposed band rating system. The demands associated with band levels D to G, are not present in CSH and we contest are a valuable addition as demands can go up (or may already be high), as well as down. In addition band A + pushes the bounds of what could be achieved far beyond CSH levels; <50 L/person/day is wholly appropriate given that it is equivalent to the minimum level required to live, as specified by the UN [29].
Figure 1.
Proposed band ratings.

Notes: 50 L/person/day—minimum required to be lived (UN, 2010), 80 L/person/day—CHS Levels 5 and 6, 105 L/person/day—CSH Levels 3 and 4, 125 L/person/day—CSH Levels 1 and 2 (Department for Communities and Local Government, 2009).
2.2. Step 2: Development of Five Design Cases for Domestic Demand
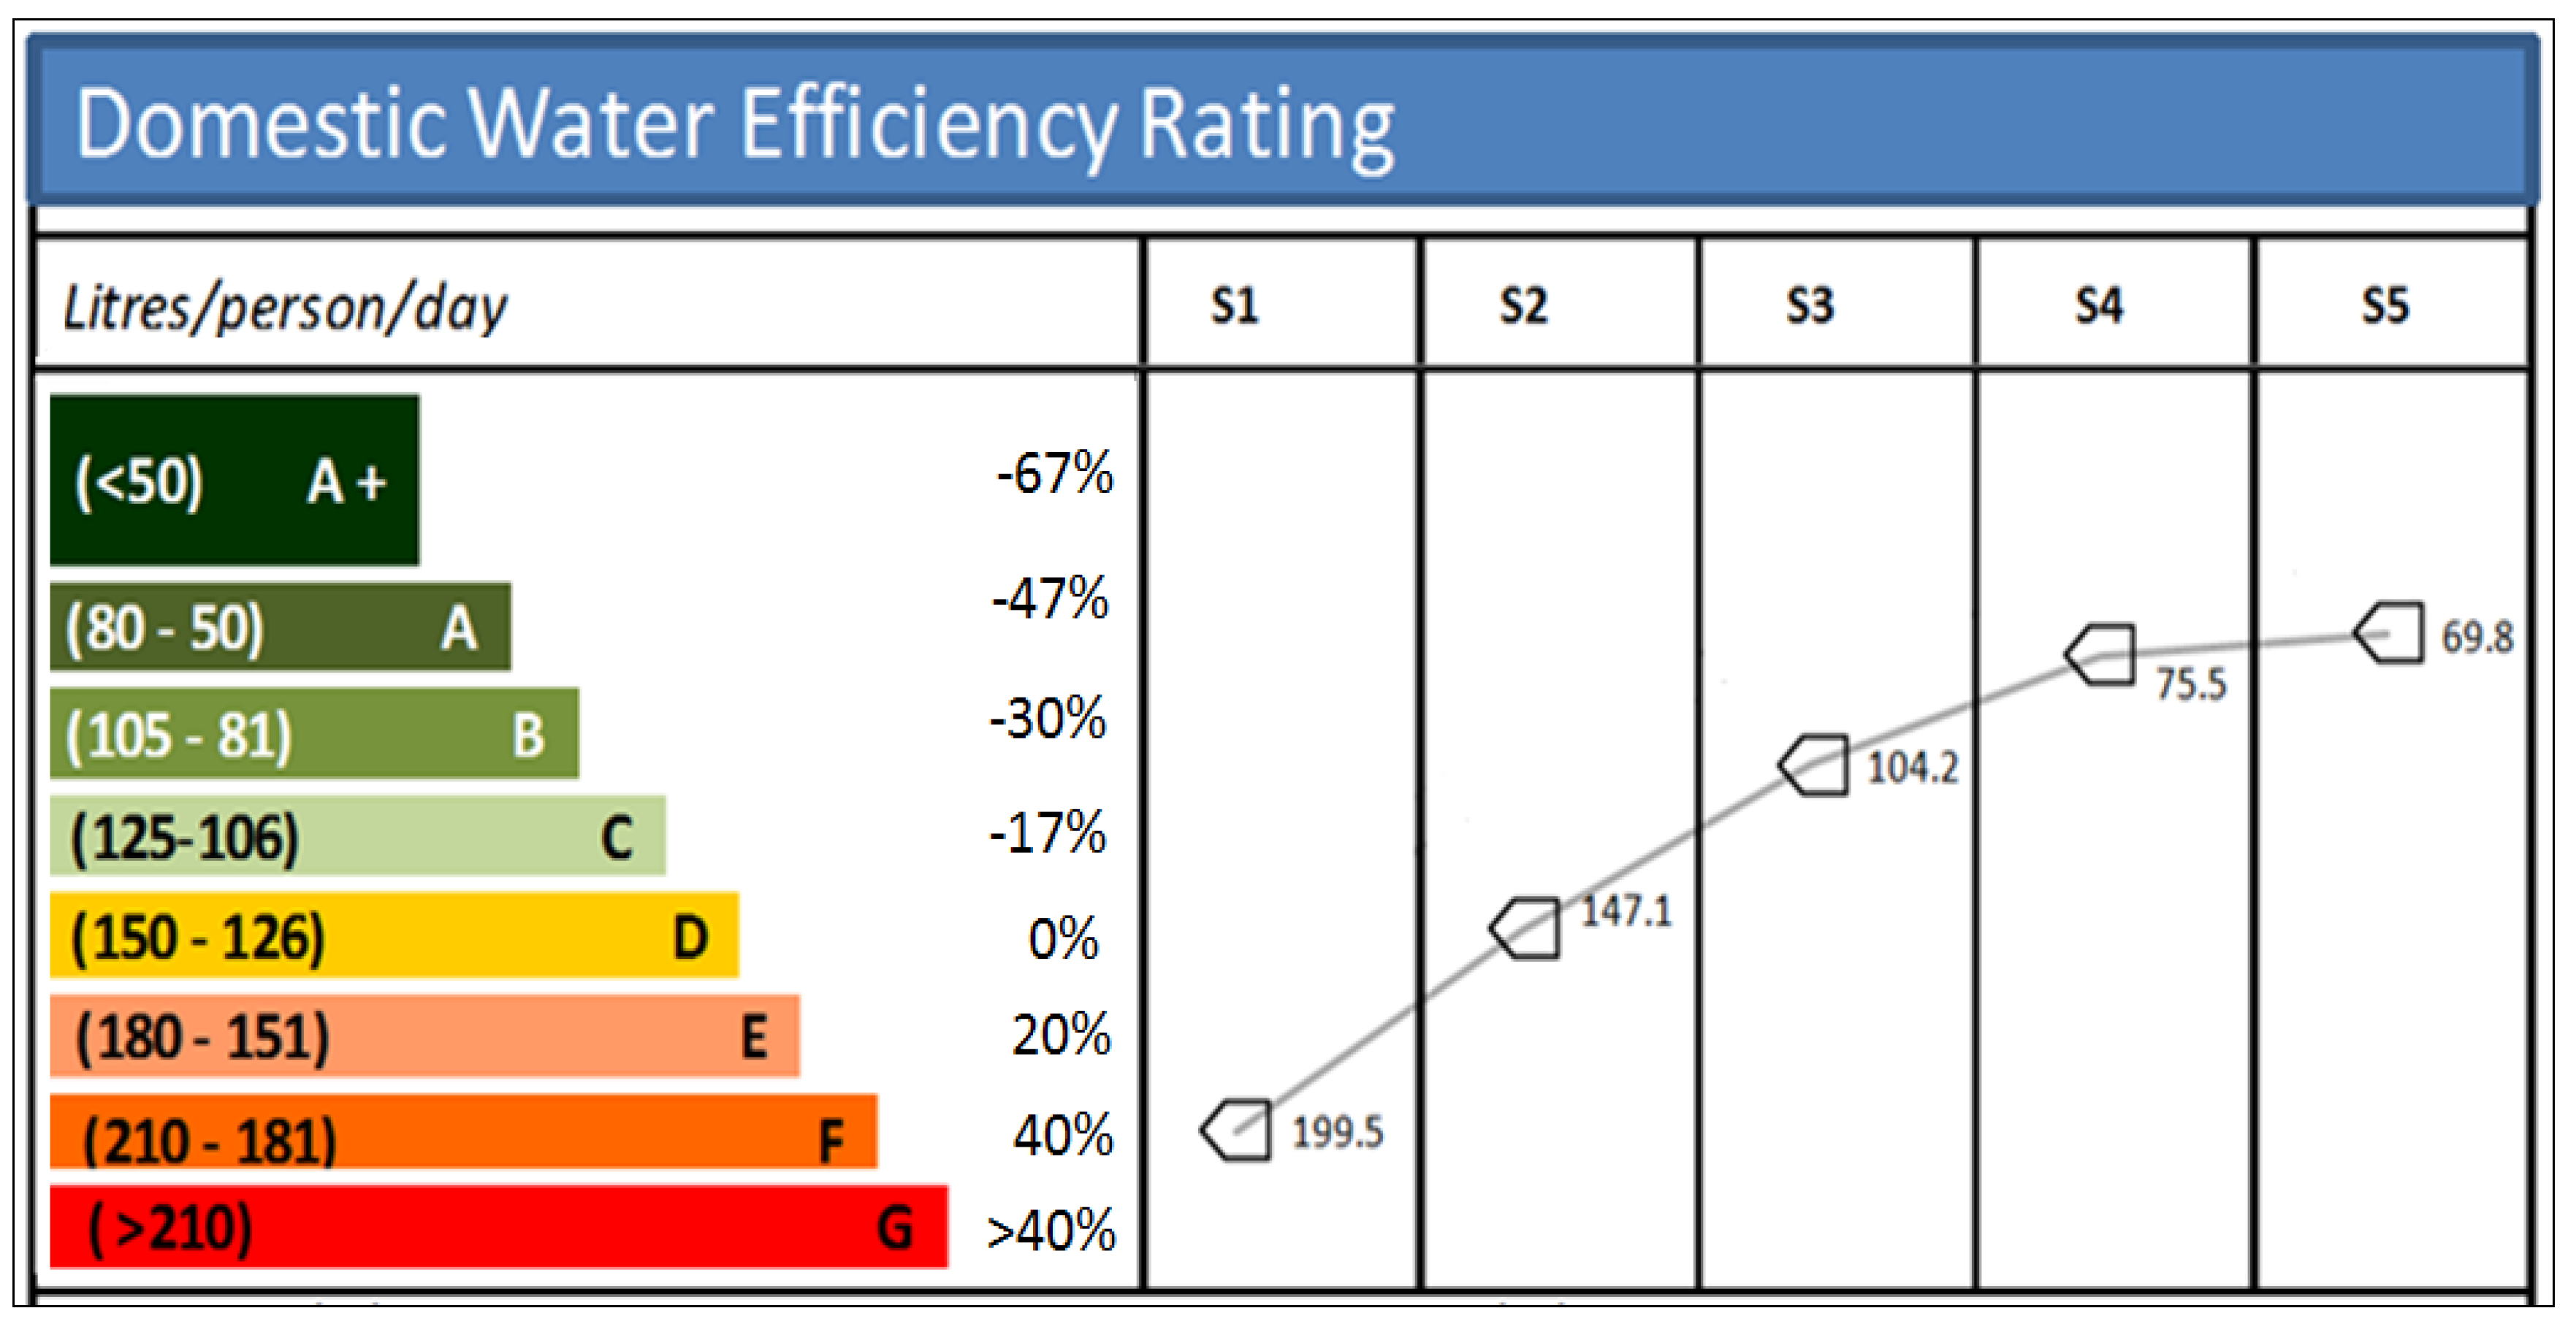
In this step five different design cases (S1 to S5 in Figure 2) are used to represent specified levels of performance that might be achieved (in terms of litres of water consumed per person per day) ranging from high water use (S1) to low water use (S5). In this methodological approach we assume either technological efficiency (2.2.1), a more detailed description of which can be found in [7,30,31], or user behaviour (2.2.2) may change. This is important as improved water-using performance is not currently rewarded in CSH. Zadeh, Rogers and Hunt [31] report on the implications of both changing concurrently, this is not included here. S2 is assumed to be equivalent to the current average water consumption levels in the UK (147 litres/person/day) and represents a baseline against which all other design cases are compared. S1 represents a 33% increase in demands compared to this design case whereas S3 to S5 represent decreases from 30% to 53%. S2 is dependent on S2t (technological efficiency of domestic appliances) multiplied by S2u (user behaviour, i.e., the way they are used). The breakdown for each is shown in Table 1 a, b respectively. This is considered to be the baseline against which changes can be made. For example, the mains water demands in S1 to S5 can be achieved by keeping “user behaviour” constant (i.e, S2u in Table 1b) and by changing “Techological efficiency” values alone (S1t to S2t in Table 1a). Alternatively, the same values can be brought about by keeping “Techological efficiency” constant (i.e., S2t in Table 1a) and by changing values of user behaviour’ alone (S1u to S5u in Table 1a).
Figure 2.
The influence of technologies and user behaviour on band ratings.

Notes: 50 L/person/day—minimum required to be lived (UN, 2010), 80 L/person/day—CHS Levels 5 and 6, 105 L/person/day—CSH Levels 3 and 4, 125 L/person/day—CSH Levels 1 and 2 (Department for Communities and Local Government, 2009).
Table 1.
Parameters used to calculate demand in Design Cases.

| End Use | Units (L—Litres) | Design Case | ||||
|---|---|---|---|---|---|---|
| S1t | S2t | S3t | S4t | S5t | ||
| WC a,b | L/flush | 6 (0) | 6 (0) | 4.5 (−25) | 2.6 (−57) | 2.6 (−57) |
| Shower a,b | L/minute | 24 (+100) | 12 (0) | 8 (−33) | 6 (−50) | 6 (−50) |
| Bath a,b | L | 230 (0) | 230 (0) | 116(−50) | 97 (−58) | None (−100) |
| Dishwasher b | L/setting | 1 (0) | 1 (0) | 0.67 (−33) | 0.67 (−33) | None (−100) |
| Washing machine b | L/kg | 13 (0) | 13 (0) | 10 (−23) | 6.1 (−53) | 6.1 (−53) |
| Sink a * | L/day | 10.4 (0) | 10.4 (0) | 10.4 (0) | 10.4 (0) | 10.4 (0) |
| Basin a * | L/day | 1.7 (0) | 1.7 (0) | 1.7 (0) | 1.7 (0) | 1.7 (0) |
| End Use | Units (P—person) | Design Case | ||||
|---|---|---|---|---|---|---|
| S1u | S2 u | S3 u | S4 u | S5 u | ||
| WC | Flushes/p/day | 4.42 (0) | 4.42 (0) | 3.31 (−25) | 1.90 (−57) | 1.90 (−57) |
| Shower | Minutes/p/day | 8.74 a (+100) | 4.37 b (0) | 2.93 c(−33 | 2.19 d(−50) | 2.5 (−50) |
| Bath | Capacity/p/day | 0.11e (0) | 0.11 (0) | 0.06 (−50) | 0.05 (−58) | None (−100) |
| Dishwasher | Use/ps/p/day f | 3.6 (0) | 3.6 (0) | 2.4 (33) | 2.4 (33) | None (100) |
| Washing machine | Use/p/day f | 2.1(0) | 2.1 (0) | 1.6 (−23) | 0.99 (−53) | 0.99 (−53) |
a 9.8 min shower (8 in 9 days); b 4.9 min shower (8 in 9 days); c 3.3 min shower (8 in 9 days); d 2.5 min shower (8 in 9 days); e Bath (full bath, 1 in 9 days); f ps—place setting.
2.2.1. User Technologies
S1 can be achieved merely by changing the shower to a power shower with a flow rate of double that adopted in S2. The reduced water demands and improved band rating achieved in S3 assume a lower flush toilet, lower flow shower, smaller bath and more water efficient washing machine and dishwasher. S5 achieves the lowest demand through adoption of appliances that are more water efficient and the removal of bath(s) and dishwasher(s).
The water use assigned to sinks (as assumed within the CSH methodology) is unchanged (10.4 L/person/day) in all design cases. It is a small % of total use (<10%) but still an area where improvements could be made—or where demands may be significantly higher than the static value assumed in CSH. (n.b. The flow rate of taps (typically 4 L/min) is important and could be used.)
2.2.2. User Behaviour
S1 can be achieved also though a 100% increase in water use from showering made by doubling the time spent in the shower (rather than adopting a power shower). S3 can be achieved by a 25% reduction in water use for WC flushing this is achieved through a 25% reduction in the number of flushes made per person per day, from a UK average of 4.42 to 3.31 flushes/person/day. (An estimate for user behaviour of sinks could be achieved by dividing 10.4 l by 4 L/min = 2.6 min—this could be assumed as the base case, against which changes are made. Accordingly a 1 minute change in use would result in either 4 litres being used or saved.
3. Results
3.1. Influence of Supply
Figure 3 shows the impact of water using performance on the band rating when alternative supplies are used. (n.b. It is important to remember that the band rating presented here relates to the total daily volume of mains water consumed by an individual and not the total volume of water consumed by an individual—this is an important distinction when it comes to resource use.)
When compared to a mains only supply it can be seen that an additional GW supply will reduce mains water requirements by between 20% (S1) and 25% (S5) year round, whereas an additional RWH supply will reduce mains water requirements by between 35% (S1) and 37% (S5) placing demands in the A + band for the S5 design case. The best band ratings (i.e., lowest mains water demand) were achieved where internal demands were lowest. In all cases the RWH system out-performed the GW system in the NW due to an abundant supply of rainwater throughout the year. (n.b. Moving from S1 to S5 there are changes to GW in terms of both supply and demand—S5 has the lowest production of GW, although it also has the lowest demand. The reverse is true for S1, the power shower produces a significant additional supply of GW as compared to S2 and yet the demand for GW in each design case is identical.)
Figure 3.
Influence of supply options on demand band ratings in NW (UK).

Notes: 50 L/person/day—minimum required to be lived (UN, 2010), 80 L/person/day—CHS Levels 5 and 6, 105 L/person/day—CSH Levels 3 and 4, 125 L/person/day—CSH Levels 1 and 2 (Department for Communities and Local Government, 2009).
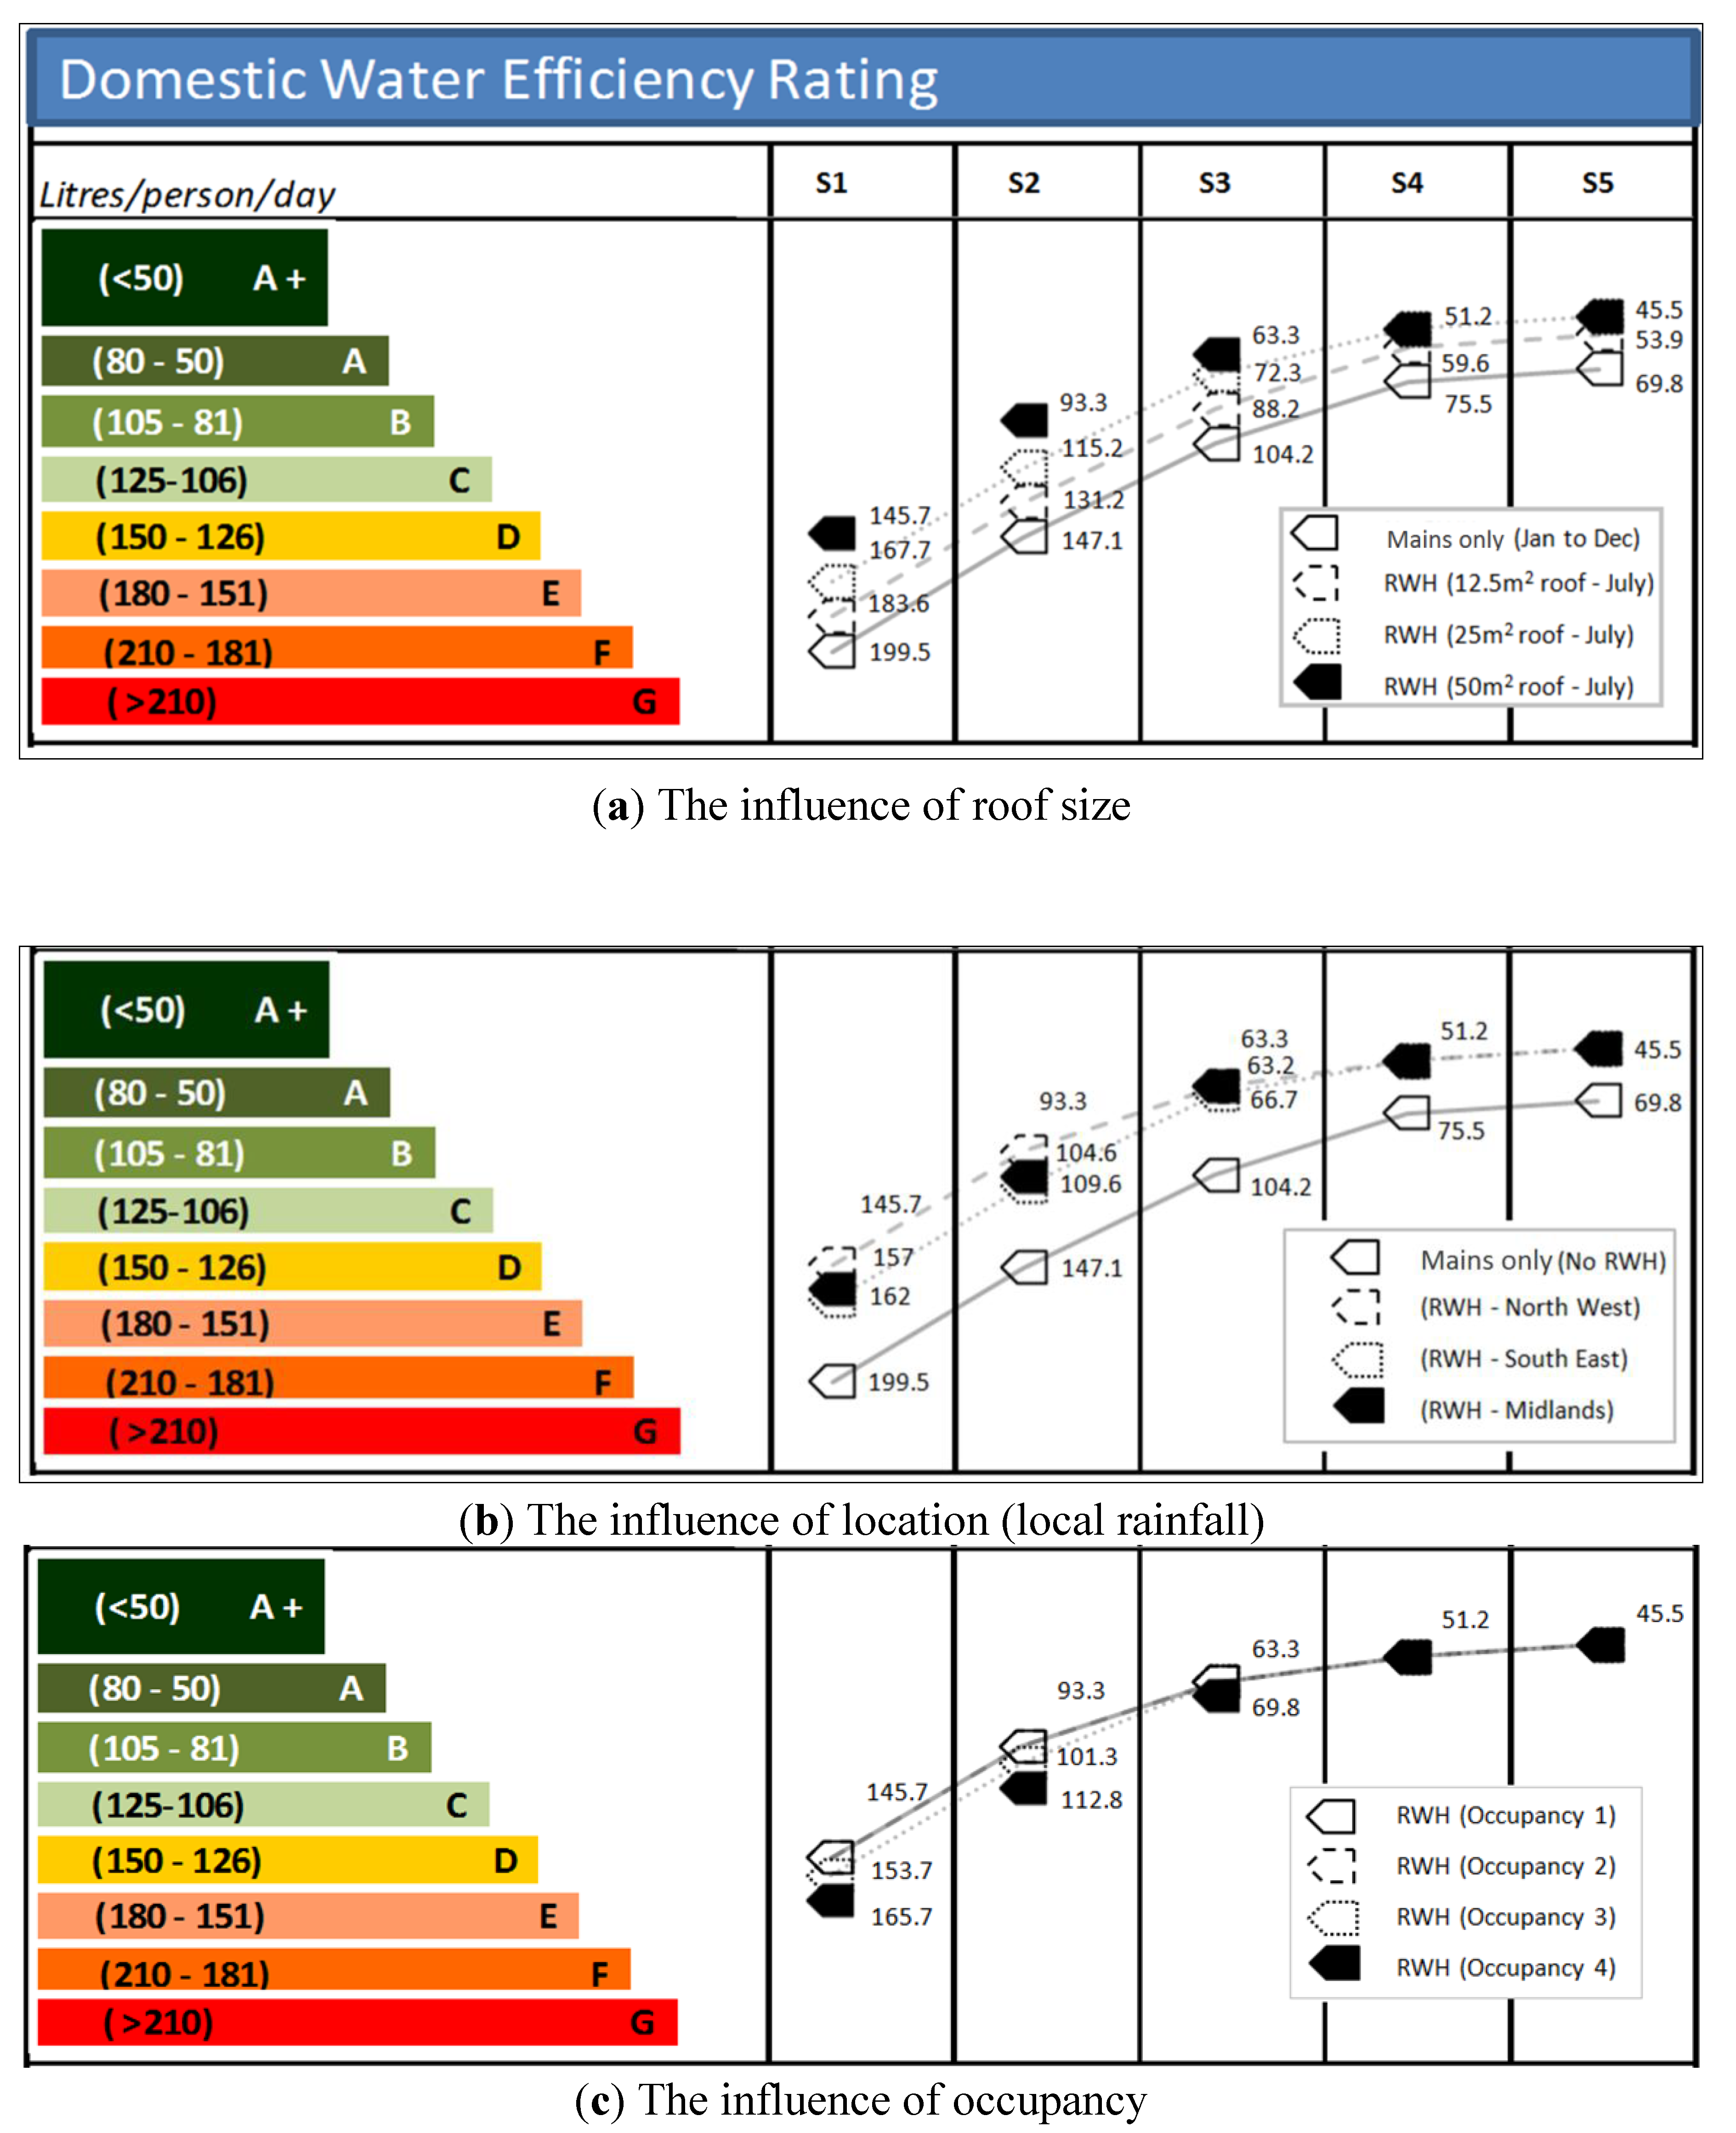
3.2. Influence of Roof Size
The influence of roof size on water using performance for each of the design cases is shown in Figure 4a. Increasing the roof size improves the band rating that can be achieved. However, a limiting value is approached if the catchment area provides sufficient supplies to meeting internal non-potable demands. This means an RWH system adopted with an undersized roof will result in a reduction in the band rating. This under-sizing may have occurred due to limitations of available roof space or the long term influence of overhanging buildings, trees, for example. Similarly over-sizing the catchment area, say to 75 m2 brought about no benefit in terms of band rating in all design cases; once non-potable demands are met any excess rainwater is surplus to requirements and is stored (where available capacity exists) or directed to the wastewater system. A surplus of stored water acts as a buffer to ensure the best band rating is achieved. A performance band of “A +” (45.5 L/person/day) could be achieved in design case S5 with a roof size of 50 m2 and 25m2, although this dropped to band “A” (53.9 L/person/day) for a 12.5 m2 roof. For design cases S4 and S5 a catchment area of 50 m2 could be considered oversized, as the non-potable demands are low, half of this would have been more than adequate to meet the specified internal demands. All of these considerations are beyond the scope of CSH and highlights the requirement for benchmarking longer-term water using performance. In contrast, Roof size has no influence on domestic GW supplies hence, not surprisingly there is no influence upon the band rating previously achieved in Figure 3. This explains the absence of an additional Figure for GW.
3.3. Influence of Geographical Location: Rainfall
The influence of rainfall on RWH system performance in three different UK locations (Midlands, North West and South East, UK) is shown in Figure 4b. The best performance levels were achieved where rainfall was highest (i.e., 1268 mm/year in NW) and worst performance levels were achieved where rainfall was lowest (780 mm/year in SE). In all cases RWH contributed to reducing mains water demands and improving the benchmark that could be achieved. Most notable was the fact that a performance level of 45.5 L/person/day could be achieved in all locations in design case S5. As the internal demands begin to increase (i.e., S3 to S1) location becomes more influential as in these design cases RWH supplies can no longer meet demands. This is because the performance of any RWH systems is directly related to rainfall, which is region specific, and this appears to impact directly on the band rating that could be obtained, lowest in SE and highest in NW. Currently this is not a consideration for CSH. Once again, GW production is not influenced by regional rainfall patterns hence there is no impact upon the levels of performance achieved in Figure 3.
3.4. Influence of Occupancy Rates
Figure 4c shows the influence of occupancy rates (1 to 4) on band rating. When 1 or 2 occupants are present performance band ratings appear to be unaffected for all design cases. When 3 or more occupants are present the band rating of S4 and S5 are unchanged and the highest performance levels are achieved (45.5 and 51.2 L/person/day respectively). However, in S1 an 8% increase in water consumption occurs, (i.e., from 145.7 to 153.7 L/person/day) and in S2 a 12% increase in water consumption occurs (i.e., from 93.3 to 101.3 L/person/day). This worsens further when one extra occupant is added—moreover the performance in S4 worsens also. These performance levels are further decreased when five or more occupants (not shown) are included, although the % increase becomes less noticeable for each extra occupant added. As internal demands and GW supplies are measured per person and increase with occupancy rate they do not affect the water band rating that can be achieved. Occupancy rates are currently outside the scope of CSH and it appears that as long as water consumption per person is low, i.e., CSH Levels 5 and 6, occupancy is not influential, however where it is higher (i.e. CSH Levels 1 to 4) some influence will occur.
Figure 4.
Influences of Rainwater Harvesting (RWH) non-potable supply option on water band ratings in UK (Location NW (UK) and month of July unless stated otherwise).
Figure 4.
Influences of Rainwater Harvesting (RWH) non-potable supply option on water band ratings in UK (Location NW (UK) and month of July unless stated otherwise).

Notes: 50 L/person/day—minimum required to be lived (UN, 2010), 80 L/person/day—CHS Levels 5 and 6, 105 L/person/day—CSH Levels 3 and 4, 125 L/person/day—CSH Levels 1 and 2 (Department for Communities and Local Government, 2009).
3.5. Inclusion of External (Gardening) Demands
3.5.1. Influence of Time of Year
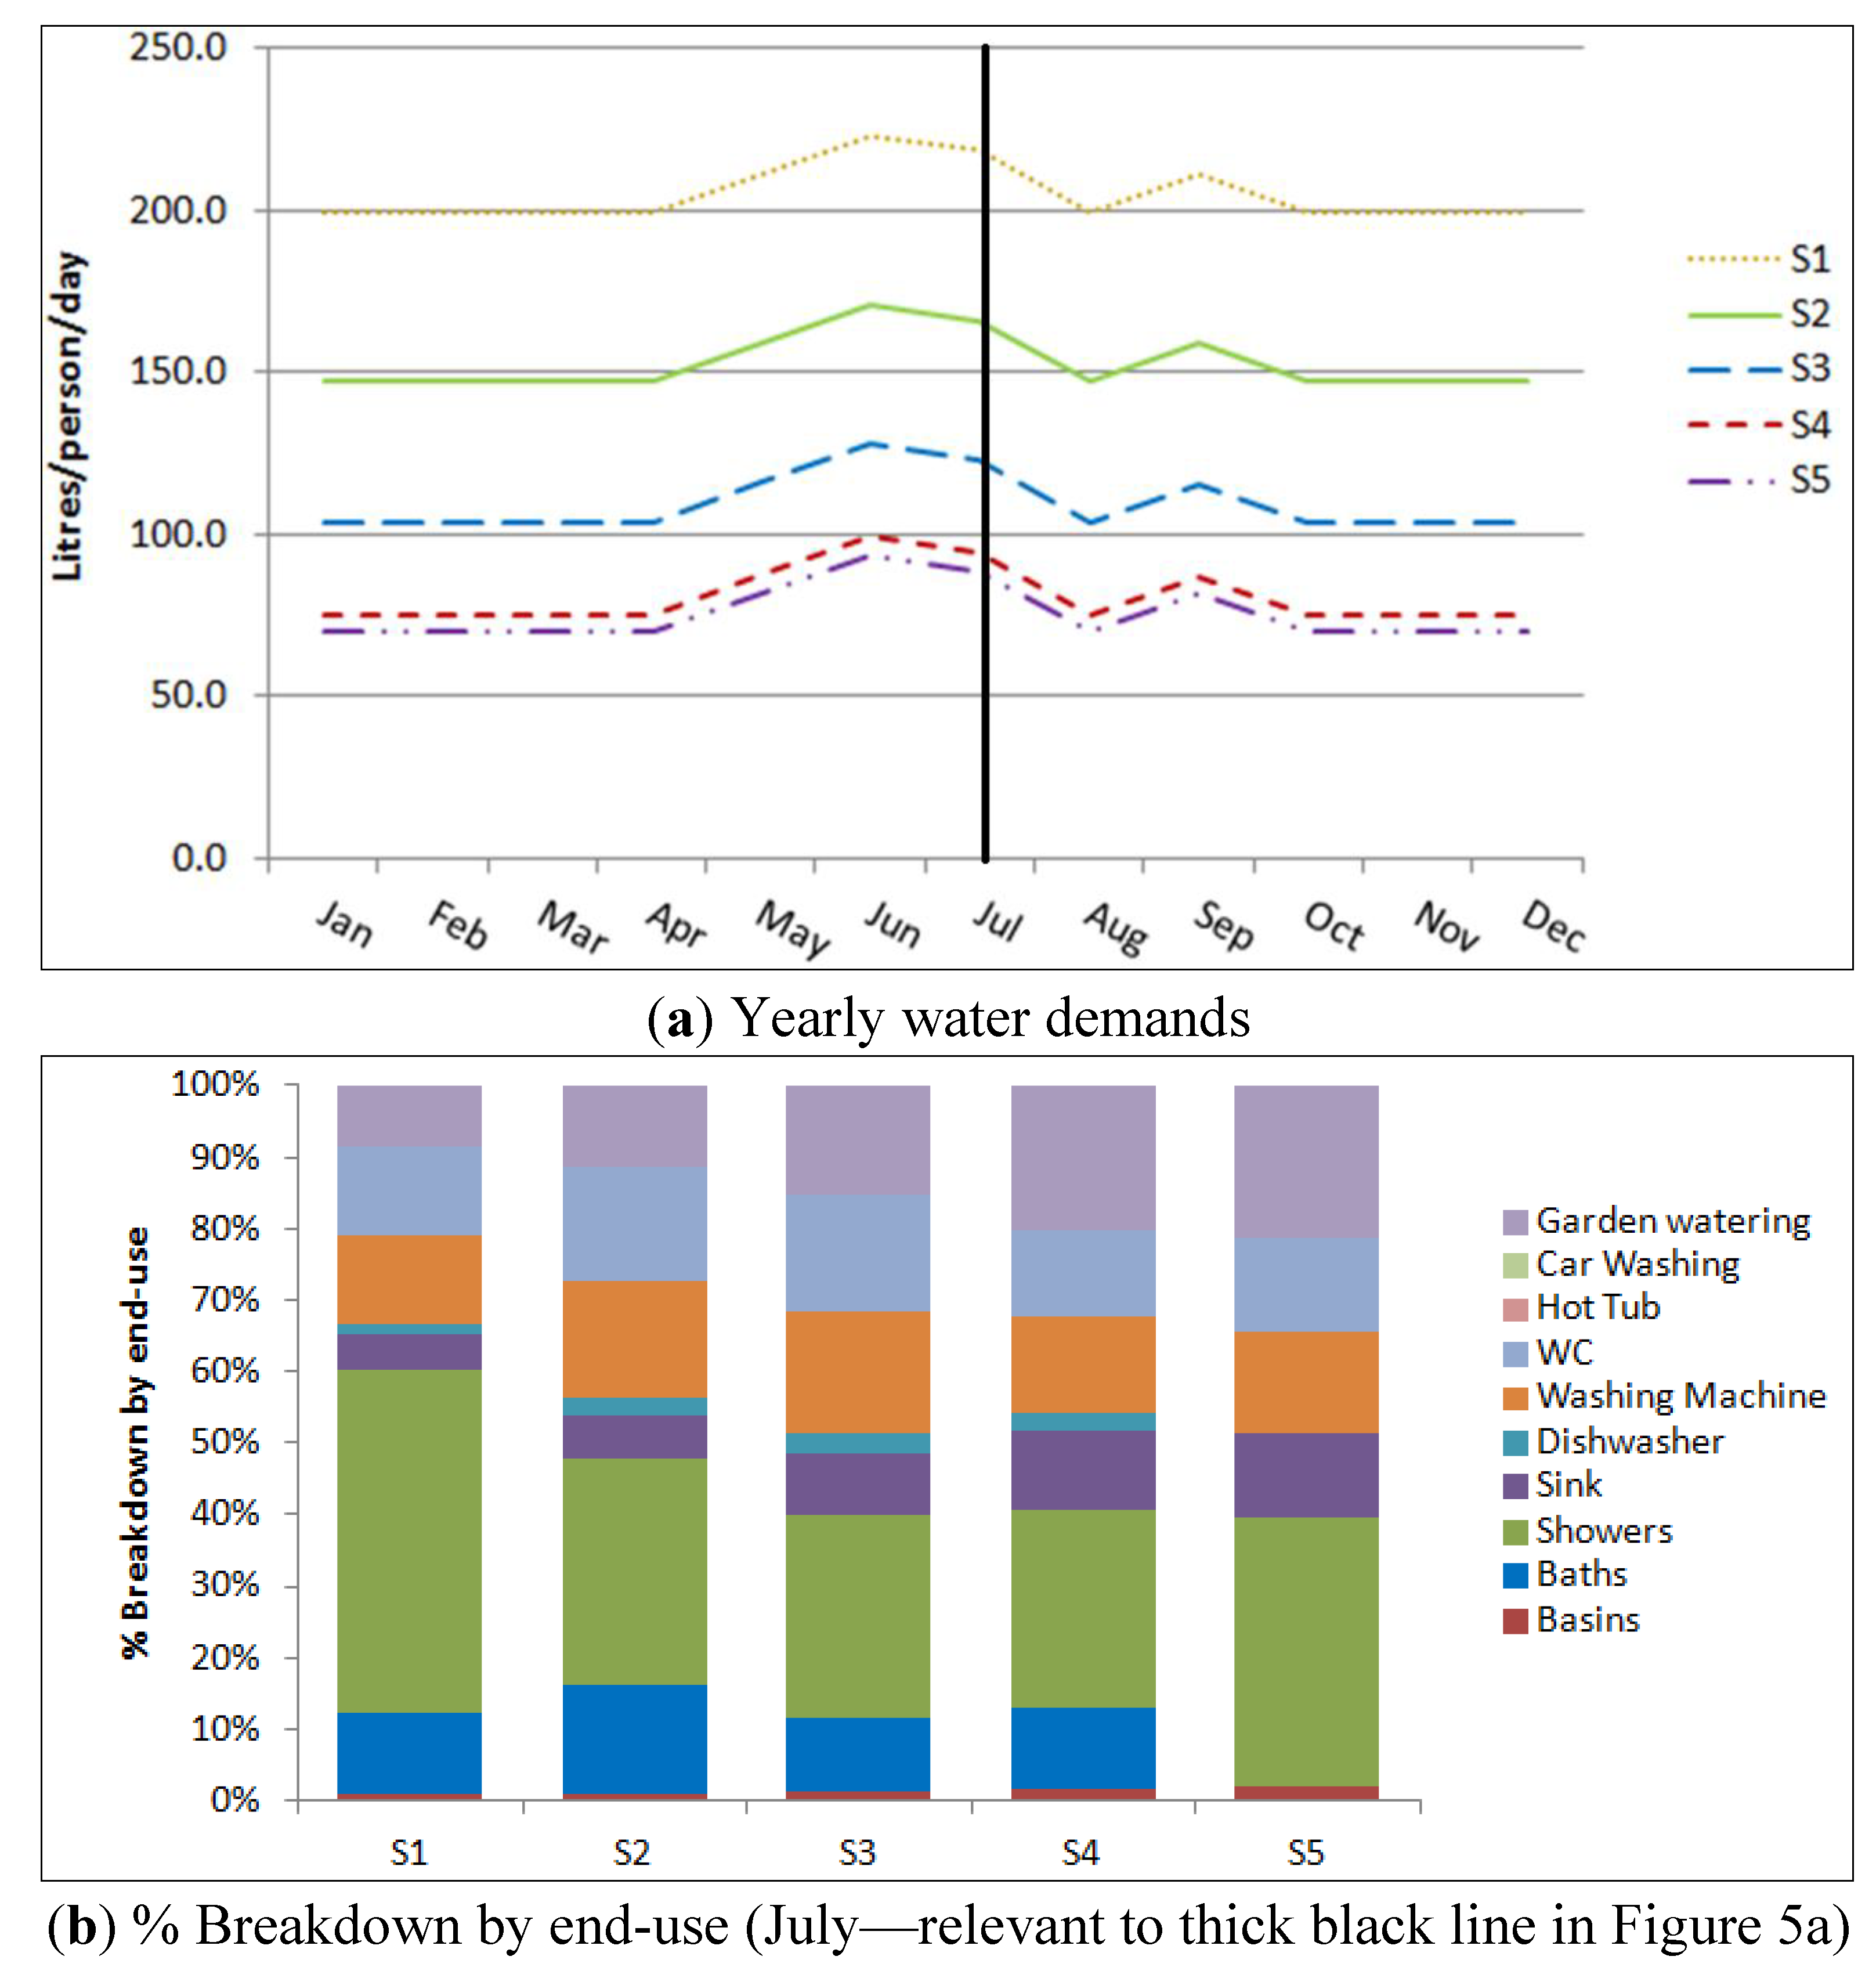
Figure 5a shows the water demands throughout the year for each design case which can be seen to increase considerably from April through to October (i.e., the summer growing season). The gardening demands are assumed to be identical in each design case, the breakdowns in July are shown in Figure 5b from where it can be seen that they amount to <10% for design case S1 and almost 20% for design case S5. This is important as it means that a domestic property might perform to CSH level 6 (i.e., 80 L/person/day—band A) during winter months and yet perform only to Level 3 and 4 (105 L/person/day or lower band B to C) in summer months—this variability is not considered in CSH. Garden demands are typically highest when temperatures are highest (evapo-transpiration is temperature dependant) and rainfall levels are lowest necessitating garden watering. This becomes particularly problematic when hosepipe bans are in place in summer months significantly reducing the ability of urban householders to successfully grow vegetables unless alternative watering measures are adopted. The difficulty for benchmarking occurs when non-potable supplies are insufficient to meet internal plus external non-potable demands in summer months.
Figure 5.
Water demands when including a 50 m2 garden in NW (UK).

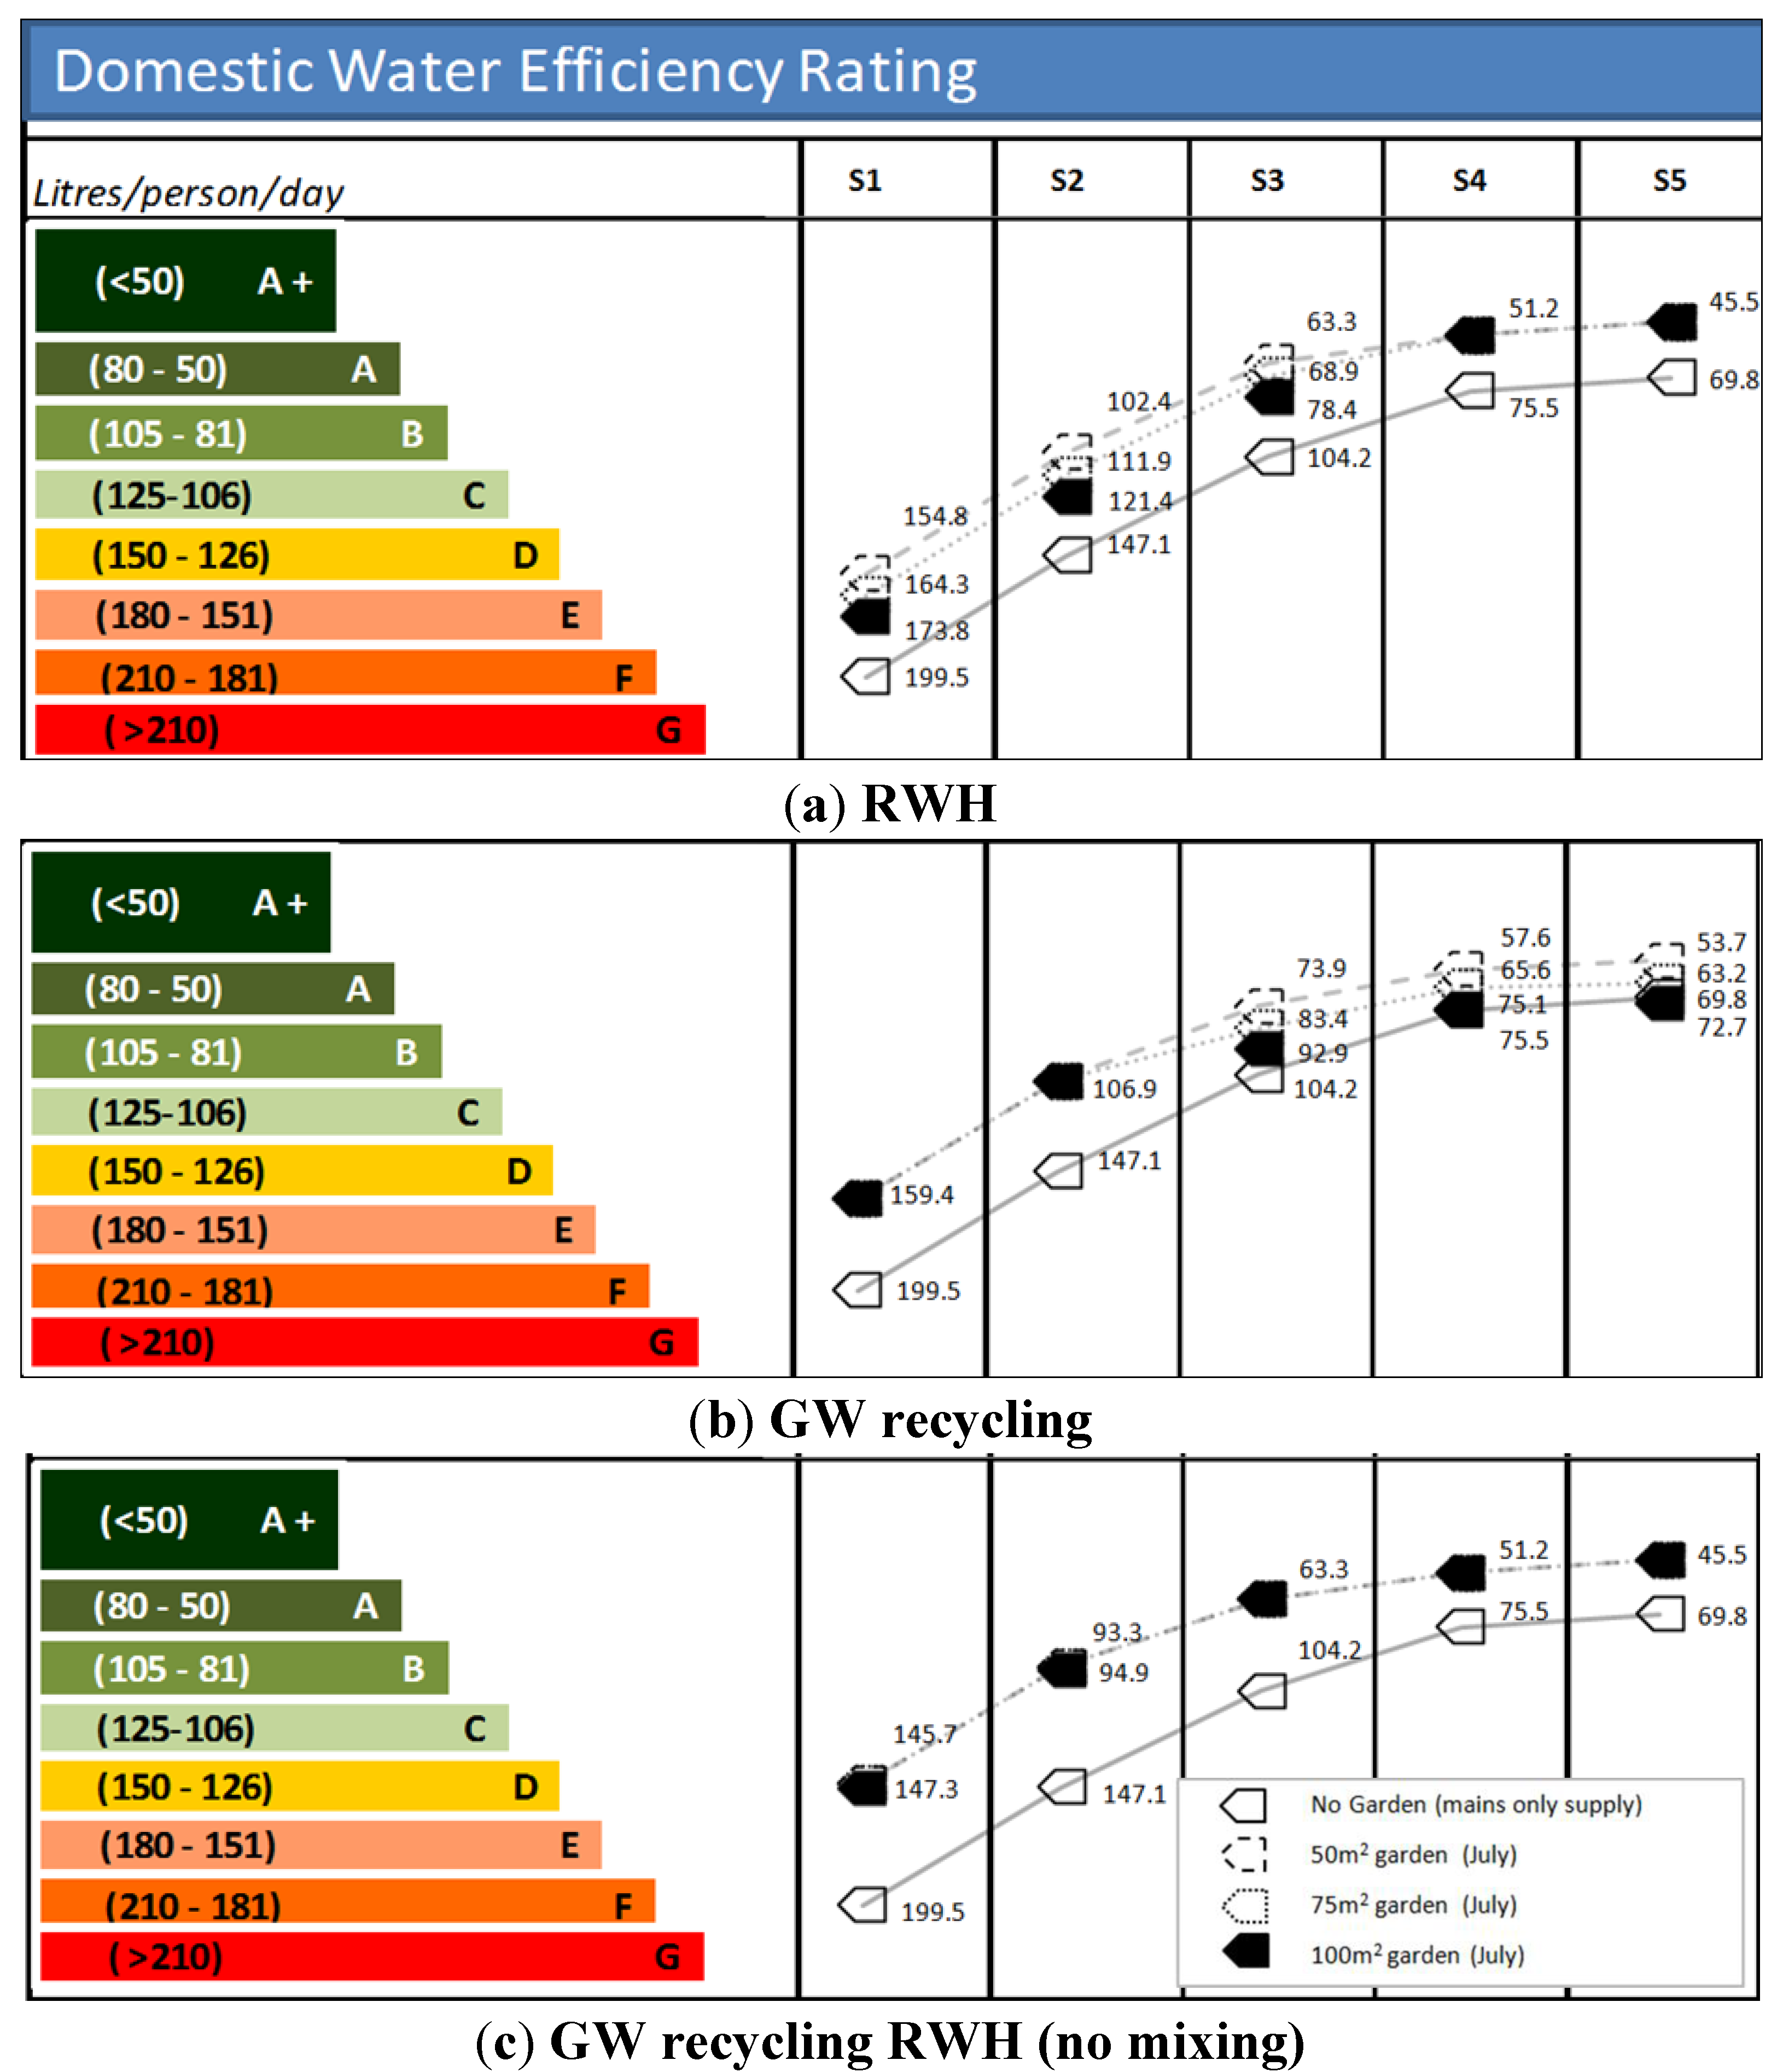
3.5.2. Influence of Garden Size (and Location)
Figure 6 shows that in the presence of 50, 75 and 100 m2 gardens performance band ratings can be improved beyond those for the base case (i.e. a domestic property without a garden supplied by mains water alone) through adoption (in isolation or in combination) of RWH and GW systems. For an RWH only option (Figure 6a) the band ratings achieved in S4 and S5 were not influenced by any changes made to garden size and matched those achievable in the absence of any garden demands (RWH option in Figure 4). However, as internal demands increased (i.e., from S3 to S1) so the mains water using performance was influenced. Most notably in S1 where a doubling in garden size (i.e., 50 to 100 m2) caused a 12% increase in demands with no change in band rating E. For a GW only option (Figure 6b) the band ratings achieved in S1 and S2 were not influenced by any changes made to garden size and matched those achievable in the absence of any garden demands (GW option in Figure 4). However, as internal demands increased (i.e., from S3 to S1) mains water using performance decreased (i.e., from S3 to S1. Most notably in design case S5 where an increase in garden size from 50 to 100 m2 resulted in a 35% increase in mains water demands, although with no change in band rating A. However, the band rating drops from A to B in design case S3 when increasing the garden size from 50 to 75 m2.
Figure 6.
Influence of garden size on band ratings for various non-potable supply options in NW (UK).
Figure 6.
Influence of garden size on band ratings for various non-potable supply options in NW (UK).

Notes: 50 L/person/day—minimum required to be lived (UN, 2010), 80 L/person/day—CHS Levels 5 and 6, 105 L/person/day—CSH Levels 3 and 4, 125 L/person/day—CSH Levels 1 and 2 (Department for Communities and Local Government, 2009).
The RWH and GW combined option (Figure 6c) allows for the highest band ratings to be achieved in all design cases and these are little influenced by changes to garden size.
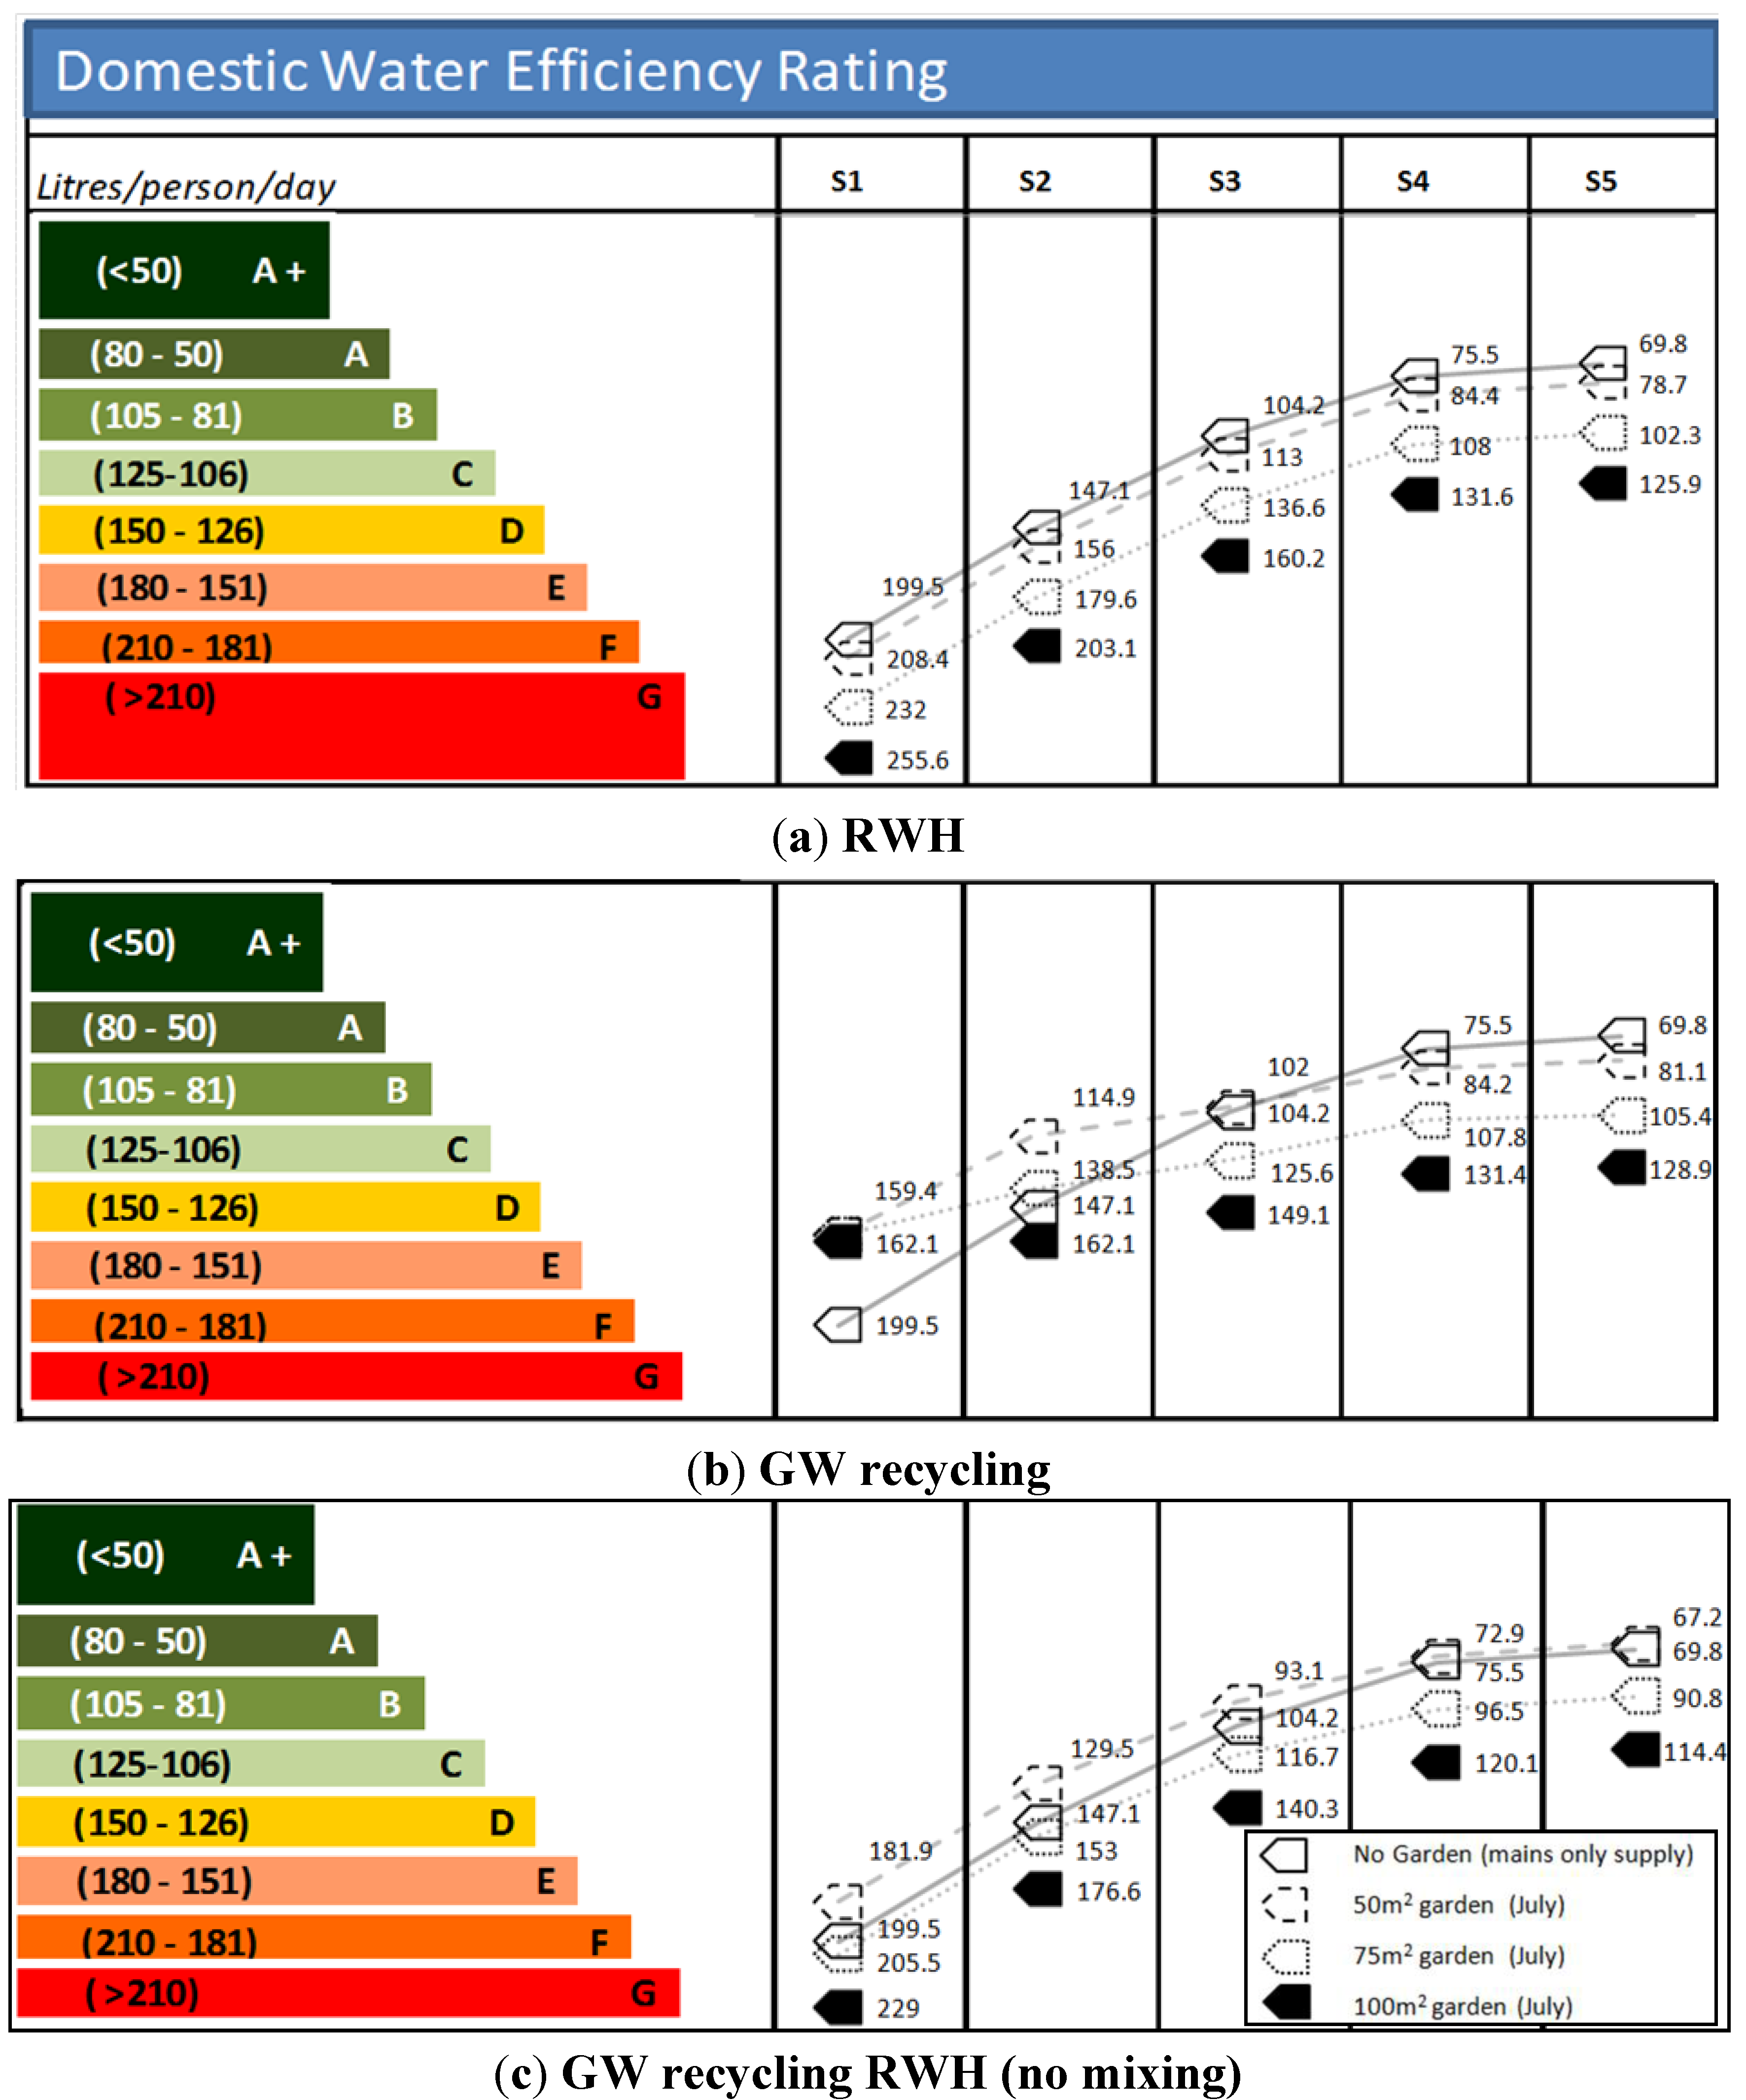
In Figure 7 the impact of changing locations from NW (UK) to SE (UK) is very noticeable. For RWH supplies; an increase in garden size increases water demands and influences band ratings for all design cases. The most noticeable impact here is in S5 where a band rating change from A to D occurs as the garden is increased from 50 to 100 m2 (Figure 7a). In all supply cases the performance is two to three band ratings lower than that achieved in NW (UK) and significantly less than the base case. The most notable exception to this is the adoption of a GW recycling system (Figure 7b) in S1 (where approximately 20% less water use is achieved than the base case for all garden sizes considered) and S2 (where 20% and 6% less water use than base case are achieved respectively for 50 m2 and 75 m2 gardens). The dual approach system (Figure 7c) offers better performance than individual approaches in S3, S4 and S5. However, the performance in S4 and S5 is worse than an individual GW recycling system, although better than an individual RWH system. These subtleties were not apparent in the NW and certainly are not considered in CSH accreditation.
Figure 7.
Influence of garden size on band ratings for various non-potable supply options in SE (UK).
Figure 7.
Influence of garden size on band ratings for various non-potable supply options in SE (UK).

Notes: 50 L/person/day—minimum required to be lived (UN, 2010), 80 L/person/day—CHS Levels 5 and 6, 105 L/person/day—CSH Levels 3 and 4, 125 L/person/day—CSH Levels 1 and 2 (Department for Communities and Local Government, 2009).
3.5.3. Influence of Occupancy (and Location)
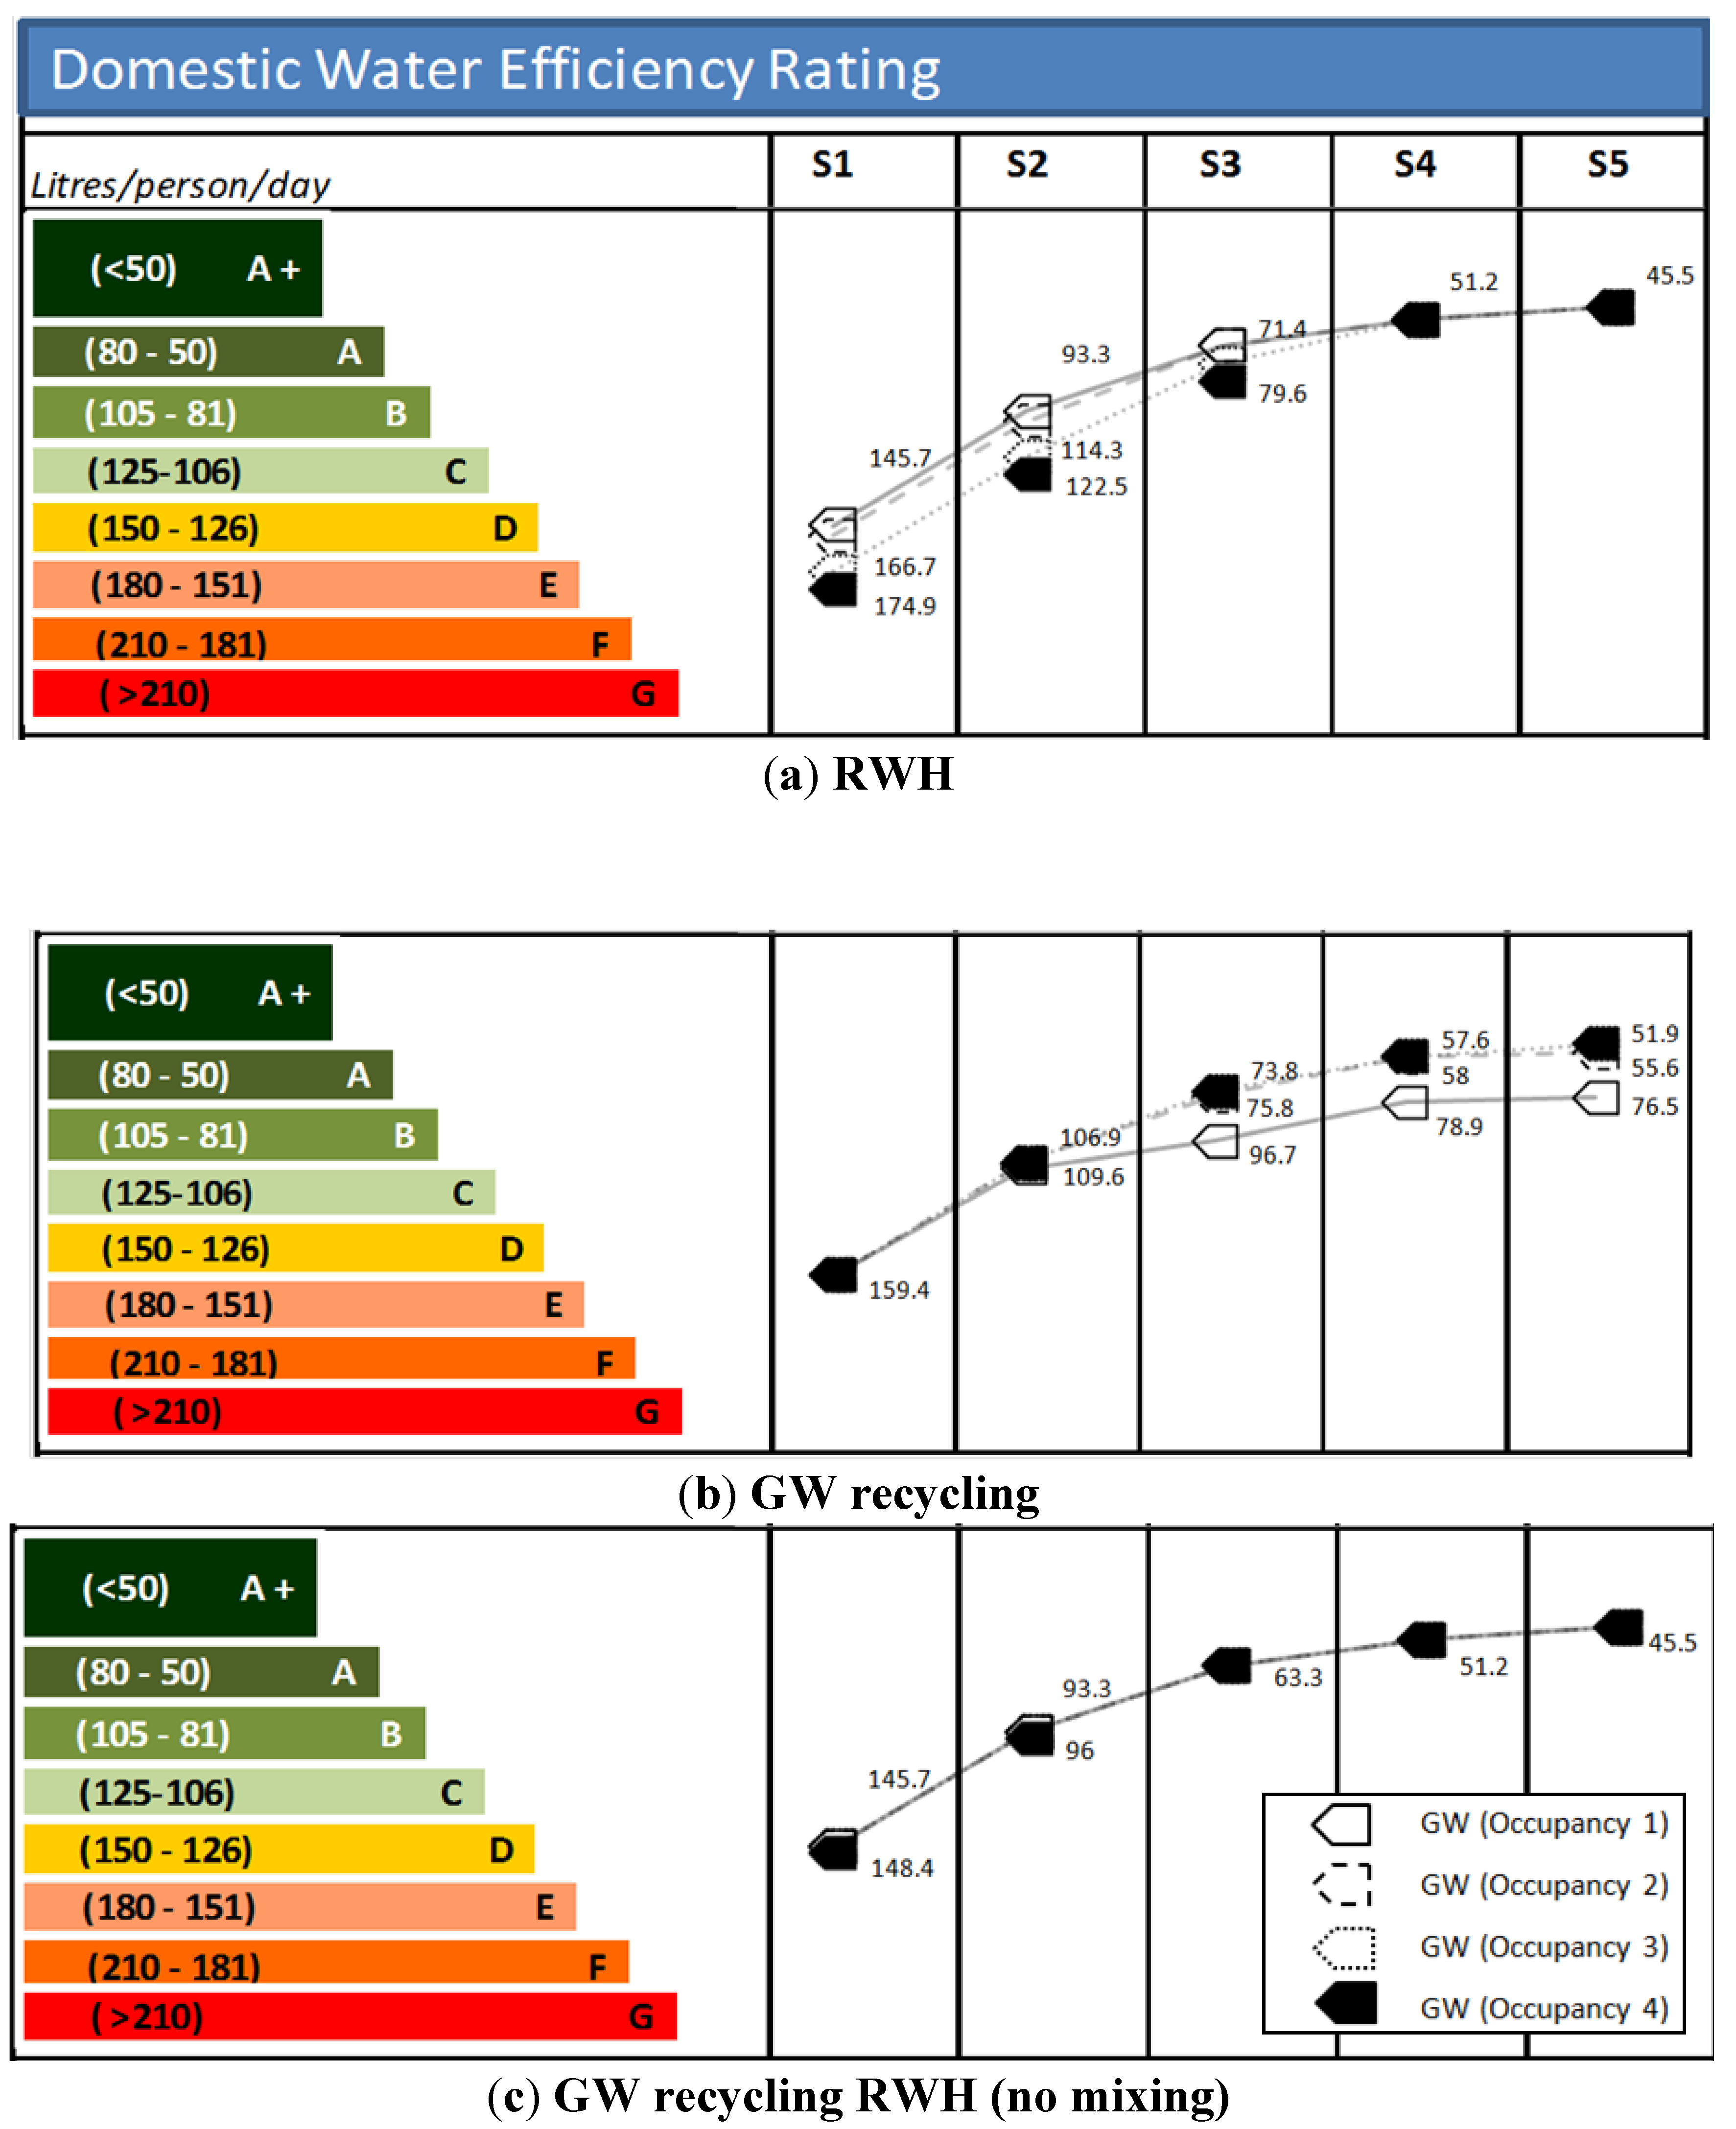
The band ratings for an RWH supply are marginally influenced in NW (UK) by occupancy rates (Figure 8a) in S1 (D to E) and S2 (B to C). The slight deviations from the baseline are due to subtle changes in internal non-potable demands within design cases; the influence being most noticeable in S1 followed by S2 and S3 where non-potable demands are higher than RWH supplies.
In the case of a GW supply band ratings are not affected by occupancy numbers (Figure 8b). This is due to the fact that GW supplies increase relative to occupancy (i.e., four occupants produce four times as much GW as one occupant)—hence water using performance will only be impacted by low occupancy rates. For example, GW supplies from one occupant are insufficient to meet non-potable demands in S2 (marginally), S3,S4 and S5 (most notably) and hence the performance is impacted.
When both RWH and GW are used (Figure 8c) the lowest water use and hence highest band ratings of all supply options are achieved. The advantage of this dual supply in NW (UK) is that occupancy no longer becomes an influential factor because there is more than enough non-potable water to meet demands.
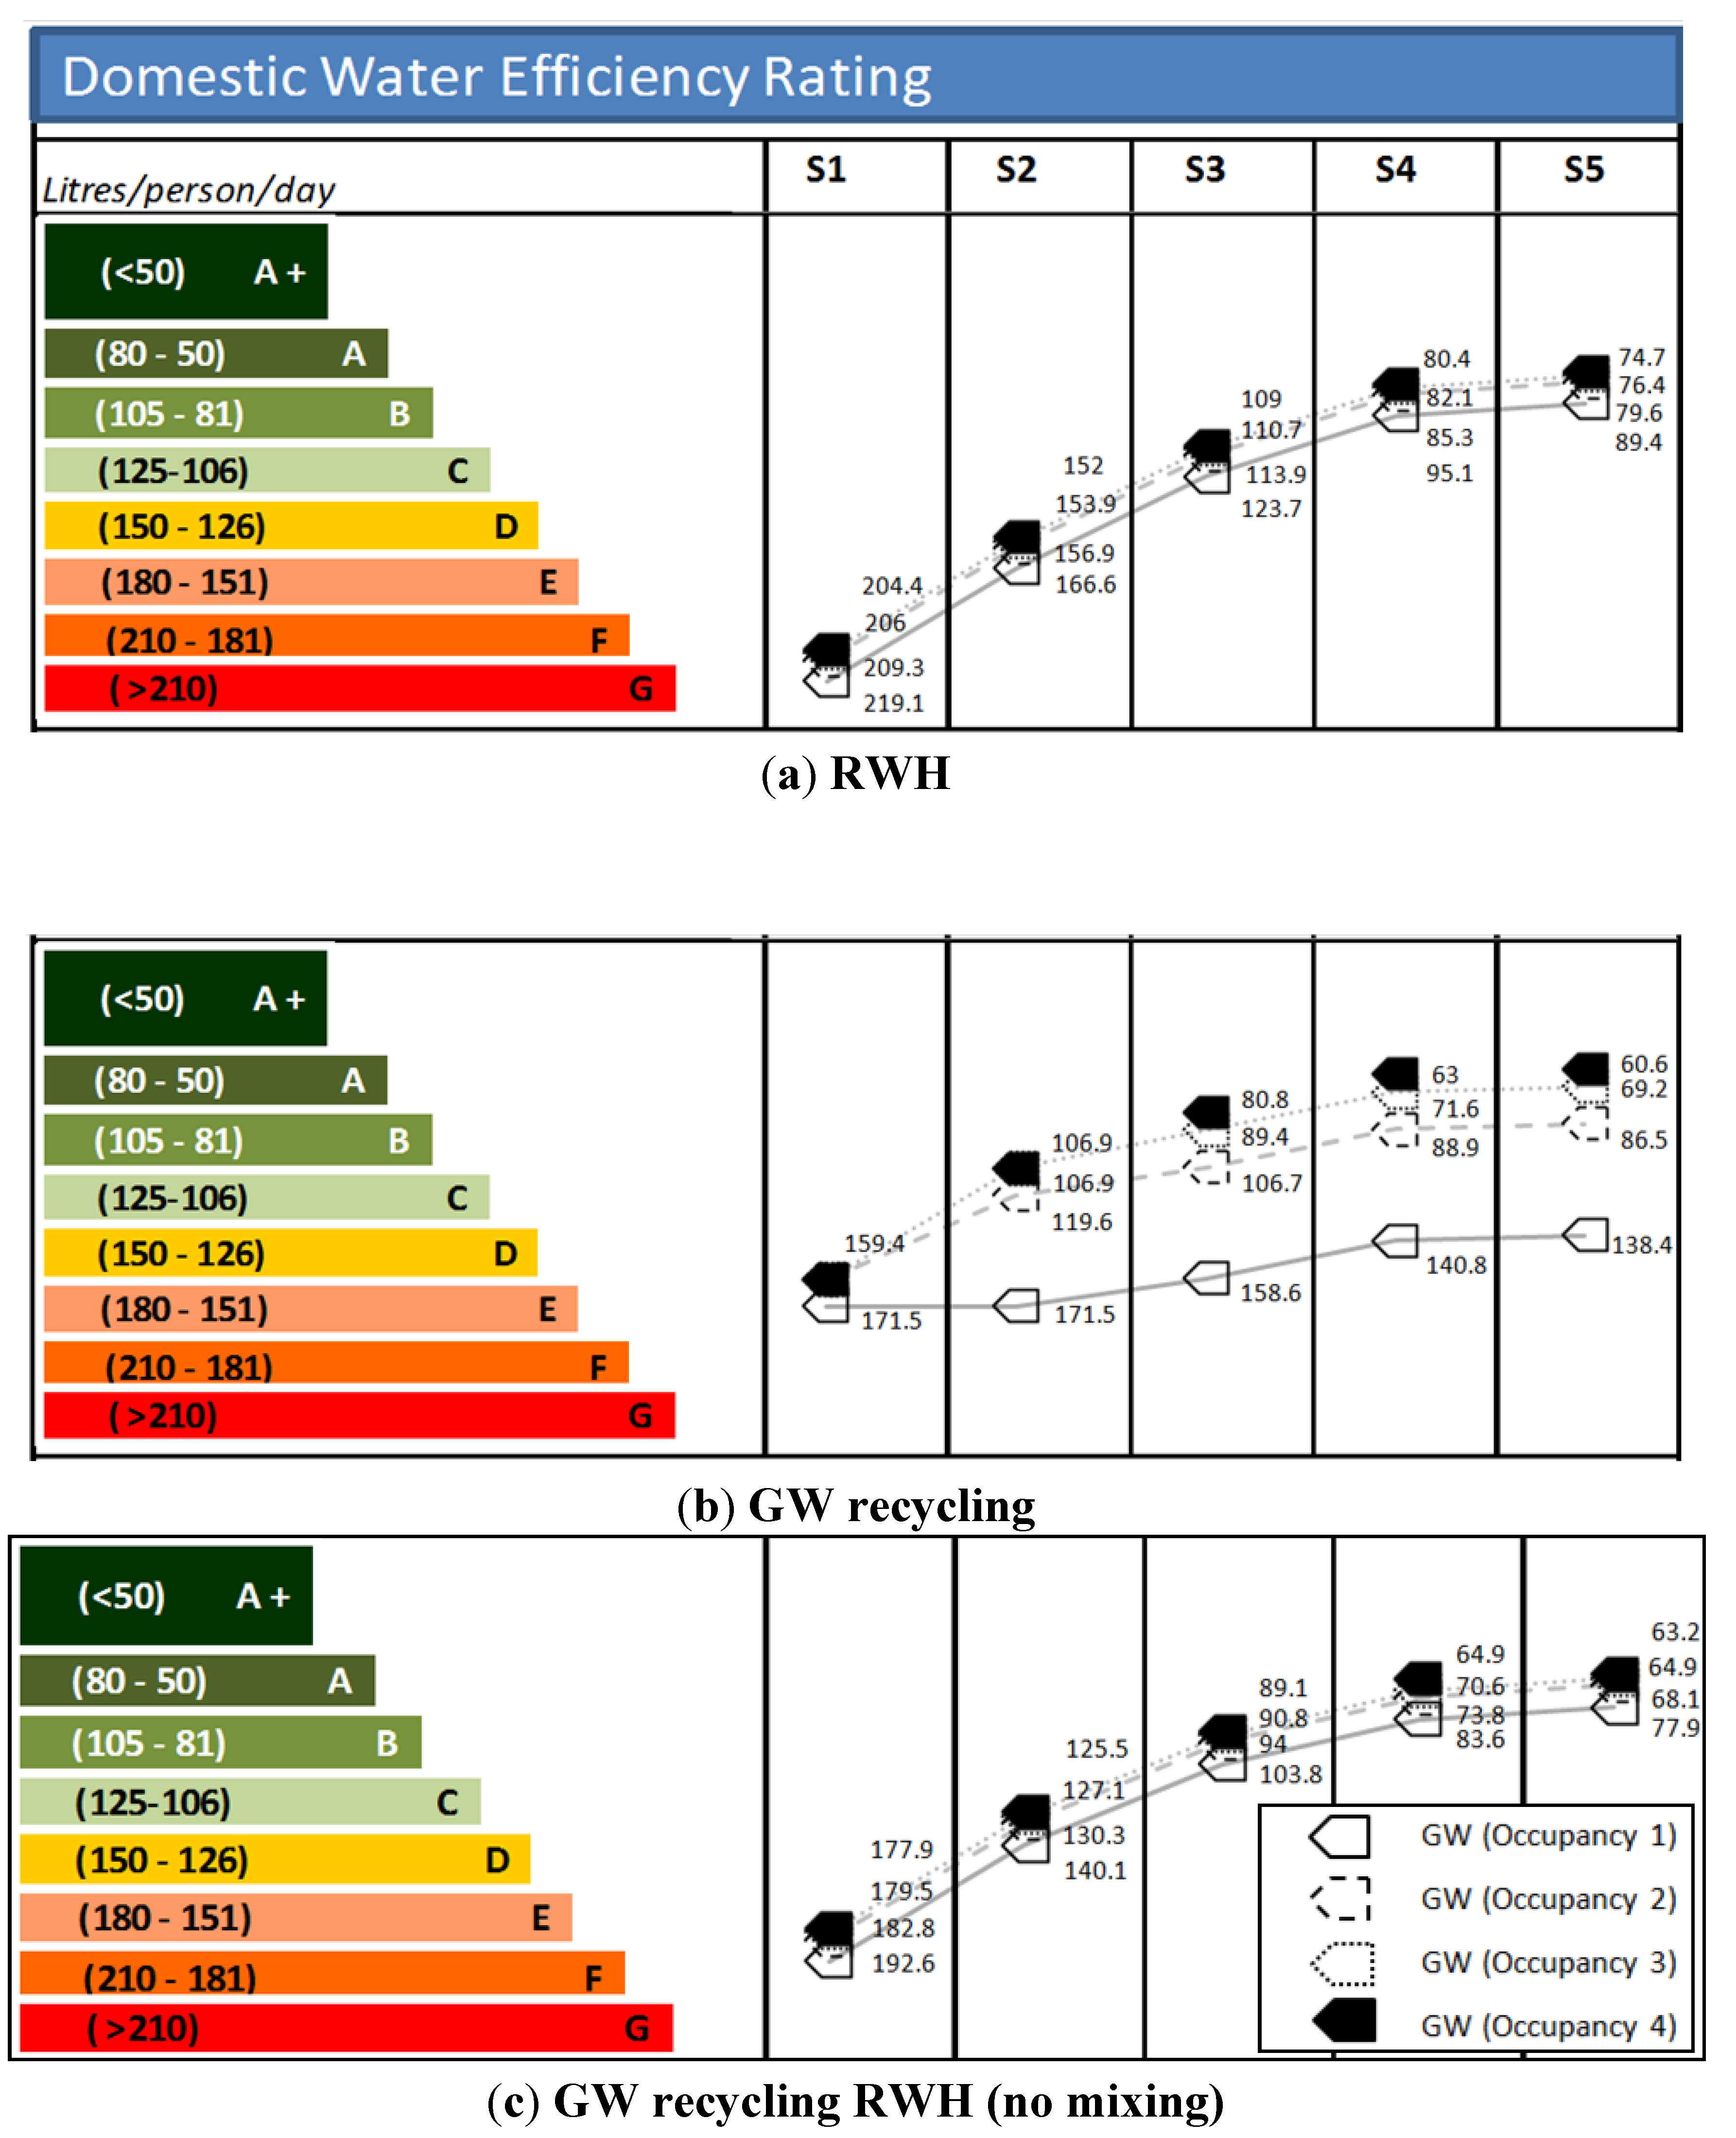
In Figure 9 the impact of a change in location to SE (UK) can be seen. The influence of occupancy numbers is far more noticeable and in all cases performance improves as occupancy numbers increase. In Figure 9a it can be seen that the band ratings for an RWH supply will also improve only in S1 (G to F) and S5 (B to A). The impact of a single occupant on the performance of the GW system and achievable band rating (Figure 9b) is more pronounced in SE (UK) than NW (UK); most notably in S5 where the water use for a single occupant is 120% larger than for 4 occupants. For NW (UK) this was 47% larger (Figure 8b). Providing the occupancy rates are 3 or less a dual system will offer better water use performance and band rating than a RWH system in the SE (UK). However, if the occupancy rate is 4 or more the best water use performance and band ratings are achieved with a GW supply. In a mixed supply system (Figure 9c), higher levels of performance are obtained in all design cases and the influence of occupancy rates less pronounced.
Figure 8.
Influence of occupancy rates and non-potable supply options on band rating for a 50 m2 garden in NW (UK).
Figure 8.
Influence of occupancy rates and non-potable supply options on band rating for a 50 m2 garden in NW (UK).

Notes: 50 L/person/day—minimum required to be lived (UN, 2010), 80 L/person/day—CHS Levels 5 and 6, 105 L/person/day—CSH Levels 3 and 4, 125 L/person/day—CSH Levels 1 and 2 (Department for Communities and Local Government, 2009).
Figure 9.
Influence of occupancy rates and non-potable supply options on band rating for a 50 m2 garden in SE (UK).
Figure 9.
Influence of occupancy rates and non-potable supply options on band rating for a 50 m2 garden in SE (UK).

Notes: 50 L/person/day—minimum required to be lived (UN, 2010), 80 L/person/day—CHS Levels 5 and 6, 105 L/person/day—CSH Levels 3 and 4, 125 L/person/day—CSH Levels 1 and 2 (Department for Communities and Local Government, 2009).
4. Discussion
The analyses performed here have highlighted the sensitivity of the proposed band rating system to a range of influences and discussed the relevance with respect to the existing code for sustainable homes where credits are awarded (sometimes prior to occupation of dwellings) without consideration of longer-term performance. The proposed benchmarking system appears to fill this shortfall. This paper does not suggest that CSH should be replaced—its limitations just need to be understood. In many respects it does what it set out to do (i.e., crediting the adoption of water efficient technologies) moreover it has buy-in from house builders and home owners alike. The proposed benchmarking system can be used alongside CSH certification (the two integrate seamlessly) giving the individual user a better idea of their actual water using performance and whether it is good (requiring little or no change) or bad (requiring significant change).
Whilst this goes a significant part of the way to achieving improved water performance within cities there are many wide ranging considerations. This section provides a broader discussion on the role technology and user behaviour (Section 4.1), policy (Section 4.2), economics (Section 4.3) and in light of these considers the feasibility and acceptability of the proposed benchmarking system (Section 4.4).
4.1. Technology and User Behaviour
There is an assumption that adoption of more water efficient technologies is the solution to reduce water consumption. Whilst this is true we need also to consider influences related to impaired functionality (i.e., the inability of the technology to deliver what it designed to do) and reduced comfort levels (i.e., the inability of the technology to deliver expected “user experience”) as water efficiency is improved. These will have a strong influence on “public acceptability”. As such there are many questions that need to be asked of a technology or of an individual using that technology, for example:
- What is the lower limit to a showers flow rate, has it been reached?
- Can a very low flow rate shower (i.e., < 6 L/min) deliver the same shower experience as a 12 L/min or even a 24 L/min power shower? If not, then would acceptability and widespread adoption be inhibited?
- Is a (re)design (e.g., aeration technology) possible to deliver the same user-experience and function (i.e., personal washing and relaxation)?
The equally strong influence(s), of “duration” of use and “frequency” of use [13,30,31] should not be ignored and yet in CSH their influences are underplayed. Whilst CSH does accredit the adoption of smaller baths, perhaps accreditation should consider the quota of water an individual uses for daily personal washing (be it through bathing or showering—the choice being theirs alone). The choice of technology and user behaviour is then accredited equally. This allows those that cannot afford a change in technologies to be accredited for more “sustainable” consumption. Likewise it incentivises those that can afford a change in technology to consider their long-term behaviour; avoiding consumers buying a water efficient shower that uses half the water of the old shower only then to use it for twice as long.
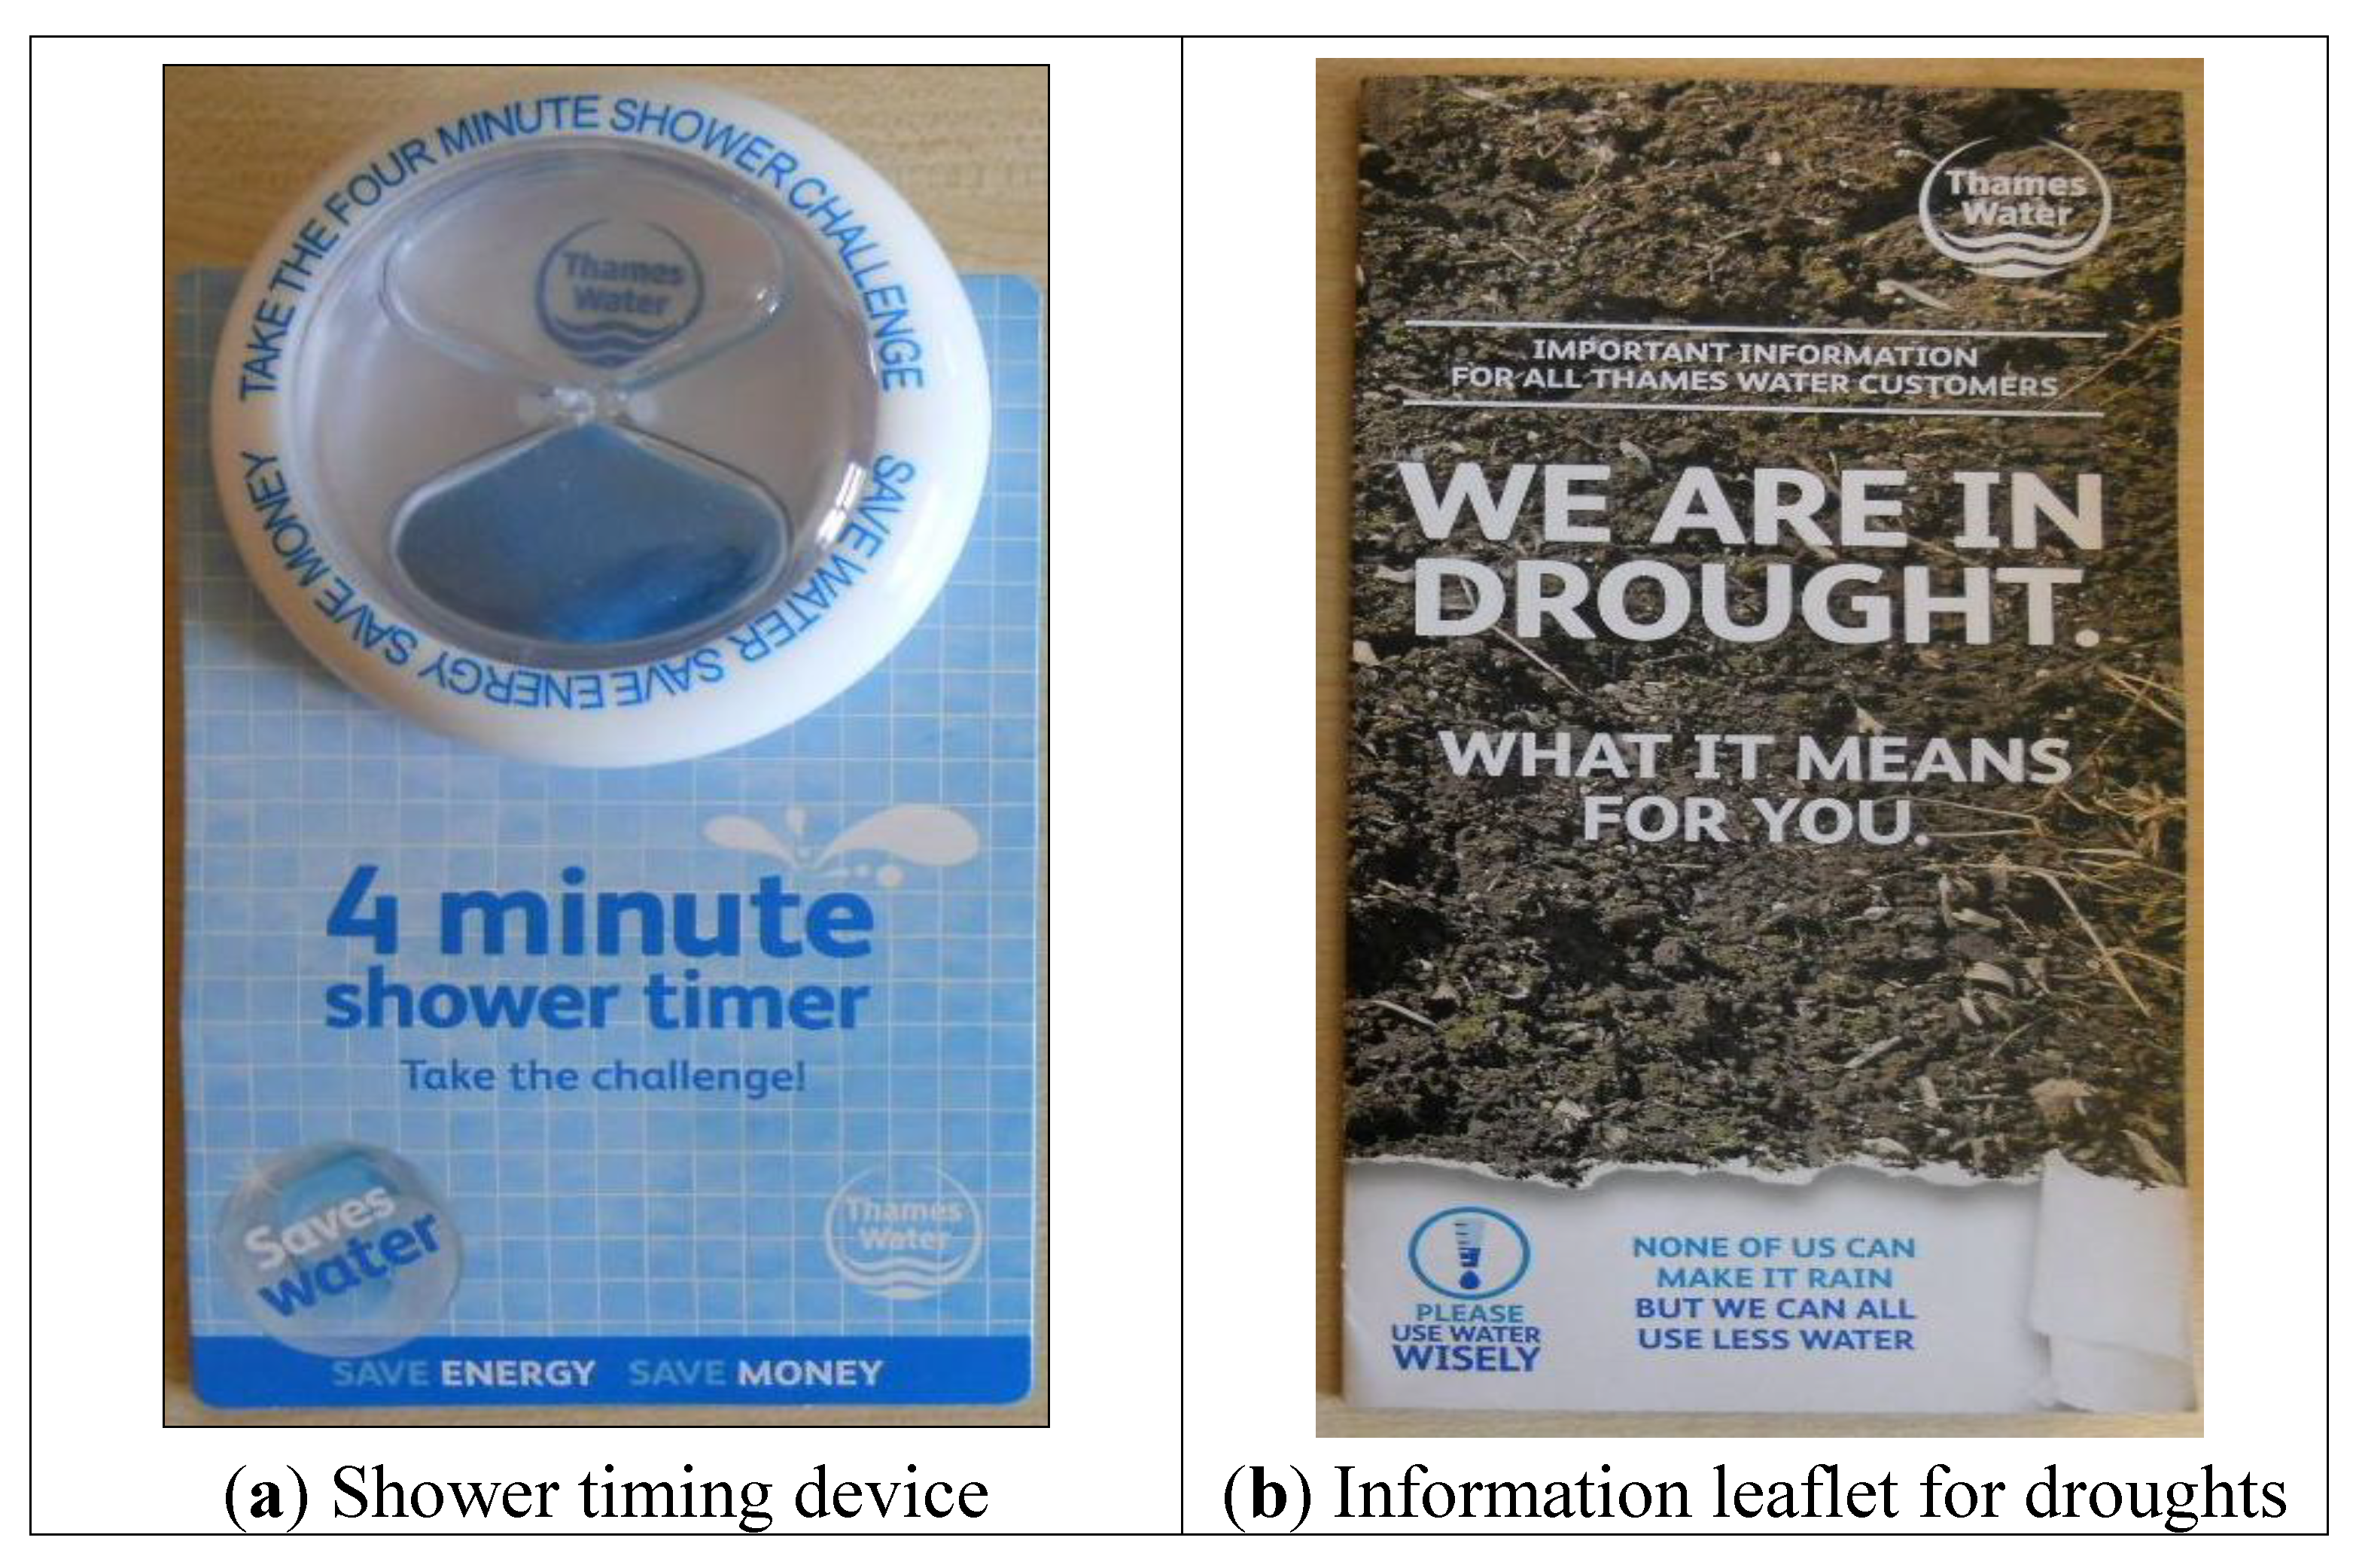
The human element is strongly influential in water demands within the home and can be highly variable—even within a single household [32]. Therefore achievement of the highest performance levels for user behaviour shown in Table 1b may require incentives, help (or nudges) to achieve such a “step-change” in user behaviour. For example, 4 min timers (Figure 10a) and information leaflet (Figure 10b) were given out freely in the South East of England by Thames water during the early drought in 2012. Although, now the drought has subsided how many of these are still being used today—moreover did users really stick to four minutes? So perhaps in this case technologies could be used to influence more strongly user behaviour. A sensor could “time-limit” or “volume-limit” bathroom water supplies ensuring set volumes of water flow from taps, showers and baths. This does not prevent the user overriding them—nor should a democracy should seek to limit free will. In a modern society this is more about making people aware of their water using behaviour and facilitating, rather than enforcing, a change. Coin operated showers, for example on camp sites, already operate in this way, although for domestic adoption perhaps the technology would benefit from electronic “bleeps” according to the minutes taken in the shower, or perhaps green, amber and red light gauges so the water does not run out before all washing is completed. Even timing devices for sinks (i.e., timed for flows of around 10 seconds—adjustable by the installer) already exist in office/hotel settings and therefore it is not beyond the realms of possibility that they could be introduced in a domestic setting. The question remains as to “how low could one go to ensure resource security whilst maintaining user comfort and performance levels, i.e., liveability for the user and for the city of the future?”
Figure 10.
Incentivising changes in “user-behaviour” for London during the 2012 drought.

More importantly can we think outside the box when it comes to future user behaviour—will it be significantly different from what we currently know and do? In most cases the thinking can be prompted by a “what if” question. For example, “what if’ we wore clothes for twice as long between washes—facilitated by manufacturers engineering stay clean clothes? “What if” we produced significantly less washing-up—by eating out more or by ordering ready cooked foods? These user changes need to be considered in parallel to technology changes and any benchmarking system should allow for this.
For some water uses it might be deemed impossible to reduce down the frequency of use below UK average values, for example WC flushing, as this is related to a natural necessary bodily function—in terms of urine we all produce around 2.5 L/person/day. Or perhaps it prompts the more pertinent question of how do we reduce flushing, if it is not through a step-change in technology? In cases of drought in Brazil a television advertisement campaign urged water users to urinate in (their own) showers whilst showering to conserve water [33].
For a western society this may on the face of it appear shocking, but it is not dissimilar to the mantra “when it’s brown we flush it down, but when it’s yellow we let it mellow” passed on to children who live in areas ridden by water droughts and rationing [34]. This paper does not suggest we all adopt these actions, far from it, however it does suggest that by thinking along these lines more inventive solutions for the way we consider sanitary waste within cities. Perhaps a dual track approach could be adopted within the home. Offices already separate urine flushing (for males) from WC flushing (for solids only). After all the volumes of “held” water within toilets in urban areas (i.e., in a U-bend-required to keep out odours out; and in a cistern—to flush) is not inconsiderable. What if, for example, the design brief for a city is to “design” these out how might this be achieved? Perhaps some type of holding mechanism for urine that is automatically flushed once a day? This is eminently possible, not least if urine became a more valuable resource? Research is already looking at it from an energy supply perspective [35]. The answer is not clear cut, although pneumatic systems are an option, and there could be numerous other options—available or yet to be thought of. One important consideration obviously would be upon outward flows to the sewerage system and this would need to be investigated further also. The point here is about moving us beyond what we now or accept as the “norm” and to provide us with a robust band-rating (including benchmarking) framework that allows for monitoring and measurement along the way. The role of user behaviour and technological efficiency (in isolation) is used here to exemplify the role of the proposed band rating system, a more in depth analysis of these highly influential factors (in isolation and conjunction) can be found in Zadeh, Hunt and Rogers [31]. The way in which water using behaviour and technological efficiency adoption changes by age, gender or demographics is unclear and perhaps this is a research challenge to be answered.
4.2. Policy
This paper does not advocate that policy should be used for water certification (using the proposed band rating system) of a building or an individual. However, when we consider that Domestic properties are currently metered it would be useful if the proposed benchmarking system (incorporating band ratings) were adopted within existing billing systems giving the user an idea of an individuals’ water use. When used alongside smart metering (advocated by existing UK policy and very much aligned with CSH philosophy, [36]) users might then begin to understand how each water use impacts upon the total water demand for a household.
The role of occupancy has been shown here to be influential on daily water use and band ratings or benchmarks that use the “per person” measure. Including this finding within policy is likely to be fraught with difficulty. Particularly so when considering the example of garden watering where the current value of 5 L/person/day significantly underestimates actual daily demands and the influence of location, occupancy, rainfall, temperature, plant type and garden size. Perhaps then the daily banding should be replaced with a yearly benchmark (per household) that allows for incorporation of fluctuations throughout the year.
On the supply-side perhaps systems should not be accredited just for their adoption more for how non-potable needs are being met through non-potable water supplies—thereby reducing consumption of mains water (see Lombardi et al. [37] for a description of the efficacy of water resilient solutions in city designs). Policy could stipulate that all non-potable demands are met through non-potable supplies. In this case a simple banning of outside taps would not be inappropriate. In addition policy could advocate the adoption of dual approaches (RWH and GW) for meeting non-potable demands—this paper has shown the significant advantages in terms of flattening the peaks and troughs in daily water-using performance, in particular where gardens are watered in summer months. This is particularly important if homeowners are being influenced to be more self-sufficient in home-growing and “greening” city centres where roof space is at a premium. One policy (or accreditation requirement) might suggest that all internal non-potable demands are met through GW and all outdoor demands such as gardening, but also car washing, are met by harvested rainwater. Green roof gardens (not least with food crops) or green walls can then be adopted only where they do not produce any additional pressure on city centre water supplies.
4.3. Economics
Economics (i.e., the costs to the water company and the costs to the consumer) is an important driver within the water sector. The water companies want to supply clean water whilst maintaining a profit for shareholders, whilst the consumer wants to minimise the outlay on water resources. The role of the policy maker (and water regulator) is to track water pricing and ensure that tariffs incentivise efficient, rather than profligate, water use whilst managing to alleviate “water-poverty”.
Payback periods for investment in water efficiency measures or localised supplies (e.g., RWH/GW) are highly influential in terms of whether the investments are small-scale (i.e., consumer invests within their property) or large-scale (i.e., city scale investment). Payback at small-scale is well reported within the literature, although the feasibility of making an economic investiment in a non-potable city network allowing all non-potable demands to be met through non-potable supplies is not. Such a network would seek to make the links between producers and users of non-potable water, for example a producer may have a large roof space and capture rainfall yet have very low or no non-potable demands (e.g., a warehouse). Whereas a user might have high non-potable demands yet have low supplies (e.g., offices). Further work is needed in this area. In addition the impact of the highly influential parameters highlighted herein should to be investigated. In all cases transport and treatment of water will have an additional cost that needs to be factored in [38]. As water efficiency measures are improved the requirement for non-potable supplies within buildings (be it domestic or other) decreases and hence the payback period will become longer, although if external demands, in particular gardening (but also vehicle washing) are included payback periods will improve significantly. In addition home urban growing of vegetables could reveal economic (and health) benefits. (The water demands are broadly similar to those for grassland and shrubs analysed here (in fact the Blaney Criddle assumes grassland as the highest base case against which “crop” water demands are calculated.) This benefit comes from the reduced cost of going to the supermarket in addition to the reduction in “embedded” transportation (and importing) costs which are not insignificant—this argument strengthens further when carbon costs are factored in. However, there is the important question of whether we will, in the not too distant future, have enough water to go round within a city centre landscape for all these different “internal” and “external” demands, even with the addition of non-potable supplies? If we do not then the “value’ and “cost’ of water will increase substantially. (Interestingly in Southern Ireland Domestic water rates were abolished in 1997 and without them there has been little to incentivise the “value” of water. With their imminent (re)introduction in January 2015 it will be interesting to see how its “value” changes).
The benchmarking system presented here could have a role in improving users value of water as it could align directly with a pricing structure-rewarding “non-profligate users” (i.e. ,those that reduce consumption of mains water) whilst alleviating “water poverty” (i.e. ,band A + use could be for free with price tariffs increasing for each band rating). The big users (band G) would pay the most and drives home the ethos of “the polluter pays” principle—which is definitely the case when water related carbon costs are included. (Tiered rate systems operate in many countries, including parts of the USA but not so for the UK). This does assume that water use is price-elastic [39,40,41,42] and many authors report this is simply not the case [43,44,45,46,47] therefore it is debatable whether such an approach would be successful in reducing water demand. Even if peoples’ water use was not changed through such an approach any increase in revenue could be used to invest in additional water supplies such as non-potable networks. However, if it were successful any loss in revenue may also be unacceptable to shareholders and lead to decreased investment in water infrastructure per se.
This may produce difficulties for water companies in knowing exactly what the total daily water use is per person based on metered records alone. Although information on occupancy rates does form part of the council tax assessment system—however loopholes might then exist where occupants are registered “at home” and yet live away for substantial periods inadvertently bringing down the measured daily water usage per person. This merely illustrates the difficulties of introducing any “fit-for-purpose” measurement/charging system that is fair for all.
4.4. Feasibility and Acceptability of a Benchmarking Approach (Using Band Ratings)
The feasibility for adopting any daily benchmarking system for a household will always come into question given the fluctuations that have been highlighted within this paper. In many respects no two days are the same when it comes to water demands of a household or an individual. For example, seasonality is statistically significant on both water demands [48] (not least due to changes in behaviour or additional demands brought on through hotter weather, e.g., more frequent showering) and water supply availability due to variability in precipitation (although RWH tanks are sized to account for this variability so they should not run short). And whilst a yearly household band rating system might flatten out the peaks and troughs, it would be hard to perceive based on the changing dynamics of a household over a lifetime. The essential element is “feedback” systems that inform individuals of their daily use (compared to a standard) in order that behavioural and/or technological efficiency adjustments are made. This is possible through adoption of the benchmarking system (using a band rating) as advocated within this paper and its impact, acceptability and feasibility would be improved if twinned with a smart metering system (one that informs the user how much water they use in real-time).
Whilst Policy can go so far, there are always going to be issues around public acceptability when bringing in policy to engender adoption of new approaches. For example, would the benchmarking system and associated band rating be viewed as overly intrusive? The answer is likely yes, only if water using performance is made public knowledge—and this might be considered intrusive for those that have something to hide but less so for those that do not. Certainly by adopting such an approach and by making users/owners/operators aware of how their water use compares (perhaps through league tables) to the norm gives precedence to a more pertinent worry of accountability. And it could be argued that this is good if we truly are to have sustainable water management.
The benchmarking system proposed here was developed for an individuals’ domestic use merely to show the principles on which a band rating could be based and the influences that could impact upon it. In essence the methodological approach could be used by individuals within any water using sector. The important point here is for water users to be informed of how they are performing in relation to how they could perform - in order that a step change in water use is achieved.
5. Conclusions
This paper introduces a new benchmarking system (using a band rating) for measuring water-use performance of a domestic water user in the UK. It has been shown to provide significant advantages when compared to existing accreditation systems like the CSH. Its generic approach and the various band ratings adopted therein are appropriate for use in any country and this lends itself well to ease of comparison. The novel approach to analysis which compares five options side-by-side helps significantly when making an informed assessment, not least when so many interdependencies are at play. The influences of demand-side and supply-side approaches were considered from where it was found that user behaviour has an equally, if not more influential role on demands than technological efficiency alone. It is suggested that any band-rating (and associated accreditation) is best aligned with overall potable mains water consumption (as adopted here) and should not have a preference for either user technology or user behaviour. The choice of how reductions are achieved should be down to the end-user. The influence of location, occupancy rates, demand profiles and supply type were found to be highly influential on water using performance and yet these are ignored by accreditation systems like CSH. This is particularly true in summer months where water demands are highest and localised supplies (e.g., RWH) are lowest. The proposed “A+” to “G” band rating system holds great potential for allowing swifter progress towards achievement of a more sustainable “city” water management where “liveability” options and a valid form of water-use measurement are required. However, Social, Economic, Political Technical and Environmental influences (i.e., resource security and carbon reduction) will all have major roles to play in achievement of this aim.
Acknowledgements
The authors wish to thank the Engineering and Physical Sciences Research Council for their support under the Liveable Cities (EP/J017698) Programme Grant. In addition the authors wish to thank all three reviewers for their most useful comments which have helped to strengthen the paper significantly.
Author Contributions
Dexter V.L. Hunt undertook the main body of the research within this paper. Contributions from Christopher D.F. Rogers helped shape the discussion sections of the paper and provided critical judgement on the research being undertaken.
Conflicts of Interest
The authors declare no conflict of interest.
References and Notes
- World Economic Forum. Insight Report—Global Risks 2014, 9th ed.; World Economic Forum: Geneva, Switzerland, 2014; pp. 12–26. [Google Scholar]
- Office for National Statistics. National Population Projections, 2010-Based Statistical Bulletin. Available online: http://www.ons.gov.uk/ons/rel/npp/national-population-projections/2010-based-projections/stb-2010-based-npp-principal-and-key-variants.html (accessed on 6 March 2014).
- Department for Environment, Food and Rural Affairs. Future Water: The Government’s Water Strategy for England; Defra: London, UK, 2008. [Google Scholar]
- Department for Communities and Local Government (DCLG). Code for Sustainable Homes: Technical Guide. Department for Communities and Local Government: London, UK, 2010; pp. 82–91. [Google Scholar]
- Walton, J.S.; El-Haram, M.; Castillo, N.H.; Horner, R.M.W.; Price, A.D.F.; Hardcastle, C. Integrated assessment of urban sustainability. Eng. Sustain. 2005, 158, 57–65. [Google Scholar] [CrossRef]
- Hunt, D.V.L.; Lombardi, D.R.; Rogers, C.D.F.; Jefferson, I. Application of Sustainability Indicators in Decision-Making Processes for Urban Regeneration Projects. Eng. Sustain. 2008, 161, 77–92. [Google Scholar] [CrossRef]
- Hunt, D.V.L.; Jefferson, I.; Gaterell, M.; Rogers, C.D.F. Planning for sustainable utility infrastructure. Urban Des. Plan. 2009, 162, 187–201. [Google Scholar] [CrossRef]
- Hunt, D.V.L.; Rogers, C.D.F.; Jefferson, I. Scenarios analysis through a future performance framework. Eng. Sustain. 2013, 166, 258–271. [Google Scholar] [CrossRef]
- Nolde, E. Possibilities of rainwater utilisation in densely populated areas including precipitation runoffs from traffic surfaces. Desalination 2007, 215, 1–11. [Google Scholar] [CrossRef]
- Eriksson, E.; Auffarth, K.; Henze, M.; Ledin, A. Characteristics of grey wastewater. Urban Water 2002, 4, 85–104. [Google Scholar] [CrossRef]
- Leggett, D.J.; Brown, R.; Brewer, D.; Stanfield, G.; Holliday, E. Rainwater and Grey Water Use in Buildings; The Construction Industry Research and Information Association (CIRIA): London, UK, 2001. [Google Scholar]
- Kingspan. Lighthouse: Level 6 Net-Zero Carbon House (Fact File). Kingspan: County Cavan, Ireland, 2009. [Google Scholar]
- Syme, G.J.; Nancarrow, B.E.; Seligman, C. The evaluation of information campaigns to promote voluntary household water conservation. Eval. Rev. 2000, 24, 539–578. [Google Scholar] [CrossRef]
- EUR-Lex. Council Directive 92/75/EEC of 22 September 1992 on the indication by labelling and standard product information of the consumption of energy and other resources by household appliances. Available online: http://eur-lex.europa.eu/legal-content/EN/TXT/?uri=CELEX:31992L0075 (accessed on 6 March 2014).
- Buzek, J.; Lopez Garrido, D. Directive 2010/30/EU of the European Parliament and of the Council of 19 May 2010 on the indication by labelling and standard product information of the consumption of energy and other resources by energy-related products. Available online: http://eur-lex.europa.eu/LexUriServ/LexUriServ.do?uri=OJ:L:2010:153:0001:0012:en:PDF (accessed on 6 March 2014).
- Gov.UK. Buying or selling your home. Available online: https://www.gov.uk/buy-sell-your-home/energy-performance-certificates (accessed on 8 March 2014).
- Macrory, I. Measuring National Well-being—Households and families; Office for National Statistics: London, UK, 2012. Available online: http://www.ons.gov.uk/ons/dcp171766_259965.pdf (accessed on 1 March 2014).
- British Standards Institution (BSI). BS 8515:2009 Rainwater Harvesting Systems—Code of Practice; British Standards Institution: London, UK, 2009. [Google Scholar]
- Mitchell, G. Aquacycle—A Daily Urban Water Balance Model; Cooperative Research Centre (CRC) for Catchment Hydrology: Victoria, Australia, 2005. [Google Scholar]
- Mitchell, V.G.; McMahon, T.A.; Mein, R.G. Components of the Total Water Balance of an Urban Catchment. Environ. Manag. 2003, 32, 735–746. [Google Scholar] [CrossRef]
- Ward, S.; Memon, F.A.; Butler, D. Rainwater Harvesting: Model-Based Design Evaluation. Water Sci. Technol. 2010, 61, 85–96. [Google Scholar] [CrossRef]
- Met Office. Regional mapped climate averages. Available online: http://www.metoffice.gov.uk/climate/uk/averages/regmapavge.html (accessed on 11 March 2014).
- Hunt, D.V.L.; Jefferson, I.; Rogers, C.D.F. Testing the Resilience of Underground Infrastructure Solutions through an Urban Futures Methodology. Available online: http://programm.corp.at/cdrom2012/papers2012/CORP2012_97.pdf (accessed on 3 March 2014).
- Hunt, D.V.L.; Lombardi, D.R.; Farmani, R.; Jefferson, I.; Memon, F.A.; Butler, D.; Rogers, C.D.F. Urban Futures and the Code for Sustainable Homes. Eng. Sustain. 2012, 165, 37–58. [Google Scholar] [CrossRef]
- Food and Agriculture Organization (FAO). Yield Response to Water; Food and Agriculture Organization: Rome, Italy, 1986. [Google Scholar]
- Downing, T.E.; Butterfield, R.E.; Edmonds, B.; Knox, J.W.; Moss, S.; Piper, B.S.; Weatherhead, E.K. Climate Change and Demand for Water; Stockholm Environment Institute Oxford Office: Oxford, UK, 2003. [Google Scholar]
- Roebuck, R.M. A Whole Life Costing Approach for Rainwater Harvesting Systems. Ph.D. Thesis, University of Bradford, Bradford, UK, 17 July 2007. [Google Scholar]
- Doorenbos, J.; Pruitt, W.O. Guidelines for Predicting Crop Water Requirements; Food and Agriculture Organization: Rome, Italy, 1992. [Google Scholar]
- UN. Water for People Water for Life—The United Nations World Water Development Report. Available online: http://unesdoc.unesco.org/images/0012/001295/129556e.pdf (accessed on 12 January 2014).
- Zadeh, S.M.; Hunt, D.V.L.; Lombardi, D.R.; Rogers, C.D.F. Shared Urban Grey water Recycling Systems: Water Resource Savings and Economic Investment. Sustainability 2013, 5, 2887–2912. [Google Scholar] [CrossRef]
- Zadeh, S.M.; Hunt, D.V.L.; Rogers, C.D.F. Future Water Demands: The Role of Technology and User Behavior. Available online: http://www.sciforum.net/conference/wsf3/paper/2167/download/pdf&sa=U&ei=BppsU4CFJtTh8AWXm4KQCQ&ved=0CB4QFjAA&usg=AFQjCNGJpoME5LbpjB2_5zyGbi0DUHX2dw (accessed on 6 January 2014).
- Spehr, K.; Curnow, R. Behaviour Change Framework for Our Water Our Future; Our Water Our Future (OWOF) Behaviour Change Framework: Victoria, Australia, 2007. [Google Scholar]
- Mangan, L. Peeing in the shower—The rules. The Guardian. 6 August 2009. Available online: http://www.theguardian.com/lifeandstyle/2009/aug/06/peeing-in-shower-rules (accessed 31 January 2014).
- Green idea reviews. If It’s Yellow, Let It Mellow Review—Does it Work? Available online: http://www.greenideareviews.com/2012/04/18/if-its-yellow-let-it-mellow-review-does-it-work/ (accessed on 8 February 2014).
- Ieropouolos, I.; Greenman, J.; Melhuish, C. Urine utilisation by microbial fuel cells; energy fuel for the future. Phys. Chem. Chem. Phys. 2012, 14, 94–98. [Google Scholar] [CrossRef]
- Nicholl, A.; Perry, M. Smart Home Systems and the Code for Sustainable Homes; IHS Building Research Establishment (BRE) Press: Bracknel, UK, 2009. [Google Scholar]
- Lombardi, D.R.; Leach, J.M.; Rogers, C.D.F.; Aston, R.; Barber, A.R.G.; Boyko, C.; Brown, J.; Bryson, J.R.; Butler, D.; Caputo, S.; et al. Designing Resilient Cities: A Guide To Good Practice; IHS Building Research Establishment (BRE) Press: Bracknell, UK, 2012; Volume 103. [Google Scholar]
- Zadeh, S.M.; Hunt, D.V.L.; Lombardi, D.R.; Rogers, C.D.F. Carbon Costing for Mixed-Use Greywater Recycling Systems. Water Manag. 2013, 16, 1–15. [Google Scholar]
- Wong, S.T. Model on Municipal Water Demand: A Case Study of North Eastern Illinois. Land Econ. 1972, 48, 34–44. [Google Scholar] [CrossRef]
- Nieswiadomy, M.L.; Molina, D.J. Comparing Residential Water Demand Estimates Under Decreasing and Increasing Block Rates Using Household Demand Data. Land Econ. 1989, 65, 280–289. [Google Scholar] [CrossRef]
- Dandy, G.; Nguyen, T.; Davies, C. Estimating Residential Water Demand in the Presence of Free Allowances. Land Econ. 1997, 73, 125–139. [Google Scholar] [CrossRef]
- Pint, M.E. Household Responses to Increased Water Rates during the California Drought. Land Econ. 1999, 75, 246–266. [Google Scholar] [CrossRef]
- Gaudin, S. Effect of Price Information on Residential Water Demand. Appl. Econ. 2006, 38, 383–393. [Google Scholar] [CrossRef]
- Mazzanti, M.; Montini, A. The Determinants of Residential Water Demand: Empirical Evidence for a Panel of Italian Municipalities. Appl. Econ. Lett. 2006, 13, 107–111. [Google Scholar] [CrossRef]
- Renwick, E.M.; Archibald, S.O. Demand Side Management Policies for Residential Water Use: Who Bears the Conservation Burden. Land Econ. 1998, 74, 343–359. [Google Scholar] [CrossRef]
- Strand, J.; Walker, I. Water Markets and Demand in Central American Cities. Environ. Dev. Econ. 2005, 10, 313–335. [Google Scholar] [CrossRef]
- Espiñeira, R.M.; Nauges, C. Is All Domestic Water Consumption Sensitive to Price Control? Appl. Econ. 2004, 36, 1697–1703. [Google Scholar] [CrossRef]
- Espiñeira, R.M. Residential Water Demand in the Northwest of Spain. Environ. Resour. Econ. 2002, 21, 161–187. [Google Scholar] [CrossRef]
© 2014 by the authors; licensee MDPI, Basel, Switzerland. This article is an open access article distributed under the terms and conditions of the Creative Commons Attribution license (http://creativecommons.org/licenses/by/3.0/).
Share and Cite
MDPI and ACS Style
Hunt, D.V.L.; Rogers, C.D.F. A Benchmarking System for Domestic Water Use. Sustainability 2014, 6, 2993-3018. https://doi.org/10.3390/su6052993
AMA Style
Hunt DVL, Rogers CDF. A Benchmarking System for Domestic Water Use. Sustainability. 2014; 6(5):2993-3018. https://doi.org/10.3390/su6052993
Chicago/Turabian StyleHunt, Dexter V. L., and Christopher D. F. Rogers. 2014. "A Benchmarking System for Domestic Water Use" Sustainability 6, no. 5: 2993-3018. https://doi.org/10.3390/su6052993