Article

Simulating Urban Growth Using the SLEUTH Model in a Coastal Peri-Urban District in China

1
College of Computer and Information Engineering, Xiamen University of Technology, Xiamen 361024, China
2
Key Lab of Urban Environment and Health, Institute of Urban Environment, Chinese Academy of Sciences, Xiamen 361021, China
3
The Institute of Remote Sensing and Digital Earth, Chinese Academy of Sciences, Beijing 100101, China
*
Author to whom correspondence should be addressed.
Sustainability 2014, 6(6), 3899-3914; https://doi.org/10.3390/su6063899
Submission received: 8 April 2014 / Revised: 15 May 2014 / Accepted: 9 June 2014 / Published: 18 June 2014
(This article belongs to the Special Issue Sustainable Cities)

Abstract

:
China’s southeast coastal areas have witnessed rapid growth in the last two decades, owing mostly to their economic and social attractions. In this paper, we chose Jimei, a coastal peri-urban district of Xiamen city on the southeast coast of China, as a study area to explore the district’s growth dynamics, to predict future sprawl during the next decade and to provide a basis for urban planning. The SLEUTH urban growth model was calibrated against historical data derived from a series of Landsat TM 5 satellite images taken between 1992 and 2007. A Lee-Sallee value of 0.48 was calculated for the district, which is a satisfactory result compared with related studies. Five coefficients of urban growth, diffusion, spread, breed, slope resistance and road gravity had values of 25, 68, 86, 24 and 23, respectively, in 2007. The growth coefficients (i.e., urban character) can capture urban growth characteristics in Jimei district. The urban DNA revealed that, over the study period, urban growth in the district was dominated both by urbanization through establishment of new urban centers, and by expansion outward from existing urban centers. In contrast to interior cities, in which expansions are dramatically shaped by actual road patterns, urban expansion in the district was likely constrained by the nearby coastline. Future urban growth patterns were predicted to 2020 assuming three different development scenarios. The first scenario simulated a continuation of historical urban growth without changing current conditions. The second scenario projected managed growth in which urban growth is limited by a layer with areas excluded from urbanization, which is the future development plan for Jimei district and Xiamen city. The third scenario depicted a growth with maximum protection in which growth was allowed to continue, similar to the second scenario, but with lower diffusion and spread coefficients applied to the growth pattern. The third scenario demonstrated that valuable land could be saved, which is the most desirable outcome for Jimei urban development. The study showed that SLEUTH can be an extremely useful tool for coastal city managers to explore the likely outcomes of their city development plans.

1. Introduction

Urbanization has been described as a massive unplanned global experiment affecting increasingly large areas of the Earth [1,2]. A century ago, approximately 15% of the world’s population was living in urban areas, while today the proportion is nearly 50%. By 2030, approximately 5 billion people are expected to reside in urban areas and they will account for 60% of the planet’s 8.3 billion people [3]. As a developing country, China’s urbanization over the last 30 years is unprecedented in human history. In 1978, only 170 million Chinese lived in cities, representing 17.4% of the country’s population; by the end of 2012, 712 million people lived in China’s cities, not just half the country, but 10.1% of the world’s population. Among the world’s cities, coastal urban areas with the highest population density have become the most dynamic economic regions in the world. Almost one-third of the world’s human population lives within 100 km of the sea and two-thirds of all cities with over 2.5 million inhabitants are located on the coast [4]. More than 6% of the American population lives in the New York metropolitan area, the largest US metro area, which accounts for approximately 8.5% of national gross domestic production (GDP) according to 2012 figures [5]. Similarly, nearly one in nine Chinese people live in the Yangtze River Delta, China’s largest super city, which represents approximately 17.3% of its GDP according to 2012 figures [6]. With the exploding growth in urbanization, cities, especially coastal cities, exert heavy pressure on lands and resources at their periphery [7,8,9,10,11], which in turn impacts the environment [12]. In the decision-making process for such areas, land managers need to carefully consider the changes brought about by urban sprawl [13].
Urban growth is manifested in both population size and spatial extent. In China, the current major pattern of urban development is increasingly taking the form of concentric circles around a central area, for example, “sprawl”, which is distinct from the form of low-density, decentralized residential and commercial development in industrialized countries [14]. Recent examples of urban sprawl include Beijing, Shanghai and Xiamen city. Central areas can have a very high level of population and economic accumulation, whereas peripheral areas have much lower levels of accumulation. For example, the average population density on Xiamen Island, the core urban area of Xiamen city in China, reached an astonishing 13,537 people per square kilometer by 2012, about 11 times that of the off-island districts, which stand at 1228 per square kilometer [15]. This form of disorderly development often leads to a series of classic symptoms, such as loss and fragmentation of natural resources, environmental pollution, residential crowding and traffic congestion. For these reasons, understanding urban systems and evaluating the impacts of urban growth on the environment are imperative and of great importance to those who study urban dynamics and those who must manage resources and provide services in these rapidly changing environments [16].
Computer modeling is essential for the analysis, and especially for the prediction, of the dynamics of urban growth [17]. Rapid progress in remote sensing (RS), geographic information systems technology (GIS) and computer science, has allowed new spatial modeling approaches, such as cellular automata (CA), artificial neural networks [18], statistical models [19], and multi-agent models [20] to emerge [13]. Using these models, policy makers can analyze different scenarios of urban growth, land use change and evaluate their effects in support of land use planning and policy [21]. Among the dynamic models, CA models, originally proposed by Ulam and Von Neumann in the 1940s, are among the most remarkable urban growth models because of their flexibility, simplicity in application, and their close ties to remote sensing data and geographic information systems (GIS) [13,22,23,24]. Since Couclelis [25,26] provided the theoretical relationship between geographical CA and urban land use change dynamics, a variety of CA models such as SLEUTH [27], the dynamic urban evolution model (DUEM) [28], the multi criteria evaluation (MCE)-CA model [29], the multi-agent system (MAS)-CA model [30], the GeoCA-Urban model [31], the Voronoi-CA model [32] and the Markov-CA model [33] have been developed to simulate urban land use change and urban expansion. Major achievements in various aspects of urban CA modelling have been discussed extensively [27,34,35,36,37].
The SLEUTH model is a CA-based urban growth model coupled with a land-cover-change model [27]. It can project urban growth based on historical trends with urban/non-urban data or with detailed categorized land use data under different developmental conditions [27]. Silva [38] pointed out that the parameters derived from calibration of the Sleuth model can be compared among different urban systems, and the interpretation can provide a foundation for understanding the urban growth processes unique to each urban system (its regional DNA). The parameters values (i.e., an urban DNA) can serve as valuable elements to describe a region’s character. The majority of SLEUTH applications have been for urban forecasting, for integrated modeling of urban growth with some other social or physical process model [39,40] or planning effort throughout various regions of the United States and the world [17,27,41,42,43,44]. Unfortunately, the successful application of a particular urban growth model in some geographical areas does not necessarily mean that it will be successful in other areas. Differences in the physical and social environment in a coastal city in China, for example, may be too great for the model to accommodate. The urban growth trend of coastal cities in China is an issue that is well worth exploring. However, it is critical to test the model’s performance before using it to predict future expansion of urban areas. We took Jimei district in Xiamen city, one of China’s five special economic zones, as representative of a coastal peri-urban district in China.
The objectives of this study are to: (1) test the SLEUTH model’s ability to simulate urban growth and historical urban expansion in a coastal city from 1992 to 2007; (2) to compare urban DNA between the coastal city and other cities of the world; and (3) to predict its expansion patterns from 2007 to 2020 under different scenarios to provide a basis for urban planning.

2. Methods and Procedures
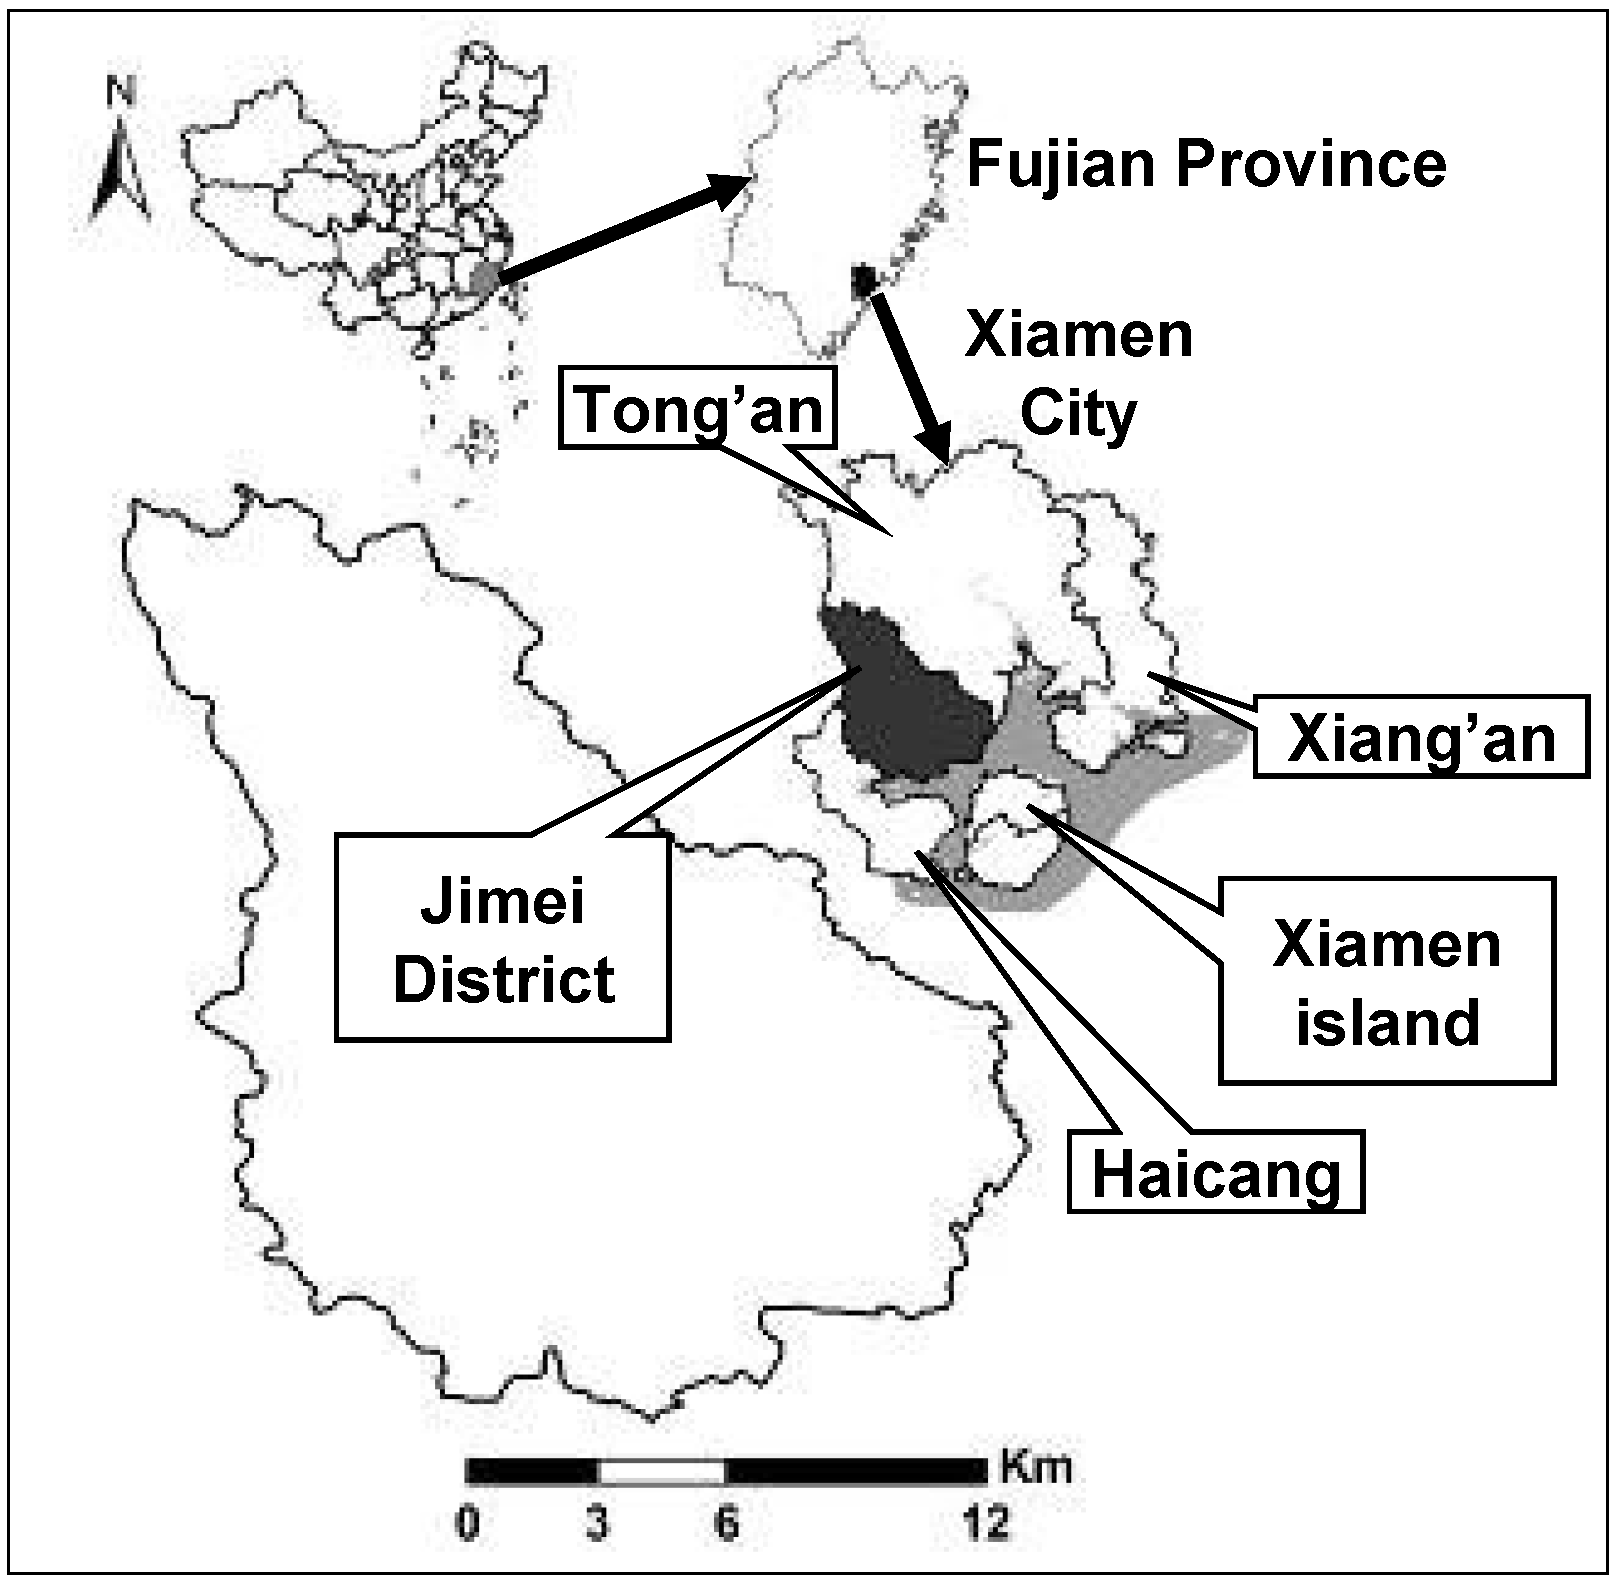
2.1. Study Area

Jimei district (117°57′–118°04′ E, 24°25′–24°26′ N) is one of the six administrative areas of Xiamen city, located on the southeast coast of Fujian Province, China (Figure 1). Since the town of Xinling was placed under the jurisdiction of the district in 2003, Jimei has had an area of 275.79 km2. It has a northern subtropical monsoon climate with an average annual temperature of 20.5 degrees. Xiamen city has become one of the fastest growing coastal cities in China [45,46,47], experiencing a 210% increase in population from 1990 to 2012, reaching approximately 3.67 million in 2012. Xiamen Island, the heart of Xiamen city, has most of the city’s population, public resources and urban construction in recent decades. Approximately 52% of Xiamen’s population lives on Xiamen Island, which accounts for only about 8% of Xiamen’s total land area [15]. At present, there are policies that advocate diffusion of urban population and economic functions from Xiamen Island (central area) into four peri-urban areas (Figure 1) (i.e., Jimei, Haicang, Tong’an and Xiang’an district) in order to mitigate urban problems through satellite cities instead of a central city.
Figure 1. Location of the study area (grey indicates sea).
Sustainability 06 03899 g001
As a typical peri-urban area in southern China, Jimei district is now witnessing almost continual large-scale urbanization [46]. According to the national census in 2000, Jimei district had a population of over 289,000 people; by 2012 the population had doubled to 607,000 people [15]. The amount of urbanized land in the Jimei district increased by 57% from 1992 to 2007, reaching 55 km2 in 2007. The rapid urbanization has impacted natural resource lands, including those with agriculture, forest and wetlands. They have been replaced by land uses with more impervious surfaces, which has led to a series of problems such as farmland shortages, water quality deterioration, eutrophication of offshore waters and occurrence of red tides in the district [46,47].

2.2. SLEUTH Model Description

The CA-based SLEUTH model was developed by Clarke et al. [27] and was designed to simulate urban growth and land cover change. Its name comes from an acronym for the input image requirements for driving the model: Slope, Land use, Exclusion, Urban extent, Transportation and Hillshade. SLEUTH simulates urban dynamics through four growth rules: spontaneous growth, new spreading center growth, edge (organic) growth and road-influenced growth. Each type of growth is applied sequentially during each cycle, and is controlled by five coefficients, namely diffusion, breed, spread, slope resistance, and road gravity [48]. As pointed out by Silva [38], the five coefficients (i.e., an urban DNA) can vary from city to city and they capture a region’s character. The coefficients are dimensionless integers that range from 0 to 100 and represent the relative contribution of the corresponding parameter to urban dynamics within a study area. Spontaneous growth simulates the random urbanization of land and is controlled by a diffusion coefficient. New spreading center growth determines whether any of the new spontaneously urbanized cells will become new urban spreading centers using the breed coefficient. Edge-growth simulates growth that occurs outward from existing urban centers as well as from urban infilling. It is controlled by the spread coefficient, which influences the probability that a non-urban cell with at least three neighbors will become urbanized. Road-influenced growth simulates the influence of the transportation network on growth patterns and is controlled by the diffusion, breed and spread coefficients [48]. In addition, SLEUTH also has a self-modification rule that allows the coefficients to change according to the urban growth rate [27]. With self-modification, SLEUTH can produce linear, exponential or S-shaped urban growth curves, which can realistically reflect different rates of urban sprawl. Further details on the theoretical background of SLEUTH can be found in the literature [17,27,49].

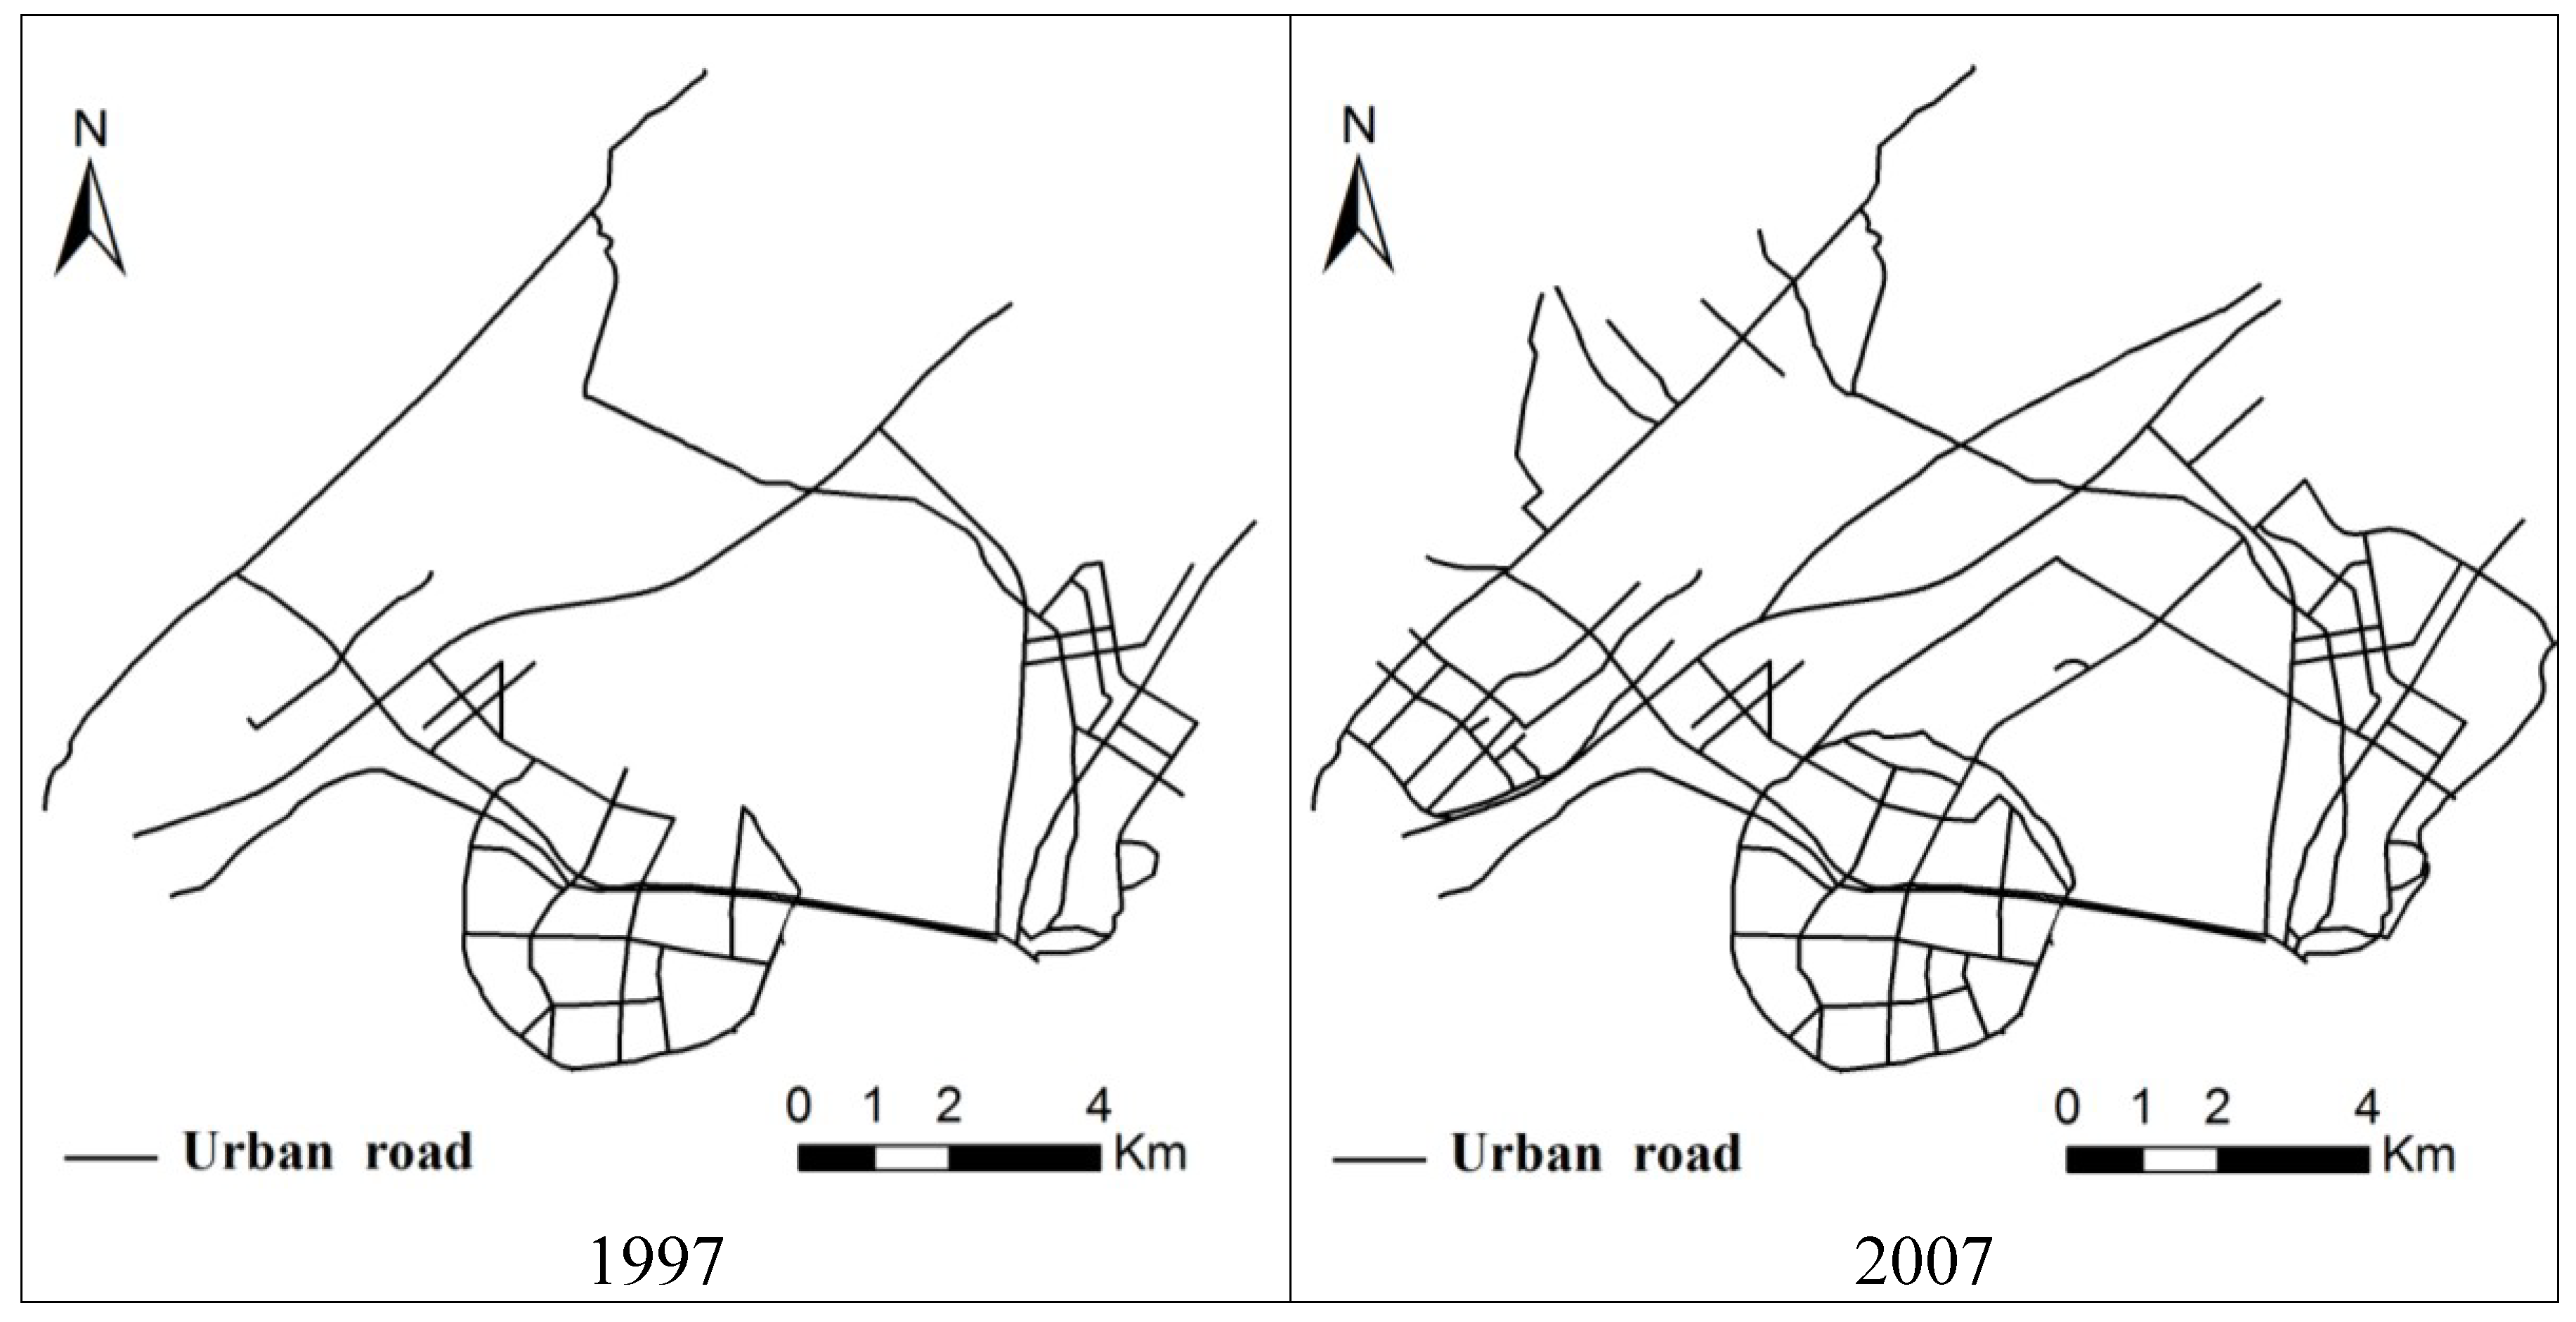
2.3. Input Preparation

SLEUTH requires inputs of historic urban extent from at least four time periods, at least two historic land use layers, a historic transportation network from at least two time periods, a single layer containing percent topographic slope, a layer with areas excluded from urbanization (the model allows classification in the layer by probability of exclusion), and a hillshade layer for use only as a background with the graphical version of the model [17].
Urban extent and land use data were obtained from four Landsat TM5 scenes of the study area acquired on 15 January 1992, 12 January 1997, 2 January 2002 and 8 January 2007. All images were rectified to a common Universal Transverse Mercator coordinate system based on the topographic maps with an accepted root mean squared (RMSE) statistic. The land use data set was classified into five types: urban land, bare land (bare soil or rock areas), forestland, farmland and water (reservoirs, ponds and sea). Visual interpretation of the TM images was carried out to form the five land use classes using vector tools in Erdas Imagine, with the help of ancillary data including a topographic map (1:50,000 scale) and field data on land use and land cover in January 2007. The land use maps were then converted into binary urban or non urban layers to depict the profile of Jimei district dynamics since 1992 (Figure 2). Transport layers were also derived from visual image interpretation based on screen digitization of the TM images in 1992 and 2007 (Figure 3). Percentage slope and hillshade layers were computed from a DEM with 25 m resolution in GIS. The hillshade layer was used as a background image for model image output. All input data layers were rasterized at a 50 m resolution to the spatial extent of the study area, and then converted into digital images in GIF format as required by the model.
Figure 2. Urban expansion of Jimei district from 1992 to 2007.
Sustainability 06 03899 g002
Figure 3. Urban road networks of Jimei district in 1997 and 2007.
Sustainability 06 03899 g003

2.4. Model Calibration Procedures

Calibration is one of the most important elements of successful model application, since it allows us to narrow down the resulting values of the model to reflect the characteristics of the local study area [17]. The aim of calibration is to derive a set of coefficients that can effectively model urban growth during the historic time period. This is achieved in SLEUTH by a Monte Carlo method, where the user indicates a range of values and the model iterates with every possible combination and permutation of five control parameters from the seed year until the target year [14], in this case from 1992 to 2007. Calibration is carried out in three phases, coarse, fine and final. An optimal SLEUTH metric (OSM) (i.e., the product of the compare, population, edges, clusters, slope, X-mean, and Y-mean metrics) was used as the primary metric to evaluate performance of the model. OSM was developed by Dietzel and Clarke [49] to produce robust and unique results for SLEUTH calibration. After each calibration phase, a top set of OSM results determines the range of values used in the subsequent phase of calibration. Calibration of the SLEUTH model is described in further detail elsewhere [17]. During calibration phases, a series of indices are used to assess model fit, which is described in Table 1. The results of the calibration phases for modeling Jimei district growth are given in Table 2.
Table 1. Selected indices used to measure goodness of fit in the SLEUTH model [17].
IndexDescription
ProductA composite index which is the result of all scores multiplied together
CompareComparison of modeled final urban extent to real final urban extent
r2 populationLeast square regression score of modeled urbanization compared with actual urbanization for control years
Edges r2Least square regression score for modeled urban edge count compared with actual urban edge count for control years
R2 clustersLeast square regression score for modeled urban clustering compared with known urban clustering for control years
Average Slope r2Least square regression of average slope for modeled urbanized cells compared with average slope of known urban cells for control years
Xmean r2Least square regression of average x values for modeled urbanized cells compared with average X values of known urban cells for control years
Ymean r2Least square regression of average y values for modeled urbanized cells compared with average y values of known urban cells for control years
All indices range from 0 to 1 where one indicates that the modeled data match the control data exactly.
Table 2. The best results for the three phases of model calibration.
Index/stepCoarseFineFinal
Product0.350.380.41
Compare0.980.970.98
r2 population0.900.890.89
Edges r20.680.670.71
R2 clusters0.880.970.95
Slope r20.930.960.99
Xmean r20.880.860.86
Ymean r20.830.840.83
Diffusion502522
Breed505575
Spread506059
Slope resistance505558
Road gravity12520

3. Results and Discussion

3.1. Model Calibration

As shown in Table 3, there are five coefficients (urban DNA) controlling urban growth change over time in the three comparison years. An increase in the breed coefficient and a decrease in slope resistance over the calibration period were the most obvious changes. The breed coefficient increased from 75 to 86 after self-modification, while slope resistance decreased rapidly from 58 to 24. The increase in the breed coefficient showed that increasing growth came from new urban centers. The decrease in the slope resistance coefficient indicated that compared to past trends, more structures have been built on slopes in the area, which was also demonstrated by Ding [50] who simulated urban growth of Suao city in the Yilan Delta area of northeast Taiwan.
To assess the performance of spatial fit, we used a Lee-Sallee shape index expressed by the ratio of the intersection and the union of the simulated and actual urban areas in SLEUTH. A perfect spatial match would result in a value of 1, but achieving high values for this index is challenging [51]. We obtained a Lee-Sallee index of 0.48 by comparing urban extent predicted in 2007 after final calibration to an independently derived urban extent from a Landsat image. Some previous studies on SLEUTH results provided a context for our results. Clarke and Gaydos [51] achieved a Lee-Sallee value of 0.30 using an earlier version of the model. Silva and Clarke [17] obtained Lee-Sallee values of 0.35 for Lisbon and 0.58 for Porto. Hakan et al. [52] modeled urban growth of Houston and derived a Lee-Sallee value of 0.51. Thus, it appeared that the calibration process for this study was satisfactory.
Table 3 also indicated the urban growth characteristics of Jimei district. The high breed parameter showed that growth of new spreading centers was a major type of urban growth. Hakan et al. [52] reported a breed coefficient of 3 for the City of Houston, USA, whereas Jantz et al. [53] reported a value of 45 for Biltmore City. In fact, during the past 15 years city managers in Jimei district have worked to develop many new centers including Guankou industrial and residential areas, Houxi industrial area, the new train station area, as well as cultural and educational areas. Compared to other areas, the spread coefficient found in this study was relatively high, demonstrating that organic growth or edge growth is another important growth type in this area. A relatively low slope coefficient (24) showed that the topography was not a limiting factor for urban growth. This fact was confirmed by field checks and current data on new residential areas. The slope resistance coefficient was similar to that of Houston (22) [14], but was much lower than that of Atlanta (95) [27]. The relatively low diffusion coefficient showed that Jimei district has a relatively compact form of growth, with its main urbanization occurring near the existing urban areas and new urban centers. The low road gravity showed that urban growth has not been significantly affected by road networks. However, in contrast to interior cities, which can be centers of transportation routes connecting radially in any direction and are increasingly shaped by actual road patterns, Jimei growth may be affected by its proximity to the coast [54].
Table 3. Forecasting coefficients derived from the SLEUTH model.
YearDiffusionSpreadBreedSlope resistanceRoad_gravity
19972361785221
20022465824022
20072568862423
(1) Diffusion coefficient determines the overall outward dispersive nature of the distribution [13]. (2) Breed coefficient specifies how likely a newly generated detached settlement is to begin its own growth cycle [17]. (3) Spread coefficient controls the amount of outward “organic” expansion. A high spread coefficient reflects a high probability of urbanization outward from existing urban centers [17]. (4) Slope resistance influences the likelihood of settlement extending up steeper slopes [17]. (5) Road gravity attracts new settlement toward and along roads [13].

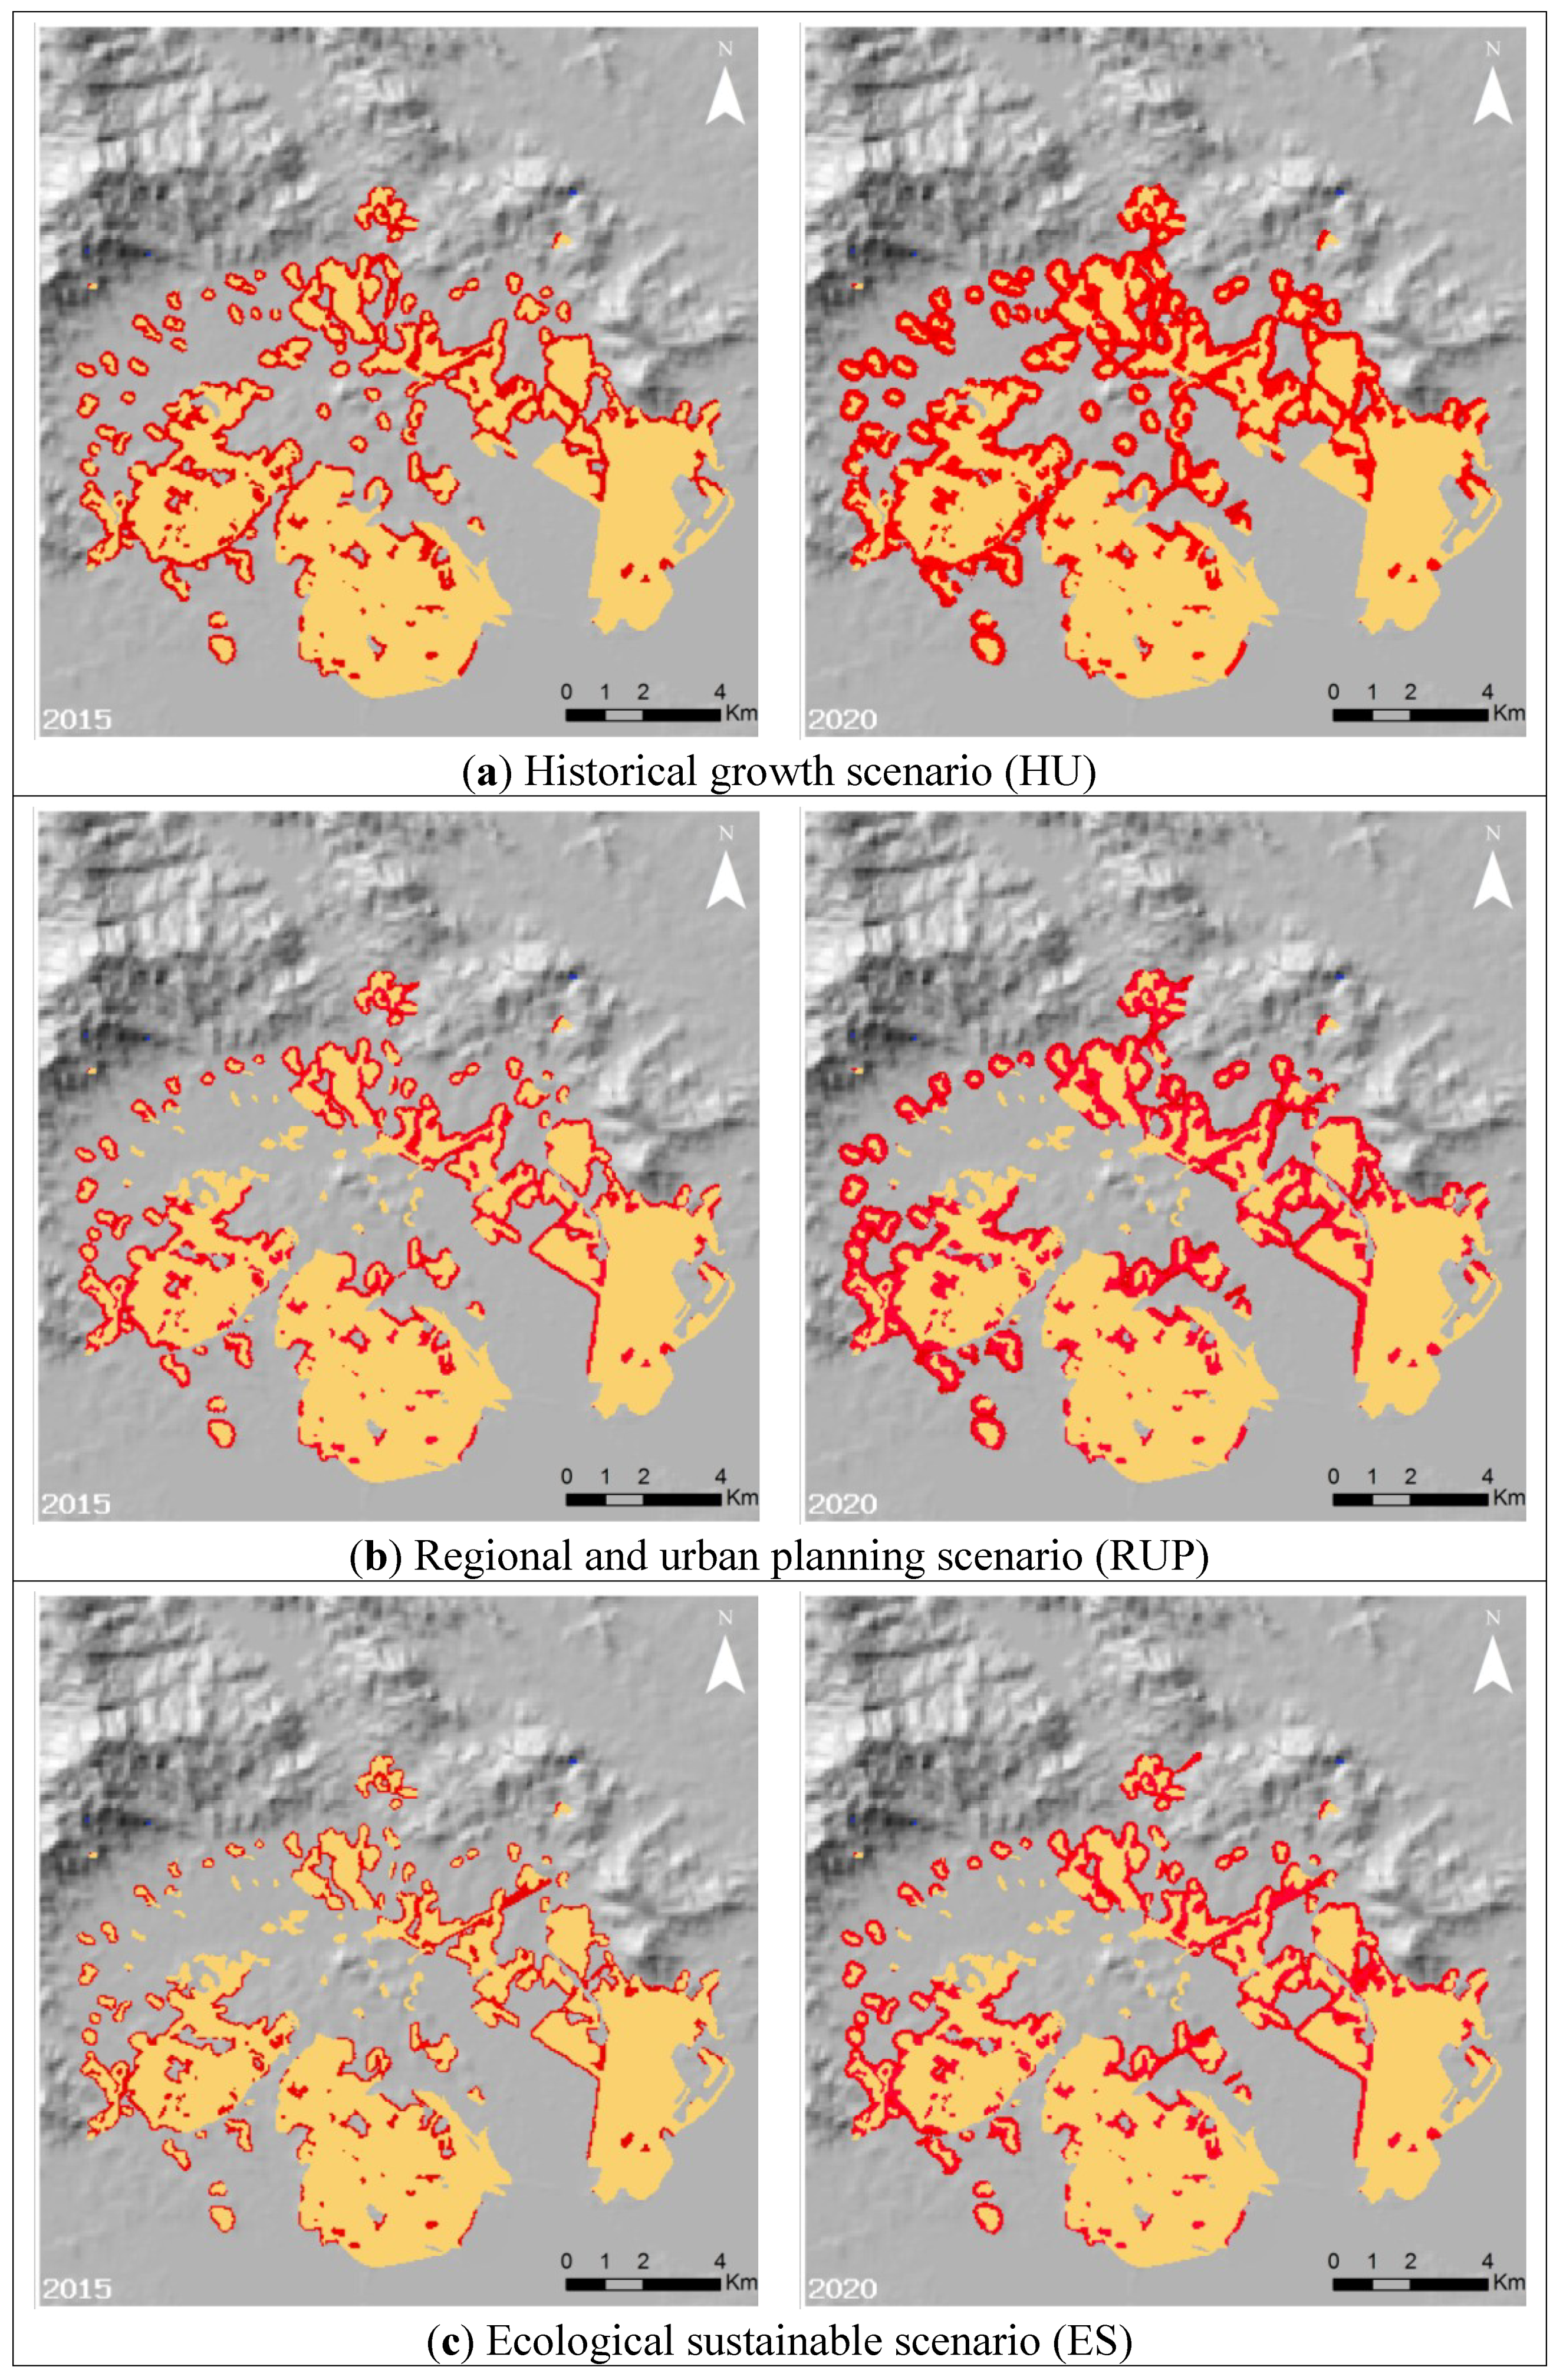
3.2. Model Scenarios and Predictions

Based on the calibration data, future urban growth trends were predicted to 2020 assuming three development scenarios: a historical growth scenario (HU), a regional and urban planning scenario (RUP) and an ecologically sustainable scenario (ES). The first scenario assumed that growth and development would continue along historical trends; urban growth was simulated with unchanged current conditions. For this scenario, parks and water were fully excluded from future development. We set 25, 68, 86, 24 and 23 (Table 3) for coefficients of urban growth, diffusion, spread, breed, slope resistance and road gravity, respectively. The second scenario projected a managed growth in which urban growth was limited using an excluded layer, e.g., [14,53], according to the future development plans for Jimei district and Xiamen city. The RUP scenario reflected a stronger commitment to spatially focused growth and resource protection. Areas excluded from future development according to city development plans included: (1) green belts 200–500 m in width along a provincial highway through the district, (2) green wedges (or green “lungs”) with an area of 22.65 km2, which are rural and scenic landscapes composed of farmland, forestland and water catchments, and (3) public green spaces (see Figure 4). In the third scenario, growth was allowed to continue similar to the second scenario with the same excluded layer, but lower diffusion and spread coefficients (12 and 45, respectively), e.g., [13,53] were applied to the growth pattern. The low diffusion and spread parameters helped to form a compact city that grows with its main urbanization occurring near existing urban areas and urban cores. The ES scenario, e.g., [13,33] reflected a more stringent set of policies targeted toward limited growth and natural resource protection and implied a more extreme set of protections on resource lands.
The results of the urban future extent predicted by SLEUTH are presented in Figure 5 and a comparison of the three scenarios is given in Figure 6. The historical growth shows that there is no limit to urban expansion. The area of the city expanded about 78% from 2006 to 2020, reaching 98.8 km2. The HU scenario showed the highest urban expansion, leading to the degradation of an overwhelming amount of land and natural resources.
According to the land use map derived from Landsat 5 TM in 2007, along with the DEM and slope map of Jimei district, only approximately 29% of the total area (275.79 km2) was suitable for urbanization because of slope, altitude and sea. The area of farmland resource was about 45 km2, accounting for 57% of the suitable urbanized area. Most of the farmland in Jimei district is fertile farmland (basic farmland), which the local people rely on. However, urban sprawl has occupied a large area of farmland. For this reason, there is an urgent need to protect the limited and valuable farmland areas within the district. The ES scenario produced a smaller increase in urban extent compared to both the HU and RUP scenarios, avoiding 17.78 km2 (p < 0.01, t-test) of growth compared to the HU scenario and 8.87 km2 (p < 0.01, t-test) compared to the RUP scenario in 2020. The ES scenario not only saved large areas of land and resources, but also led to a compact form of growth that facilitates provision of services for urban planning by city managers. Hence, the ES scenario should be the preferred choice for Jimei district.
Under each of the scenarios, new spreading centers of growth were projected to be the most important growth type for Jimei district (Figure 5). Three centers, including the Houxi industrial area, the new train station area, and the cultural and educational areas will gradually link up into a single area. In addition, the core area of Jimei new town around Xinglin Bay will become a new urban growth center.
Figure 4. Areas excluded from future development under the second and third scenarios of development in Jimei district.
Sustainability 06 03899 g004
Figure 5. Projected urban expansion of Jimei under three scenarios in 2015 (left) and 2020 (right).
Sustainability 06 03899 g005
Yellow represents urban area in 2007 and red indicates increased area of prediction in Jimei district. A: Guankou industrial and residential areas; B: Houxi industrial area; C: new train station area; D: cultural and educational areas; and E: core area of Jimei new town.
Figure 6. The urban extent of Jimei district up to the year 2020 under three scenarios.
Sustainability 06 03899 g006

4. Summary and Conclusions

Given the trend of increasing urban growth throughout the world, concerns over environmental degradation are increasing. Computer models, in particular CA models, can be used as innovative tools to understand the dynamics of urban systems and assess the impacts of urban growth on the environment. In this study, we applied the CA-based SLEUTH model to explore historic changes and predict future scenarios of expansion of a coastal city in southern China. Our research explored the suitability of utilizing one CA, the SLEUTH model, for regional planning applications.
We took note of the role of GIS and remote sensing techniques in applying the SLEUTH model, and rapidly extracted a considerable amount of data for modeling using remote sensing. GIS was essential to the input data preparation, model calibration and evaluation of growth impacts. Moreover, the results of the model were easily imported into GIS for presentation purposes.
In the study, we successfully calibrated the SLETUH model for Jimei district using the OSM method based on historic data from 1992 to 2007. The coefficients derived (urban DNA) from the calibration process were comparable with published values from other SLEUTH case studies. The growth coefficients showed very high breed and spread coefficients in Jimei district, which meant that the major drivers of urban growth in Jimei district were new edge growth and edge growth. The low road gravity coefficient suggested that urban expansion is constrained by the nearby coastline. The urban growth characteristics were captured using the urban DNA derived from SLEUTH through calibration. The urban DNA best describes the specific urban system, and so it can predict future developments. In attempting to define this DNA for each region, SLEUTH seems to be of great significance in planning studies. Urban DNA from SLEUTH allows for the understanding of how the different elements progress and constrain different regions, and what function they should have in shaping future scenarios [38,54].
We also designed three scenarios representing different growth strategies in our study area. Among the three scenarios, the third scenario provided the most environmental protection for Jimei district and a relatively small increase in the extent of urban land, which would be the most desirable result for urban development of Jimei.
Although the excluded layer is ideal for simulating the effects of conservation or regulatory policies, SLEUTH does not have an adequate mechanism to simulate the potential impacts of incentive policies. For example, a new town in Jimei district has been developed with great financial incentive and will be built by 2015. It is estimated that the total investment will reach up to 2.1 billion USD for this new town. With a planned core area (Figure 5c) of 6 km2 and 70,000 people in the new town, Xiamen’s municipal government hopes to diffuse the urban population and economic functions from Xiamen Island. We simulated this effect in the excluded layer by putting a resistance to development on land, but we were not able to simulate the attraction needed to rapidly form the new town, especially the core area. The inability to redirect growth pressure is a drawback of the SLEUTH model, which may not capture the real impact of implementing land-conservation measures. Apparently, incentive policies can prevent SLEUTH from being able to accurately capture urban growth patterns and processes. Despite these considerations, the results obtained from applying SLEUTH in a coastal peri-urban area demonstrate that the model has considerable potential as a decision-making tool and helps city managers to realize the outcome of possible actions they might take. It is expected that some insight into problems dealing with urbanization can be beneficial to coastal cities experiencing rapid urbanization in other parts of the world.

Acknowledgments

The authors would like to acknowledge the contributions of the National Science Foundation of Fujian Province (2013J01165), National Natural Science Foundation of China (41101143, 41101501) and Xiamen University of Technology (XYK201435), in funding and data collection support. We also thank three anonymous reviewers for their comments.

Author Contributions

Lizhong Hua made substantial contributions to design, data processing and analysis. Lina Tang participated in revising it critically and contributed to some conception of the study. Shenghui Cui contributed original Landsat TM images. Kai Yin was responsible for data cleaning. All authors had read and approved the final manuscript.

Conflict of Interest

The authors declare no conflict of interest.

References

  1. Alig, R.J.; Healy, R.G. Urban and built-up land area changes in the United States: An empirical investigates of determinants. Land Econ. 1987, 63, 215–226. [Google Scholar]
  2. Vaz, E.; Aversa, J. A Graph theory approach for geovisualization of land use change: An application to Lisbon. J. Spat. Organ. Dyn. 2013, 1, 254–264. [Google Scholar]
  3. UN (United Nation). World Urbanization Prospects: The 2001 Revision; Population Division: New York, USA, 2002; p. 182. [Google Scholar]
  4. Makgill, R.; Rennie, H. A model for integrated coastal management legislation: A principled analysis of New Zealand’s resource management act 1991. Int. J. Mar. Coast. Law. 2012, 27, 135–165. [Google Scholar] [CrossRef]
  5. The United States conference of mayors. U.S. metro economies. Available online: http://www.usmayors.org/metroeconomies/2013/201311-report.pdf (accessed on 8 April 2014).
  6. National Bureau of Statistics of China. China Statistical Yearbook 2013; China Statistics Press: Beijing, China, 2013. [Google Scholar]
  7. Leao, S.Z.; Bishop, I.D.; Evans, D. Simulating urban growth in a developing nation’s region using a cellular automata-based model. J. Urban.Plan. D-ASCE 2004, 130, 145–158. [Google Scholar] [CrossRef]
  8. Deng, H.B.; Song, M.; Chen, C.D.; Rong, B.L. Current situation and development of Chinese urban forestry. Int. J. Sustain. Dev. World Ecol. 2008, 15, 371–377. [Google Scholar] [CrossRef]
  9. Vaz, E.; Walczynska, A.; Nijkamp, P. Regional challenges in tourist wetland systems: An integrated approach to the Ria Formosa in the Algarve, Portugal. Reg. Environ. Change 2013, 13, 33–42. [Google Scholar] [CrossRef]
  10. Ren, Y.; Yan, J.; Wei, X.; Wang, Y.; Yang, Y.; Hua, L.Z. Effects of rapid urban sprawl on urban forest carbon stocks: Integrating remotely sensed, GIS and forest inventory data. J. Environ. Manag. 2012, 113, 447–455. [Google Scholar] [CrossRef]
  11. Zhang, Q.; Wallace, J.; Deng, X.; Seto, K.C. Central versus local states: Which matters more in affecting China’s urban growth? Land Use Policy 2014, 38, 487–496. [Google Scholar] [CrossRef]
  12. Kew, B.; Lee, B.D. Measuring sprawl across the urban rural continuum using an amalgamated sprawl index. Sustainability 2013, 5, 1806–1828. [Google Scholar] [CrossRef]
  13. Rafiee, R.; Salman, M.A.; Khorasani, N.; Darvishsefat, A.A. Simulating urban growth in Mashad City, Iran through the SLEUTH model (UGM). Cities 2009, 26, 19–26. [Google Scholar] [CrossRef]
  14. Hakan, O.; Klein, A.G.; Srinivas, R. Using the SLEUTH urban growth model to simulate the impacts of future policy scenarios on urban land use in the Houston-Galveston-Brazoria CMSA. Res. J. Soc. Sci. 2007, 2, 72–82. [Google Scholar]
  15. Xiamen Municipal Statistical Bureau of China. Xiamen Special Economic Zone Yearbook 2013; China Statistics Press: Beijing, China, 2013. [Google Scholar]
  16. Yang, X. Satellite monitoring of urban spatial growth in the Atlanta metropolitan area. Photogramm. Eng. Rem. Sens. 2002, 68, 725–734. [Google Scholar]
  17. Silva, E.A.; Clarke, K.C. Calibration of the SLEUTH urban growth model for Lisbon and Porto, Spain. Comput. Environ. Urban Syst. 2002, 26, 525–552. [Google Scholar] [CrossRef]
  18. Pijanowskia, B.C.; Brown, D.G.; Shellitoc, B.A.; Manikd, G.A. Using neural networks and GIS to forecast land use changes: A land transformation model. Comput. Environ. Urban Syst. 2002, 26, 553–575. [Google Scholar] [CrossRef]
  19. Cheng, J.; Masser, I. Urban growth pattern modelling: A case study of Wuhan city, PR China. Landsc. Urban Plann. 2003, 62, 199–217. [Google Scholar] [CrossRef]
  20. Benenson, I. Multi-agent simulations of residential dynamics in the city. Comput. Environ. Urban Syst. 1998, 22, 25–42. [Google Scholar] [CrossRef]
  21. Veldkamp, A.; Lambin, E.F. Editorial: Predicting land-use change. Agr. Ecosys. Environ. 2001, 85, 1–6. [Google Scholar] [CrossRef]
  22. Liao, J.F.; Tang, L.N.; Shao, G.F.; Qiu, Q.Y.; Wang, C.P.; Zheng, S.N.; Su, X.D. A neighbor decay cellular automata approach for simulating urban expansion based on particle swarm intelligence. Int. J. Geogr. Inf. Sci. 2014, 28, 720–738. [Google Scholar] [CrossRef]
  23. Kityuttachai, K.; Tripathi, N.K.; Tipdecho, T.; Shrestha, R. CA-Markov analysis of constrained coastal urban growth modeling: Hua Hin seaside city, Thailand. Sustainability 2013, 5, 1480–1500. [Google Scholar] [CrossRef]
  24. Liu, M.; Hu, Y.M.; Li, C.L.; Sun, F.Y.; Xu, Y.Y.; Chen, T. Combining CLUE-S and SWAT models to forecast land use change and non-point source pollution impact at a watershed scale in Liaoning province, China. Chinese Geogr. Sci. 2014, 24, 1–11. [Google Scholar] [CrossRef]
  25. Couclelis, H. Cellular worlds: A framework for modelling micromacro dynamics. Environ. Plann. A 1985, 17, 585–596. [Google Scholar]
  26. Couclelis, H. Macrostructure and microbehavior in a metropolitan area. Environ. Plann. B Plann. Des. 1989, 16, 141–154. [Google Scholar]
  27. Clarke, K.C.; Hoppen, S.; Gaydos, L. A self-modifying cellular automaton model of historical urbanization in the San Francisco Bay area. Environ. Plann. B Plann. Des. 1997, 24, 247–261. [Google Scholar]
  28. Xie, Y.C. A generalized model for cellular urban dynamics. Geogr. Anal. 1997, 28, 350–373. [Google Scholar] [CrossRef]
  29. Wu, F.; Webster, C.J. Simulating artificial cities in a GIS environment: Urban growth under alternative regulation regimes. Int. J. Geogr. Inf. Sci. 2000, 14, 625–648. [Google Scholar] [CrossRef]
  30. Ligtenberg, A.; Bregt, A.K.; Lammeren, R.V. Multi-actor-based land use modeling: Spatial planning using agents. Landsc. Urban Plann. 2001, 56, 21–33. [Google Scholar] [CrossRef]
  31. Zhou, C.H.; Sun, Z.H.; Xie, Y.C. The Research of Geographical Cellular Automata; Science Press: Beijing, China, 1999; pp. 1–163. [Google Scholar]
  32. Shi, W.; Pang, M.Y. Development of Voronoi-based cellular automata -an integrated dynamic model for Geographical. Int. J. Geogr. Inf. Sci. 2000, 14, 455–474. [Google Scholar] [CrossRef]
  33. Vaz, E.; Caetano, M.; Nijkamp, P.; Painho, M. A multi-scenario forecast of urban change: A study on urban growth in the Algarve. Landsc. Urban Plann. 2012, 104, 201–211. [Google Scholar] [CrossRef]
  34. Batty, M.; Xie, Y.C.; Sun, Z.L. Modelling urban dynamics through GIS-based cellular automata. Comput. Environ. Urban Syst. 1999, 23, 205–233. [Google Scholar] [CrossRef]
  35. Wu, F. Calibration of stochastic cellular automata: The application to rural-urban land conversions. Int. J Geogr. Inf. Sci. 2002, 16, 795–818. [Google Scholar] [CrossRef]
  36. Ménard, A.; Marceau, D.J. Exploration of spatial scale sensitivity in geographical cellular automata. Environ. Plann. B Plann. Des. 2005, 32, 693–714. [Google Scholar] [CrossRef]
  37. Liu, X.P.; Li, X.; Liu, L. A bottom-up approach to discover transition rules of cellular automata using ant intelligence. Int. J Geogr. Inf. Sci. 2008, 22, 1247–1269. [Google Scholar] [CrossRef]
  38. Silva, E.A. The DNA of our regions: Artificial intelligence in regional planning. Futures 2004, 36, 1077–1094. [Google Scholar] [CrossRef]
  39. Arthur, S.T.; Carlson, T.N.; Ripley, D.A. Land use dynamics of Chester county, Pennsylvania, from a satellite remote sensing perspective. Geocarto Int. 2000, 15, 25–35. [Google Scholar]
  40. Claggett, P.; Jantz, C.A.; Goetz, S.J.; Bisland, C. Assessing development pressure in the Chesapeake Bay watershed: An evaluation of two land-use change models. Environ. Monit. Assess. 2004, 94, 129–146. [Google Scholar] [CrossRef]
  41. Yang, X.; Lo, C.P. Modelling urban growth and landscape change in the Atlanta metropolitan area. Int. J. Geogr. Inform. Sci. 2003, 17, 463–488. [Google Scholar] [CrossRef]
  42. Dietzel, C.K.; Clarke, K.C. The effect of disaggregating land use categories in cellular automata during model calibration and forecasting. Comput. Environ. Urban. Syst. 2006, 30, 78–101. [Google Scholar]
  43. Jantz, C.A.; Goetz, S.J.; Donato, D; Claggett, P. Designing and implementing a regional urban modeling system using the SLEUTH cellular urban model. Comput. Environ. UrbanSyst. 2010, 34, 1–16. [Google Scholar]
  44. Syphard, A.D.; Clarke, K.C.; Franklin, J.; Regan, H.M.; Mcginnis, M. Forecasts of habitat loss and fragmentation due to urban growth are sensitive to source of input data. J. Environ. Manag. 2011, 92, 1882–1893. [Google Scholar] [CrossRef]
  45. Hua, L.Z.; Li, X.Q.; Tang, L.N.; Yin, K.; Zhao, Y. Spatio-temporal dynamic analysis of island-city landscape: A case study of Xiamen Island, China. Int. J. Sustain. Dev. World Ecol. 2010, 17, 273–278. [Google Scholar] [CrossRef]
  46. Hua, L.Z.; Cui, S.H.; Huang, Y.F.; Yin, K.; Xiong, Y.Z. Analyses of Peri-Urban landscape dynamics in the rapid urbanizing process: A case study of Xiamen. Acta Ecol. Sin. 2009, 29, 3509–3517. [Google Scholar]
  47. Tang, L.N.; Zhao, Y.; Yin, K.; Zhao, J. City profile: Xiamen. Cities 2013, 31, 615–624. [Google Scholar] [CrossRef]
  48. Sangawongse, S.; Sun, C.H.; Tsai, B.W. Urban growth and land cover change in Chiang Mai and Taipei: Results from the SLEUTH model. In Proceedings of the MODSIM 2005 International Congress on Modelling and Simulation, Melbourne, Australia, 12-15 December 2005; Zerger, A., Argent, R.M., Eds.; The Modelling and Simulation Society of Australia and New Zealand: Hobart, Australia.
  49. Dietzel, C.K.; Clarke, K.C. Toward optimal calibration of the SLEUTH land use change model. Trans. GIS. 2007, 11, 29–45. [Google Scholar]
  50. Ding, Y.C.; Zhang, Y.K. The simulation of urban growth applying SLETUH CA model to the Yilan DELTA in Taiwan. Jurnal Alam Bina 2007, 9, 95–107. [Google Scholar]
  51. Clarke, K.C.; Gaydos, L.J. Loose coupling a cellular automaton model and GIS: Long-term urban growth prediction for San Francisco and Washington/Baltimore. Int. J. Geogr. Inform. Sci. 1998, 12, 699–714. [Google Scholar] [CrossRef]
  52. Hakan, O.; Klein, A.G.; Srinivas, R. Calibration of the SLEUTH model based on the historic growth of Houston. J. AppliedSci. 2007, 7, 1843–1853. [Google Scholar]
  53. Jantz, C.A.; Goetz, S.J.; Shelley, M.K. Using the SLEUTH urban growth model to simulate the impacts of future policy scenarios on urban land use in the Baltimore-Washington Metropolitan Area. Environ. Plann. BPlann. Des. 2003, 31, 251–271. [Google Scholar] [CrossRef]
  54. Clarke, K.C.; Gazulis, N.; Dietzel, C.K.; Goldstein, N.C. A decade of SLEUTHing: Lessons learned from applications of a cellular automaton land use change model. In Classics from IJGIS: Twenty Years of the International Journal of Geographical Information Systems and Science; Fisher, P., Ed.; Taylor and Francis: Boca Raton, USA, 2007; pp. 413–425. [Google Scholar]

