Spatio-Temporal Patterns and Policy Implications of Urban Land Expansion in Metropolitan Areas: A Case Study of Wuhan Urban Agglomeration, Central China

Abstract
:1. Introduction
2. Materials and Methods
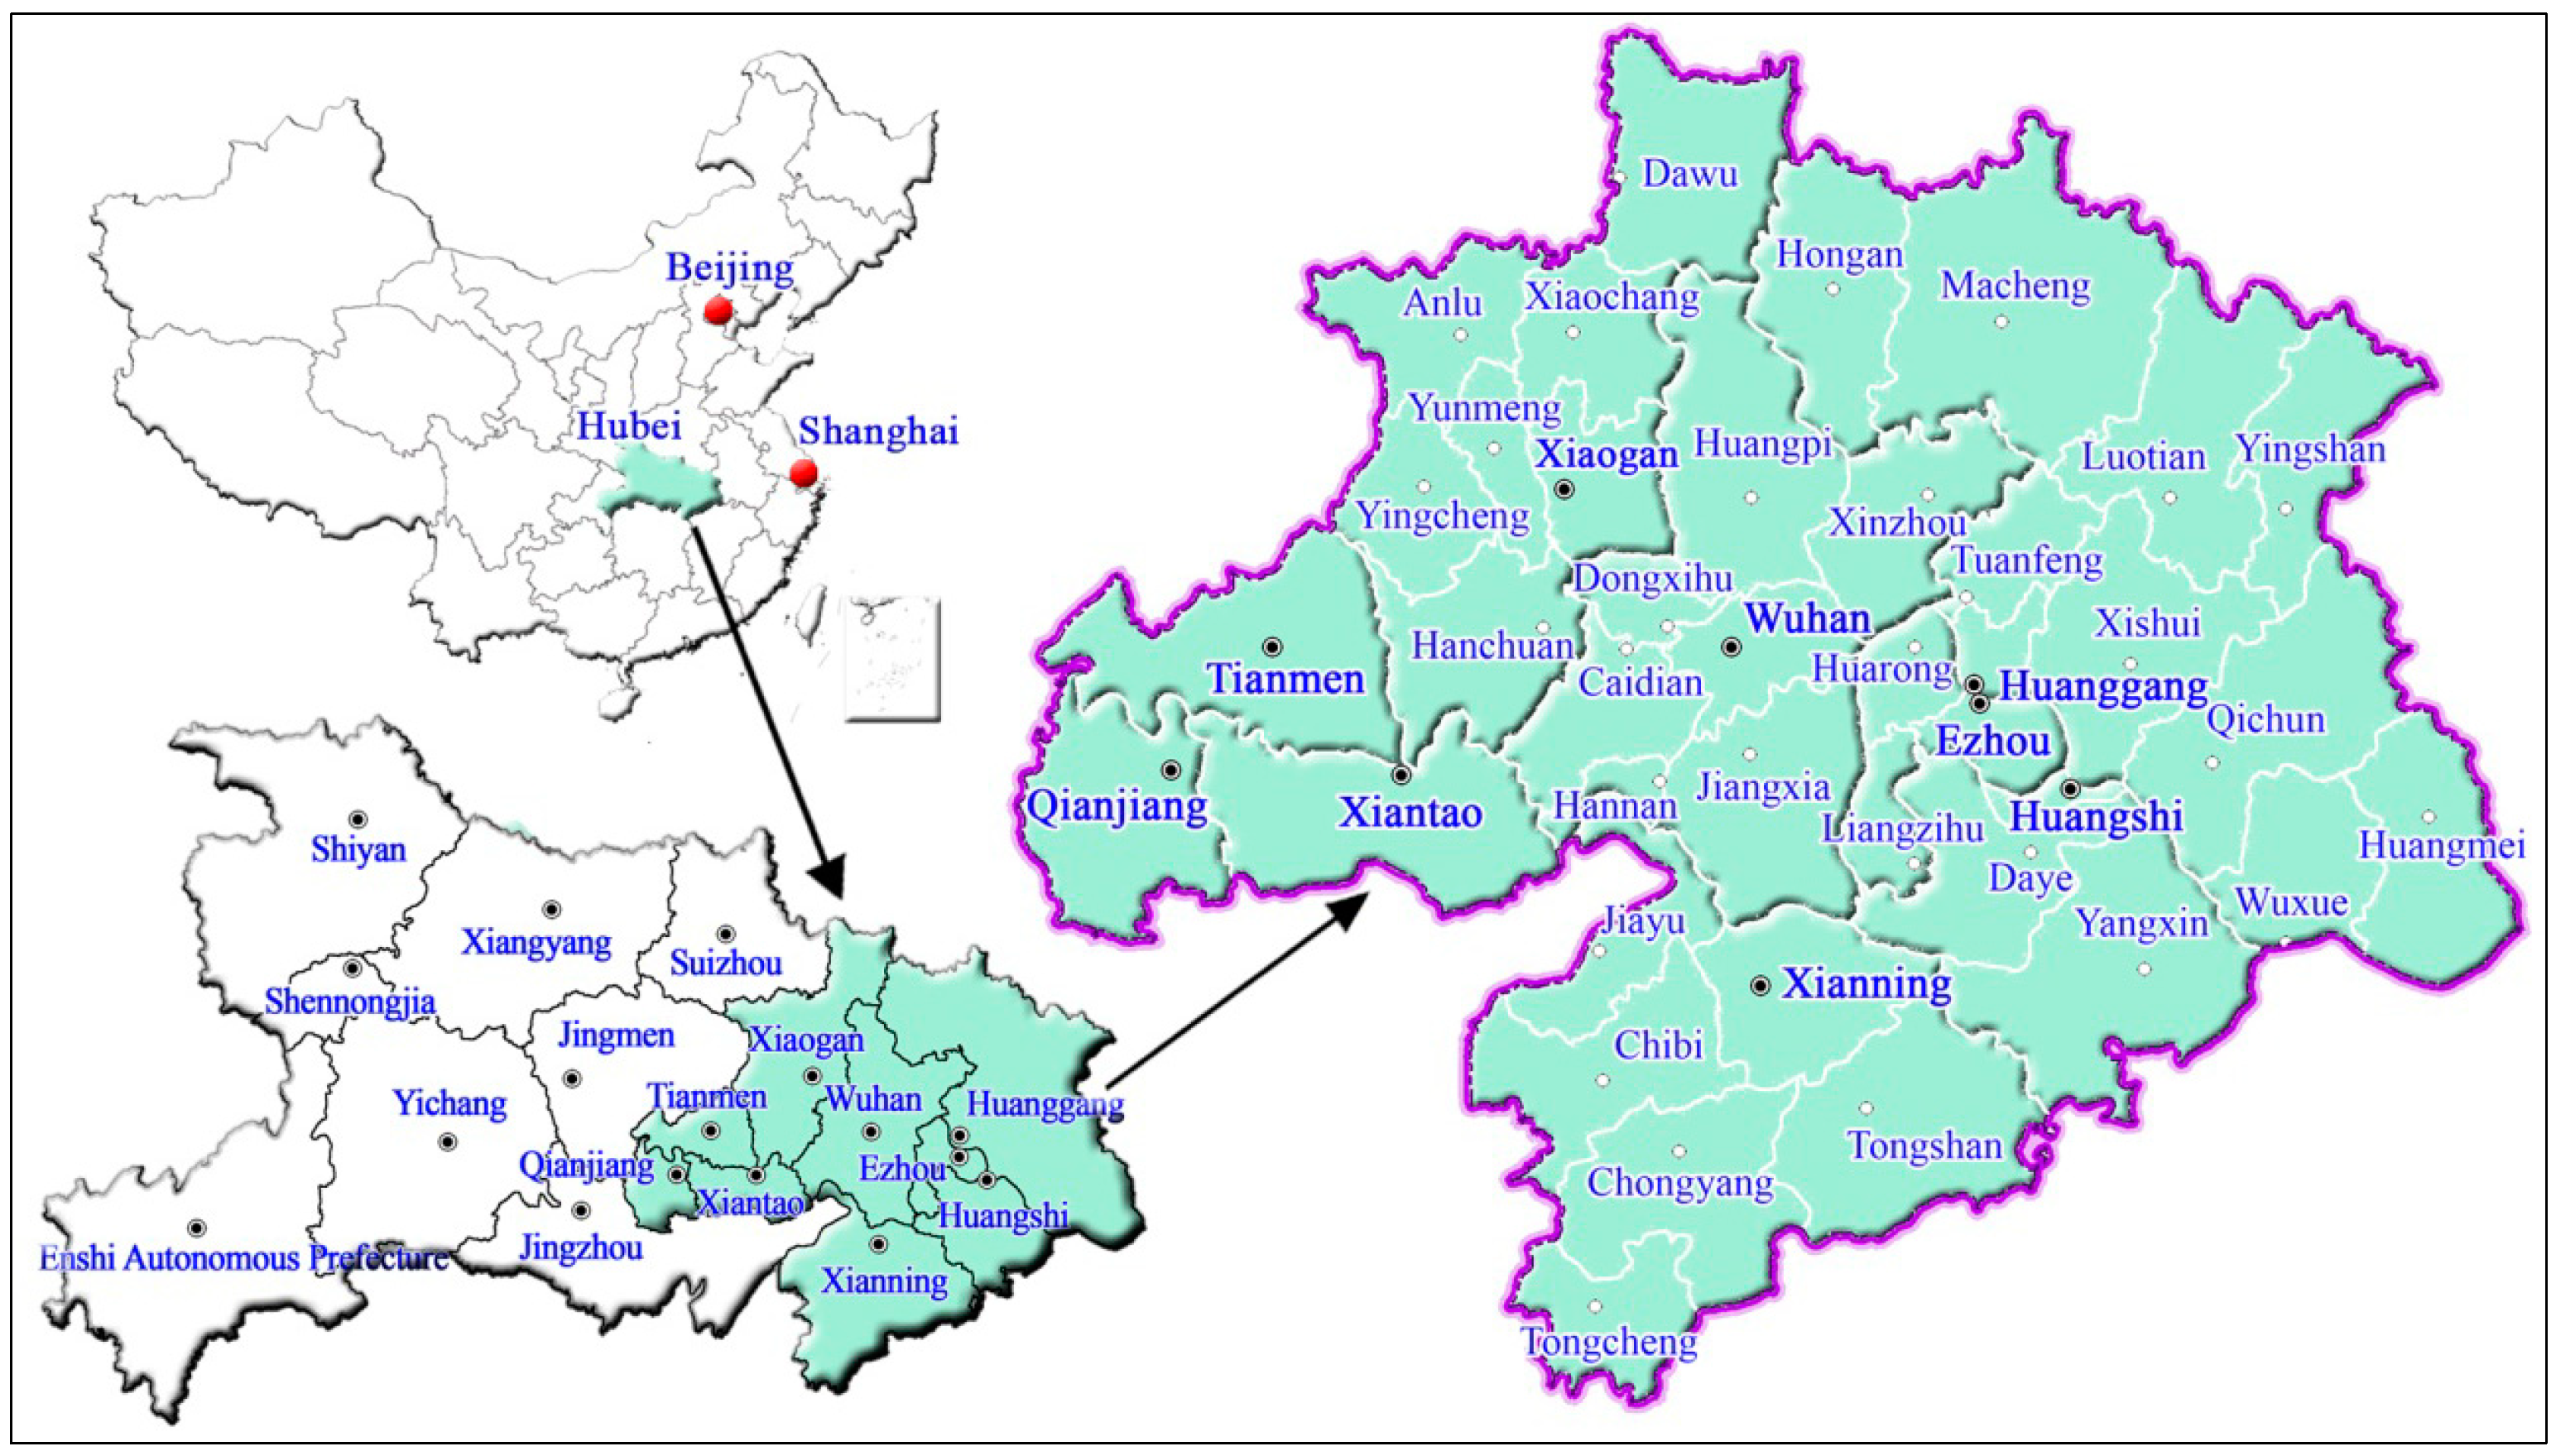
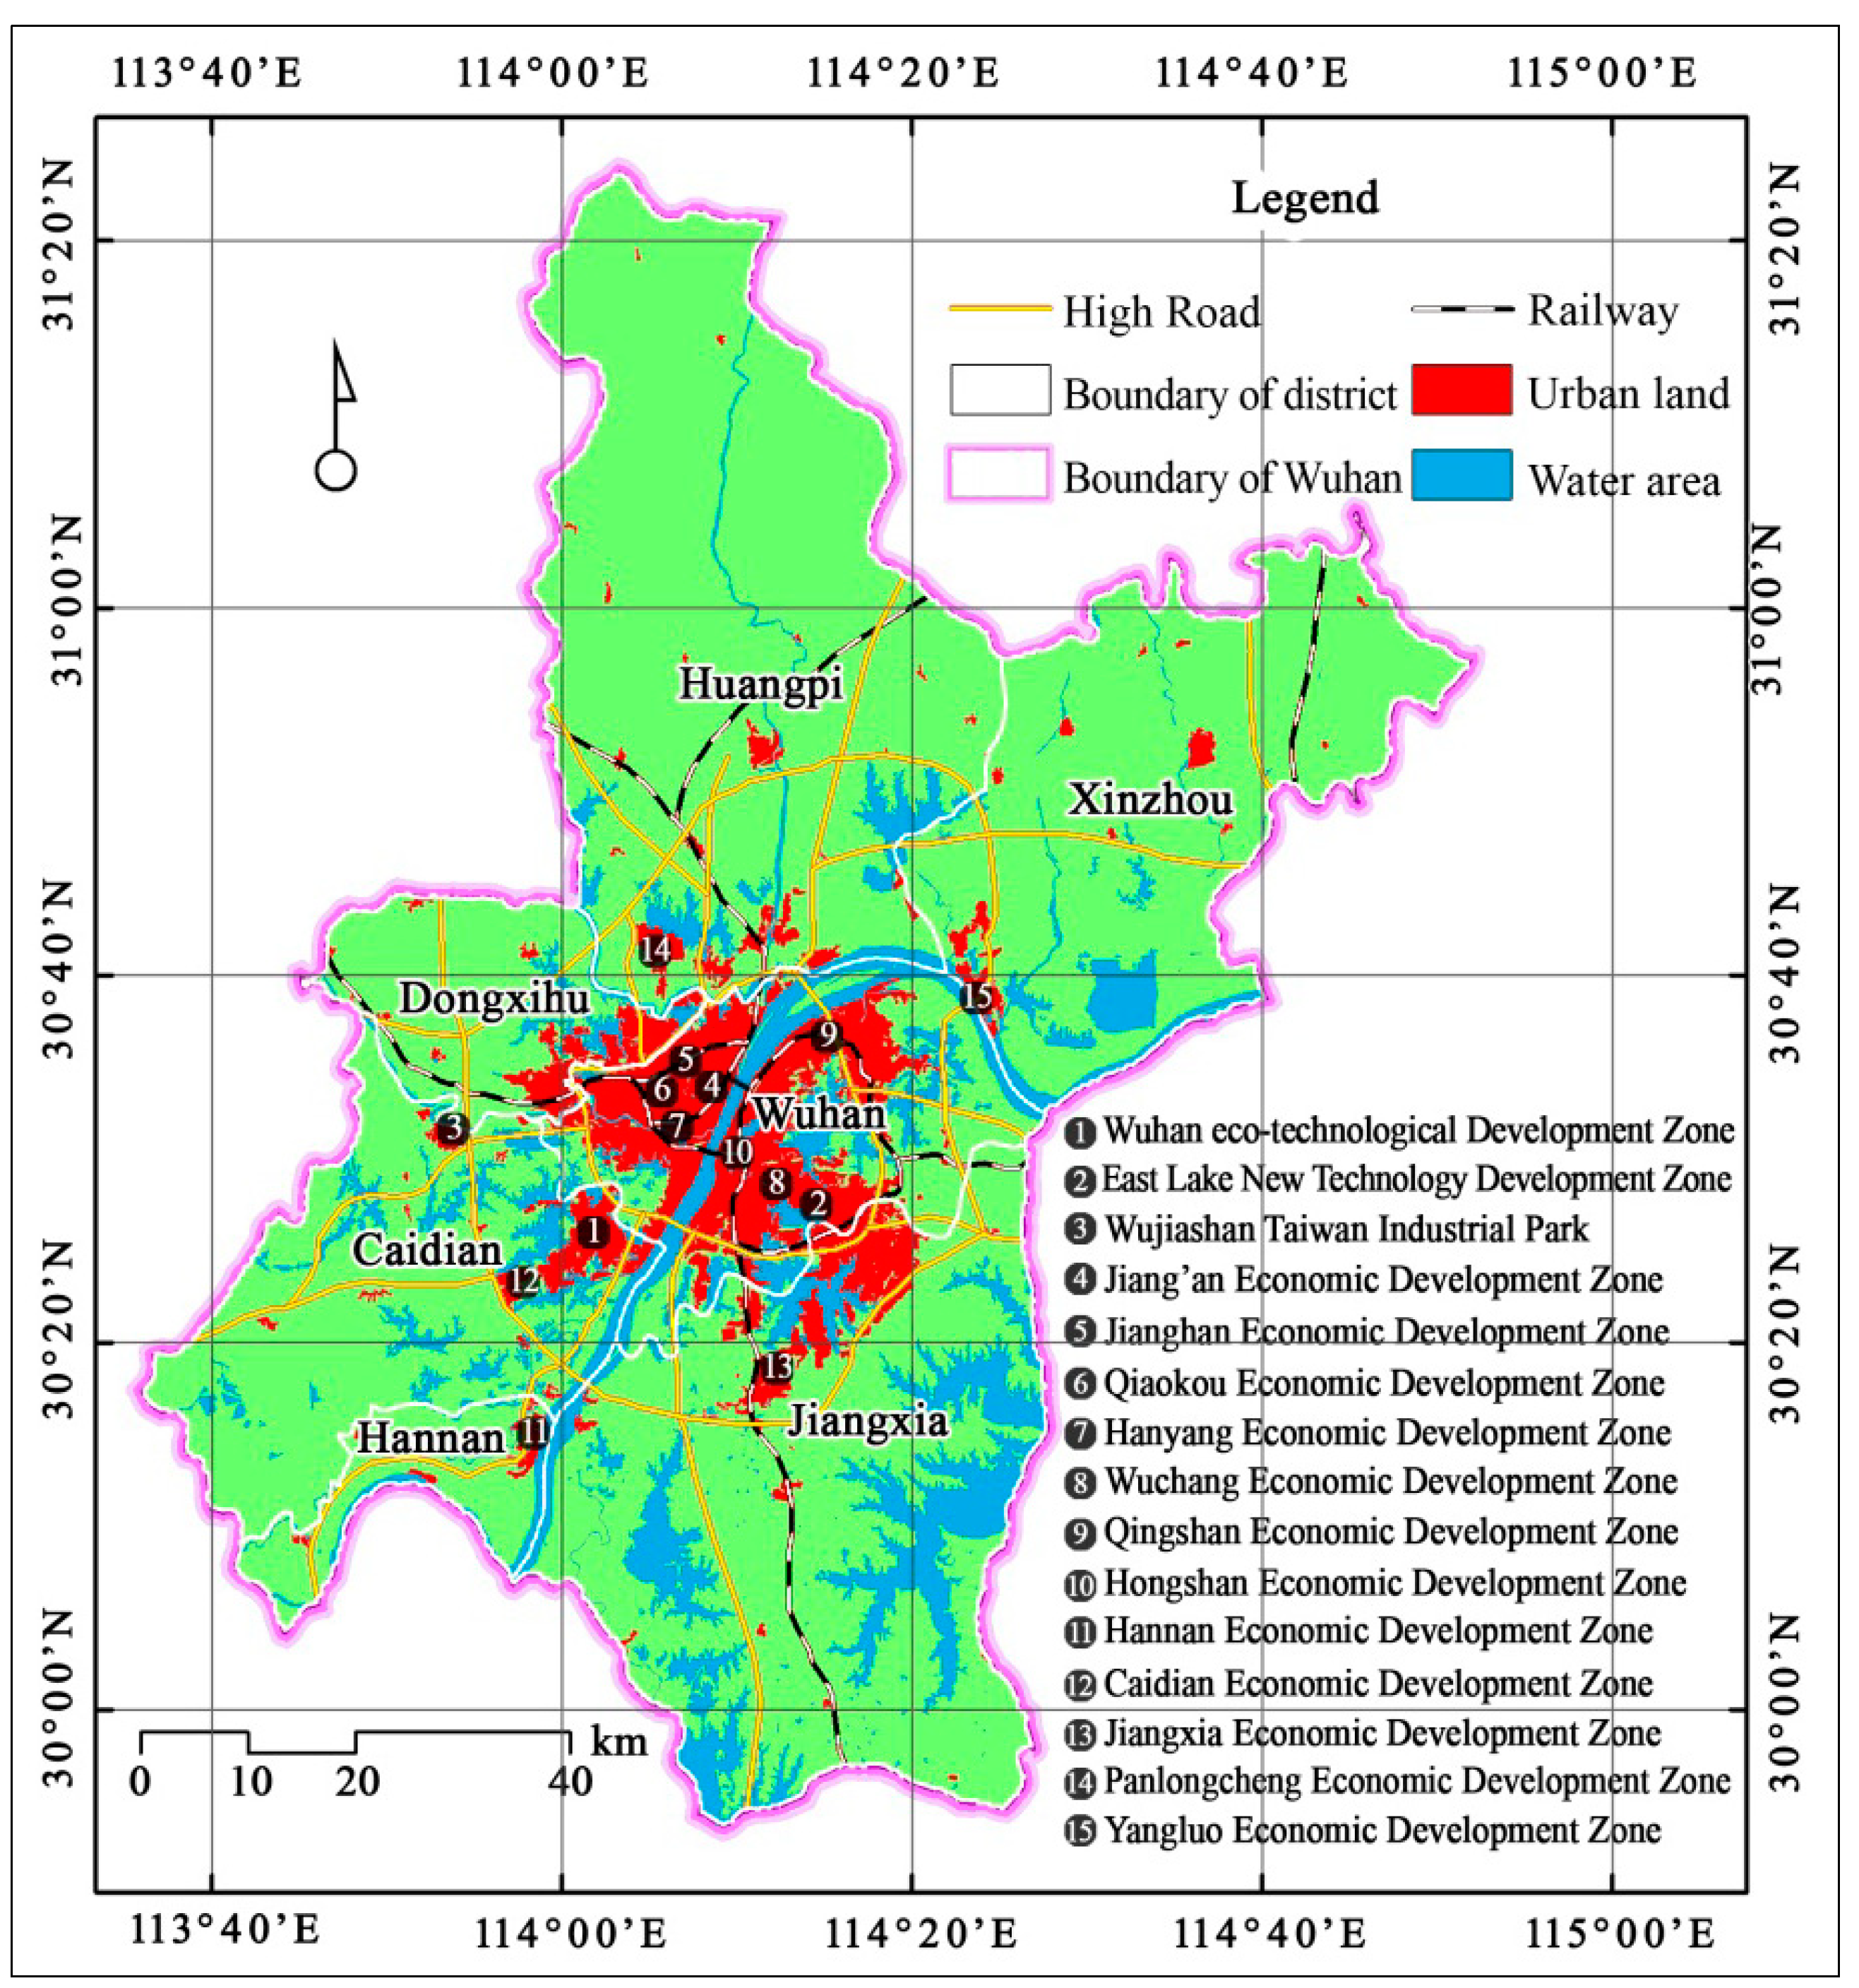
2.1. Study Area

2.2. Data Sources and Processing
2.2.1. Definition of Urban Area
2.2.2. Satellite Image Processing
2.2.3. Accuracy Analysis


| Region | Urban Land Area (km2) | Urban Land Change (km2) | |||||
|---|---|---|---|---|---|---|---|
| 1980 | 1990 | 2000 | 2010 | 1980–1990 | 1990–2000 | 2000–2010 | |
| Wuhan | 88.28 | 272.58 | 336.89 | 715.40 | 184.3 | 64.31 | 378.51 |
| Huangshi | 33.43 | 56.54 | 66.22 | 96.98 | 23.11 | 9.68 | 30.76 |
| Ezhou | 7.43 | 17.47 | 27.75 | 44.97 | 10.04 | 10.28 | 17.22 |
| Xiaogan | 21.36 | 76.84 | 104.92 | 125.70 | 55.48 | 28.08 | 20.78 |
| Huanggang | 17.44 | 78.72 | 108.08 | 147.54 | 61.28 | 29.36 | 39.46 |
| Xianning | 15.89 | 48.35 | 59.26 | 104.28 | 32.46 | 10.91 | 45.02 |
| Xiantao | 9.69 | 30.95 | 35.66 | 60.83 | 21.26 | 4.71 | 25.17 |
| Qianjiang | 6.95 | 22.57 | 27.64 | 38.24 | 15.62 | 5.07 | 10.6 |
| Tianmen | 3.21 | 23.47 | 28.49 | 35.91 | 20.26 | 5.02 | 7.42 |
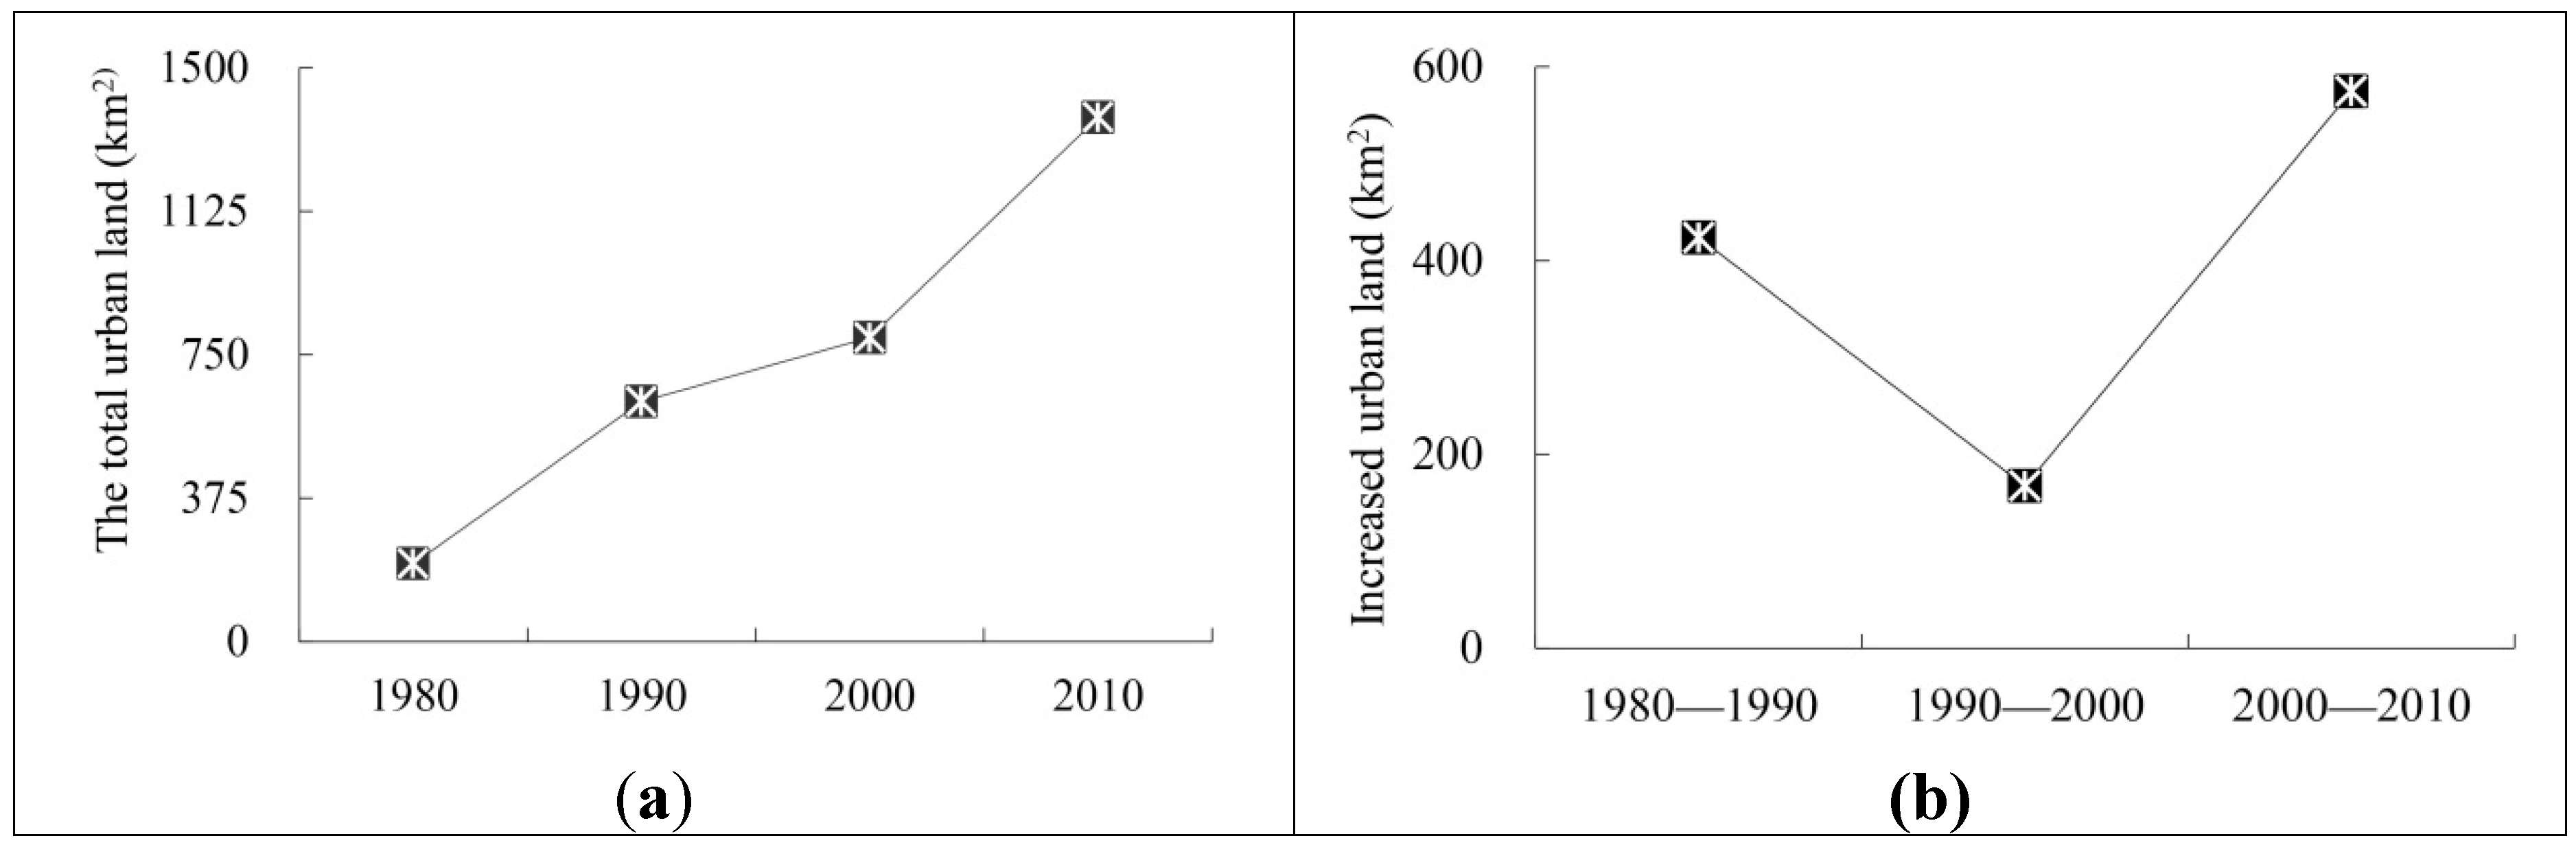
| WUA | 203.66 | 627.48 | 794.90 | 1369.83 | 423.82 | 167.42 | 574.93 |
2.2.4. Socio-Economic Data Acquisition
2.3. Methods
2.3.1. Urban Expansion Intensity Index (UEII)
 and
and  are the area of urban land at time t2 and t1, respectively, TLAi is the total area within the administrative county boundary i, and Δt is the study period (i.e., t2 − t1).
2.3.2. Urban Expansion Differentiation Index (UEDI)
and indicate the area of urban land of unit i at time t2 and t1, respectively; and ULAt2 and ULAt1 indicate the total area of urban land in the study area at time t2 and t1, respectively.2.3.3. Fractal Dimension
3. Results Analysis
3.1. The Temporal Evolution Characteristics of Urban Land Expansion

| Region | Urban Expansion Intensity Index(UEII) | Urban Expansion Differentiation Index(UEDI) | ||||||
|---|---|---|---|---|---|---|---|---|
| 1980–1990 | 1990–2000 | 2000–2010 | 1980–2010 | 1980–1990 | 1990–2000 | 2000–2010 | 1980–2010 | |
| Wuhan | 0.2167 | 0.0756 | 0.4450 | 0.7372 | 1.0032 | 0.8842 | 1.5534 | 1.2406 |
| Huangshi | 0.0508 | 0.0213 | 0.0676 | 0.1397 | 0.3323 | 0.6414 | 0.6423 | 0.3320 |
| Ezhou | 0.0616 | 0.0630 | 0.1056 | 0.2302 | 0.6495 | 2.2055 | 0.8582 | 0.8827 |
| Xiaogan | 0.0625 | 0.0316 | 0.0234 | 0.1175 | 1.2484 | 1.3695 | 0.2738 | 0.8532 |
| Huanggang | 0.0352 | 0.0169 | 0.0226 | 0.0747 | 1.6883 | 1.3983 | 0.5047 | 1.3027 |
| Xianning | 0.0333 | 0.0112 | 0.0462 | 0.0908 | 0.9814 | 0.8462 | 1.0502 | 0.9713 |
| Xiantao | 0.0842 | 0.0186 | 0.0996 | 0.2024 | 1.0545 | 0.5695 | 0.9761 | 0.9217 |
| Qianjiang | 0.0772 | 0.0250 | 0.0524 | 0.1546 | 1.0809 | 0.8421 | 0.5304 | 0.7869 |
| Tianmen | 0.0768 | 0.0190 | 0.0281 | 0.1239 | 3.0371 | 0.8018 | 0.3598 | 1.7812 |
| WUA region | 0.0732 | 0.0289 | 0.0993 | 0.2014 | 1.0000 | 1.0000 | 1.0000 | 1.0000 |
| Coefficient of standard deviation | 0.7538 | 0.7767 | 1.3430 | 0.7538 | 1.0032 | 0.8842 | 1.5534 | 1.2406 |
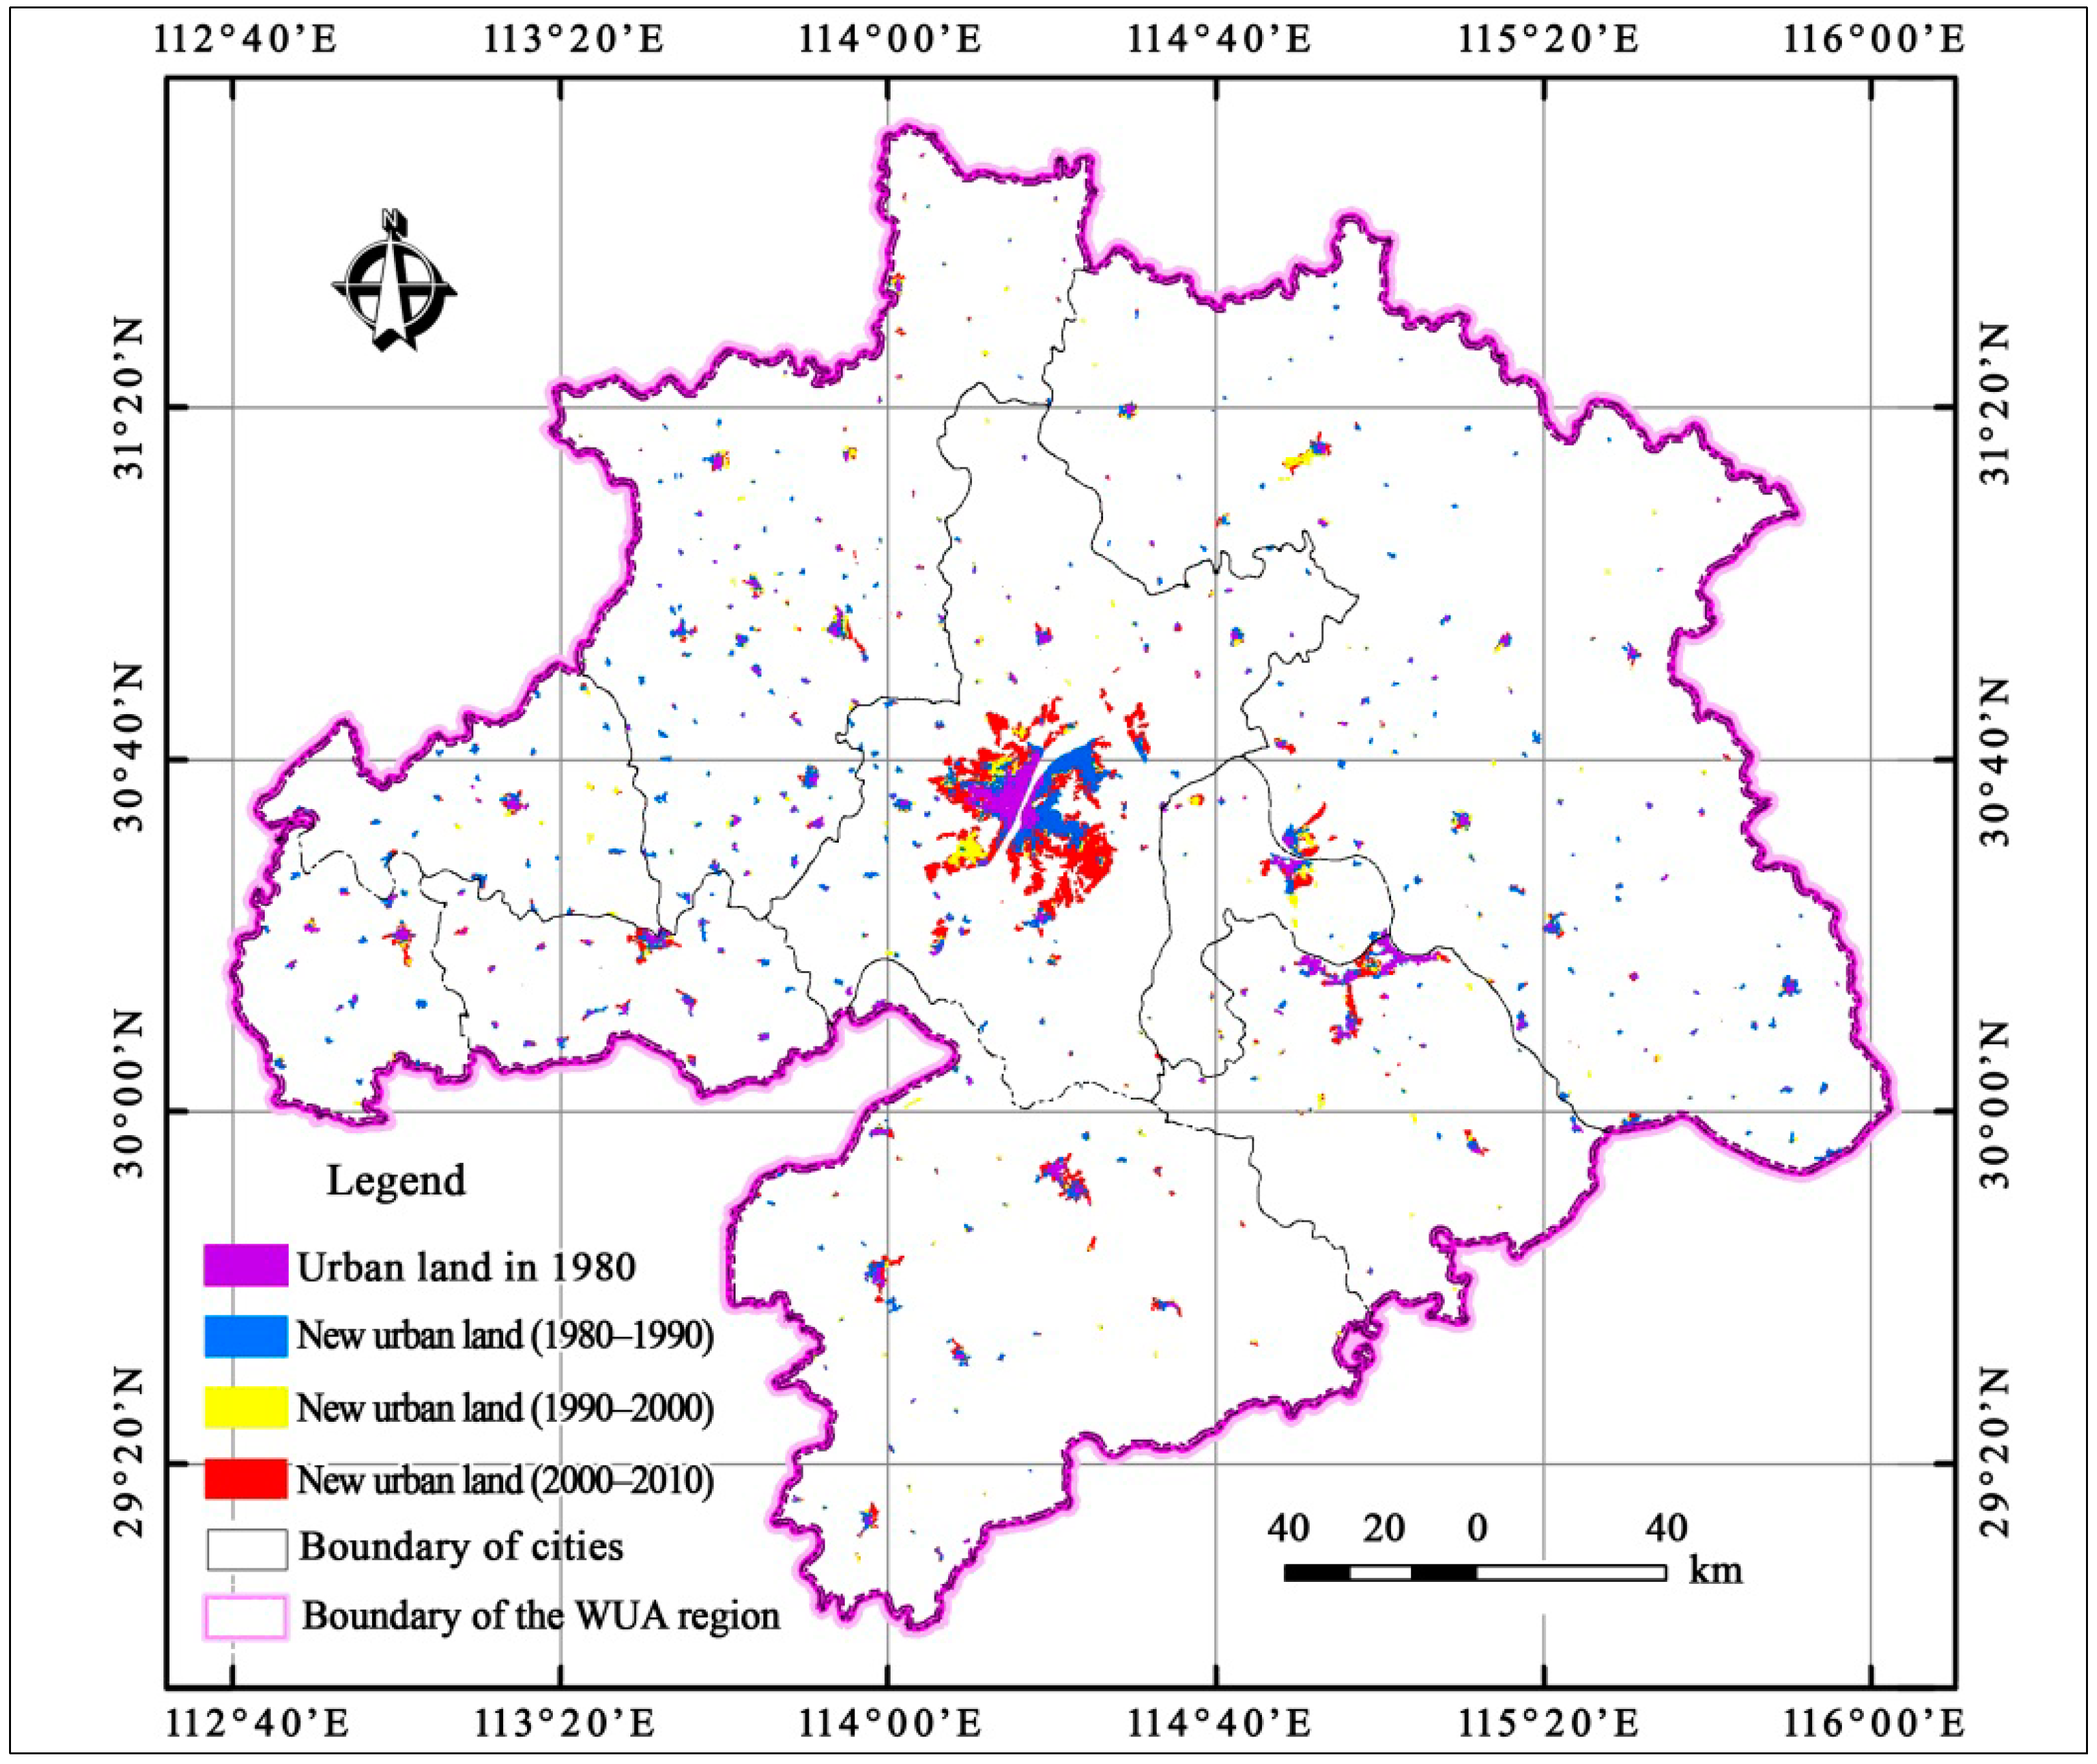
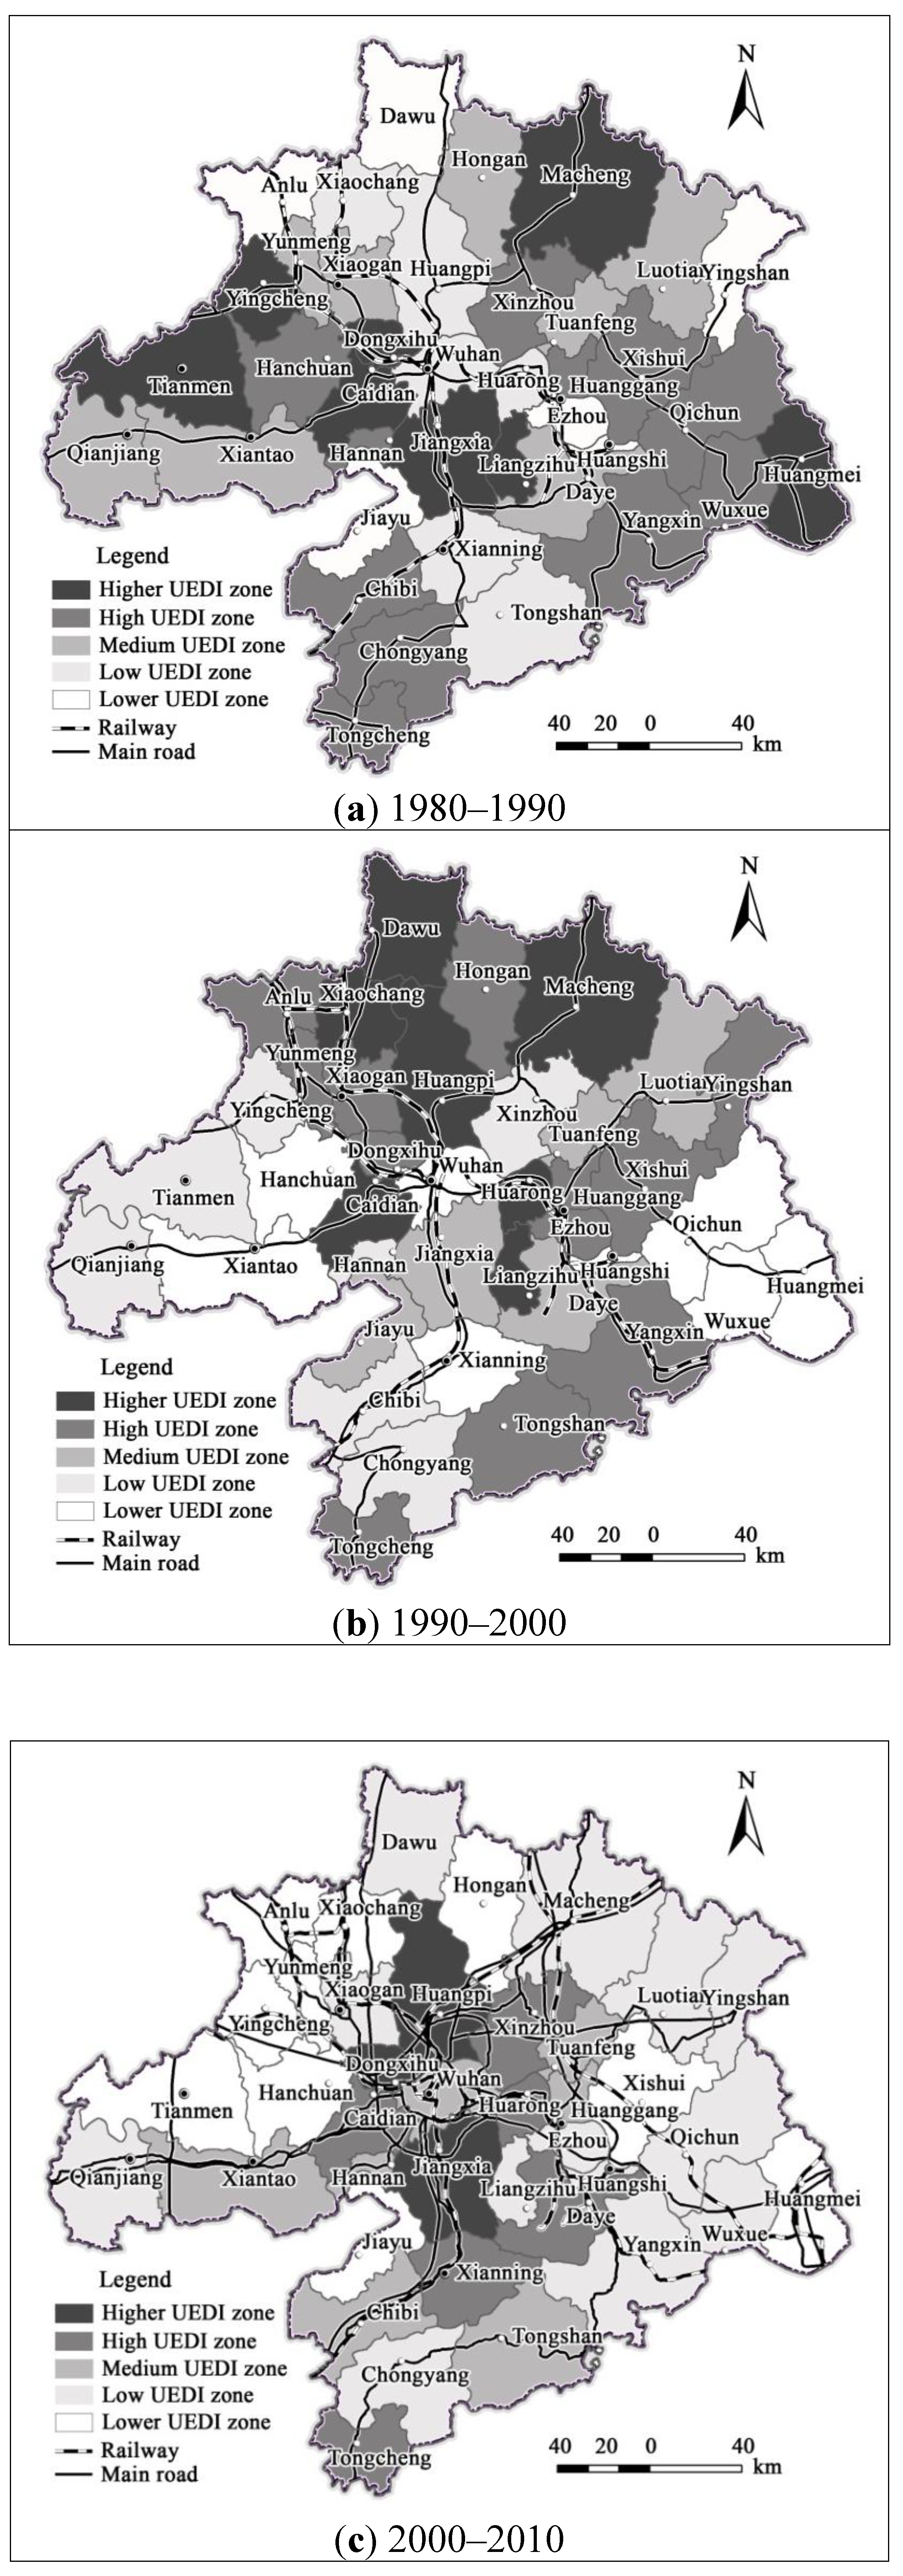
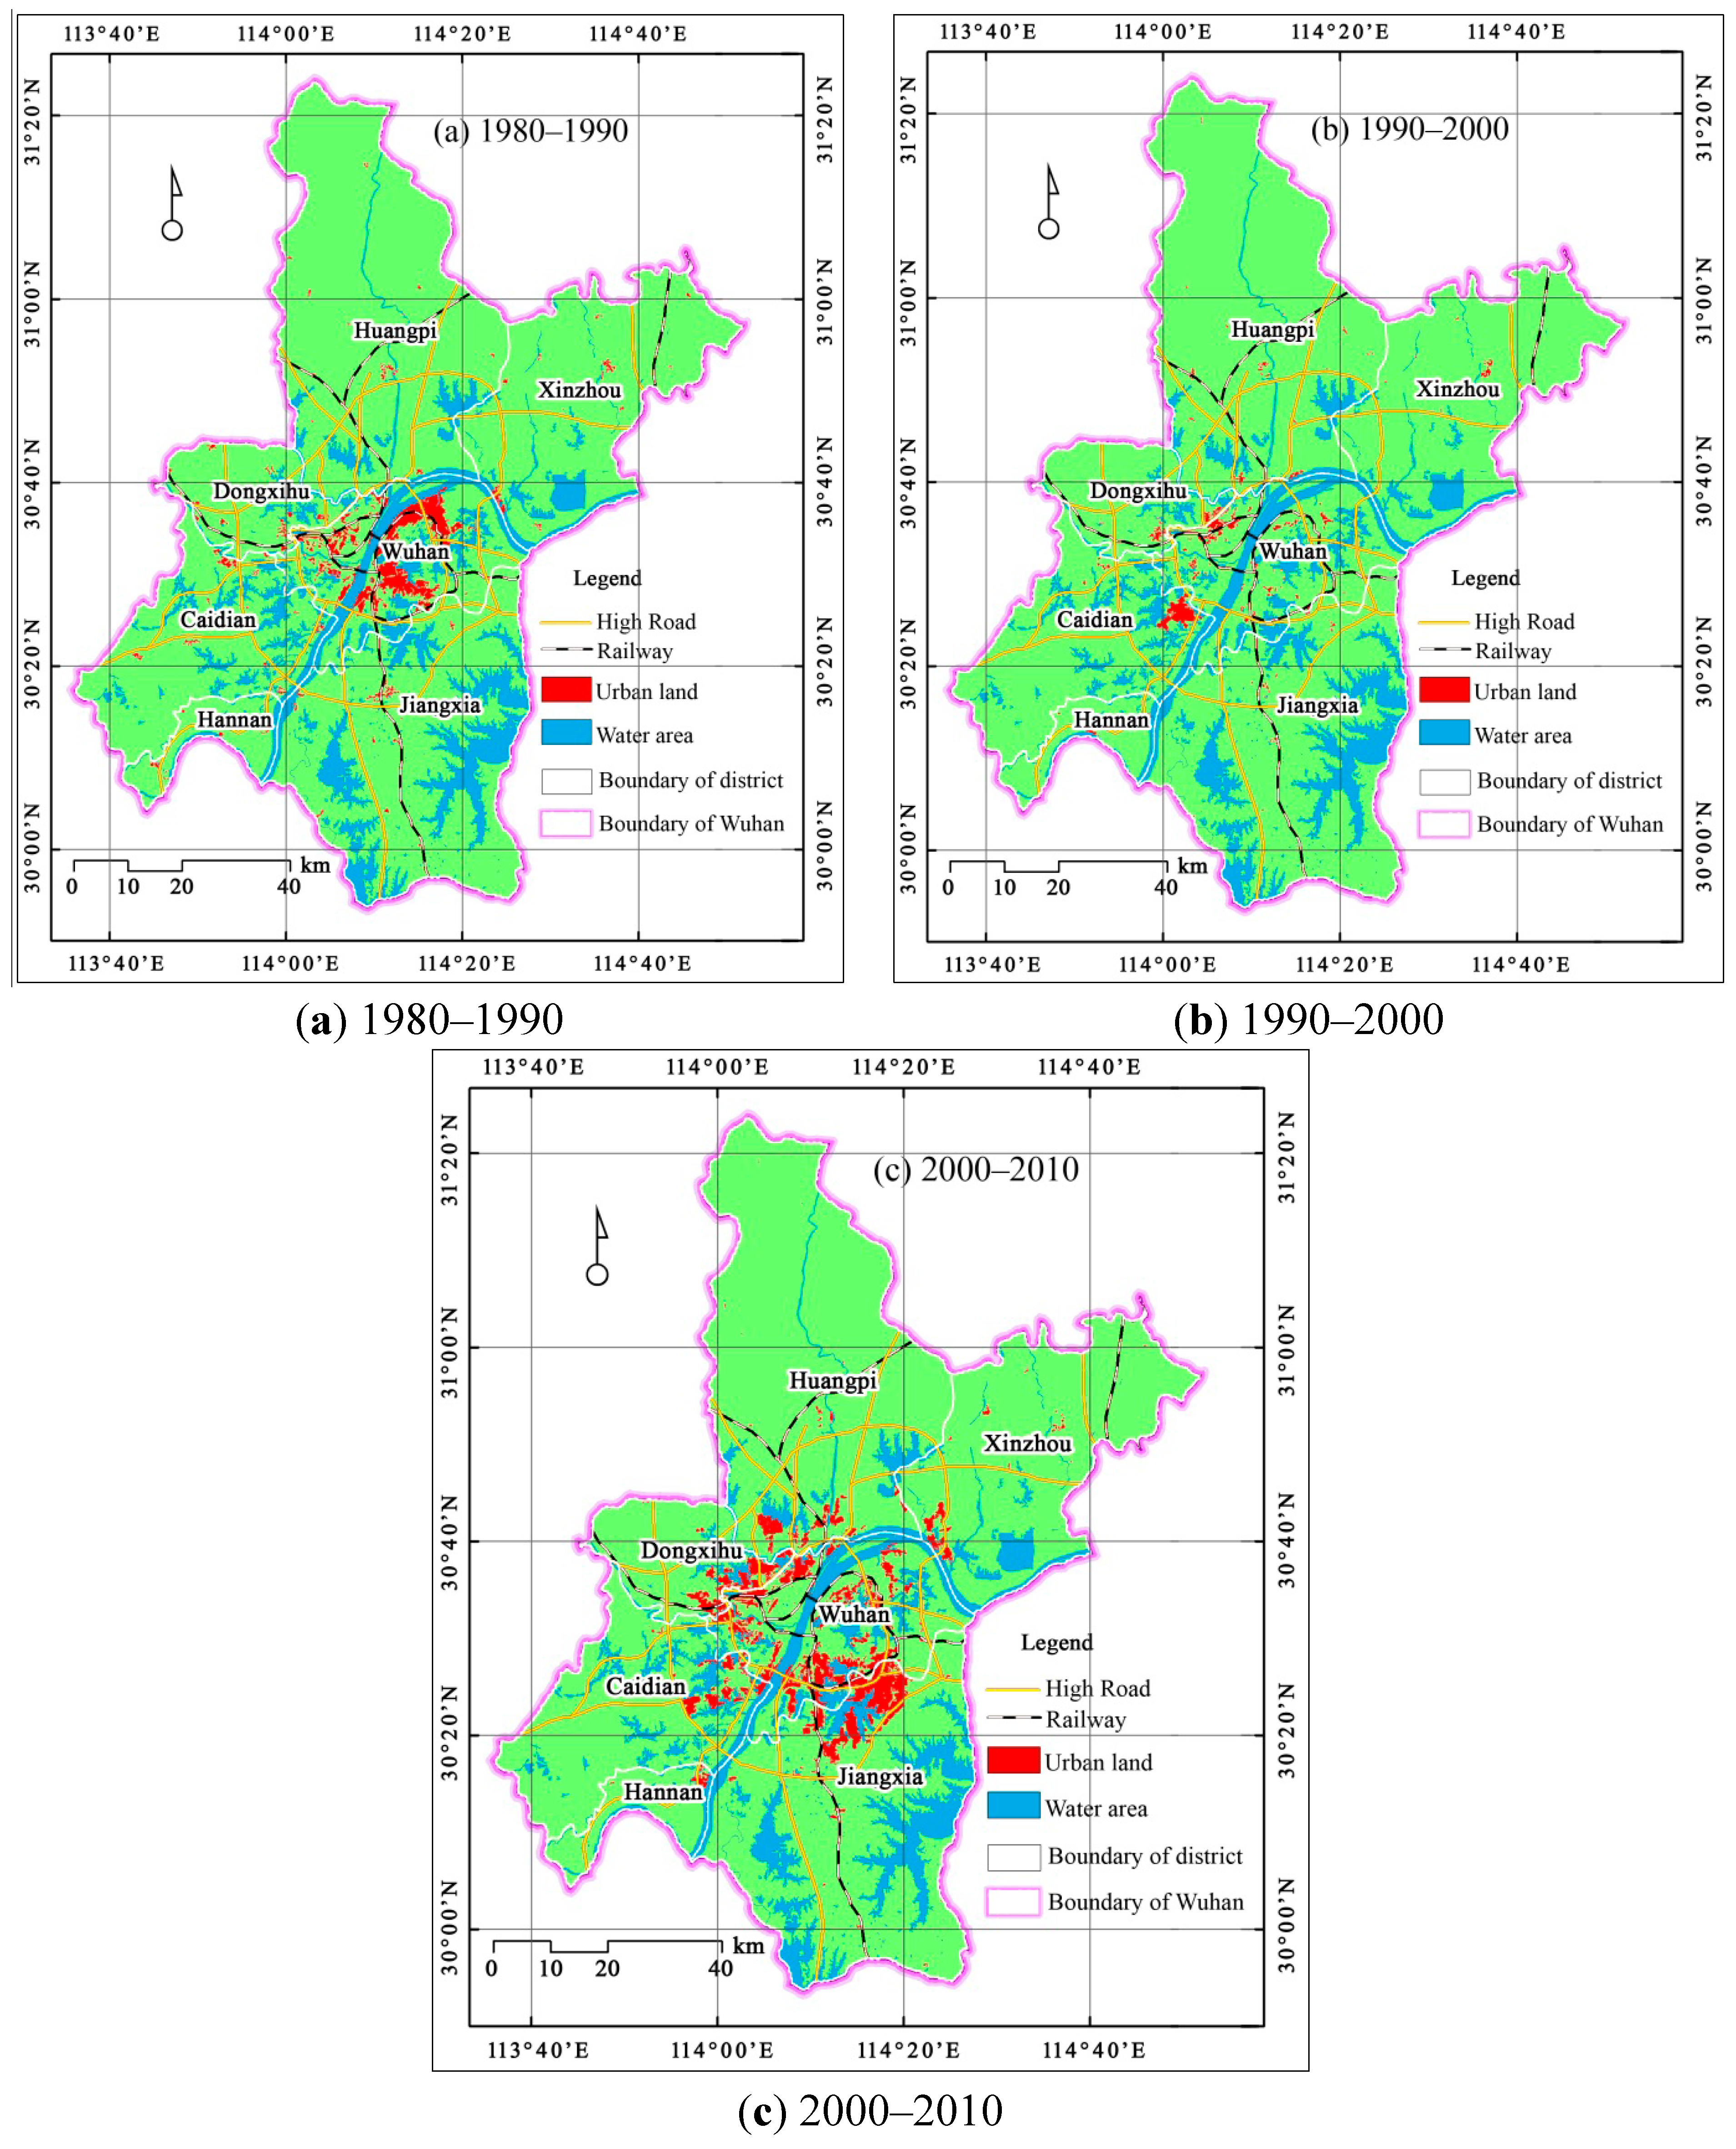
3.2. The Spatial Evolution Characteristics of Urban Land Expansion

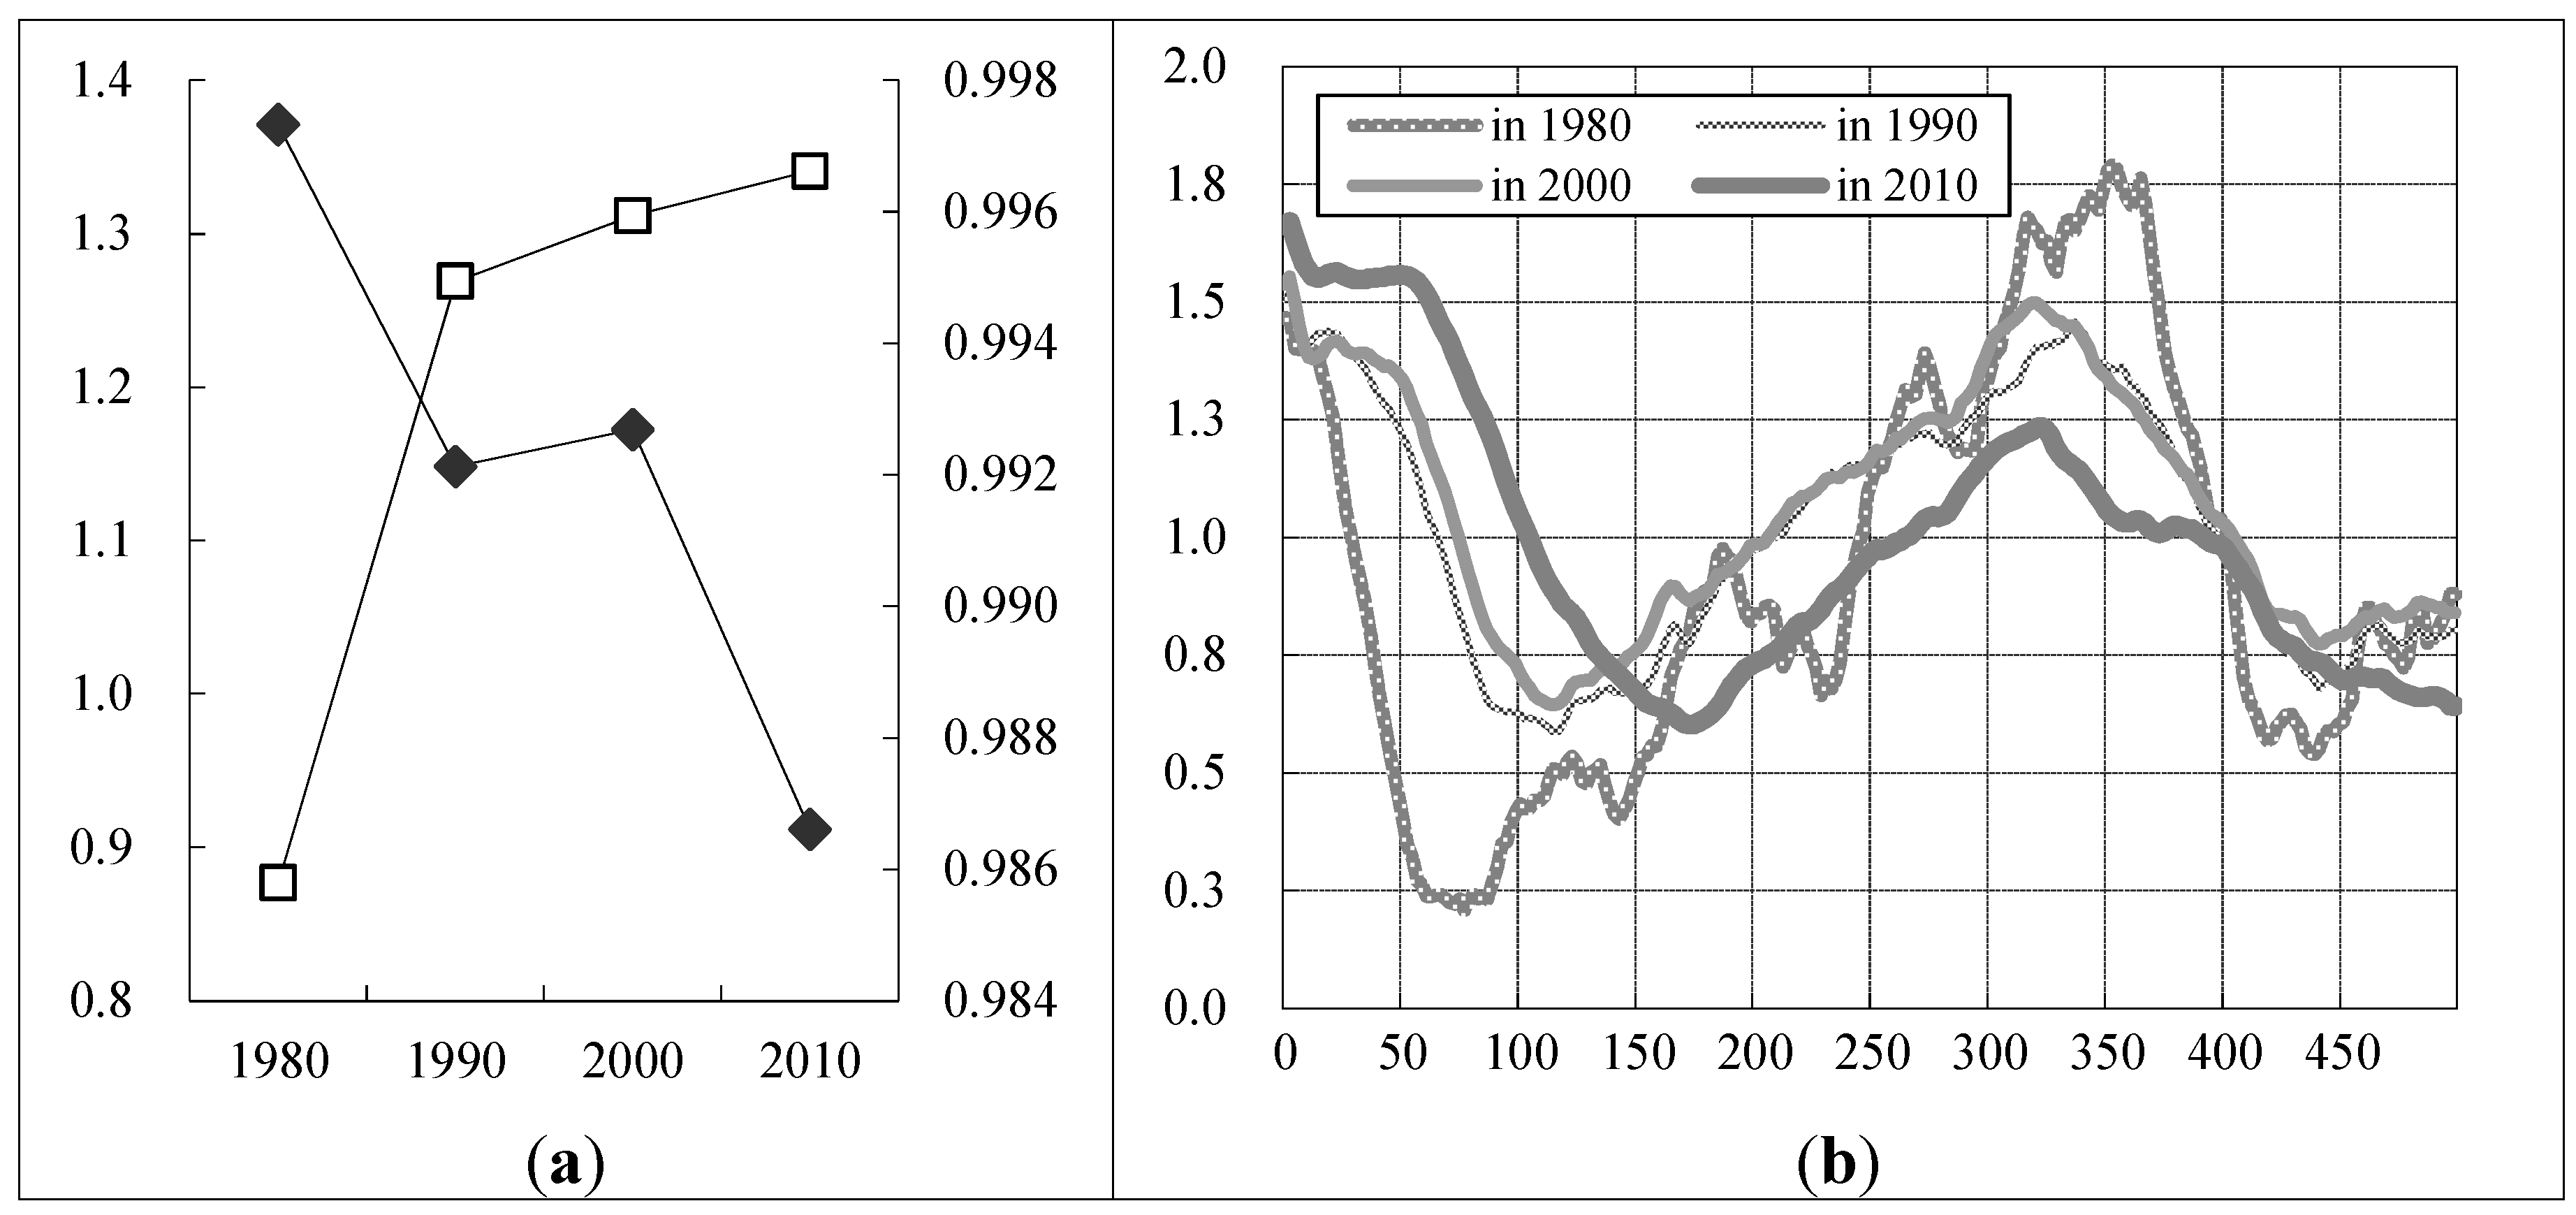
3.3. The Spatio-Temporal Evolution of Urban Morphology

4. Factors Influencing Urban Land Expansion
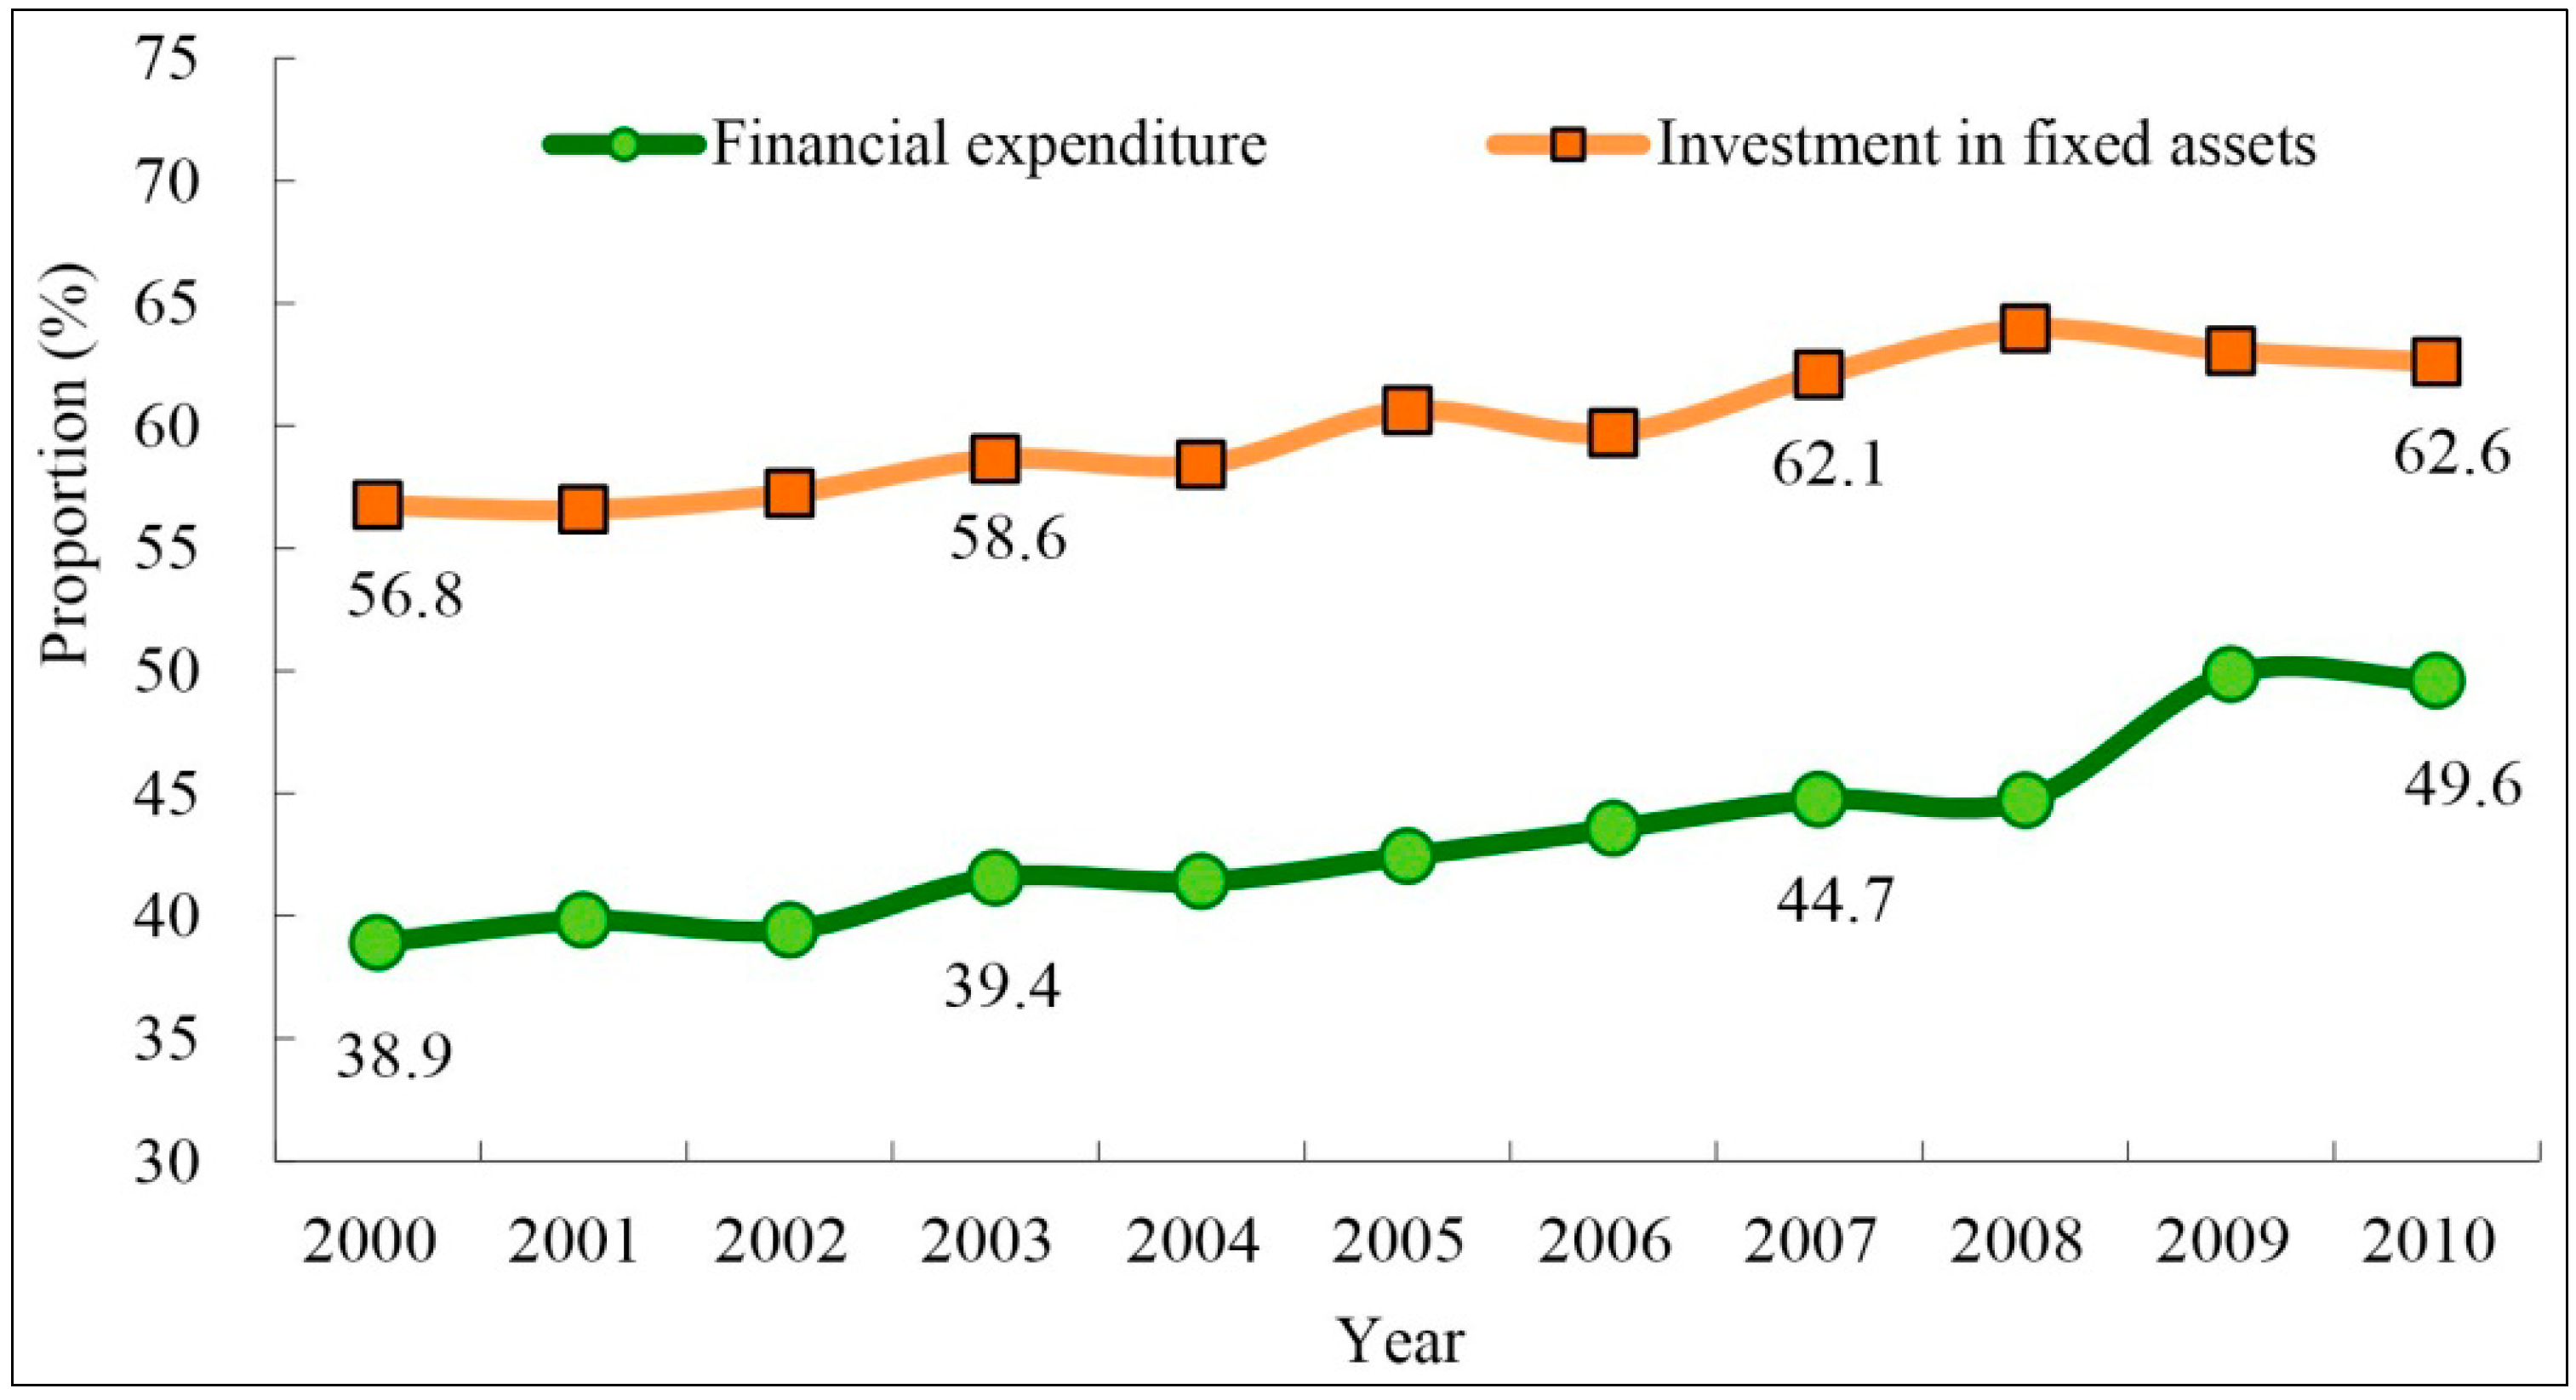
4.1. Industrialisation
| Indicators | 1980 | 1990 | 2000 | 2010 |
|---|---|---|---|---|
| Gross domestic product (GDP)/108 RMB | 114.08 | 386.64 | 2499.13 | 9635.76 |
| GDP per capita/RMB | 478 | 1429 | 8142 | 31861 |
| Total population/104 persons | 2384.81 | 2704.91 | 3069.60 | 3024.29 |
| Urbanisation rate/% | 20.91 | 26.15 | 46.09 | 53.10 |
| Total industrial output value/108 RMB | - | 619.78 | 1844.05 | 13146.42 |
| Total fixed asset investment/108 RMB | - | 75.31 | 806.81 | 6762.67 |


4.2. Urban Population Growth
4.3. Land-Use Policies
4.4. Urbanisation Guidelines
4.5. National Development Strategy
5. Discussion


6. Conclusions
Acknowledgments
Author Contributions
Conflicts of Interest
References
- Ma, L.J.C. Urban transformation in China, 1949–2000: A review and research agenda. Environ. Plan. 2002, 34, 1545–1569. [Google Scholar] [CrossRef]
- Long, H.L.; Zou, J.; Pykett, J.; Li, Y.R. Analysis of rural transformation development in China since the turn of the new millennium. Appl. Geogr. 2011, 31, 1094–1105. [Google Scholar] [CrossRef]
- Fang, C.L.; Guan, X.L.; Lu, S.S.; Zhou, M.; Deng, Y. Input-output efficiency of urban agglomerations in China: An application of data envelopment analysis (DEA). Urban Stud. 2013, 50, 2766–2790. [Google Scholar] [CrossRef]
- Xu, Z.L.; Zhu, N. City size distribution in China: Are large cities dominant? Urban Stud. 2009, 46, 2159–2185. [Google Scholar] [CrossRef]
- Chen, S.; Zeng, S.; Xie, C. Remote Sensing and GIS for urban growth analysis in China. Photogramm. Eng. Remote Sens. 2000, 66, 593–598. [Google Scholar]
- Deng, X.Z.; Huang, J.K.; Rozelle, S.; Uchida, E. Economic growth and the expansion of urban land in China. Urban Stud. 2010, 47, 813–843. [Google Scholar] [CrossRef]
- National Bureau of Statistics of China (NBSC). China Statistical Yearbook; State Statistical Press: Beijing, China, 1982–2011.
- Shao, M.; Tang, X.Y.; Zhang, Y.H.; Li, W.J. City clusters in China: Air and surface water pollution. Front. Ecol. Environ. 2006, 4, 353–361. [Google Scholar] [CrossRef]
- Jiang, F.; Liu, S.H.; Yuan, H.; Zhang, Q. Measuring urban sprawl in Beijing with geo-spatial indices. J. Geogr. Sci. 2007, 10, 469–478. [Google Scholar] [CrossRef]
- Gong, J.Z.; Liu, Y.S.; Xia, B.C. Spatial heterogeneity of urban land-cover landscape in Guangzhou from 1990 to 2005. J. Geogr. Sci. 2009, 19, 213–224. [Google Scholar] [CrossRef]
- Xie, Y.C.; Yu, M.; Tian, G.J.; Xing, X.R. Socio-economic driving forces of arable land conversion: A case study of Wuxian City, China. Global Environ. Chang. 2005, 15, 238–252. [Google Scholar] [CrossRef]
- Long, H.L.; Tang, G.; Li, X.B.; Heilig, G.K. Socio-economic driving forces of land-use change in Kunshan, the Yangtze River Delta economic area of China. J. Environ. Manag. 2007, 83, 351–364. [Google Scholar] [CrossRef]
- Kaufmann, R.K.; Seto, K.C. Change detection, accuracy, and bias in a sequential analysis of Landsat imagery in the Pearl River Delta, China: Econometric techniques. Agric. Ecosyst. Environ. 2001, 85, 95–105. [Google Scholar] [CrossRef]
- Tan, M.H.; Li, X.B.; Xie, H.; Lu, C.H. Urban land expansion and arable land loss in China—A case study of Beijing-Tianjin-Hebei region. Land Use Policy 2005, 22, 187–196. [Google Scholar] [CrossRef]
- Ma, R.H.; Gu, C.L.; Pu, Y.X.; Ma, X.D. Mining the urban sprawl pattern: A case study on Sunan, China. Sensors 2008, 8, 6371–6395. [Google Scholar]
- Hubei Statistical Bureau (HSB). Hubei Statistical Yearbook; China Statistics Press: Beijing, China, 1981–2011. [Google Scholar]
- Manandhar, R.; Odeh, I.O.; Ancev, T. Improving the accuracy of land use and land cover classification of landsat data using post-classification enhancement. Remote Sens. 2009, 1, 330–344. [Google Scholar] [CrossRef]
- Martínez, S.; Mollicone, D. From land cover to land use: A methodology to assess land use from remote sensing data. Remote Sensing 2012, 4, 1024–1045. [Google Scholar] [CrossRef]
- Liu, J.Y.; Liu, M.L.; Deng, X.Z.; Zhuang, D.F.; Zhang, Z.X.; Luo, D. The land use and land cover change database and its relative studies in China. J. Geogr. Sci. 2002, 12, 275–282. [Google Scholar] [CrossRef]
- Tian, G.; Liu, J.; Xie, Y.; Yang, Z.; Zhuang, D.; Niu, Z. Analysis of spatio-temporal dynamic pattern and driving forces of urban land in China in 1990s using TM images and GIS. Cities 2005, 22, 400–410. [Google Scholar] [CrossRef]
- Wang, J.; Liu, Y.; Liu, Z. Spatio-temporal patterns of cropland conversion in response to the “Grain for Green Project” in China’s Loess Hilly region of Yanchuan county. Remote Sens. 2013, 5, 5642–5661. [Google Scholar] [CrossRef]
- Liu, S.H.; Sylvia, P. Spatial Patterns and Dynamic Mechanisms of Urban Land Use Growth in China: Case Studies in Beijing and Shanghai; Interim Report IR-02-005; International Institute for Applied Systems Analysis: Laxenburg, Austria, 2002. [Google Scholar]
- Tannier, C.; Pumain, D. Fractals in urban geography: A general outline and an empirical example. CyberGeo: Eur. J. Geogr. 2005, 307, 22–40. [Google Scholar]
- Zhu, H.; Li, X. Discussion on the Index Method of Regional Land Use Change. Acta Geogr. Sin. 2003, 5, 643–650. [Google Scholar]
- Guan, X.L.; Fang, C.L.; Zhou, M.; Wu, H. Spatio-temporal characteristics of spatial expansion of urban land in Wuhan urban agglomeration. J. Nat. Resour. 2012, 27, 1447–1459. (In Chinese) [Google Scholar]
- Long, H.L.; Zou, J.; Liu, Y.S. Differentiation of rural development driven by industrialisation and urbanisation in eastern coastal China. Habitat Int. 2009, 33, 454–462. [Google Scholar] [CrossRef]
- Deng, X.Z.; Huang, J.K.; Rozelle, S.; Uchida, E. Growth, population and industrialisation, and urban land expansion of China. J. Urban Econ. 2008, 63, 96–115. [Google Scholar] [CrossRef]
- Wu, L.X.; Sun, B.; Zhou, S.L.; Huang, S.E.; Zhao, Q.G. A new fusion technique of remote sensing images for land use/cover. Pedosphere 2004, 14, 187–194. [Google Scholar]
- Fang, C.L.; Lin, X.Q. The spatial integration and industrial rationalization organization of Wuhan Urban Agglomeration. Geogr. Res. 2008, 27, 397–408. [Google Scholar]
- Pacione, M. The internal structure of cities in the third world. Geography 2001, 86, 189–209. [Google Scholar]
- Zhu, L.; Jiang, Z. From brigade to village community: The land tenure system and rural development in China. Camb. J. Econ. 1993, 17, 441–461. [Google Scholar]
- Yeh, A.G.O.; Li, X. Economic development and agricultural land loss in the Pearl River Delta, China. Habitat Int. 1999, 23, 373–390. [Google Scholar] [CrossRef]
- Liu, Y.S.; Fang, F.; Li, Y.H. Key issues of land use in China and implications for policy making. Land Use Policy 2014, 40, 6–12. [Google Scholar] [CrossRef]
- Lu, S.; Guan, X.; Zhou, M.; Wang, Y. Land resources allocation strategies in an urban area involving uncertainty: A case study of Suzhou, in the Yangtze River Delta of China. Environ. Manag. 2014, 53, 894–912. [Google Scholar] [CrossRef]
- Liang, Z.; White, M.J. Market Transition, Government Policies, and Interprovincial Migration in China: 1983–1988. Econ. Dev. Cult. Chang. 1997, 45, 321–339. [Google Scholar] [CrossRef]
- Zhao, S.X.B.; Chan, R.C.K.; Sit, K.T.O. Globalisation and the dominance of large cities in contemporary China. Cities 2003, 20, 265–278. [Google Scholar] [CrossRef]
- Fang, C.L.; Liu, X.L. Temporal and spatial differences and imbalance of China’s urbanisation development during 1950–2006. J. Geogr. Sci. 2009, 19, 719–732. [Google Scholar] [CrossRef]
- Fan, C.C. Uneven development and beyond: Regional development theory in post-Mao China. Int. J. Urban Reg. Res. 1997, 21, 620–639. [Google Scholar] [CrossRef]
- Yang, D.L. Patterns of China’s regional development strategy. China Q. 1990, 122, 230–257. [Google Scholar] [CrossRef]
- Yin, J.; Yin, Z.; Zhong, H.; Xu, S.; Hu, X.; Wang, J.; Wu, J. Monitoring urban expansion and land use/land cover changes of Shanghai metropolitan area during the transitional economy (1979–2009) in China. Environ. Monit. Assess. 2011, 177, 609–621. [Google Scholar] [CrossRef] [PubMed]
- Sun, C.; Wu, Z.F.; Lv, Z.Q.; Yao, N.; Wei, J.B. Quantifying different types of urban growth and the change dynamic in Guangzhou using multi-temporal remote sensing data. Int. J. Appl. Earth Obs. Geoinf. 2013, 21, 409–417. [Google Scholar] [CrossRef]
- Zhang, T.W. Land market forces and government’s role in sprawl: The case of China. Cities 2000, 17, 123–135. [Google Scholar] [CrossRef]
- Wong, S.W.; Tang, B.S. Challenges to the sustainability of “development zones”: A case study of Guangzhou Development District, China. Cities 2005, 22, 303–316. [Google Scholar] [CrossRef]
- Gross, C.; Ritzinger, A.; Magel, H. Searching for the village of tomorrow Scenarios on the functionality of Bavarian villages in 2020. disP–Plan. Rev. 2011, 47, 44–55. [Google Scholar]
- Stroessner, G. Land consolidation in Bavaria: Support given to rural areas. Irrig. Eng. Rural Plan. 1986, 9, 53–59. [Google Scholar]
- Liu, Y.S.; Lu, S.S.; Chen, Y.F. Spatio-temporal change of urban-rural equalized development patterns in China and its driving factors. J. Rural Stud. 2013, 32, 320–330. [Google Scholar] [CrossRef]
- Song, S.; Zhang, K.H. Urbanisation and city size distribution in China. Urban Stud. 2002, 39, 2317–2327. [Google Scholar] [CrossRef]
© 2014 by the authors; licensee MDPI, Basel, Switzerland. This article is an open access article distributed under the terms and conditions of the Creative Commons Attribution license (http://creativecommons.org/licenses/by/3.0/).
Share and Cite
Lu, S.; Guan, X.; He, C.; Zhang, J. Spatio-Temporal Patterns and Policy Implications of Urban Land Expansion in Metropolitan Areas: A Case Study of Wuhan Urban Agglomeration, Central China. Sustainability 2014, 6, 4723-4748. https://doi.org/10.3390/su6084723
Lu S, Guan X, He C, Zhang J. Spatio-Temporal Patterns and Policy Implications of Urban Land Expansion in Metropolitan Areas: A Case Study of Wuhan Urban Agglomeration, Central China. Sustainability. 2014; 6(8):4723-4748. https://doi.org/10.3390/su6084723
Chicago/Turabian StyleLu, Shasha, Xingliang Guan, Chao He, and Jiali Zhang. 2014. "Spatio-Temporal Patterns and Policy Implications of Urban Land Expansion in Metropolitan Areas: A Case Study of Wuhan Urban Agglomeration, Central China" Sustainability 6, no. 8: 4723-4748. https://doi.org/10.3390/su6084723