Personal Norms of Sustainability and Farm Management Behavior

Abstract
:1. Introduction
2. Conceptual Background
2.1. Norm-Activation Theory
2.2. Sustainability
2.3. System Description
2.4. Dual-Preferences Model

3. Data and Methods
3.1. Description of Data Collection
3.2. Elicitation of Personal Norms
“Sustaining the natural environment by sustaining the grazing capacity of your rangeland: How high should the grazing capacity of your rangeland, expressed in hectares per Large Stock Unit, be during your own and future generations?”
“Sustaining the livelihood of farmers by sustaining income: How much annual net income (gross revenues from farming minus operating expenses, taxes and interest on loans), expressed in today’s N$, should you yourself and future generations at least derive from cattle farming?”
3.3. Management Strategies, Ecosystem Condition, Income, and Further Characteristics

| Variable | Definition | Mean | Std. dev. | Min | Max |
|---|---|---|---|---|---|
| Personal norms | |||||
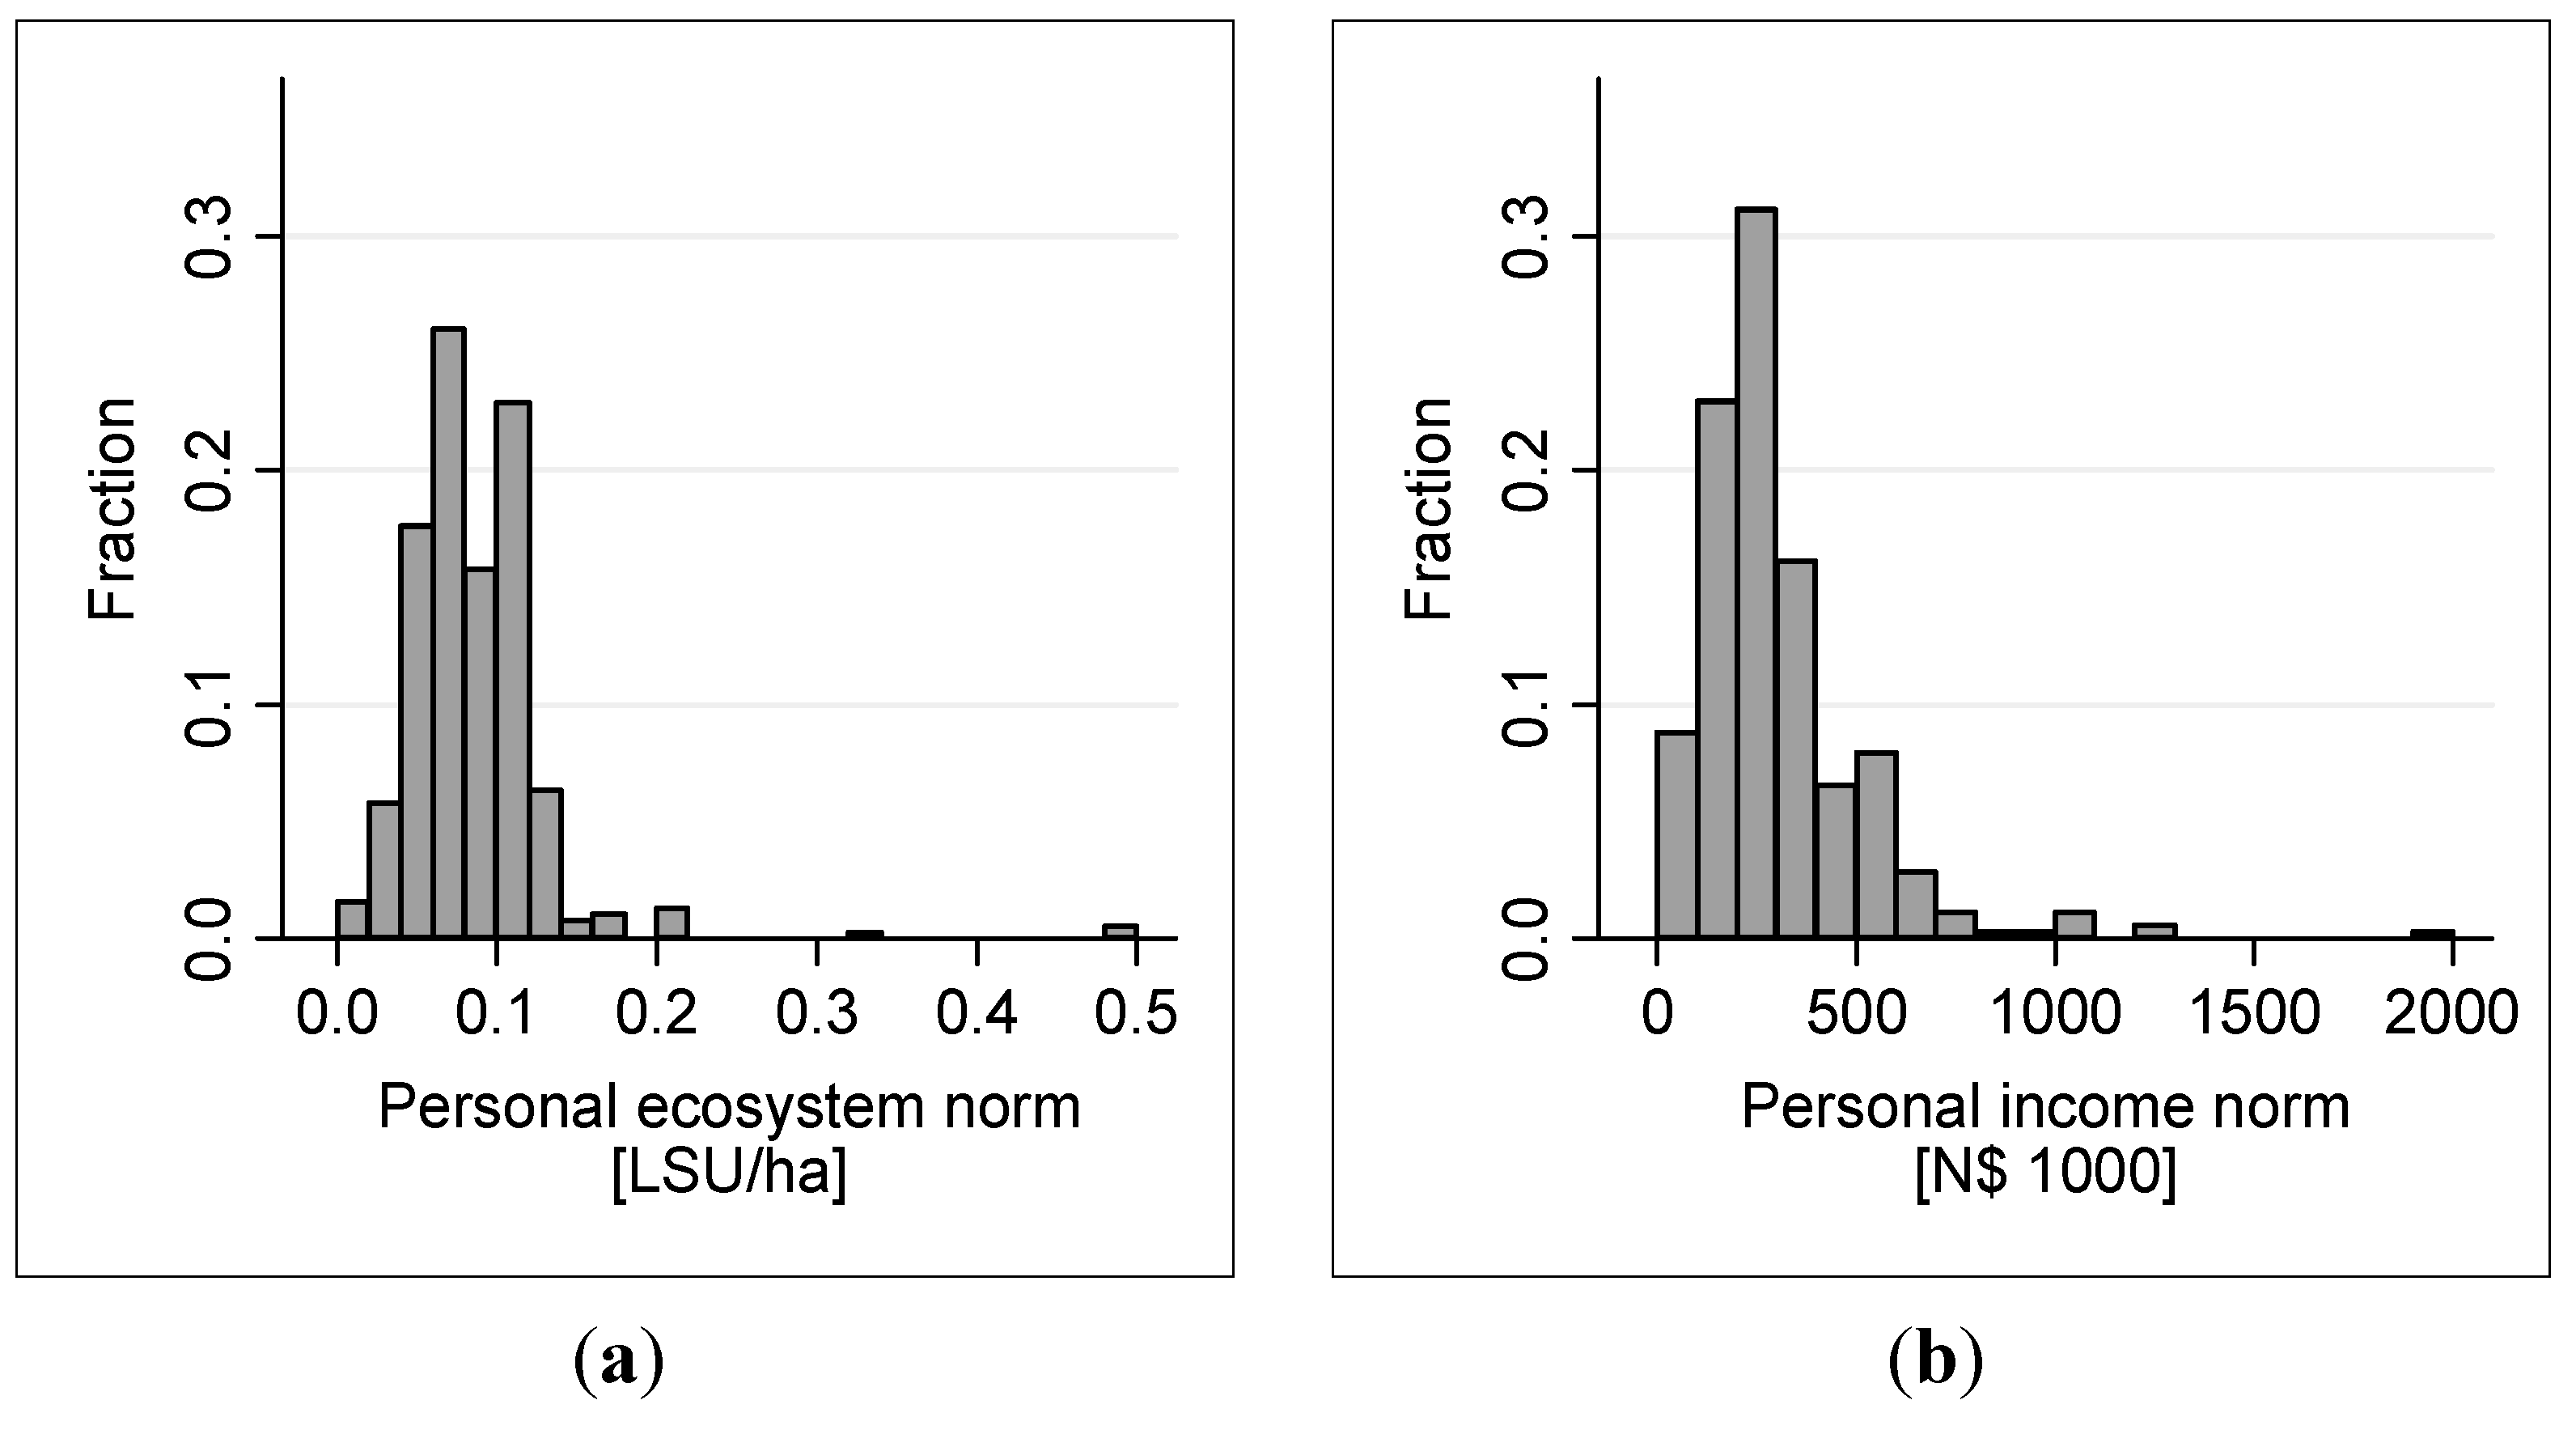
| Ecosystem norm | Minimum threshold above which grazing capacity should be sustained, in Large Stock Unit per hectare | 0.08 | 0.03 | 0.01 | 0.33 |
| Income norm | Minimum threshold above which annual net income from cattle farming should be sustained, in N$ | 271,550 | 202,595 | 4000 | 2,000,000 |
| Socio-demographic characteristics | |||||
| Income | Annual net income from cattle farming; calculated as mid-points of six intervals of total annual income, corrected for fraction derived from cattle farming, in N$ | 111,911 | 95,313 | 0 | 360,000 |
| Female | Female | 0.04 | 0.19 | 0.00 | 1.00 |
| Age | Age in years | 54.0 | 11.5 | 27.0 | 90.0 |
| Farm experience | Experience in farming in years | 24.5 | 12.8 | 1.5 | 70.0 |
| Afrikaans | Of Afrikaans ethnicity | 0.52 | 0.50 | 0.00 | 1.00 |
| German | Of German ethnicity | 0.43 | 0.50 | 0.00 | 1.00 |
| Other ethnicity | Of English or indigenous ethnicity | 0.04 | 0.20 | 0.00 | 1.00 |
| Low education | No apprenticeship, college or university education | 0.36 | 0.48 | 0.00 | 1.00 |
| Living off farm | Farmer lives off farm during week, proxy for part-time farming | 0.22 | 0.41 | 0.00 | 1.00 |
| Rangeland area | Area of rangeland in hectares | 8158 | 5385 | 0 | 44,244 |
| Cattle quantity | Number of cattle in April 2008 | 473 | 392 | 0 | 3200 |
| Sustainability interest | Number of generations over which cattle farming should be sustainable | 3.40 | 3.21 | 0.00 | 10.00 |
| Environmental characteristics | |||||
| Ecosystem condition | Ecosystem condition measured as Large Stock Unit per hectare | 0.08 | 0.03 | 0.01 | 0.33 |
| Erongo | Farm located in Erongo | 0.05 | 0.23 | 0.00 | 1.00 |
| Hardap/Karas | Farm located in Hardap or Karas | 0.04 | 0.20 | 0.00 | 1.00 |
| Khomas | Farm located in Khomas | 0.20 | 0.40 | 0.00 | 1.00 |
| Kunene | Farm located in Kunene | 0.10 | 0.30 | 0.00 | 1.00 |
| Omaheke | Farm located in Omaheke | 0.23 | 0.42 | 0.00 | 1.00 |
| Oshikoto | Farm located in Oshikoto | 0.02 | 0.14 | 0.00 | 1.00 |
| Otjozondjupa | Farm located in Otjozondjupa | 0.36 | 0.48 | 0.00 | 1.00 |
| Management strategies [1 = not at all important, 6 = very important] | |||||
| Rangeland size increase | Purchase/lease of extra rangeland for scale effects | 3.3 | 1.7 | 1.0 | 6.0 |
| Spatial diversification | Purchase/lease of extra rangeland in areas with different rainfall patterns | 3.2 | 1.7 | 1.0 | 6.0 |
| Resting rangeland | Resting part of rangeland in good rainy seasons as buffer for bad seasons | 4.6 | 1.5 | 1.0 | 6.0 |
| Additional feed | Purchase of supplementary feed | 4.6 | 1.6 | 1.0 | 6.0 |
| Breed adaptation | Choice of breed adapted to high variability in grass production | 4.5 | 1.4 | 1.0 | 6.0 |
| Production system adaptation | Choice of cattle production system | 4.4 | 1.4 | 1.0 | 6.0 |
3.4. Statistical Specification

4. Results
4.1. Characterization of Personal Norms

4.2. Determinants of Personal Norms
| Dependent variables | Ecosystem norm | Income norm |
|---|---|---|
| Ecosystem | 5.7 × 10⁻¹ *** | 4.8 × 10⁴ |
| condition | (5.35 × 10⁻²) | (3.93 × 10⁵) |
| Income | 1.6 × 10⁻⁸ | 7.1 × 10⁻¹ *** |
| (1.87 × 10⁻⁸) | (1.37 × 10⁻¹) | |
| Female | −9.7 × 10⁻³ | −2.1 × 10⁴ |
| (8.43 × 10⁻³) | (6.18 × 10⁴) | |
| Age | 2.1 × 10⁻⁴ | 1.3 × 10³ |
| (1.98 × 10⁻⁴) | (1.45 × 10³) | |
| Farm experience | −2.8 × 10⁻⁴ | −2.7 × 10³ ** |
| (1.79 × 10⁻⁴) | (1.31 × 10³) | |
| Afrikaans | 4.3 × 10⁻³ | −1.2 × 10⁴ |
| (7.77 × 10⁻³) | (5.70 × 10⁴) | |
| German | 6.8 × 10⁻⁴ | −5.3 × 10⁴ |
| (7.84 × 10⁻³) | (5.74 × 10⁴) | |
| Low education | −1.6 × 10⁻⁴ | −7.7 × 10² |
| (3.49 × 10⁻³) | (2.56 × 10⁴) | |
| Living off farm | 9.5 × 10⁻⁴ | −6.9 × 10³ |
| (4.07 × 10⁻³) | (2.98 × 10⁴) | |
| Rangeland area | −1.1 × 10⁻⁶ ** | 7.0 ** |
| (4.68 × 10⁻⁷) | (3.43) | |
| Cattle quantity | 8.1 × 10⁻⁶ | −18.0 |
| (6.51 × 10⁻⁶) | (47.70) | |
| Sustainability | −7.0 × 10⁻⁶ | −1.2 × 10³ |
| interest | (4.95 × 10⁻⁴) | (3.63 × 10³) |
| Erongo | −1.9 × 10⁻² *** | 1.4 × 10⁴ |
| (7.47 × 10⁻³) | (5.48 × 10⁴) | |
| Hardap/Karas | −2.1 × 10⁻² ** | 1.5 × 10⁵ ** |
| (8.53 × 10⁻³) | (6.26 × 10⁴) | |
| Khomas | −8.9 × 10⁻³ ** | −1.5 × 10⁴ |
| (4.44 × 10⁻³) | (3.25 × 10⁴) | |
| Kunene | −7.9 × 10⁻³ | −7.7 × 10⁴ * |
| (5.66 × 10⁻³) | (4.15 × 10⁴) | |
| Omaheke | −1.2 × 10⁻² *** | 2.3 × 10³ |
| (4.23 × 10⁻³) | (3.10 × 10⁴) | |
| Oshikoto | −1.5 × 10⁻² | −6.6 × 10⁴ |
| (1.09 × 10⁻²) | (8.00 × 10⁴) | |
| Constant | 3.8 × 10⁻² *** | 1.8 × 10⁵ * |
| (1.28 × 10⁻²) | (9.35 × 10⁴) | |
| Adjusted R2 | 0.404 | 0.180 |
| F-statistic | 11.145 | 4.287 |
| Model significance | 0.000 | 0.000 |
| Observations | 270 | 270 |
4.3. Impact of Personal Norms on Management
| Dependent variables | Rangeland size increase | Spatial diversification | Resting rangeland | Additional feed | Breed adaptation | Production system adaptation |
|---|---|---|---|---|---|---|
| Ecosystem norm | −1.525 | 3.083 | −0.840 | 1.185 | 1.068 | −0.401 |
| (3.279) | (3.321) | (3.444) | (3.445) | (3.345) | (3.272) | |
| Income norm | 3.8 × 10⁻⁷ | 8.7 × 10⁻⁸ | 3.8 × 10⁻⁸ | −1.5 × 10⁻⁸ | −9.6 × 10⁻⁸ | 1.9 × 10⁻⁷ |
| (3.4 × 10⁻⁷) | (3.4 × 10⁻⁷) | (3.7 × 10⁻⁷) | (3.5 × 10⁻⁷) | (3.6 × 10⁻⁷) | (3.5 × 10⁻⁷) | |
| Cutoff 1 | −0.795 *** | −0.709 *** | −1.665 *** | −1.522 *** | −1.840 *** | −1.534 *** |
| (0.107) | (0.106) | (0.148) | (0.135) | (0.161) | (0.136) | |
| Cutoff 2 | −0.262 *** | −0.171 * | −1.079 *** | −1.155 *** | −1.207 *** | −1.136 *** |
| (0.101) | (0.101) | (0.117) | (0.117) | (0.120) | (0.118) | |
| Cutoff 3 | 0.059 | 0.194 * | −0.730 *** | −0.781 *** | −0.809 *** | −0.762 *** |
| (0.100) | (0.101) | (0.108) | (0.108) | (0.109) | (0.108) | |
| Cutoff 4 | 0.708 *** | 0.668 *** | −0.323 *** | −0.322 *** | −0.231 ** | −0.056 |
| (0.105) | (0.105) | (0.103) | (0.103) | (0.101) | (0.100) | |
| Cutoff 5 | 1.254 *** | 1.307 *** | 0.242 ** | 0.187 * | 0.640 *** | 0.708 *** |
| (0.120) | (0.122) | (0.103) | (0.102) | (0.105) | (0.105) | |
| Log-likelihood | −474 | −476 | −422 | −415 | −427 | −435 |
| Observations | 270 | 270 | 270 | 270 | 270 | 270 |
| Dependent variables | Rangeland size increase | Spatial diversification | Resting rangeland | Additional feed | Breed adaptation | Production system adaptation |
|---|---|---|---|---|---|---|
| Ecosystem norm | −2.611 | 2.541 | −1.098 | 1.604 | 1.302 | 1.092 |
| (3.443) | (3.491) | (3.667) | (3.665) | (3.528) | (3.452) | |
| Income norm | 3.2 × 10⁻⁷ | −5.1 × 10⁻⁸ | 5.4 × 10⁻⁸ | −1.5 × 10⁻⁷ | −2.7 × 10⁻⁸ | 2.6 × 10⁻⁷ |
| (3.7 × 10⁻⁷) | (3.7 × 10⁻⁷) | (3.9 × 10⁻⁷) | (3.8 × 10⁻⁷) | (3.7 × 10⁻⁷) | (3.8 × 10⁻⁷) | |
| Female | −0.105 | −0.116 | 0.920 ** | 0.290 | 1.075 *** | 0.558 |
| (0.348) | (0.348) | (0.430) | (0.389) | (0.410) | (0.370) | |
| Age | −0.009 | −0.005 | 0.002 | 0.005 | 0.002 | 0.004 |
| (0.008) | (0.008) | (0.009) | (0.009) | (0.008) | (0.008) | |
| Farm experience | −0.005 | −0.002 | 0.014 * | −0.006 | 0.003 | 0.010 |
| (0.008) | (0.008) | (0.008) | (0.008) | (0.008) | (0.008) | |
| Afrikaans | 0.410 | 0.621 * | −0.064 | −0.249 | −0.478 | −0.127 |
| (0.330) | (0.335) | (0.350) | (0.354) | (0.345) | (0.333) | |
| German | 0.156 | 0.419 | −0.617 * | −0.462 | −0.701 ** | −0.418 |
| (0.333) | (0.337) | (0.355) | (0.358) | (0.350) | (0.338) | |
| Low education | −0.145 | −0.239 | −0.195 | 0.187 | −0.087 | −0.253 * |
| (0.146) | (0.146) | (0.151) | (0.155) | (0.147) | (0.147) | |
| Living off farm | 5.3 × 10⁻² | 1.6 × 10⁻¹ | 1.9 × 10⁻¹ | 2.7 × 10⁻¹ | 1.2 × 10⁻¹ | −8.2 × 10⁻³ |
| (1.7 × 10⁻¹) | (1.7 × 10⁻¹) | (1.8 × 10⁻¹) | (1.8 × 10⁻¹) | (1.7 × 10⁻¹) | (1.7 × 10⁻¹) | |
| Rangeland area | 9.2 × 10⁻⁶ | 4.6 × 10⁻⁵ ** | 2.4 × 10⁻⁵ | 1.8 × 10⁻⁵ | 3.0 × 10⁻⁵ | 6.9 × 10⁻⁵ *** |
| (1.9 × 10⁻⁵) | (1.9 × 10⁻⁵) | (1.9 × 10⁻⁵) | (1.9 × 10⁻⁵) | (1.9 × 10⁻⁵) | (2.1 × 10⁻⁵) | |
| Cattle quantity | 2.3 × 10⁻⁴ | −4.6 × 10⁻⁴ * | −6.0 × 10⁻⁴ ** | −9.0 × 10⁻⁵ | −2.4 × 10⁻⁴ | −5.6 × 10⁻⁴ ** |
| (2.6 × 10⁻⁴) | (2.6 × 10⁻⁴) | (2.7 × 10⁻⁴) | (2.7 × 10⁻⁴) | (2.6 × 10⁻⁴) | (2.8 × 10⁻⁴) | |
| Sustainability | −0.014 | −0.029 | −0.043 ** | 0.002 | 0.008 | 0.022 |
| interest | (0.021) | (0.021) | (0.022) | (0.022) | (0.021) | (0.021) |
| Erongo | 0.407 | −0.051 | 0.144 | −0.855 *** | 0.396 | 0.225 |
| (0.309) | (0.311) | (0.334) | (0.319) | (0.331) | (0.317) | |
| Hardap/Karas | −0.533 | −0.250 | −0.556 | −0.473 | −0.740 ** | −0.589 |
| (0.360) | (0.359) | (0.365) | (0.359) | (0.359) | (0.360) | |
| Khomas | −0.025 | 0.059 | −0.059 | −0.239 | −0.049 | 0.226 |
| (0.185) | (0.185) | (0.194) | (0.190) | (0.187) | (0.188) | |
| Kunene | −0.075 | 0.225 | 0.114 | −0.232 | 0.219 | 0.120 |
| (0.237) | (0.239) | (0.255) | (0.244) | (0.243) | (0.238) | |
| Omaheke | −0.182 | −0.144 | −0.130 | 0.820 *** | −0.063 | −0.072 |
| (0.179) | (0.179) | (0.186) | (0.206) | (0.180) | (0.181) | |
| Oshikoto | 0.067 | −0.076 | 0.134 | −0.340 | −0.163 | 0.021 |
| (0.452) | (0.446) | (0.464) | (0.453) | (0.443) | (0.443) | |
| Cutoff 1 | −1.128 ** | −0.580 | −1.939 *** | −1.666 *** | −2.119 *** | −1.048 ** |
| (0.512) | (0.510) | (0.553) | (0.558) | (0.543) | (0.523) | |
| Cutoff 2 | −0.570 | −0.015 | −1.290 ** | −1.270 ** | −1.468 *** | −0.637 |
| (0.509) | (0.510) | (0.541) | (0.554) | (0.532) | (0.518) | |
| Cutoff 3 | −0.232 | 0.370 | −0.910 * | −0.854 | −1.057 ** | −0.242 |
| (0.508) | (0.510) | (0.537) | (0.553) | (0.529) | (0.516) | |
| Cutoff 4 | 0.449 | 0.872 * | −0.467 | −0.340 | −0.455 | 0.514 |
| (0.509) | (0.509) | (0.535) | (0.553) | (0.528) | (0.517) | |
| Cutoff 5 | 1.008 ** | 1.530 *** | 0.146 | 0.232 | 0.467 | 1.335 ** |
| (0.512) | (0.514) | (0.537) | (0.553) | (0.527) | (0.521) | |
| Log-likelihood | −464 | −466 | −403 | −388 | −414 | −420 |
| Observations | 270 | 270 | 270 | 270 | 270 | 270 |
5. Discussion and Conclusions
Acknowledgments
Author Contributions
Conflicts of Interest
Appendix A. Dual-Preferences Model

 with α > 0, β > 0. Then u'(y) = α − β·y > 0 which is increasing and concave in y. We specify the grazing capacity as linear and increasing in extent a of management, i.e., g(a) = g·a with g > 0. We further assume constant returns to scale in production, i.e., f(g(a)) = f·g(a) = ϕ·a with ϕ > 0 and constant marginal costs, i.e., c(a) = c·a with c > 0 [64]. Furthermore, we normalize market price p to unity. Net income y(a) may then be rewritten as y(a) = f(a) − c(a) = (ϕ−c)·a = φ·a where φ = ϕ−c, and is increasing for all a if we assume that ϕ>c>0 and thus φ> 0.

- Proposition 1:
- A change in optimal extent a* of management for a change in the norm g;− is zero if and only if γ equals zero.
- Proposition 2:
- A change in optimal extent a* of management for a change in the norm y;− is zero if and only if υ equals zero.
Appendix B. Piecewise Regression


Appendix C. Robustness Checks
C.1. Robustness Check for Analysis of Research Question 2 (Determinants of Personal Norms)
| Dependent variables | Ecosystem norm | Income norm |
|---|---|---|
| Ecosystem norm | 5.5 × 10⁵ | |
| (4.62 × 10⁵) | ||
| Income norm | 1.0 × 10⁻⁸ | |
| (8.60 × 10⁻⁹) | ||
| Ecosystem condition | 5.7 × 10⁻¹ *** | −2.7 × 10⁵ |
| (5.35 × 10⁻²) | (4.73 × 10⁵) | |
| Income | 8.3 × 10⁻⁹ | 7.0 × 10⁻¹ *** |
| (1.96 × 10⁻⁸) | (1.37 × 10⁻¹) | |
| Female | −9.5 × 10⁻³ | −1.5 × 10⁴ |
| (8.42 × 10⁻³) | (6.19 × 10⁴) | |
| Age | 2.0 × 10⁻⁴ | 1.2 × 10³ |
| (1.98 × 10⁻⁴) | (1.45 × 10³) | |
| Farm experience | −2.5 × 10⁻⁴ | −2.6 × 10³ * |
| (1.81 × 10⁻⁴) | (1.32 × 10³) | |
| Afrikaans | 4.4 × 10⁻³ | −1.5 × 10⁴ |
| (7.76 × 10⁻³) | (5.70 × 10⁴) | |
| German | 1.2 × 10⁻³ | −5.4 × 10⁴ |
| (7.84 × 10⁻³) | (5.74 × 10⁴) | |
| Low education | −1.5 × 10⁻⁴ | −6.9 × 10² |
| (3.48 × 10⁻³) | (2.55 × 10⁴) | |
| Living off farm | 1.0 × 10⁻³ | −7.5 × 10³ |
| (4.07 × 10⁻³) | (2.98 × 10⁴) | |
| Rangeland area | −1.2 × 10⁻⁶ ** | 7.6 ** |
| (4.72 × 10⁻⁷) | (3.47) | |
| Cattle quantity | 8.3 × 10⁻⁶ | −23.0 |
| (6.51 × 10⁻⁶) | (47.90) | |
| Sustainability interest | 5.6 × 10⁻⁶ | −1.2 × 10³ |
| (4.95 × 10⁻⁴) | (3.63 × 10³) | |
| Erongo | −2.0 × 10⁻² *** | 2.4 × 10⁴ |
| (7.47 × 10⁻³) | (5.55 × 10⁴) | |
| Hardap/Karas | −2.3 × 10⁻² *** | 1.6 × 10⁵ ** |
| (8.62 × 10⁻³) | (6.33 × 10⁴) | |
| Khomas | −8.7 × 10⁻³ * | −1.0 × 10⁴ |
| (4.43 × 10⁻³) | (3.28 × 10⁴) | |
| Kunene | −7.1 × 10⁻³ | −7.3 × 10⁴ * |
| (5.70 × 10⁻³) | (4.16 × 10⁴) | |
| Omaheke | −1.2 × 10⁻² *** | 8.8 × 10³ |
| (4.23 × 10⁻³) | (3.15 × 10⁴) | |
| Oshikoto | −1.4 × 10⁻² | −5.8 × 10⁴ |
| (1.09 × 10⁻²) | (8.02 × 10⁴) | |
| Constant | 3.6 × 10⁻² *** | 1.6 × 10⁵ |
| (1.28 × 10⁻²) | (9.51 × 10⁴) | |
| Adjusted R2 | 0.405 | 0.182 |
| F-statistic | 10.650 | 4.143 |
| Model significance | 0.000 | 0.000 |
| Observations | 270 | 270 |
C.2. Robustness Checks for Analysis of Research Question 3 (Impact of Personal Norms on Management)
| Dependent variables | Rangeland size increase | Spatial diversification | Resting rangeland | Additional feed | Breed adaptation | Production system adaptation | |
|---|---|---|---|---|---|---|---|
| Ecosystem norm | −5.027 | 4.702 | −1.056 | 0.819 | 1.041 | 0.434 | |
| (3.550) | (3.622) | (3.742) | (3.683) | (3.587) | (3.496) | ||
| Income norm | 4.8 × 10⁻⁷ | −3.9 × 10⁻⁷ | 6.4 × 10⁻⁸ | −1.5 × 10⁻⁷ | −1.6 × 10⁻⁷ | 2.7 × 10⁻⁷ | |
| (3.7 × 10⁻⁷) | (3.8 × 10⁻⁷) | (3.9 × 10⁻⁷) | (3.9 × 10⁻⁷) | (3.8 × 10⁻⁷) | (3.8 × 10⁻⁷) | ||
| Female | −0.072 | −0.244 | 0.830 * | 0.216 | 0.805 * | 0.343 | |
| (0.362) | (0.364) | (0.436) | (0.399) | (0.413) | (0.376) | ||
| Age | −0.006 | −0.001 | 0.003 | 0.006 | 0.001 | 0.005 | |
| (0.009) | (0.009) | (0.009) | (0.009) | (0.008) | (0.008) | ||
| Farm experience | −0.005 | 0.003 | 0.015 * | −0.006 | 0.000 | 0.010 | |
| (0.008) | (0.008) | (0.008) | (0.008) | (0.008) | (0.008) | ||
| Afrikaans | 0.116 | 0.559 | −0.049 | −0.334 | −0.504 | −0.088 | |
| (0.342) | (0.357) | (0.356) | (0.357) | (0.354) | (0.337) | ||
| German | −0.071 | 0.588 | −0.578 | −0.473 | −0.539 | −0.321 | |
| (0.349) | (0.361) | (0.361) | (0.363) | (0.361) | (0.344) | ||
| Low education | −0.010 | −0.204 | −0.173 | 0.248 | 0.009 | −0.206 | |
| (0.152) | (0.154) | (0.154) | (0.158) | (0.151) | (0.149) | ||
| Living off farm | −1.3 × 10⁻¹ | 1.4 × 10⁻¹ | 1.4 × 10⁻¹ | 2.1 × 10⁻¹ | 1.2 × 10⁻¹ | −7.8 × 10⁻² | |
| (1.7 × 10⁻¹) | (1.8 × 10⁻¹) | (1.8 × 10⁻¹) | (1.8 × 10⁻¹) | (1.8 × 10⁻¹) | (1.7 × 10⁻¹) | ||
| Rangeland area | −2.5 × 10⁻⁵ | 4.7 × 10⁻⁵ ** | 1.9 × 10⁻⁵ | 3.2 × 10⁻⁶ | 1.3 × 10⁻⁵ | 5.5 × 10⁻⁵ *** | |
| (2.0 × 10⁻⁵) | (1.9 × 10⁻⁵) | (2.0 × 10⁻⁵) | (2.0 × 10⁻⁵) | (2.0 × 10⁻⁵) | (2.1 × 10⁻⁵) | ||
| Cattle quantity | 0.001 ** | −0.001 *** | −0.001 ** | 0.000 | −0.000 | −0.000 | |
| (0.000) | (0.000) | (0.000) | (0.000) | (0.000) | (0.000) | ||
| Sustainability | 0.008 | −0.035 | −0.040 * | 0.009 | 0.009 | 0.027 | |
| interest | (0.021) | (0.022) | (0.022) | (0.023) | (0.021) | (0.021) | |
| Erongo | 0.591 * | −0.353 | 0.129 | −0.895 *** | 0.253 | 0.149 | |
| (0.319) | (0.327) | (0.345) | (0.325) | (0.337) | (0.327) | ||
| Hardap/Karas | −0.439 | 0.243 | −0.443 | −0.333 | −0.504 | −0.403 | |
| (0.374) | (0.375) | (0.371) | (0.365) | (0.363) | (0.364) | ||
| Khomas | −0.035 | 0.120 | −0.034 | −0.249 | −0.111 | 0.246 | |
| (0.192) | (0.193) | (0.197) | (0.191) | (0.190) | (0.191) | ||
| Kunene | −0.360 | 0.322 | 0.072 | −0.321 | 0.220 | 0.009 | |
| (0.248) | (0.249) | (0.260) | (0.247) | (0.249) | (0.242) | ||
| Omaheke | −0.096 | −0.132 | −0.125 | 0.881 *** | −0.071 | −0.039 | |
| (0.188) | (0.191) | (0.191) | (0.209) | (0.187) | (0.187) | ||
| Oshikoto | 0.157 | −0.103 | 0.143 | −0.341 | −0.264 | 0.037 | |
| (0.463) | (0.457) | (0.464) | (0.453) | (0.446) | (0.446) | ||
| Spatial | 0.528 *** | 0.071 | 0.143 ** | −0.031 | 0.127 ** | ||
| diversification | (0.049) | (0.056) | (0.058) | (0.054) | (0.054) | ||
| Resting | 0.005 | 0.031 | 0.032 | 0.108 ** | −0.015 | ||
| rangeland | (0.047) | (0.047) | (0.048) | (0.045) | (0.046) | ||
| Additional feed | −0.007 | 0.123 ** | 0.006 | 0.057 | −0.018 | ||
| (0.048) | (0.048) | (0.050) | (0.048) | (0.048) | |||
| Breed | 0.067 | 0.015 | 0.148 *** | 0.069 | 0.264 *** | ||
| adaptation | (0.054) | (0.055) | (0.054) | (0.055) | (0.051) | ||
| Production | −0.038 | 0.131 ** | −0.054 | −0.006 | 0.252 *** | ||
| system adapt. | (0.053) | (0.053) | (0.055) | (0.056) | (0.050) | ||
| Rangeland size | 0.537 *** | 0.005 | −0.003 | 0.076 | −0.027 | ||
| increase | (0.049) | (0.056) | (0.058) | (0.053) | (0.054) | ||
| Cutoff 1 | 0.246 | 2.429 *** | −1.239 * | −0.871 | −0.412 | 0.233 | |
| (0.646) | (0.666) | (0.644) | (0.658) | (0.647) | (0.639) | ||
| Cutoff 2 | 1.015 | 3.218 *** | −0.588 | −0.463 | 0.295 | 0.666 | |
| (0.647) | (0.673) | (0.634) | (0.654) | (0.642) | (0.634) | ||
| Cutoff 3 | 1.488 ** | 3.780 *** | −0.200 | −0.027 | 0.748 | 1.092 * | |
| (0.649) | (0.680) | (0.631) | (0.653) | (0.643) | (0.633) | ||
| Cutoff 4 | 2.364 *** | 4.456 *** | 0.250 | 0.510 | 1.399 ** | 1.906 *** | |
| (0.655) | (0.687) | (0.630) | (0.655) | (0.645) | (0.638) | ||
| Cutoff 5 | 3.066 *** | 5.304 *** | 0.881 | 1.099* | 2.382 *** | 2.800 *** | |
| (0.661) | (0.700) | (0.633) | (0.656) | (0.649) | (0.647) | ||
| Log-likelihood | −397 | −389 | −397 | −381 | −396 | −402 | |
| Observations | 270 | 270 | 270 | 270 | 270 | 270 | |
References and Notes
- Howarth, R.B. Towards an operational sustainability criterion. Ecol. Econ. 2007, 63, 656–663. [Google Scholar] [CrossRef]
- Solow, R. Sustainability: An economist’s perspective. In Economics of the Environment, Selected Readings, 3rd ed.; Dorfman, R., Dorfman, N.S., Eds.; Norton: New York, NY, USA, 1993. [Google Scholar]
- Anand, S.; Sen, A. Human development and economic sustainability. World Dev. 2000, 28, 2029–2049. [Google Scholar] [CrossRef]
- Brekke, K.A.; Kverndokk, S.; Nyborg, K. An economic model of moral motivation. J. Public Econ. 2003, 87, 1967–1983. [Google Scholar] [CrossRef]
- Conlin, M.; Lynn, M.; O’Donoghue, T. The norm of restaurant tipping. J. Econ. Behav. Organ. 2003, 52, 297–321. [Google Scholar] [CrossRef]
- Young, H.P. Social norms. In The New Palgrave Dictionary of Economics, 2nd ed.; Durlauf, S.N., Blume, L., Eds.; Macmillan: London, UK, 2008. [Google Scholar]
- Young, H.P.; Burke, M. Norms, customs and conventions. In Handbook of Social Economics, 1st ed.; Benhabib, J., Bisin, A., Jackson, M.O., Eds.; North Holland: Amsterdam, Netherlands, 2010. [Google Scholar]
- Harland, P.; Staats, H.; Wilke, H.A. Explaining proenvironmental intention and behavior. J. Appl. Soc. Psychol. 1999, 29, 2505–2528. [Google Scholar] [CrossRef]
- Stern, P.C. New environmental theories: Toward a coherent theory of environmentally significant behavior. J. Soc. Issues 2000, 56, 407–424. [Google Scholar] [CrossRef]
- Nordlund, A.M.; Garvill, J. Value structures behind proenvironmental behavior. Environ. Behav. 2002, 34, 740–756. [Google Scholar] [CrossRef]
- Schwartz, S.H. Normative explanations of helping behavior: A critique, proposal and empirical test. J. Exp. Soc. Psychol. 1973, 9, 349–364. [Google Scholar] [CrossRef]
- Schwartz, S.H. Normative influences on altruism. Adv. Exp. Soc. Psychol. 1977, 10, 221–279. [Google Scholar]
- Stern, P.C.; Dietz, T.; Abel, T.; Guagnano, G.A.; Kalof, L. A value-belief-norm theory of support for social movements: The case of environmentalism. Res. Hum. Ecol. 1999, 6, 81–97. [Google Scholar]
- Hopper, J.R.; Nielsen, J.M. Recycling as altruistic behavior: Normative and behavioral strategies to expand participation in a community recycling program. Environ. Behav. 1991, 23, 195–220. [Google Scholar] [CrossRef]
- Thørgersen, J. Spillover processes in the development of a sustainable consumption pattern. J. Econ. Psychol. 1999, 20, 53–81. [Google Scholar] [CrossRef]
- Ek, K.; Söderholm, P. Norms and economic motivation in the Swedish green electricity market. Ecol. Econ. 2008, 68, 169–182. [Google Scholar] [CrossRef]
- Pearce, D.W.; Marandya, A.; Barbier, E.B. Blueprint for a Green Economy, 1st ed.; Eartgscan: London, UK, 1989. [Google Scholar]
- Daly, H.E.; Cobb, J.B.; Cobb, C.W. For the Common Good: Redirecting the Economy toward Community, the Environment, and a Sustainable Future, 2nd ed.; Beacon Press: Boston, MA, USA, 1994. [Google Scholar]
- Ekins, P.; Simon, S.; Deutsch, L.; Folke, C.; Groot, R. A framework for the practical application of the concepts of critical natural capital and strong sustainability. Ecol. Econ. 2003, 44, 165–185. [Google Scholar] [CrossRef]
- Baumgärtner, S.; Quaas, M.F. Ecological-economic viability as a criterion of strong sustainability under uncertainty. Ecol. Econ. 2009, 68, 2008–2020. [Google Scholar] [CrossRef]
- Quaas, M.F.; Baumgärtner, S.; Becker, C.; Frank, K.; Müller, B. Uncertainty and sustainability in the management of rangelands. Ecol. Econ. 2007, 62, 251–266. [Google Scholar] [CrossRef]
- Olbrich, R.; Quaas, M.F.; Baumgärtner, S. Risk and risk management in Namibian commercial cattle farming. 2011; unpublished work. [Google Scholar]
- Quaas, M.F.; Baumgärtner, S. Optimal grazing management rules in semi-arid rangelands with uncertain rainfall. Nat. Resour. Model. 2012, 25, 364–387. [Google Scholar] [CrossRef]
- De Klerk, J. Bush Encroachment in Namibia. Report on Phase 1 of the Bush Encroachment Research, Monitoring and Management Project, 1st ed.; Ministry of Environment and Tourism: Windhoek, Namibia, 2004. [Google Scholar]
- Olbrich, R.; Quaas, M.F.; Baumgärtner, S. Sustainable Use of Ecosystem Services under Multiple Risks—A Survey of Commercial Cattle Farmers in Semi-Arid Rangelands in Namibia; Working Paper Series in Economics No. 137; Leuphana University Lüneburg: Lüneburg, Germany, 2009. [Google Scholar]
- Olbrich, R.; Quaas, M.F.; Baumgärtner, S. A survey of commercial cattle farmers in semi-arid rangelands of Namibia on risk,sustainability and management. J. Appl. Soc. Sci. Stud. 2012, 132, 463–471. [Google Scholar]
- Elster, J. Social norms and economic theory. J. Econ. Perspect. 1989, 3, 99–117. [Google Scholar] [CrossRef]
- Hausman, D.M.; McPherson, M.S. Economic Analysis, Moral Philosophy, and Public Policy, 2nd ed.; Cambridge University Press: New York, NY, USA, 2006. [Google Scholar]
- Ajzen, I. The theory of planned behavior. Organ. Behav. Hum. Dec. 1991, 50, 179–211. [Google Scholar] [CrossRef]
- Bamberg, S.; Schmidt, P. Incentives, morality, or habit? Predicting students’ car use for university routes with the models of Ajzen, Schwartz, and Triandis. Envion. Behav. 2003, 35, 264–285. [Google Scholar] [CrossRef]
- Widegren, O. The new environmental paradigm and personal norms. Envion. Behav. 1998, 30, 75–100. [Google Scholar] [CrossRef]
- Kallgren, C.A.; Reno, R.R.; Cialdini, R.B. A focus theory of normative conduct: When norms do and do not affect behavior. Pers. Soc. Psychol. B. 2000, 26, 1002–1012. [Google Scholar] [CrossRef]
- Brekke, K.A.; Kipperberg, G.; Nyborg, K. Social interaction in responsibility ascription: The case of household recycling. Land Econ. 2010, 86, 766–784. [Google Scholar]
- Individuals balance compliance with the norms with fulfillment of egoistic needs. As such, they may not feel capable of complying with the norm (and thus not feel capable of averting adverse consequences) for ethically more or less sound reasons.
- Faber, M.; Frank, K.; Klauer, B.; Manstetten, R.; Schiller, J.; Wissel, C. On the foundation of a general theory of stocks. Ecol. Econ. 2005, 55, 155–172. [Google Scholar] [CrossRef]
- Olbrich, R. Environmental Risk and Sustainability: The Case of Commercial Livestock Farming in Semi-Arid Rangelands. Ph.D. Thesis, Leuphana University Lüneburg, Lüneburg, Germany, 2012. [Google Scholar]
- Mendelsohn, J. Farming Systems in Namibia, 1st ed.; Research & Information Services in Namibia: Windhoek, Namibia, 2006. [Google Scholar]
- Hager, C.; Marggraff, M.; Namibia Agricultural Union, Windhoek, Namibia. Interview, 2 April 2007.
- Ministry of Agriculture, Water and Forestry (MAWF). Agricultural Statistics Bulletin (2000–2007), 1st ed.Ministry of Agriculture, Water and Forestry: Windhoek, Namibia, 2000.
- Ward, D.; Saltz, D.; Ngairorue, B. Spatio-temporal rainfall variation and stock management in arid Namibia. Rangeland Eco. Manag. 2004, 57, 130–140. [Google Scholar]
- Wiegand, K.; Ward, D.; Saltz, D. Multi-scale patterns and bush encroachment in an arid savanna with a shallow soil layer. J. Veg. Sci. 2005, 16, 311–320. [Google Scholar] [CrossRef]
- Ministry of Environment and Tourism (MET). Atlas of Namibia Project, 1st ed.Ministry of Environment and Tourism: Windhoek, Namibia, 2002.
- A Large Stock Unit (LSU) is a standard measure for livestock quantity in Namibia. In the case of cattle, one cattle equals one LSU.
- Lubbe, L.; Ministry of Agriculture, Water and Forestry, Windhoek, Namibia. Interview, 19 October 2007.
- Peltzer, T.; Farm Onjossa, Okahandja, Namibia. Interview, 18–19 October 2007.
- Many other ecosystem features are related negatively to bush encroachment such as biodiversity or groundwater availability.
- On 1 August 2008, N$ 1000 equaled € 88.14 or US$ 137.50.
- Postlewaite, A. Social norms and preferences. In Handbook of Social Economics, 1st ed.; Benhabib, J., Bisin, A., Jackson, M.O., Eds.; North Holland: Amsterdam, Netherlands, 2010; pp. 31–67. [Google Scholar]
- In our statistical analyses, we will estimate the model separately for each of the six strategies.
- Thus, compliance with the personal norms is assured if actual ecosystem condition and income are equal to or above the ecosystem norm and income norm, respectively.
- To our knowledge, there exists no other comprehensive survey of commercial cattle farmers in Namibia. We thus cannot validate the representativeness of our sample by comparison with independently collected data sets.
- In the question we asked for grazing capacity we used the unit ha/LSU, since this is the commonly used unit in Namibia. For our subsequent analysis, we inverted the answers to the unit LSU/ha.
- Spearman correlation for personal norm for time horizon vs. time preferences: ρ = 0.02, p = 0.80, N = 270. Spearman correlation for personal norm for income risk vs. risk preferences: ρ = −0.05, p = 0.44, N = 261. Information on how these norms and preferences were measured is provided in [26].
- Statistics are calculated for all those farmers who did not display missing values for any variable used in the estimation of management strategies in Equation.
- Based on further data we collected in the survey [26], Otjozondjupa had—out of the five regions Erongo, Hardap/Karas, Khomas, Omaheke, and Otjozondjupa—the highest rainfall in the rainy seasons 2006/07 and 2007/08 as well as the second lowest risk rating (as reported by farmers) for each of the bush fire, cattle diseases, and predation risk categories.
- They also have a lower ecosystem norm as denoted by a significant negative coefficient of −1.1 × 10⁻⁶.
- In contrast, Park and Ha [68], who also employ the norm activation model, find a significant positive effect of personal norms on recycling. However, they study only the intention to recycle, not actual recycling behavior.
- No database exists that contains all commercial cattle farmers and their key socio-demographic characteristics. We thus compared samples from two subpopulations, NAU members and MeatCo customers, but found no difference in important socio-demographic characteristics [25]. We add here that samples also do not differ in personal norms and on-farm management strategies (t-tests, p > 0.1 for all personal norms and management strategies).
- Videras, J.; Owen, A.L.; Conover, E.; Wu, S. The influence of social relationships on pro-environmental behaviors. J. Envion. Econ. Manag. 2012, 63, 35–50. [Google Scholar] [CrossRef]
- Joubert, D.; Polytechnic of Namibia, Windhoek, Namibia. Interview, 21 July 2008.
- Neumann, N.; Ministry of Agriculture, Windhoek, Namibia. Interview, 30 July 2008.
- Pack, W.; Farm Grünental, Gobabis, Namibia. Interview, 26 July 2008.
- Even though we were inspired in the formulation of our model by the dual preferences model of [4], we have adopted a different concept of a moral norm. In [4], the moral norm is essentially defined as the morally ideal effort that maximizes social welfare if all members of a society act accordingly. In contrast, our concept of a personal norm defines what is ideal independent of what other members of the society consider as ideal or of how they act (see Section 2.1).
- We tested the validity of the specifications regarding the grazing capacity function and production function in our data using robust regressions (to account for potential outliers). Regarding the grazing capacity function we cannot reject a linear relationship between extent of the strategy and the actual grazing capacity at the 10% significance level for three out of the six management strategies described in Section 2.3 (i.e., for spatial diversification, resting rangeland, and additional feed). In regards to the production function, we cannot reject a linear relationship between actual grazing capacity and number of cattle at the 10% significance level. Thus, we deem our specifications to be realistic concerning those two functions. We could not perform a similar analysis for the cost function, as we do not have sufficient data on production costs.
- Zellner, A. An efficient method of estimating seemingly unrelated regressions and tests for aggregation bias. J. Am. Stat. Assoc. 1962, 57, 348–368. [Google Scholar] [CrossRef]
- Li, G. Robust regression. In Exploring Data Tables, Trends, and Shapes, 1st ed.; Hoaglin, F.M., Tukey, J.W., Eds.; Wiley: Washington, DC, USA, 1985; pp. 281–340. [Google Scholar]
- Specifically, we employ the version of an OLS robust regression as implemented in Stata’s rreg command.
- Park, J.; Ha, S. Understanding consumer recycling behavior: Combining the Theory of Planned Behavior and the Norm Activation Model. Fam. Consum. Sci. 2014, 42, 278–291. [Google Scholar] [CrossRef]
© 2014 by the authors; licensee MDPI, Basel, Switzerland. This article is an open access article distributed under the terms and conditions of the Creative Commons Attribution license (http://creativecommons.org/licenses/by/3.0/).
Share and Cite
Olbrich, R.; Quaas, M.F.; Baumgärtner, S. Personal Norms of Sustainability and Farm Management Behavior. Sustainability 2014, 6, 4990-5017. https://doi.org/10.3390/su6084990
Olbrich R, Quaas MF, Baumgärtner S. Personal Norms of Sustainability and Farm Management Behavior. Sustainability. 2014; 6(8):4990-5017. https://doi.org/10.3390/su6084990
Chicago/Turabian StyleOlbrich, Roland, Martin F. Quaas, and Stefan Baumgärtner. 2014. "Personal Norms of Sustainability and Farm Management Behavior" Sustainability 6, no. 8: 4990-5017. https://doi.org/10.3390/su6084990