1. Introduction
The food supply chain has become an important contributor to a number of environmental impacts. This is due to an increase in food production, to changes in dietary habits and to the way in which the processes included in the food chain are generally performed. In order for the whole chain to be taken into consideration, a life cycle approach to environmental assessment is needed; in that framework, the Life Cycle Assessment (LCA) methodology has been increasingly used to improve the environmental performance of food systems [
1].
When it comes to the widespread use of life cycle information, the simplification of LCA appears to be a vital question, especially for Small- and Medium-sized Enterprises (SMEs) that are unlikely to have either the knowledge or the resources necessary to implement conventional full LCAs. In a previous study [
2], a literature review was performed in order for the most suitable simplified LCA tools to be identified within the food sector. These tools were then evaluated by some experts and rated on the basis of several pre-set criteria. These criteria included ISO compliance, user-friendly interface, broad focus, limited data requirement or adaptability to existing databases, relevance to the life cycle step of agriculture, and ease of integration with EPD, POEMS and/or other communication tools. The simplified LCA tools were then ranked using decision-making methodologies, belonging to the family of Multi-Attribute Utility Theory.
For this paper, some of the best rated tools were tested and the results were examined in parallel to those of a full LCA. The case study was performed in the framework of a small family-managed wine making firm in the region of Abruzzo, Italy, called
Palazzo Centofanti. The functional unit selected for this study was defined as a 0.75 L bottle of organic red wine “
Montepulciano d’Abruzzo”, including its primary, secondary and tertiary packaging. The data collection was performed in the crop year 2010–2011. The basic phases of the product’s life cycle included in the study were: agriculture, vinification and distribution. Therefore, it can be considered as a cradle-to-market analysis [
1].
In a previous work [
1], the full LCA is described in detail along with the implementation of one of the simplified tools (eVerdEE), whilst in this paper three more tools are examined in parallel. Actually, the three tools under study include two from the original review results [
2] and one that came up in a later review. At the moment, all the tools are being re-assessed (by having them tested by a larger set of users) using decision making approaches, in order for a final ranking list to be produced and thus the pre-defined criteria to be validated. The results discussed in this paper refer to the particular case study. The authors have no intention whatsoever of declaring the superiority of one tool over the others.
3. BilanProduit
BilanProduit [
4], designed by ADEME France, is a tool, available only in French, the simplification of which is at the level of LCI [
5]. This takes into account the principal stages of a product’s life cycle: the raw materials, manufacturing procedures, means of transport and sources of energy, and is designed for when performing an LCA intended for eco-design [
5]. The tool is downloadable in the form of a Microsoft Excel file after registration and offers an incorporated database (using mainly entries from EcoInvent 2.0 (Ecoinvent Centre, Zürich and Lausanne, Switzerland). Detailed tips for the use of the tool are provided online but also within the file itself. The environmental impact categories tackled by BilanProduit are: energy and resource consumption, greenhouse effect, acidification, eutrophication, photochemical pollution, aquatic ecotoxicity and human toxicity.
3.1. Goal and Scope Definition
At the beginning the user needs to include on a separate sheet of the file called “Méthodologie” the details of the project, such as the name and the date. Then in another one the FU has to be declared. Here, the goal of the study can be inserted in the “description of the system” section. The tool does not provide here the opportunity to explicitly define the system boundary; however the user can insert the entries representing the system in the sheets that follow.
As far as allocation is concerned, this was performed in the same way as described for the eVerdEE tool.
3.2. Life Cycle Inventory
Within the sheets that follow the initial ones, the user can insert the processes regarding the system under study. The sheets include the phases of production, transports, use, and end of life. For every entry selected in the production sheet, the user needs to specify the phase in the life cycle that it is connected to. For this case study, the connection was performed by correlating the entries to the agricultural and vinification phases.
It is to be noted that this tool appeared to be lacking in specific fertilizers’ entries within its database. Therefore the fertilizers used in the agricultural phase were omitted, whilst the database provided sufficient entries for the pesticides used during the same phase.
As far as transport is concerned, the ones related to the raw materials were included in the production phase whilst under the “transport” entry only the transport of the final product was considered. The relevant calculations were performed as in the case of eVerdEE.
3.3. Life Cycle Impact Assessment and Interpretation
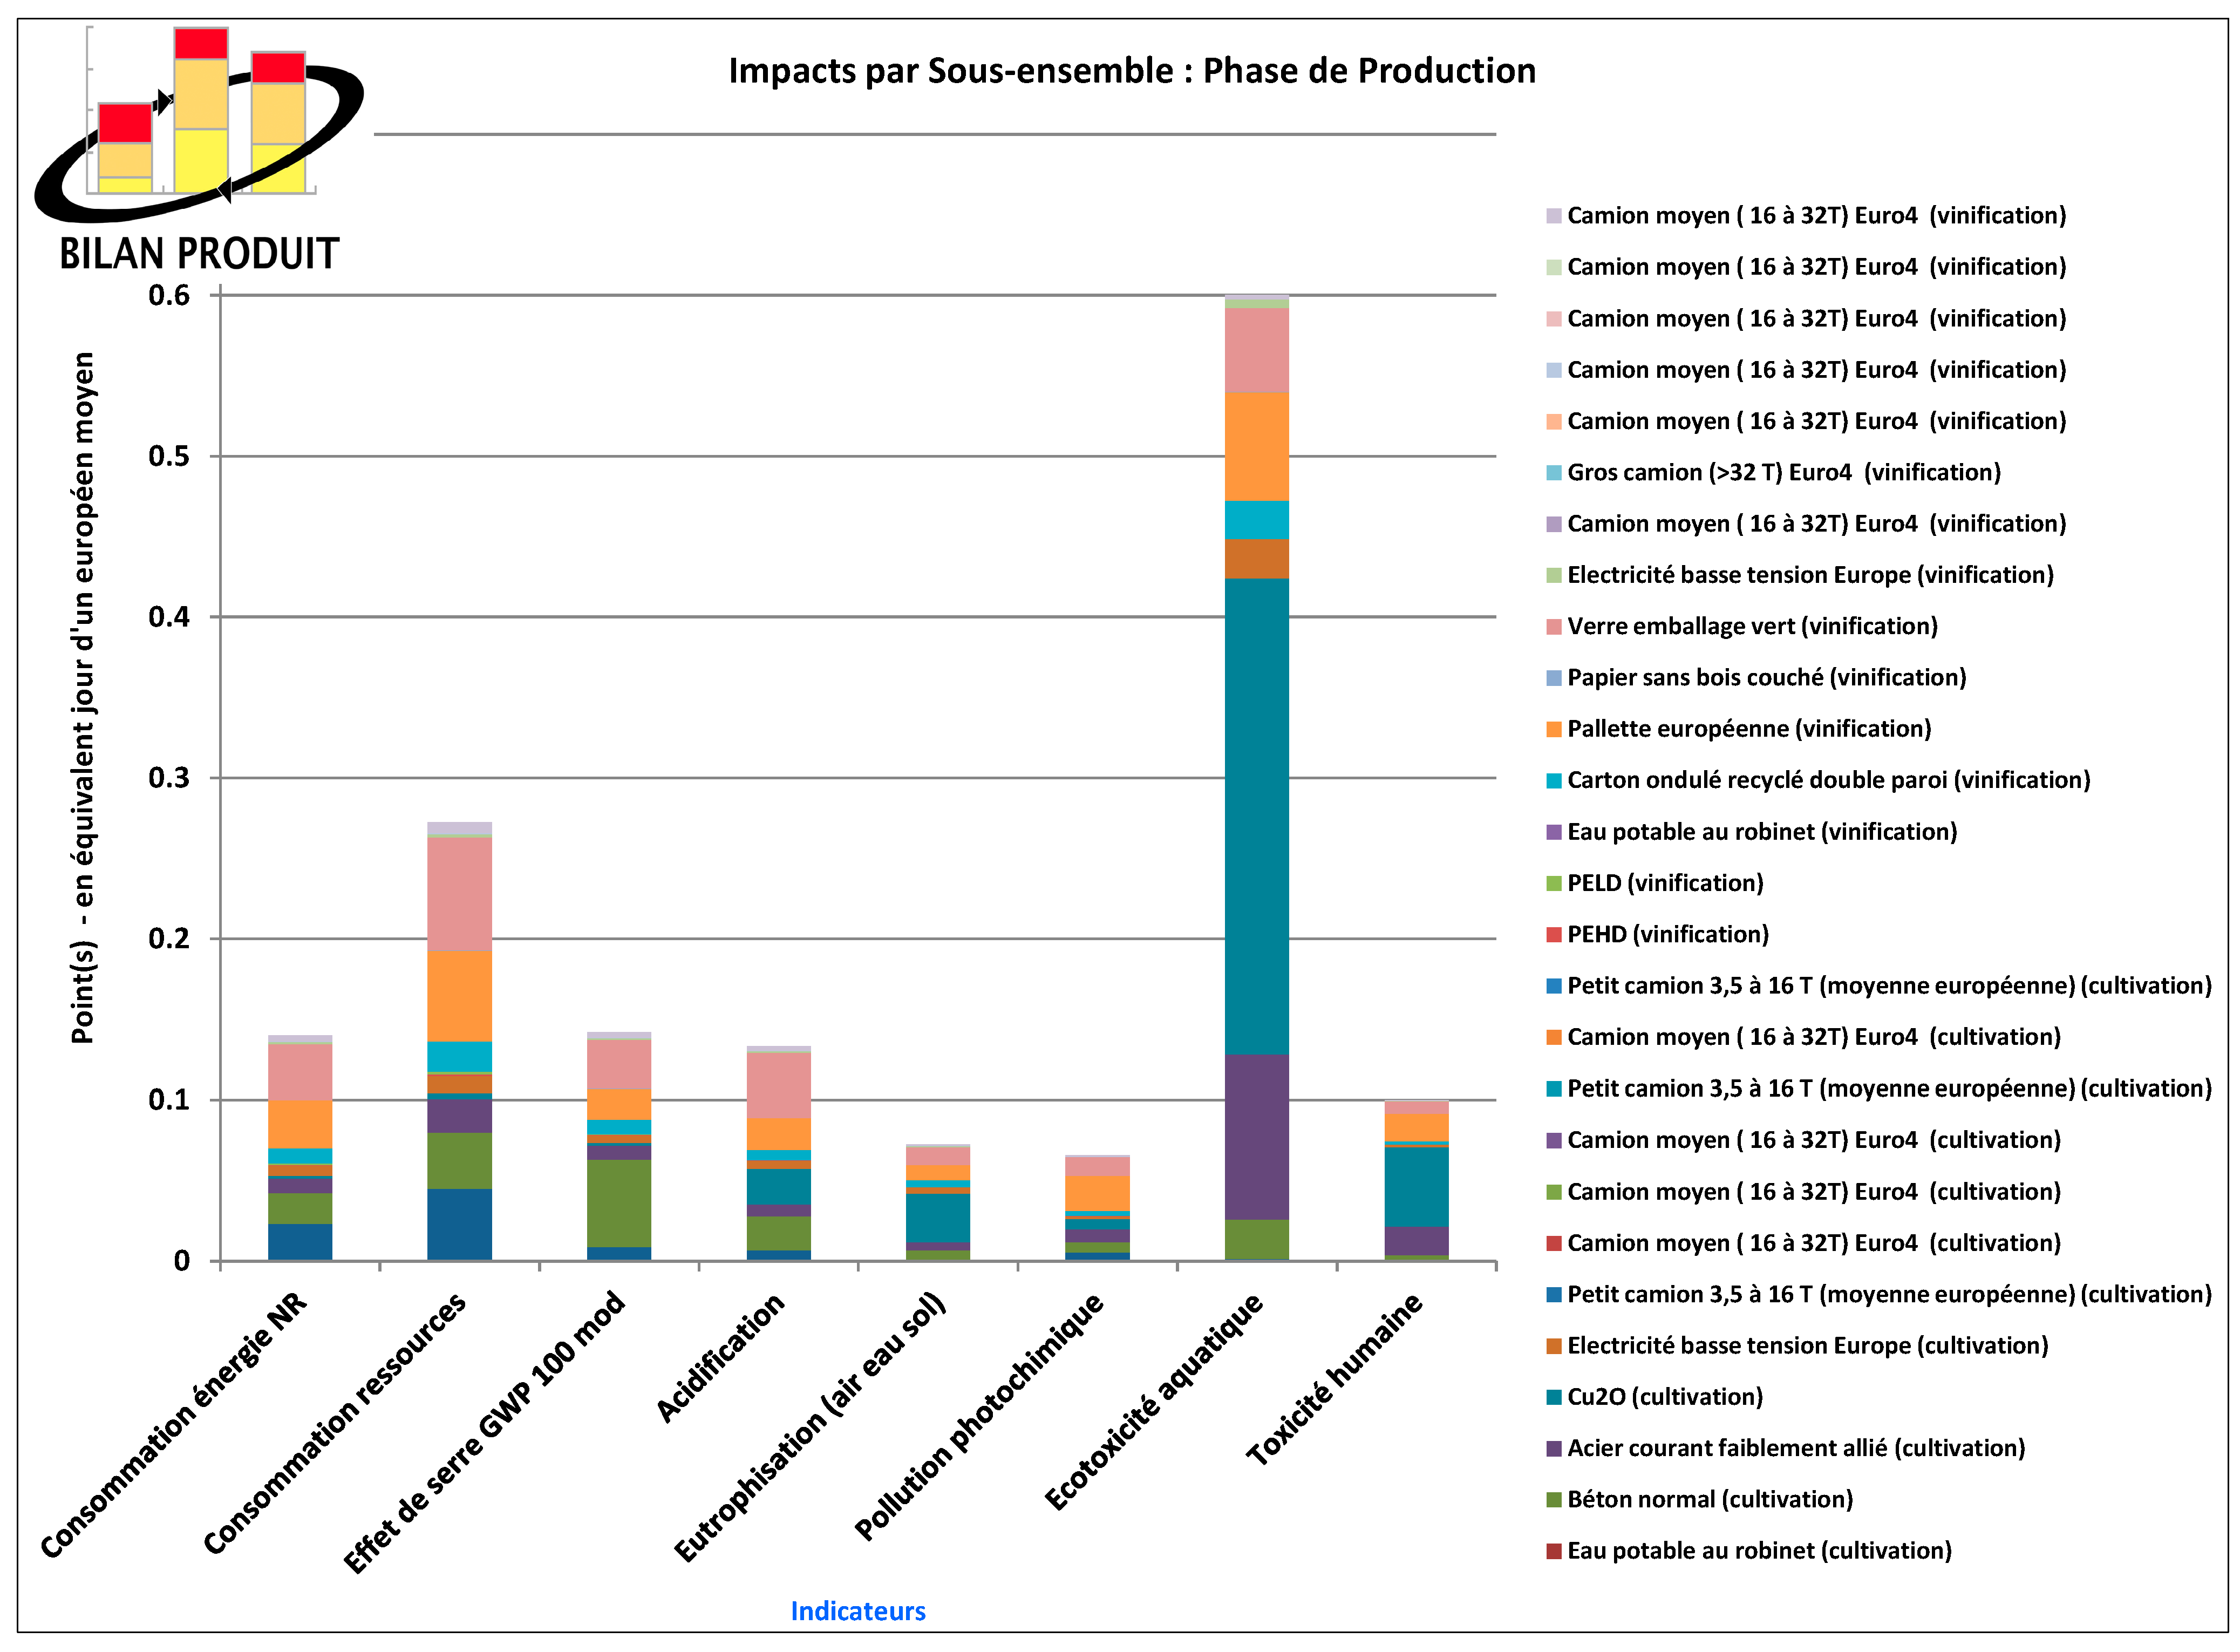
When the user has finished inserting all the data, the tool calculates all the results and produces a table and some graphs. These graphs include the overall life cycle impacts, the ones for the production phase and the ones of the transport phase (since for this study the end-of-life phase was excluded). These last two graphs can be quite useful in order to have a clear idea of which process contributed most per impact category (see
Figure 1).
For this study, the production phase (that includes both agriculture and vinification) is the most influencing one for all the environmental impact categories. The category that is most affected appears to be the aquatic ecotoxicity by far, followed by the consumption of resources. For both cases, what appears to have the most influence is the transport of raw materials.
Figure 1.
Results per impact assessment and process for the phase of production (source: BilanProduit).
Figure 1.
Results per impact assessment and process for the phase of production (source: BilanProduit).
4. Carbonostics
Carbonostics [
6] is a simplified LCA tool, the simplification of which is mainly related to the phase of Life Cycle Impact Assessment (LCIA). This is due to the fact that it mainly focuses on one impact category, namely Global Warming. In this mainly food-specific tool, each data record can be identified with a production method, time and geographical region, and is associated with CO
2-eq emissions, cost and nutritional value [
2]. As climate change and water scarcity are two issues that have been raised by several stakeholders, the use of such a reduced set of indicators appears to be quite appropriate, mainly in terms of communicability to the final users. Nevertheless, it should be noted that focusing on a single environmental impact may result in neglecting any shifting of impacts from one category to another and thus in not promoting the improvement of the overall environmental performance [
7]. This tool is not fully ISO-compliant, but it is PAS2050- and BPX- compliant, user-friendly and includes the possibility to extract the necessary data in order for it to be directly inserted into Environmental Product Declaration (EPD) reports [
2].
4.1. Goal and Scope Definition
Within the first page, the tool gives the opportunity to insert various necessary data, such as mass and volume of the “food ingredients” and the costs of electricity and disposal. As far as the “mass of food ingredients” is concerned, this is defined as the sum of the mass of all the raw material ingredients that are a part of the finished product, which is not necessarily the weight of the final packaged product [
6]. The tool does not require a formal FU definition: however, it attributes all calculations to the aforementioned “mass of food ingredients”. The system boundary cannot be defined here either, but the LCI that follows is structured in a way to allow for this (see
Section 4.2).
Finally, regarding allocation, this was performed in the same way as described in
Section 2 for the eVerdEE tool.
4.2. Life Cycle Inventory
Within the page of LCI the users get to see an overview of the data that was inserted initially (e.g., mass, volume, etc.) and then a list of five different categories/phases, where the inventory data is inserted directly online: ingredients, packaging, processing, shipping and consumer. Similar to BilanProduit and eVerdEE, the Carbonostics tool comes with an incorporated database. As soon as an entry is selected, the user can view a set of information about it, including the data source and e-link. Then, it is possible to include for the specific process the mass, extra mass for waste, cost and water use, depending on the kind of results to be obtained, and some extra information such as carbon sequestration.
For this study, the ready-made entry “Grapes, wine, average, Europe”—including the production of grapes for winemaking—was selected from the category “ingredients”. This was because not all the necessary processes to describe the agricultural phase were available in the database. As a consequence, the whole grape-growing phase was approximated by the aforementioned entry.
As regards the “packaging” category, all types of packaging are included, from primary to tertiary, along with their transport to the firm. In the “processing”, the energy consumption during the agricultural phase was not inserted, as this was included in the process of grapes production, as described above. Finally, the distance travelled was calculated as the weighted average of the distance of the transported good to the three regions and was inserted in the category of “shipping”, as there was no entry for “quantity” that needed to be shipped.
4.3. Life Cycle Impact Assessment and Interpretation
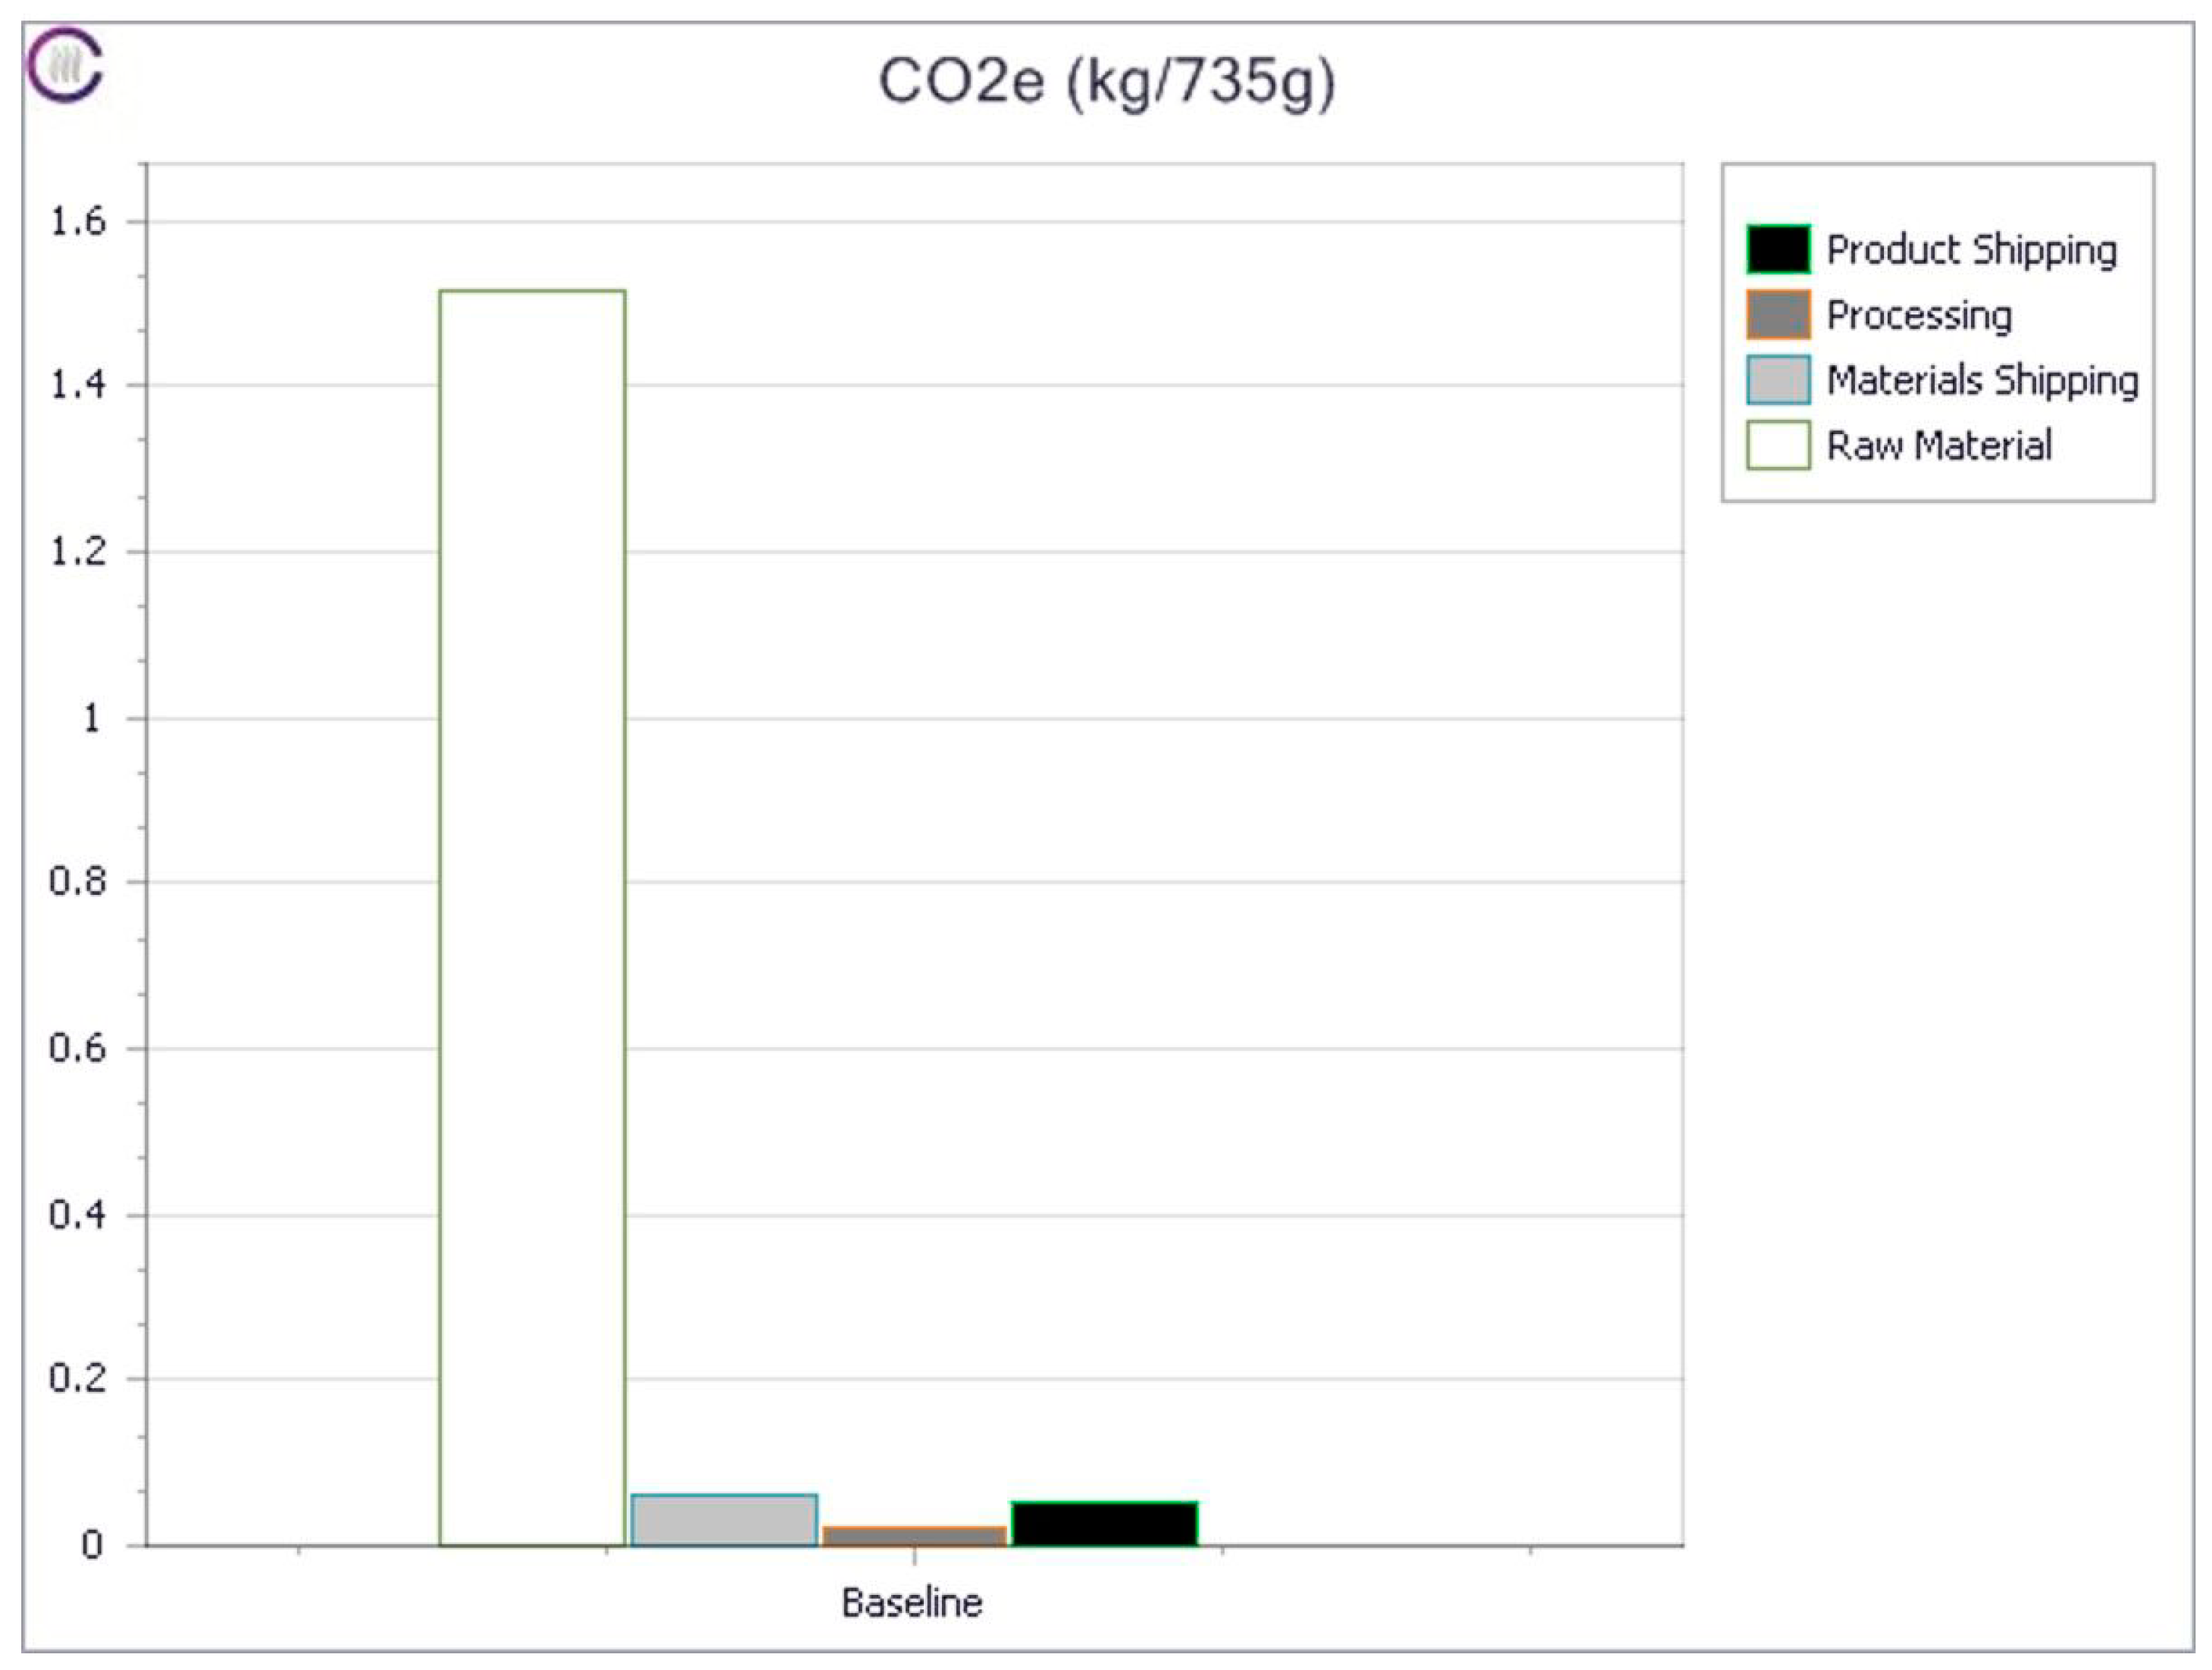
As soon as all data are inserted, the Carbonostics tool calculates the results and produces tables, graphs, and a cost-carbon-nutritional (CCN) values graph. As this tool focuses only on climate change, the graphic results produced by it mainly represent the CO
2-eq emissions per phase of the product’s life cycle. As can be seen from
Figure 2, the “raw material” phase, which corresponds to the agricultural phase, is the one mostly responsible for the carbon dioxide emissions, rather than the shipping of the product or the materials. It should be noted here that apparently the packaging is included in the raw materials. The “processing” phase (that corresponds to the electricity consumed during the vinification phase) seems to be the less impacting one.
Figure 2.
Quantity of CO2eq per phase of the life cycle of the product (adapted from: Carbonostics).
Figure 2.
Quantity of CO2eq per phase of the life cycle of the product (adapted from: Carbonostics).
5. CCaLC
CCaLC [
8] is a simplified tool the simplification of which, as in the case of Carbonostics, is mainly related to the phase of Life Cycle Impact Assessment (LCIA), as it is advertised to focus mainly on one environmental impact category, namely climate change. However, the user can actually obtain results for some other impact categories, as well: water footprint, acidification, eutrophication, ozone depletion, photochemical smog and human toxicity [
9]. The tool is a Microsoft Excel file, available online and can be downloaded after registration. At the moment, an executable version of the software is under development that will render it more flexible and faster to use [
9]. The file contains an incorporated database, but also provides the possibility to use a part of the EcoInvent database reaching overall more than 6000 items. CCaLC was designed specifically for businesses and developed in collaboration with them [
8,
9]. Finally, this tool is underpinned by internationally accepted methodologies, such as ISO 14044 and PAS 2050 [
8,
9].
5.1. Goal and Scope Definition
Upon opening the file, the flow chart where the inventory data can be directly inserted by the user can be seen on the main page. In order for the details regarding the goal and scope definition to be entered, a specific section has to be accessed through the “enter system details” option. There, the FU, the measurement units the user wishes to use, the data collection date and any other comments can be included. There is no specific entry for the goal of the study, but it can be entered in the “comments” section, if desired.
As in the case of Carbonostics, the system boundary cannot be selected here, but the LCI that follows is structured in a way to allow for this. Finally, allocation was performed in the same way as described for the previous tools.
5.2. Life Cycle Inventory
As mentioned above, the tool comes with a generic schematic representation of a product’s life cycle, which includes raw materials, production, storage, use, waste management and transport (that connects all of these entries to each other). By clicking on the various entries, the user can insert the data directly in the file and has two options for every entry: to use either the CCaLC database or the EcoInvent one. For this study, most of the data was selected from the incorporated database (in order to test the robustness of the tool). Only two entries were inserted from the EcoInvent database, namely the compost (used in the agricultural phase) and the paper (used for the label—in packaging—in the vinification phase).
For the “raw materials” entry, the user needs to include the raw materials used for this product. Afterwards, the “production” is divided into several sub-stages that are connected by possible transport stages. In this study and within the production, the cultivation of grapes and the vinification were modeled, connected by the necessary transport from the field to the wine-making premises. On the other hand, in the “raw materials” phase all the materials used for both the phases along with the packaging ones were inserted with a “link” to the respective phases. This “link” is required by the tool in order to connect the various stages between them. Finally, the land use change was not included since there was no entry for Italy in the available list of countries.
5.3. Life Cycle Impact Assessment and Interpretation
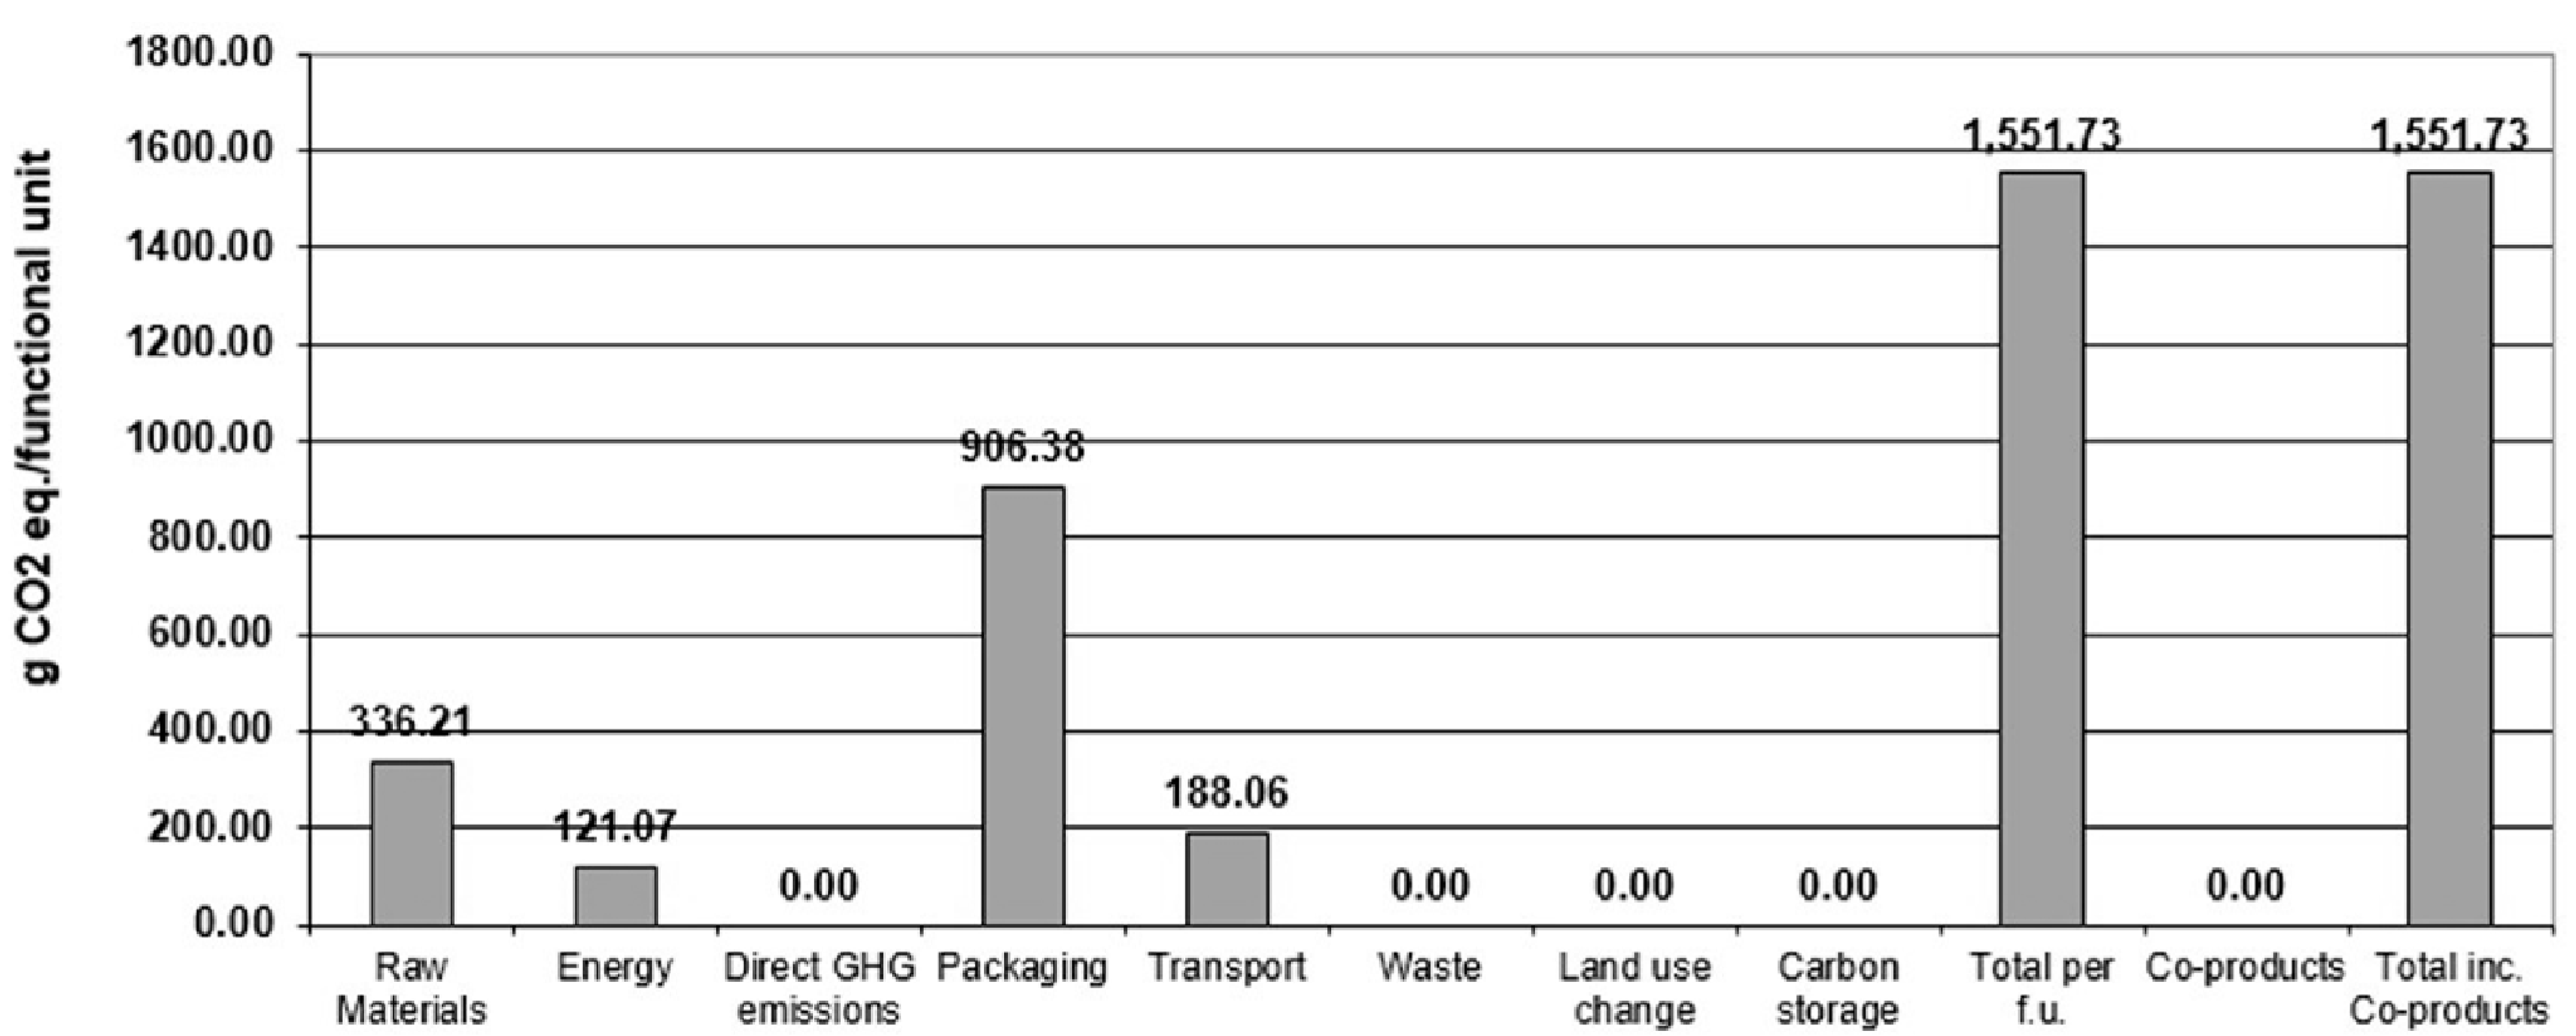
The tool then calculates and produces the graphs not only for the Carbon Footprint (CF) but also for the other aforementioned environmental impact categories. The results are presented as a summary (raw materials, production, storage, use, transport) or in the case of CF as per data category (raw materials, energy, packaging, transport, land use change,
etc.). It can be seen in
Figure 3 that packaging appears to have the highest impact for the climate change category, followed by raw materials and transport. On the other hand, for acidification and eutrophication the stages of transport and raw materials have the highest impact, whilst for human toxicity, ozone layer depletion and photochemical smog, the “raw materials” stage is the dominant one.
Figure 3.
Carbon Footprint by data category (source: CCaLC).
Figure 3.
Carbon Footprint by data category (source: CCaLC).
6. Discussion and Conclusions
As far as the full LCA is concerned (please refer to [
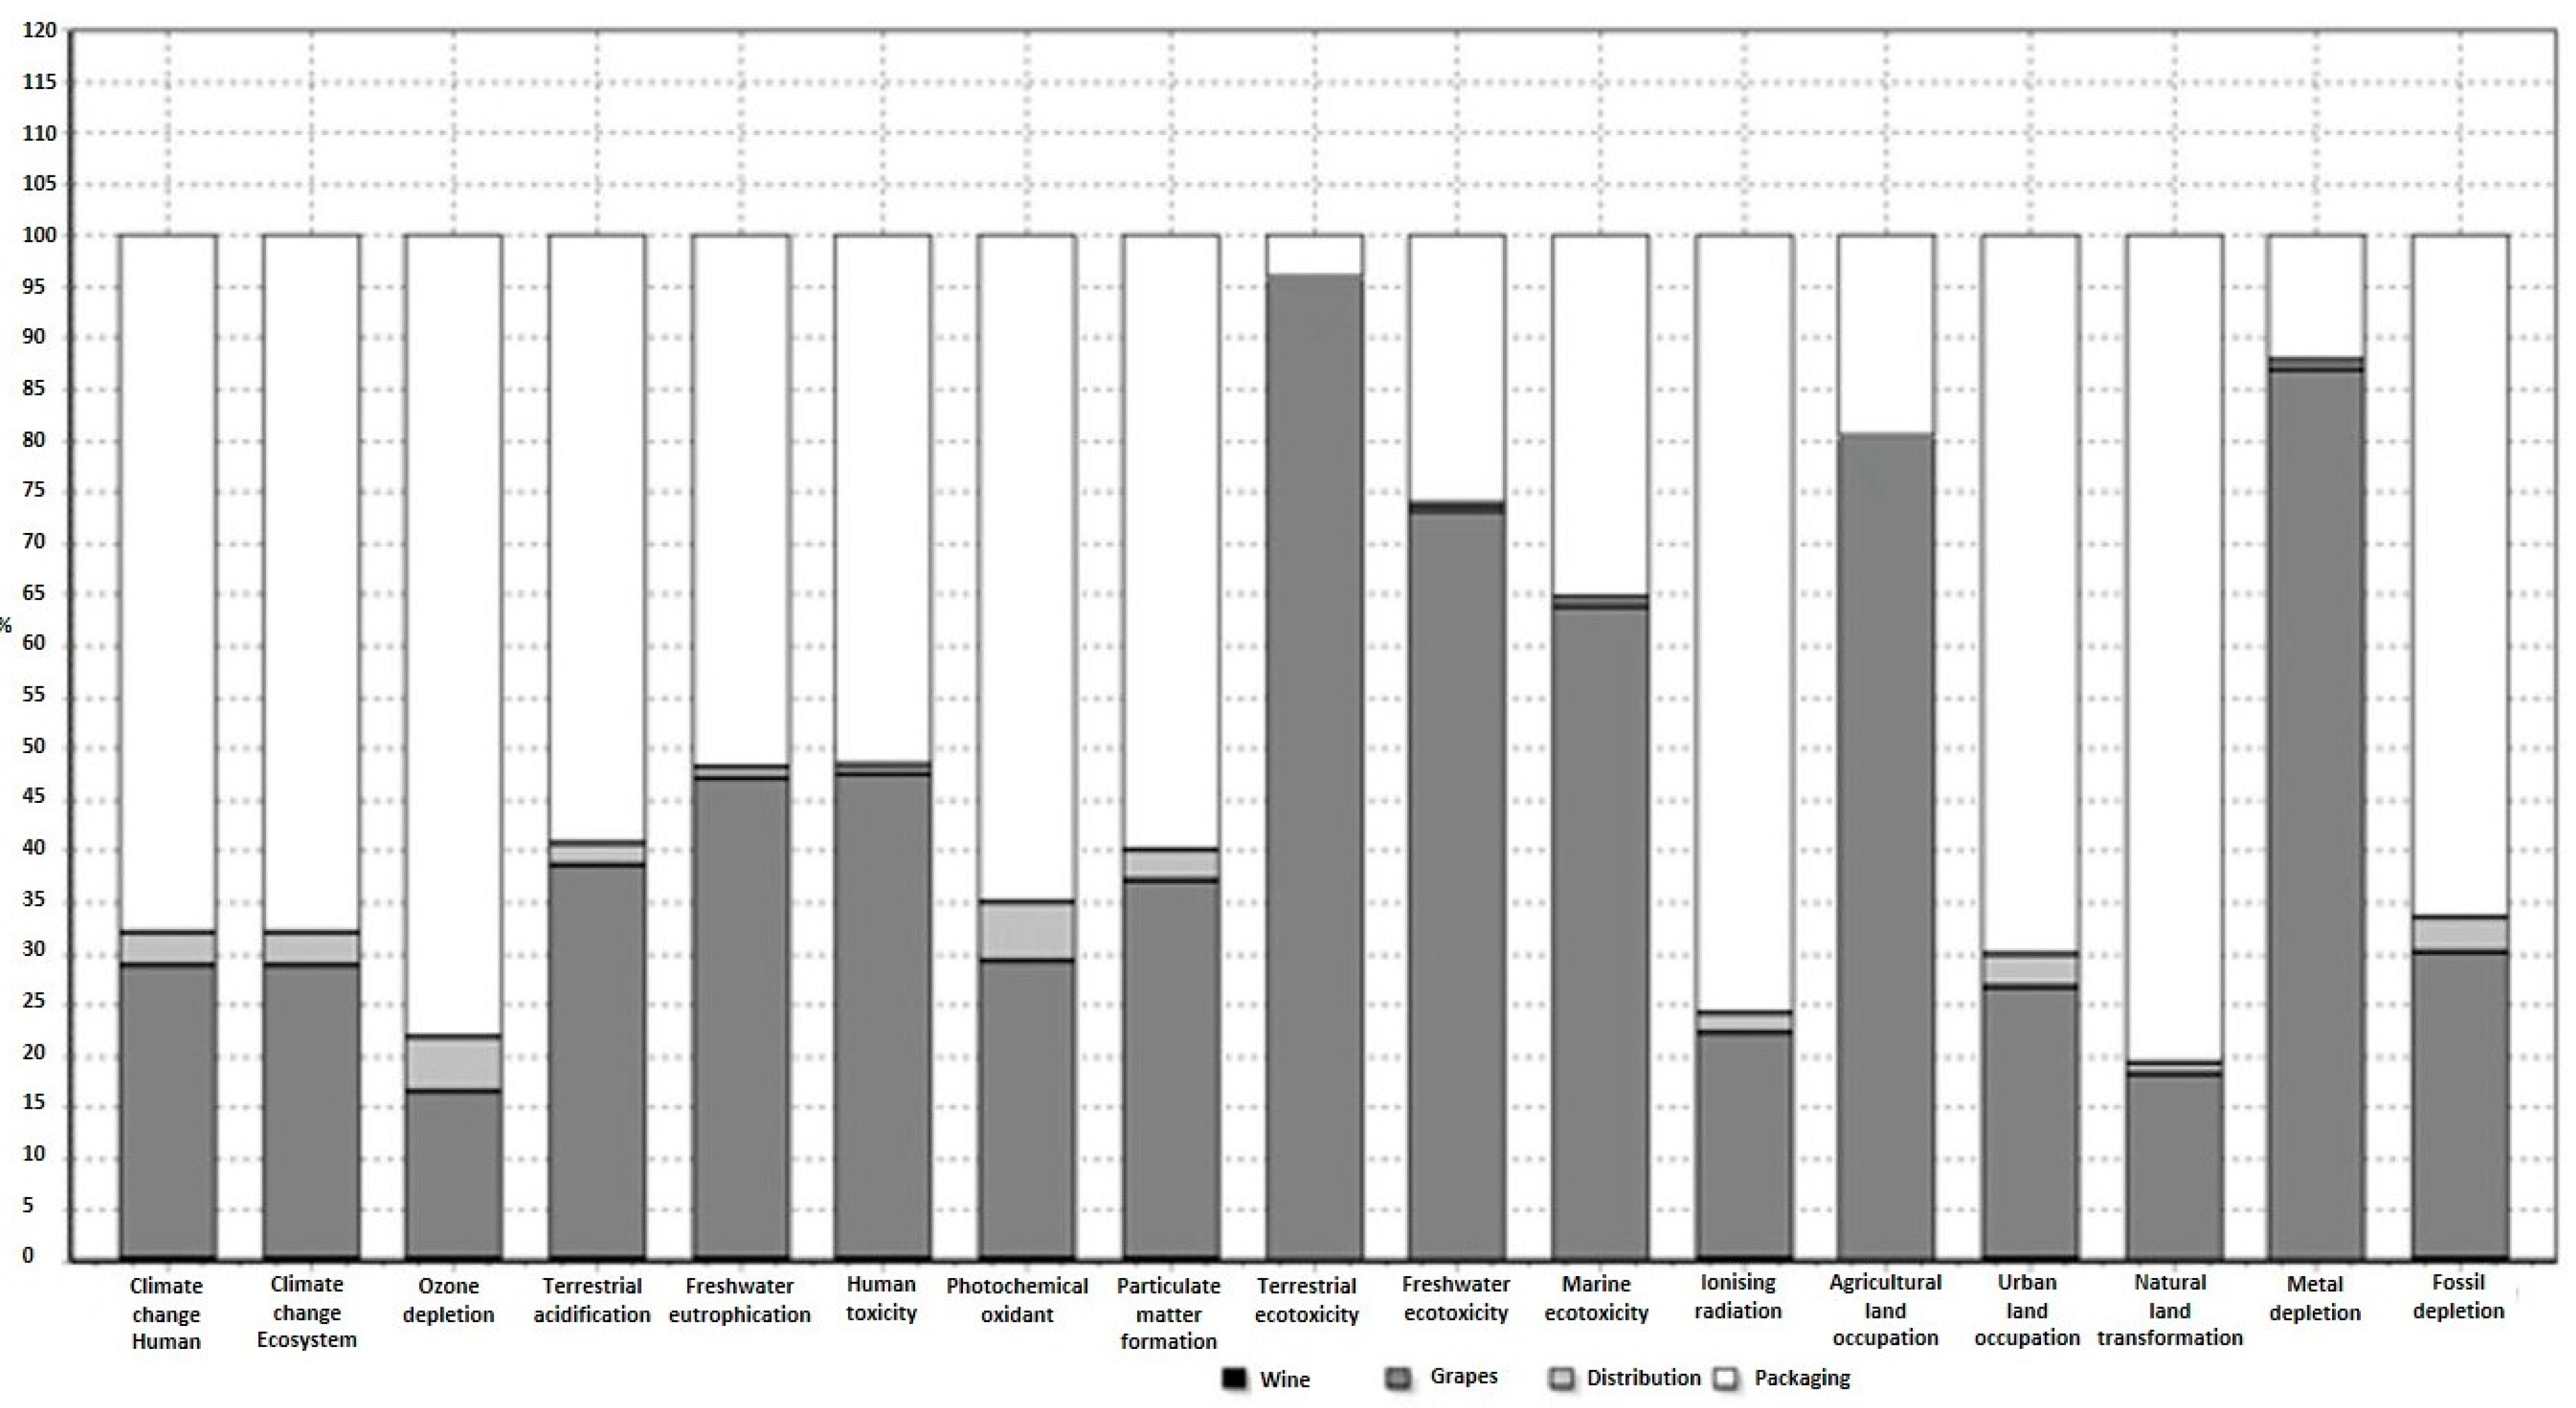
1] for a detailed description), a large variety of environmental impact categories was analyzed using the European ReCiPe Endpoint (H) method. The characterization results (see
Figure 4) demonstrate that the agricultural phase has the most impact for a set of impact categories, such as terrestrial ecotoxicity, metal depletion, agricultural land occupation, freshwater eutrophication, freshwater ecotoxicity and marine ecotoxicity [
1]. The phase of packaging appears to be more responsible for most of the categories such as natural land transformation, ozone depletion, ionizing radiation and, to a lesser degree, for climate change [
1].
Regarding the normalization results, fossil depletion appears to have the highest score, followed by the agricultural land occupation and climate change [
1]. As part of the packaging phase, the use of green glass for the wine bottles was by far the most impacting one for almost all the impact categories [
1].
As a general remark, the view in parallel of different tools that were based on different modeling and impact assessment methods cannot provide scientifically sound comparisons. Nevertheless, this assessment can provide a general idea of how simplified LCA tools work and what can be defined as their strengths and weaknesses for the final user.
From the analysis presented, in general, no safe considerations could be drawn with regard to which phase contributed more, as different stages contributed differently to the various impact categories. This is also because the use of different tools does not allow the same modeling for the case study. As the various phases were created differently and for meeting different needs of the tools, some processes ended up in different phases for each one of the tools under study. For example for eVerdEE, two different analyses were performed and then one of them (agriculture) was inserted in the second one as a component. In the BilanProduit analysis the production phase had to include both the agriculture and the wine making phases. Carbonostics had a ready-made entry for the agricultural phase and CCaLC provided the possibility to model all phases separately.
Furthermore, the fact that in the various incorporated databases there were different processes missing has led to a heterogeneous comparison of the results even for cases where the modeling was similar for two tools. For instance, eVerdEE and CCaLC were similarly modeled, but different processes were missing for each of the related databases, rendering their parallelism quite heterogeneous.
In addition, no conclusions could be drawn with regard to which impact categories were more affected, as not all tools focused on the same ones. For example, Carbonostics focused only on one category (e.g., Global Warming), whilst others focused on more than one. Nevertheless, these categories were not the same ones in every case and the results were not always presented in the same way (e.g., reflecting the phase of characterization or the one of normalization, etc.).
It has to be highlighted, therefore, that the choice of a simplified LCA tool lies within the objectives of a study, and more importantly within the characteristics of the product under study. The modeling of one tool can be, for instance, more suitable for the phases needed for the production of a product (see, for example, the need of modeling of a component for eVerdEE). Finally, the fact that the incorporated database can contain most of the processes that are needed for the study can play a fairly determining role for the selection of the most suitable tool.
Figure 4.
Characterization results—SimaPro (adapted from: [
1]).
Figure 4.
Characterization results—SimaPro (adapted from: [
1]).


