1. Introduction
The key mechanism for the orderly development of a system lies in the coordination of the sub-systems therein: these determine the characteristics of any system transformation. The coordinated development of the system refers to harmonious and consistent development among its sub-systems [
1]. It reflects the process of a system’s development from disorder state to order. As development becomes the theme of the age, local governments make tourism a pillar industry in many regions in China. There is often a blind pursuit of the rapid development of tourism, while fails to deal with the relationships between tourism, the economy, and environment. As a result, regional tourism, the economy, and environment develop in an unbalanced fashion, which goes against the tenets of sustainable development. Regional economy, tourism, and environment constitute an inter-coupled system [
2]. In case of benign coordination of the regional environment, touristic, and economic systems, the circulation of value among the three sub-systems will be mutually beneficial with regards the healthy, sustainable development thereof [
3]. In recent years, with the rapid development of the tourism industry, the relationship between tourism, the regional economy, and its environment has become a research focus. The environment lays the basis for regional tourism, while the development of tourism and regional economic development usually have a destructive impact on the environment. Therefore, how to harmonize development with concern for the environment becomes an important topic. However, before the 1990s, scholars seldom studied the regional environment, tourism, and economy simultaneously in a system. Instead, they mostly investigated the coordinated development of any two of them, such as the coordinated development links between environment and the economy, environment and tourism, or the economy and tourism. Research into the coordinated development of environment and economy started as long ago as the 1920s, and then developed rapidly around the 1980s. Yu
et al. (1984) discussed the restricting mechanism of the environment on economic development, and suggested that proper development can guarantee the coordination between the environment and the economy [
4]; Niu (1988) systematically investigated the interactions between the economy and the environment, and found that technological innovations in economic development are a major driving force behind harmonised development of both the regional economy and its environment [
5]; Costanza, R.
et al. (2008) constructed a simulation model of dynamic interaction of economic and environmental processes to identify some environmental benefits [
6]. The coordination of development between an economy and tourism has drawn research attention since the 1970s: research on this topic witnessed rapid growth in the 1990s. In many nations, tourism was considered as an alternative development strategy for the economic regeneration of rural areas (Hannigan, 1994) [
7]; In Eastern Europe, tourism has been identified as a catalyst to stimulate economic growth (Simpson, Chapman and Mahne, 1998) [
8]; Toh Mun Heng (1993) used input-output methodology to analyze the economic impact of Singapore’s tourist industry and to evaluate its prospects for development [
9]. In China many scholars such as Xu (1993), Bao (1994), Wu (1997)
et al. also studied the coordinated development between their respective regional tourism industries and their economies and analyzed the problems caused by the overly rapid development of regional tourism [
10,
11,
12]. Research into the coordinated development between tourism and the environment exhibited rapid development in 1990s: Dimitrios Buhais (1993) emphasized the importance of maintaining quality and continuously monitoring the impact of tourism on environment, and thought that there was some need for further research on the impact of tourism, refinement of development policies, wider application of the environmental approach, and greater efforts directed toward achieving implementation of environmentally oriented plans [
13]; Peter U.C. Dieke (1993) thought tourist activities would substantially impact on the environment, resulting in “change of land cover and land use”, “use of energy and its impacts”, “exchange of biota and species extinction”, and “dispersion of diseases” [
14]; Hunter, C. (1995) investigated Tourism’s environmental impacts on the natural, and constructed an assessment model [
15]; Wang (1996) and Wang (1999) analyzed some cases of uncoordinated development between tourism and the environment and their impact [
16,
17]; Collins, A (1998) thought tourism-centric development policies were also reasoned to be of inherently limited value in achieving strong sustainability objectives in protection of the environment. However, research into the coordinated development of the sub-systems of environment, tourism, and the economy has only been developed of late.
At present, the coordinated development of ecology-tourism-economy systems is mainly qualitatively researched: little quantitative research exists. Murphy, P.E. (1998, 2004) found that tourism was simultaneously portrayed as a destroyer of environment, undermining social norms and economics, and believed it was the community participation in tourism management that promote the coordinated development of the environment, tourism and economy [
18,
19]. Zhu (2000), and Yan (2002), considered that the regional economy and tourism have to develop in a step with the environment [
20,
21]. They proposed a development strategy, which highlights regional characteristics, efficiency, and environmental protection, for a regional environment-tourism-economy system. Gossling, S.
et al. (2005) analyzed the interplay of environmental damage and economic gains within the context of tourism [
22]. Zhang
et al. (2008) investigated the coordination of tourism, economy, and the environment in Guilin City in China, and concluded that coordination lay at a low-to-medium level [
23]; Li and Wei (2012) put forward countermeasures for the coordinated development of their regional environment, economy and tourism industry from the perspective of the low carbon economy [
24]; Liu and Yang (2011) analysed the mechanics of coordinated development in a regional environment-tourism-economy system [
25]; Zhong and Liu (2012) conducted research into grading the coordinated development of an environment-tourism-economy system in Guangdong Province, China [
26]. Qualitative research fails to describe the harmony among the sub-systems in regional environment-tourism-economy systems, and it cannot reflect the extent to which development is coordinated within the system. Regarding previous quantitative research into the coordinated development of regional environment-tourism-economy systems, the investigation methods adopted were mainly analytic hierarchy processes, fuzzy multiple judgments, order parameter efficacy functions,
etc.; while for determining an indexing system, expert consultation methods and literature search-based methods were most commonly used. Environment-tourism-economy systems, as complex dissipative structures, show, in their development, characteristics of non-linear coupling and consistency. The results obtained using these evaluation models fail to explore the non-linearity of the coordinated development of environment-tourism-economy systems and the temporal variation of the coordinated development thereof. Therefore, they cannot describe the characteristics and governing laws of operation of the system. Additionally, the indices determined using an expert consultation method and a literature survey-based method are incapable of reflecting their contributions to the coordinated development of the system. So doubt remains as to their validity.
The evolutionary characteristics of a system depend on the interactions between its elements and their effects. To move towards an ordered mechanism, the most important thing is neither the balance of the current system, nor the distance of the system from equilibrium. What is most important is the coordination among the sub-systems within the system. Order parameters play a leading role in system development, and whether phase change of system happens or not is determined by the changes of order parameters. Coordination refers to the cooperation, harmony, and virtuous circles extant among multiple systems or their elements. The degree of coordination represents the extent to which systems or their elements are consistent with regards their development. These phenomena show the trend by which a system becomes more orderly. Development differs from growth. Growth refers to the volume expansion of the system, but development refers to the orderly evolution based on the coordination of each part within the system. Sometimes, a reorientation of economic priorities may lead to growth, but it may be always away from growth. So we must enhance human well-being through a more environmentally-friendly way to guarantee the development of environment-economic-society system (Gregory M. Mikkelson, 2013) [
27]. Considering environment-tourism-economy systems as complex, and large, based on system theory and coordination theory, we can further analyze the factors influencing the orderly evolution of the system, and discover the underlying problems influencing that orderly evolution, then construct a reasonable coordination mechanism for the promotion of orderly development of the regional environment-tourism-economy system. Research on dynamic coordinated development of the system must probe into the order changes of order parameter during the evolution of the system. To study the dynamic coordinated development of regional environment-tourism-economy, we should analyze the order changes of environment benefit index, tourism benefit index and economy benefit index which are determined by interactions among environmental sub-system, tourism sub-system and economic sub-system, and analyze the changes of coordinated development determined by regional interactions of sub-systems of environment, tourism, and economy and the benefit index of them.
As an undeveloped region, western Hunan contains a mix of minorities with an imbalanced development of its economy, society, and environment. The region is rich in tourism resources, which is not only an important domestic tourism destination of China, but also is becoming an international tourism destination. The rapid development of tourism damages the environment. Meanwhile, owing to the backward state of its economy, there is no basis upon which the development of tourism can be supported. All these result from many problems with the sustainable development of regional tourism and these are pressing issues for the coordinated development of the environment-tourism-economy system of western Hunan. Therefore, on the basis of previous research, this study firstly constructed an evaluation index system based on regional coordinated development theory, system theory, and the PSR conceptual framework. The evaluation index system was determined according to the accumulative contribution rate by rotating factor loading using principal component analysis. With a related evaluation model, it quantitatively investigated the coordinated development of the environment-tourism-economy system in western Hunan, explored the dynamic evolution of the system and revealed the internal mechanism of the coordinated development of the environment, tourism, and the economy. It purported to promote a profound recognition of the problems arising from the development of the environment, tourism, and the economy and in doing so proposed favorable countermeasures.
3. Results and Analysis
3.1. Basic Conditions of the Research Region
Western Hunan in this research refers to the western region of Hunan Province in a geographical sense, including Zhangjiajie City, Huaihua City and Xiangxi Autonomous Prefecture. This region borders Guizhou Province and Chongqing City to the west. To the north, it is bordered by Hubei Province. To the south, it is connected with Guangxi Autonomous Region. To the east, it borders Changde City, Yiyang City, Loudi City and Shaoyang City in Hunan Province. The area covers longitude 108°47′ E to 111°20′ E and latitude 25°52′ N to 29°48′ N. It contains 23 counties or county-level cities and has an area of 52,578 km2. The total population is 8,898,900, with 167 persons per km2. Topographically, the region is mainly mountainous or hilly: it is in a transition zone and has a sub-tropical humid monsoon climate which endows this region with four distinct seasons, a mild climate, concentrated rainfall, and rich solar and thermal resources. The average temperature lies between 16 °C to 18 °C. The average temperatures in January and July are 4.9 °C and 28.1 °C respectively. T average annual precipitation is 1300–1700 mm. This region has a dense river network and rich river-water resources. However, the volume of river water undergoes significant seasonal changes, with spring and summer being the rainy season and autumn and winter being the dry season. According to general classification system of vegetation, the system of forest ecosystem in the Xiangxi area mainly consists of warm evergreen coniferous forest, deciduous broadleaf forest, evergreen and deciduous broad-leaved mixed forest, evergreen broad-leaved forest, evergreen sclerophyllous broad-leaved forest, warm shrubs, evergreen leather leaf brush and herbaceous swamp. The soils are mainly red yellow, yellow and yellow brown soils in deep strata, with 4.5 ≤ pH ≤ 5.5. The parent rocks are mainly sandstones and shales. The soils are distributed vertically, with coverage between 700 and 1000 m altitude comprising mountainous yellow soil, 700 to 1200 m with yellow soil, and yellow brown soils above 1200 m. The region is diverse with regard to its tourism resources. According to the classification method of tourism resources in the Classification, Investigation and Evaluation of Tourism Resources, edited by The Chinese Academy of Sciences and National Tourism Administration, there are 121 types of tourism resources in the region, accounting for 78.5% of the fundamental types of tourism resources in China. Additionally, the region is rich in tourism resources, of which, geological and folk tourism are the most famous. The Wulingyuan Geological Park, which is on World Natural Heritage and World Geopark lists, and three national geological parks (Fenghuang Mountain, Wulong Mountain, and Guzhanghong Stone Forest) are located in the region. Moreover, there are 46 national minorities living in the region. They are characterized by their distinct lifestyles, diet, dress, artisanal handicraft production, marriage rites, family customs, villages, festivals, burial rites, religion, etc.
Although being less developed economically, this region experiences rapid economic growth. Its GDP reached ¥149,525 million (CNY) in 2011, an increase of 12.8% from 2010. The primary, secondary, and tertiary industries grew by 3.7%, 13.2% and 13.1% respectively. The three sectors were (proportionally) 15.1:39.5:45.4; in 2012, the GDP reached ¥173,778 million, an increase of 16.22% from that in 2011; the primary, secondary and tertiary industry sectors grew by 3.9%, 11.1% and 12.3% respectively. The sectors were (proportionally) 14.9:39.1:46.0. Tourism in this region witnessed rapid redevelopment; in 2011, western Hunan received 44,517,000 tourists and earned tourism revenue worth ¥34,016 million (increases of 19.16% and 21.31% over 2010 figures respectively). In 2012, these increased to 54,801,000 tourists and ¥42,622 million respectively (increases of 18.04% and 24.74% respectively). Regarding the region, tourists mainly come from China, inbound tourists account for a small proportion of total visitor numbers (this is because the rapid economic development of China itself draws an increasing number of tourists). While the number of inbound tourists saw a rapid increase: in 2002, the number of inbound tourists was 357,300, while it grew to 1,259,000 in 2007 and 2,978,700 by 2012. The inbound tourists mainly came from South Korea, Japan, etc.
3.2. Results and Analysis
Using the aforementioned method, the data for western Hunan during the years 2001 to 2012 were used to calculate
f(
x),
g(
y),
h(
z),
B,
C, and
D for the environment-tourism-economy system, as shown in
Table 3,
Table 4,
Table 5,
Table 6,
Figure 2,
Figure 3,
Figure 4 and
Figure 5.
Table 3.
The benefit index, coupling degree and coordinated development level of the environment, tourism and economy system in western Hunan during 2001–2012.
Table 3.
The benefit index, coupling degree and coordinated development level of the environment, tourism and economy system in western Hunan during 2001–2012.
| Index | 2001 | 2002 | 2003 | 2004 | 2005 | 2006 | 2007 | 2008 | 2009 | 2010 | 2011 | 2012 |
|---|
| f(x) | 0.5712 | 0.6163 | 0.6204 | 0.6261 | 0.6545 | 0.6775 | 0.6779 | 0.6786 | 0.6787 | 0.6789 | 0.7152 | 0.7634 |
| g(y) | 0.3903 | 0.5115 | 0.1714 | 0.5131 | 0.6162 | 0.6831 | 0.3745 | 0.3721 | 0.3815 | 0.7074 | 0.7586 | 0.8043 |
| h(z) | 0.1515 | 0.2087 | 0.1321 | 0.2031 | 0.2558 | 0.3797 | 0.2675 | 0.2574 | 0.3217 | 0.3897 | 0.4489 | 0.4831 |
| B | 0.0838 | 0.1697 | 0.0124 | 0.1490 | 0.2310 | 0.5323 | 0.2572 | 0.2323 | 0.3827 | 0.5384 | 0.6264 | 0.6409 |
| C | 0.3617 | 0.4323 | 0.3353 | 0.4343 | 0.4874 | 0.5595 | 0.4530 | 0.4488 | 0.4763 | 0.5689 | 0.6174 | 0.6595 |
| D | 0.1754 | 0.2709 | 0.0645 | 0.2543 | 0.3355 | 0.5458 | 0.3414 | 0.3329 | 0.4269 | 0.5534 | 0.6219 | 0.6501 |
Table 4.
The benefit index, coupling degree and coordinated development level of the environment, tourism and economy system in Zhangjiajie City during 2001–2012.
Table 4.
The benefit index, coupling degree and coordinated development level of the environment, tourism and economy system in Zhangjiajie City during 2001–2012.
| Index | 2001 | 2002 | 2003 | 2004 | 2005 | 2006 | 2007 | 2008 | 2009 | 2010 | 2011 | 2012 |
|---|
| f(x) | 0.6152 | 0.6534 | 0.6478 | 0.6514 | 0.6657 | 0.6817 | 0.6862 | 0.6872 | 0.6374 | 0.6841 | 0.7601 | 0.7851 |
| g(y) | 0.5162 | 0.6016 | 0.1974 | 0.5813 | 0.7132 | 0.7635 | 0.4204 | 0.4103 | 0.4153 | 0.8154 | 0.8914 | 0.9123 |
| h(z) | 0.3561 | 0.4021 | 0.1563 | 0.3561 | 0.4147 | 0.4561 | 0.3107 | 0.3065 | 0.3152 | 0.4825 | 0.5132 | 0.5212 |
| B | 0.6374 | 0.6806 | 0.0240 | 0.5596 | 0.6117 | 0.6571 | 0.3782 | 0.3598 | 0.4648 | 0.3828 | 0.6286 | 0.6182 |
| C | 0.4918 | 0.5425 | 0.3611 | 0.5193 | 0.5748 | 0.6078 | 0.4828 | 0.4796 | 0.4841 | 0.6337 | 0.6876 | 0.7050 |
| D | 0.5599 | 0.6077 | 0.0931 | 0.5391 | 0.5930 | 0.6320 | 0.4601 | 0.4154 | 0.4305 | 0.6461 | 0.6574 | 0.6602 |
Table 5.
The benefit index, coupling degree and coordinated development level of the environment, tourism and economy system in Xiangxi Autonomous Prefecture during 2001–2012.
Table 5.
The benefit index, coupling degree and coordinated development level of the environment, tourism and economy system in Xiangxi Autonomous Prefecture during 2001–2012.
| Index | 2001 | 2002 | 2003 | 2004 | 2005 | 2006 | 2007 | 2008 | 2009 | 2010 | 2011 | 2012 |
|---|
| f(x) | 0.5412 | 0.5963 | 0.5834 | 0.5961 | 0.6245 | 0.6605 | 0.6611 | 0.6616 | 0.6653 | 0.6789 | 0.6952 | 0.7132 |
| g(y) | 0.3103 | 0.4515 | 0.1314 | 0.4131 | 0.4862 | 0.5631 | 0.3445 | 0.3221 | 0.3415 | 0.5974 | 0.6486 | 0.7313 |
| h(z) | 0.1315 | 0.1687 | 0.1121 | 0.1931 | 0.2658 | 0.3597 | 0.1875 | 0.1658 | 0.1897 | 0.2997 | 0.3689 | 0.4561 |
| B | 0.0612 | 0.0988 | 0.0048 | 0.1625 | 0.3401 | 0.5682 | 0.0979 | 0.0661 | 0.0987 | 0.3474 | 0.5104 | 0.6704 |
| C | 0.3311 | 0.3963 | 0.3044 | 0.3983 | 0.4534 | 0.5207 | 0.4083 | 0.3954 | 0.4110 | 0.5109 | 0.5554 | 0.6140 |
| D | 0.1423 | 0.1979 | 0.0382 | 0.2544 | 0.3927 | 0.5439 | 0.1999 | 0.1554 | 0.2014 | 0.4212 | 0.5324 | 0.6416 |
Table 6.
The benefit index, coupling degree and coordinated development level of the environment, tourism and economy system in Huaihua City during 2001–2012.
Table 6.
The benefit index, coupling degree and coordinated development level of the environment, tourism and economy system in Huaihua City during 2001–2012.
| Index | 2001 | 2002 | 2003 | 2004 | 2005 | 2006 | 2007 | 2008 | 2009 | 2010 | 2011 | 2012 |
|---|
| f(x) | 0.6241 | 0.6675 | 0.6467 | 0.6637 | 0.7098 | 0.7514 | 0.7541 | 0.7576 | 0.7597 | 0.7689 | 0.7952 | 0.8161 |
| g(y) | 0.1563 | 0.1675 | 0.1134 | 0.2791 | 0.3932 | 0.6631 | 0.3645 | 0.3421 | 0.3605 | 0.6742 | 0.7086 | 0.7574 |
| h(z) | 0.1875 | 0.2187 | 0.1521 | 0.2136 | 0.2858 | 0.3997 | 0.3452 | 0.3358 | 0.3437 | 0.4197 | 0.4589 | 0.4893 |
| B | 0.0261 | 0.0323 | 0.0396 | 0.1084 | 0.2703 | 0.5333 | 0.2964 | 0.2507 | 0.2826 | 0.5624 | 0.6203 | 0.6484 |
| C | 0.3559 | 0.3879 | 0.3422 | 0.4067 | 0.4769 | 0.5931 | 0.5115 | 0.5058 | 0.5135 | 0.6103 | 0.6434 | 0.6736 |
| D | 0.0964 | 0.11191 | 0.0365 | 0.2098 | 0.3590 | 0.5624 | 0.3894 | 0.3561 | 0.3809 | 0.5859 | 0.6317 | 0.6608 |
Figure 1.
The region of Western Hunan of Hunan Province.
Figure 1.
The region of Western Hunan of Hunan Province.
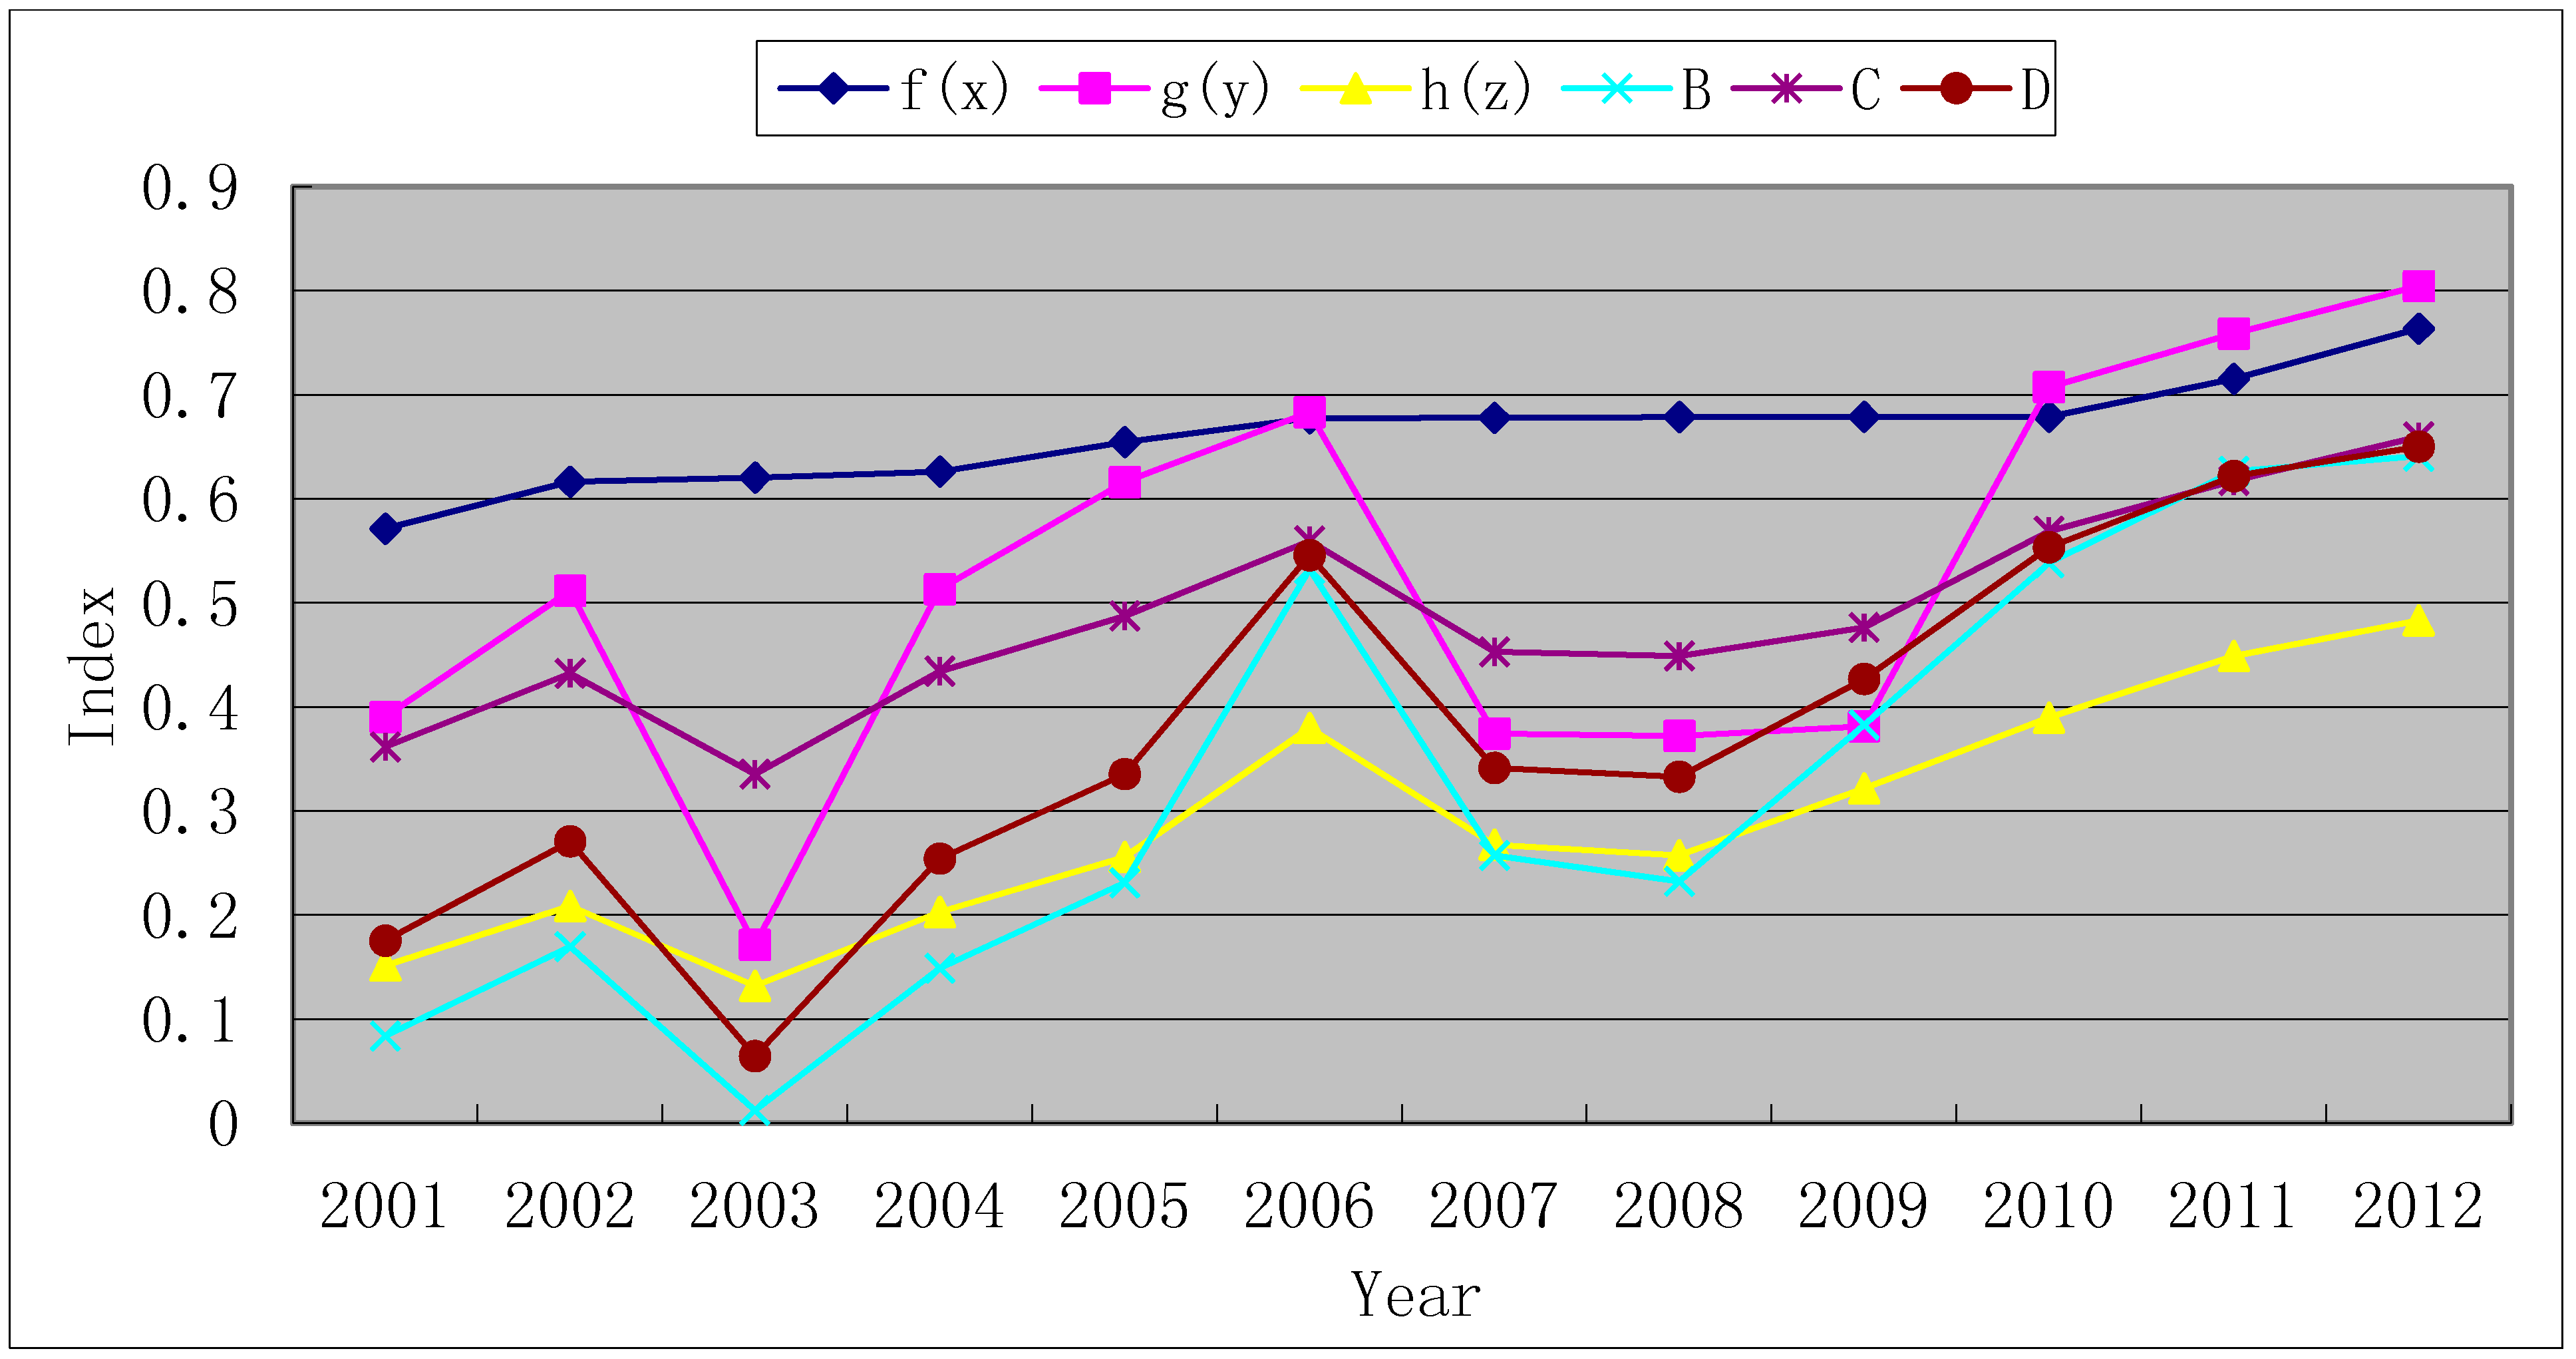
Figure 2.
The change of the benefit index, coupling degree and coordinated development level of the environment, tourism and economy system in western Hunan during 2001–2012.
Figure 2.
The change of the benefit index, coupling degree and coordinated development level of the environment, tourism and economy system in western Hunan during 2001–2012.
Figure 3.
The change of the benefit index, coupling degree and coordinated development level of the environment, tourism and economy system in Zhangjiajie City during 2001–2012.
Figure 3.
The change of the benefit index, coupling degree and coordinated development level of the environment, tourism and economy system in Zhangjiajie City during 2001–2012.
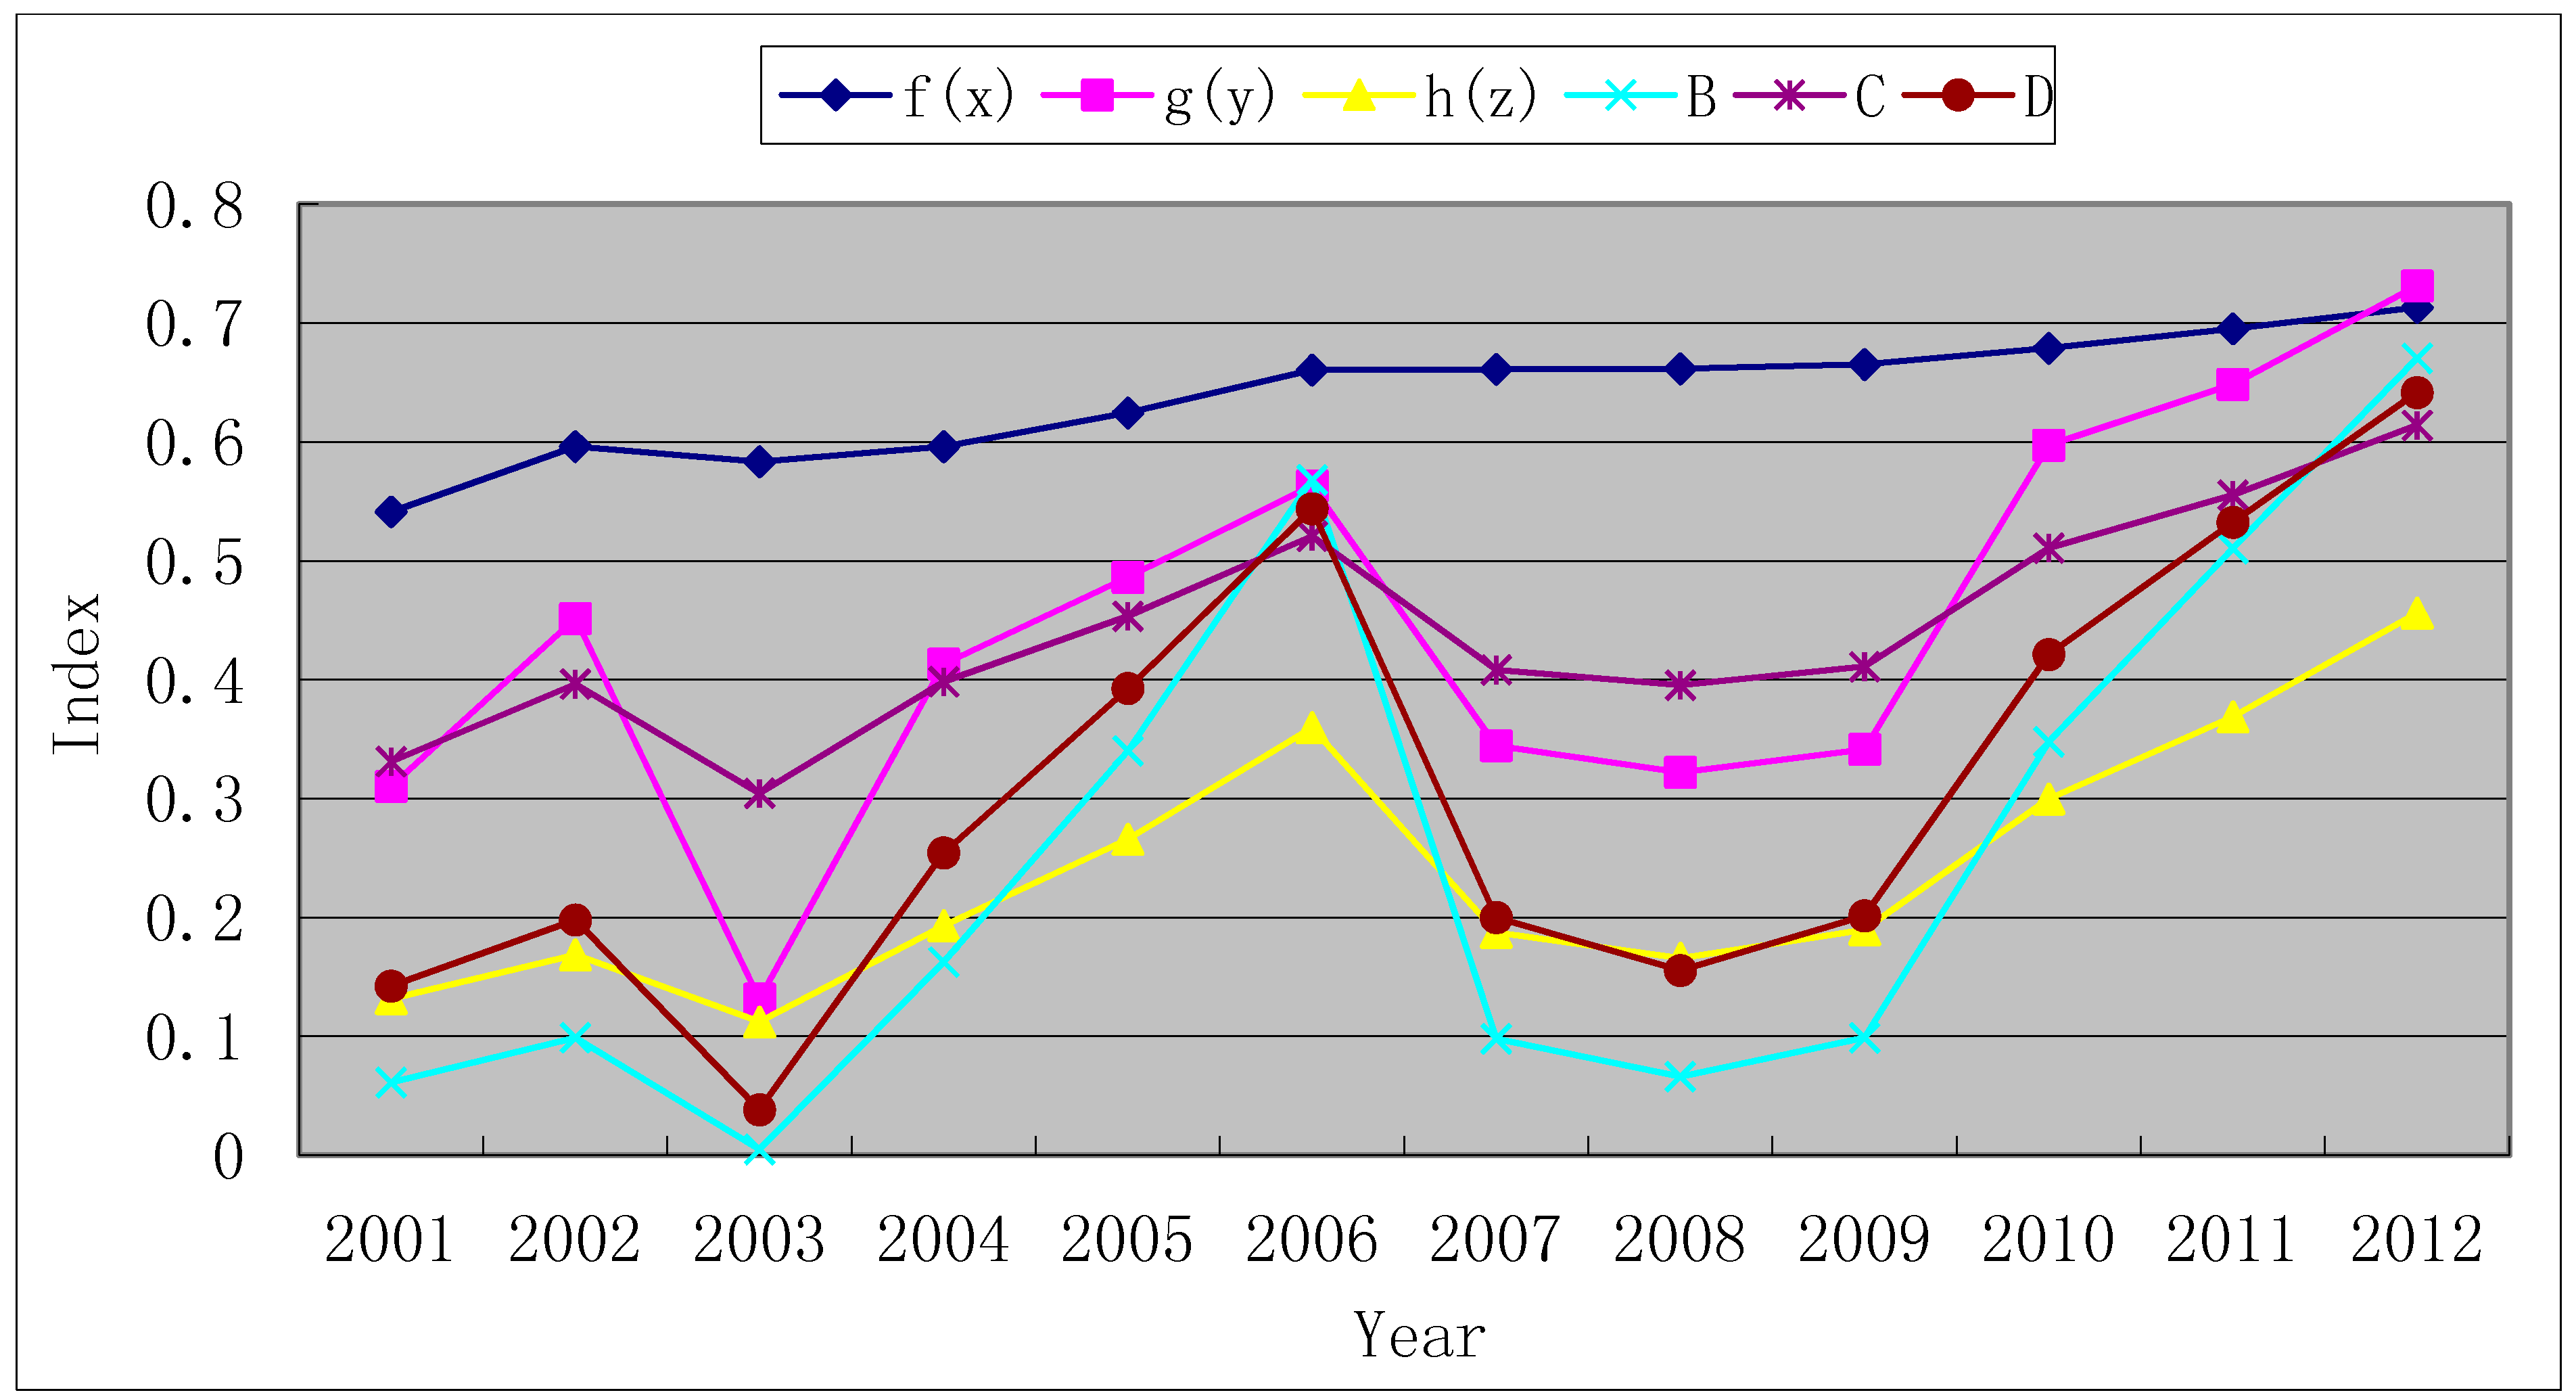
Figure 4.
The change of the benefit index, coupling degree and coordinated development level of the environment, tourism and economy system in Xiangxi Autonomous Prefecture during 2001–2012.
Figure 4.
The change of the benefit index, coupling degree and coordinated development level of the environment, tourism and economy system in Xiangxi Autonomous Prefecture during 2001–2012.
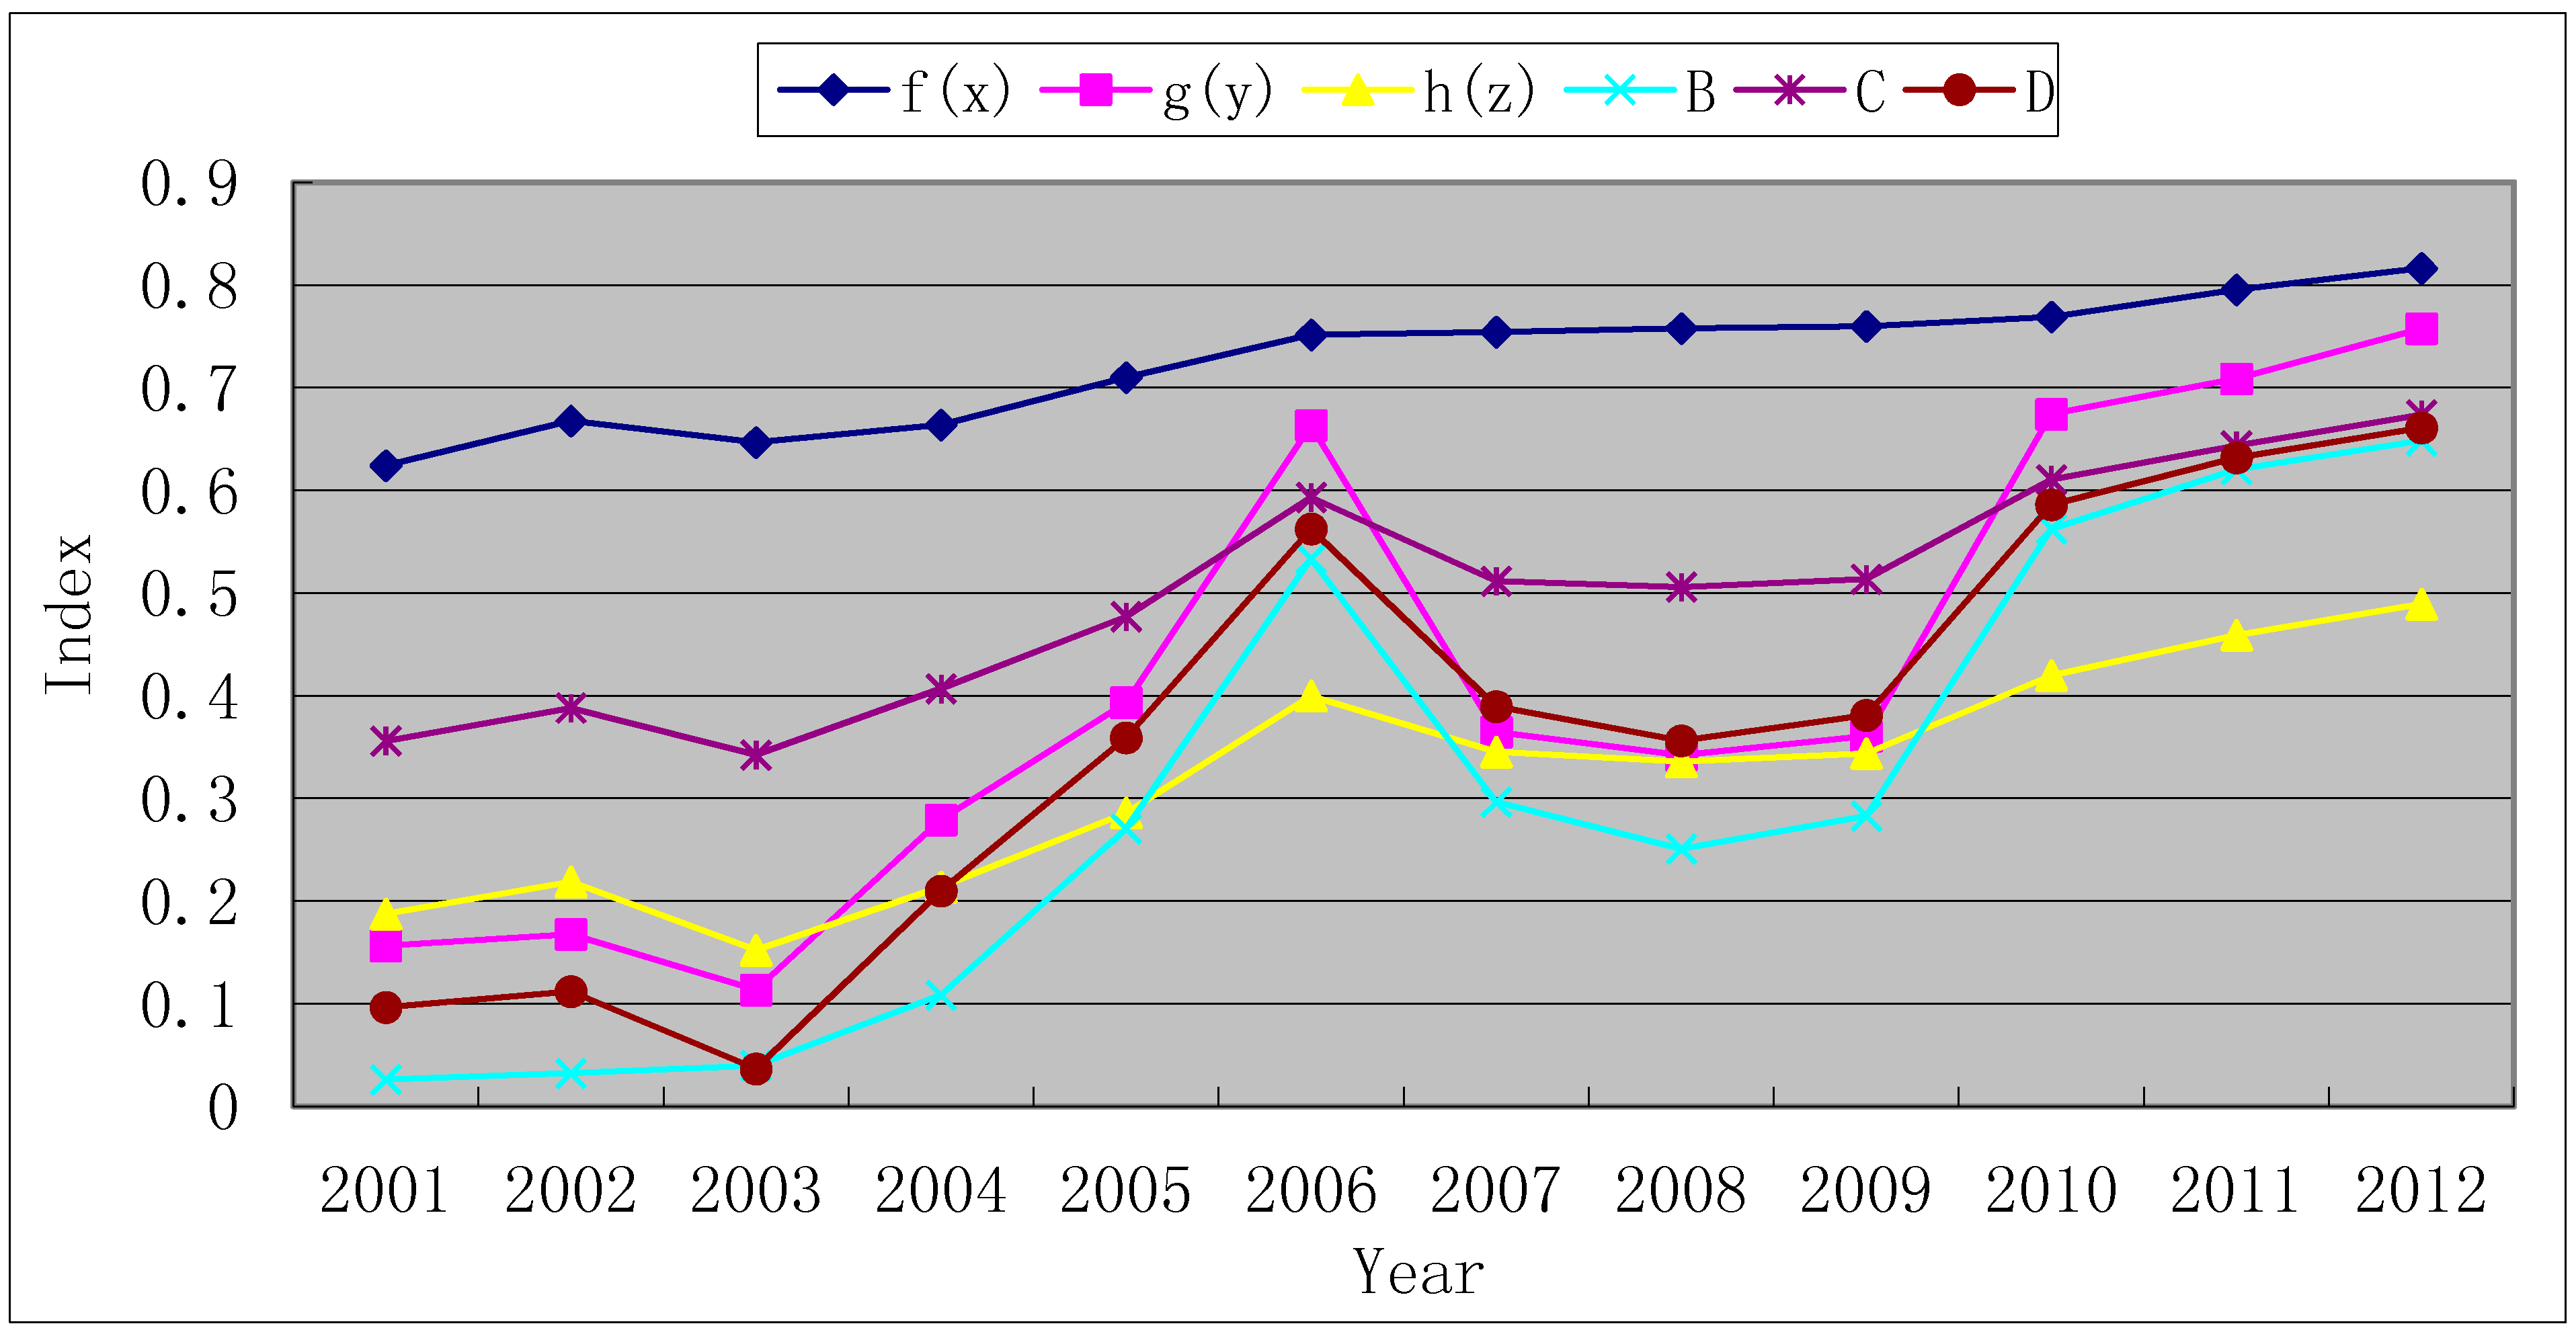
Figure 5.
The change of the benefit index, coupling degree and coordinated development level of the environment, tourism and economy system in Huaihua City during 2001–2012.
Figure 5.
The change of the benefit index, coupling degree and coordinated development level of the environment, tourism and economy system in Huaihua City during 2001–2012.
3.2.1. Benefit Changes in the Environment, the Tourism Sector and the Economy
As shown in
Table 3,
Table 4,
Table 5,
Table 6,
Figure 2,
Figure 3,
Figure 4 and
Figure 5, the environment, tourism, and the economy in western Hunan all benefitted from 2001 to 2012. In particular, the tourism benefit index
g(
y), economic benefit index
h(
z), and comprehensive benefit index
C of the environment-tourism-economy system grew rapidly from 0.3903, 0.1515, and 0.3617 in 2012 to 0.8043, 0.4831, and 0.6595 in 2012 respectively. Of the benefit indices in western Hunan including
f(
x),
g(
y) and
h(
z), the environment benefit index remained relatively high with a slow growth trend. It was 0.5712 in 2001 and 0.7634 in 2012, with an increase rate of only 2.80% over those 12 years. This result suggested that, compared with economy and tourism, the foundation of environmental development in this region is better. However, due to difficulties in improving the process, the effect was less than may be otherwise supposed. The tourism benefit index saw the fastest growth, with an average increase of 8.84% over the 12 years. This was caused by the constant economic, social, and cultural development tin China and abroad, as well as sustained investment in the tourism resources, the tourism market, and the continuous improvement in the tourism environment in the region in recent years. The
g(
y),
h(
z),
C for western Hunan showed certain variations. The curves of the three indices present two obvious lows during the 12 years. In 2003,
g(
y),
h(
z) and
C decreased by 66.49%, 36.07% and 24.01% from those in 2002. In 2004, they returned to their 2002 levels. In 2007,
g(
y),
h(
z) and
C decreased by 45.18%, 29.55% and 18.87% from the previous year. In 2008 and 2009, they continued to decrease. In 2010, they rebounded to their 2006 levels. However, in the two lows in the development of
g(
y),
h(
z) and
C, the environmental benefit showed slight growth. This result suggested that the tourism and economy in this region were fragile to some extent. The prevalence of “SARS” in 2003 and the global financial crisis which started in 2007 affected both tourism and economic development in this region. On the other hand, it has been shown that tourism and economic development are important factors influencing the development of the environment. Therefore, when tourism and the economy develop slowly or even shrink, the environment may actually improve. Of course, this result also verified the importance of the role of the self-organizing characteristics of the environment with its natural ability to self-maintain.
On the whole, the development of
f(
x),
g(
y),
h(
z) and
C in the three cities in western Hunan were consistent with the overall situation indicated above. However, as shown in
Table 3,
Table 4,
Table 5,
Table 6,
Figure 2,
Figure 3,
Figure 4 and
Figure 5, they were unbalanced in different cities: Huaihua City had the highest environmental benefit, while Zhangjiajie City exhibited both high tourism and economic benefits. But the growth rate of tourism and economic benefits is slow in Zhangjiajie City, and the average annual growth rate of them were only 0.698%, 4.21% respectively during 2001–2012, which indicated that the development advantages based on tourism industry were becoming weak gradually. In addition, Huaihua witnessed the fastest tourism benefit growth. In 2001, the tourism benefit index of Huaihua was 0.1563, which was only 30.29% and 50.37% of that of Zhangjiajie City and Xiangxi Prefecture respectively. However, in 2006, it jumped to 0.6631. This value was significantly higher than that of Xiangxi Prefecture and 85.85% of that of Zhangjiajie City. On the one hand, western Hunan attached great importance to the integration of its regional tourism development in recent years, especially to the integration of tourism resource systems and tourism market systems. Therefore, tourism in Huaihua City, with slightly poorer tourism resources, was driven by tourism in Xiangxi Prefecture and Zhangjiajie City. The tourism development pattern of western Hunan changed gradually. On the other hand, with transportation improvements in Huaihua City in recent years, the geographical location advantages of Huaihua City, namely, linking western and eastern regions, became increasingly prominent. Comparatively, the importance to traffic of the location of Xiangxi Prefecture in south-western China was weakened to some extent relative to that of Huaihua. Therefore, the tourism development superiority of Huaihua City was highlighted. As for the two lows in the development of
g(
y),
h(
z) and
C, Zhangjiajie suffered the most, followed by Xiangxi Prefecture. This suggested that tourism and the economy of Zhangjiajie were the most vulnerable. This was because the economic income of Zhangjiajie was mainly derived from tourism. Since tourism in Zhangjiajie has been preferentially developed both in China and abroad, the economy and tourism in Zhangjiajie depend on external development conditions to a large extent. So, any crisis pertaining to the development of tourism in China and abroad causes the economy of Zhangjiajie to be disproportionately affected. In contrast, tourists travelling to Xiangxi and Huaihua mainly come from the surrounding provinces; the international tourism markets of the two regions have not been effectively developed. Therefore, the two regions are less restricted by large-scale tourism development factors in China and abroad. In addition, compared with the other two cities, Huaihua has established relatively complete industry clusters. Tourism revenue is only a small part of its income. Therefore, this city had the least economic vulnerability and two shallow lows in its development of
g(
y),
h(
z) and
C.
3.2.2. Analysis of the Coupling Pattern of the Environment, Tourism and Economy
The coupling degree
B expresses the degree of balance in the interactions of the factors in a system, and the nearer
B(
t) approaches 1, the more balanced the interaction in these sub-systems. As shown in
Table 3,
Table 4,
Table 5,
Table 6,
Figure 2,
Figure 3,
Figure 4 and
Figure 5, in western Hunan the coupling degree of the sub-system of environment, tourism and economy is not high, and the
B value of which varied from 0.0838 to 0.5384 during 2001–2010. This was mainly due to the lagging development of its tourism and economy, especially the under-developed economic subsystem in this area had greatly restricted the coupling development of the environment- tourism- economy system. In 2001, the economy benefit index and tourism benefit index of western Hunan were 0.0838 and 0.3903% respectively, which were only 26.52% and 63.33% of its environment benefit index. Then, with the development of economy and tourism, the coupling degree
B of the environment-tourism-economy system in western Hunan increased gradually. While in 2007, the world economic crisis brought serious impact on the development of tourism and economy in this area, especially in 2008, the economy benefit index and tourism benefit index reduced from 0.3797 and 0.6831 in 2006 to 0.3745 and 0.2574. This situation did not get better until 2009. This outcome proved that the interactions of the three sub-systems in western Hunan were unbalanced because of lagging development of its tourism and economy from 2001 to 2010. The environment played the dominant role in the development of the environment-tourism-economy system. However, western Hunan saw a rapid expansion of tourism and economic order parameters and an increase of the extent of coupling of the three sub-systems in the same period. In 2010, the regional government adjusted their economic and tourism development policies and formulated more favorable industrial cluster development policies. Moreover, it strengthened the development of eco-tourism. Compared with the extensive development before, the government of western Hunan focuses on the protection of the ecological environment in tourism development at present, for example, restricting the number of tourists in some main scenic spots, using environmentally friendly cars in most of scenic areas to reduce tourism traffic emission, and strengthening environmental education for the community and tourists. But all of these were ignored in this region before. Therefore, the coupling degree of the three sub-systems increased to 0.6409 in 2012. Meanwhile, after 2010, the role of the environment gradually declined in the development of the environment-tourism-economy system in this region, while the dominant role of tourism was highlighted. Additionally, the coupling degree variations of the three sub-systems in these three cities in western Hunan also varied. From 2001 to 2012, Zhangjiajie presented the highest
B value overall, while having lowest rate of increase and the largest variations. In 2011,
B reached 0.6374, which was the highest of the three cities. However, in 2012, it decreased to be the lowest value of the three cities. Especially in the “SARS” year (2003), the
B value was only 0.024. This result implied that economic development had become a bottleneck restricting the development of the environment in Zhangjiajie; The
B value for Huaihua increased most rapidly. In 2001, it was only 0.0261. By 2012, it had increased to 0.6484 at an average annual rate of increase of 5.19%.
3.2.3. Analysis about the Coordinated Development Pattern
As suggested by
Table 7,
Figure 2,
Figure 3,
Figure 4 and
Figure 5, the environment-tourism-economy system of western Hunan was almost uncoordinated from 2001 to 2009. In 2001, the coordination degree
D of this system was only 0.1754, which proved the uncoordinated state of this system. Especially in 2003, when
D was only 0.0645, a highly uncoordinated state prevailed. This result implied that the “SARS” effect exerted a serious impact on the system. Under such an impact, the system almost collapsed; from 2005 to 2009, the
D value of this system varied between 0.3 and 0.5, implying that the three sub-systems (environment, tourism, and economy) were mutually antagonistic. In 2010, the environment-tourism-economy system of western Hunan showed a barely coordinated state and rapid improvement thereafter. In 2012, the
D value increased to 0.6501, implying a primary coordination state. This outcome revealed that the order parameter adjustment of the environment-tourism-economy system of western Hunan showed favorable positive effects after several years of development. The sub-systems therein were developing towards a state of correct proportional importance and mutual synergistic growth. Through the flows of investment, effort, and information flow, continuous promotion of the improvement of the environment-tourism-economy system was achieved.
Table 7.
The coordinated development of the environment-tourism-economy system of western Hunan from 2001 to 2012.
Table 7.
The coordinated development of the environment-tourism-economy system of western Hunan from 2001 to 2012.
| Year | Coordinated Development Degree D | Coordination State | Year | Coordinated Development Degree D | Coordination State |
|---|
| 2001 | 0.1754 | Serious imbalance | 2007 | 0.3414 | Slight imbalance |
| 2002 | 0.2709 | Moderate imbalance | 2008 | 0.3329 | Slight imbalance |
| 2003 | 0.0645 | High imbalance | 2009 | 0.4269 | Approaching imbalance |
| 2004 | 0.2543 | Moderate imbalance | 2010 | 0.5534 | Bare coordination |
| 2005 | 0.3355 | Slight imbalance | 2011 | 0.6219 | Primary coordination |
| 2006 | 0.5458 | Bare coordination | 2012 | 0.6501 | Primary coordination |
However, the coordinated development of the environment-tourism-economy system of western Hunan still faces great challenges. As shown in
Table 3,
Table 4,
Table 5,
Table 6,
Figure 2,
Figure 3,
Figure 4 and
Figure 5, it can be seen from the benefit indices
f(
x),
g(
y), and
h(
z) of this region from 2001 to 2012 that, although the three indices presented increasing trends on the whole, these increases were not synchronized. The economic benefit index lagged the environment index. Moreover, its growth was slower than that of the tourism benefit index. Lagging economic development will restrict environmental and touristic development; In contrast, the tourism benefits index grew too rapidly. In 2012, the tourism index
g(
y) of western Hunan was 0.8043, which exceeded the index
f(
x) (environment benefit). In particular,
g(
y) for Zhangjiajie was as high as 0.9123, which was far higher than the values of
f(
x) and
h(
z). The rapid and advanced tourism development in this city brought pressure to bear upon the environmental and economic foundations. In case of a failure to effectively control tourism development and alter the original extensive tourism development mode in Zhangjiajie, the environment-tourism-economy system in this city will become disordered once more. The environment-tourism-economy systems in the three cities in western Hunan also present unbalanced coordinated development. On the whole, the environment-tourism-economy system of Zhangjiajie exhibited the best coordinated development foundation albeit with the slowest development. In 2001, Zhangjiajie entered a primary coordination state with a
D value of 0.5599. However, after 12 years’ development, it was still in a primary coordination state with a
D value of 0.6602 in 2012 (increasing by an annual average rate of 0.84%). The environment-tourism-economy system of Huaihua showed the poorest coordinated development foundation albeit with the fastest development. In 2001, the
D value of Huaihua was 0.0964. In 2012, it had increased to 0.6608 at an average annual growth rate of 4.70%. This
D value was the highest of the three cities chosen.
4. Conclusions and Suggestions
An environment-tourism-economy system is a complex system with continuous material, energy and information exchanges and perplexing interactive effects between its sub-systems [
39]. Due to the development degree differences in the sub-systems, the coupling degrees therein varied over time. Therefore, the coordinated development of an environment-tourism-economy system was subjected to a complicated evolution process. The coordinated development model has certain advantages in evaluating the environment-tourism-economy system, and it can explore the non-linearity of the coordinated development of environment-tourism-economy systems. By quantitatively describing the degree of coordination between sub-systems, it can reflect the development degree and the state of the system, as well as the characteristics of the system operation, which can help us to forecast the developing trend of regional environment-tourism-economy system, and propose scientific measures to improve the system. Based on the PSR conceptual model, the evaluation index system for the regional environment-tourism-economy system was determined by principal component analysis, which ensures that the evaluation indices were both valid and representative. It was revealed that the coordination degree
D of the environment-tourism-economy system varied within the range [0–0.5] during 2001–2009 in western Hunan, that is to say, the environment-tourism-economy system in western Hunan had been in an uncoordinated state from 2001 to 2009 based on the coordinated development model. However, the system presented a rapidly increasing trend. The coordination degree
D was more than 0.6 in 2011. It revealed that the order parameter adjustment to the environment-tourism-economy system of western Hunan showed favorable positive effects after several years of development, suggesting a transition in the system from disordered development to orderly development. The coordinated development of the environment-tourism-economy system in western Hunan was affected by many factors such as the economic crisis, illness, tourism development policy and economic development policy,
etc., and the strength that these factors affected the ecological environment subsystems, tourism subsystems, and economic subsystems was not the same in different time, so the coordinated development of the environment-tourism-economy system in western Hunan had non-linear characteristics. The coordinated development was unbalanced in different cities in western Hunan. The environment-tourism-economy system of Zhangjiajie exhibited the best coordinated development foundation albeit with the slowest development speed. During 2001–2012,
D value of its average growth rate was only 0.84%, while in Huaihua City it was 4.70%, which is the highest among the three cities in western Hunan. The economic benefit index ranged from 0.1321 to 0.4831, and the long-term under-developed economy of western Hunan has become the main factor restricting the coordinated development of the environment-economy system of western Hunan; although it has been provided with favorable foundations, the environment in this region has developed slowly. Moreover, in case of a failure to control the rapid development of tourism, this region may re-enter its previous uncoordinated development phase. That is to say, the environment becomes the main factor restricting tourism and economic development in the region. Regardless of the rapid development, tourism industry in this region had the characteristics of fluctuation. In 2003 and 2008, the economic benefit index dropped to 0.1714 and 0.3721 respectively, which showed considerable vulnerability of tourism industry in western Hunan. This was consistent with the actual situation of the environment-tourism-economy system in western Hunan and thus proved the applicability of the evaluation method in reflecting objective facts.
To promote the coordinated development of the environment-tourism-economy system in western Hunan, the following recommendations were proposed: (1) Strengthening the investigation of the forecasting and early-warning of the evolution of the environment-tourism-economy system and more deeply revealing the relationships between its sub-systems; scientifically and reasonably regulating the development process of this system by exploring the evolution mechanism and evolution laws. (2) Guiding the development of the economy, tourism, and environment in this region with system coordination development theory. Considering inter-dependence, inter-promotion, inter-constriction, integrity and comprehensiveness of the sub-systems, it was deemed important to establish system integrity awareness and a regional development view for regional sustainable coordinated development of the environment-tourism-economy system. (3) Scientific sustainable development planning of the environment-tourism-economy system should be made, and economy and tourism should be develop appropriately based on the correct forecast and early-warning of the evolution of environment-tourism-economy system to ensure that the environmental assets and conditions can be maintained well. (4) Optimizing its industrial structure. It is inadvisable to develop the economy and tourism at the expense of the environment. With regard to economic and tourism development, it is suggested that we continuously reinforce industrial clustering of construction to optimize the industrial structure; moreover, by improving the security of the tourism and economic systems, their vulnerability is reduced. (5) Strengthening environmental management; increasing investment in ecological construction and protection; improving ecological compensation mechanisms, and enhancing public awareness of environmental protection are necessary. (6) Improving the resource utilization rate in the economy and in tourism; establishing effective economic and tourism developments; reducing the damage caused by economic and tourism developments on the environment are also necessary.
In this paper, some further studies need to be done. Firstly, indices weights were determined with strong subjectivity. Though AHP was used to remedy this defect, its subjectivity cannot be eliminated completely. Secondly, due to different development levels and different conditions of environment, tourism and economy, there are different levels of dynamic coordinated development among different regions. Comparative Studies were not done between western Hunan and other regions because of limited data.


 respectively; y1, y2, y3, …, yn are the n indices depicting the tourism system which were standardized as
  respectively; z1, z2, z3, …, zj are the j indices pertaining to the economy which were standardized as
  respectively; ai is the weight of index I in the environment system; bi is the weight of index I in the tourism system; ci is the weight of index I in the economic system; C(t) is a comprehensive benefit evaluation index for environment, tourism, and the economy which reflects the overall benefit of the system; α, β, and γ are undetermined coefficients, α > 0, β > 0, γ > 0, and α + β + γ = 1. Both regional environment and economic development play an important role in tourism development; the interactions are asymmetric. Even rapid development of the tourism industry can promote regional economic development, while the development of the regional economy is a result of the combined interactions of multiple elements. The development of a regional environment can effectively promote tourism, while tourism may interfere with, or damage, the environment [6]. Therefore, according to expert advice, we set α = 0.4, β = 0.2, and γ = 0.4; D is the coordinated development degree which expresses the level of coordinated development in the system and the overall coordination effects of regional environmental-touristic-economic development; it may be deduced that 0 < D < 1. In cases where the coordinated development degree is 1, the system is in an optimal coordinated development state; otherwise, the lower the coordinated development degree, the more uncoordinated the system. To effectively illustrate the evolution of coordinated development of the environment-tourism-economy system, a fuzzy membership degree was introduced to establish fuzzy level classification criteria for coordinated development (Table 2).


