1. Introduction
The book “Limits to Growth” published by the Club of Rome in 1972 revealed that the human population and economy would grow beyond the physical limits of the planet. A recent study further proves that observed trends in population dynamics, services provision, per capita food outputs, industrial output, remaining non-renewable resources, and pollution match the standard model presented in the book fairly well [
1]. Their own 30-year follow-up [
2] provides additional support for the conclusions derived from their original World3 scenarios, updates those scenarios, and outlines the changes they feel are required for the shift towards a more sustainable society. What is more the European Commission has manifested “Smart, Sustainable and Inclusive Growth” as the Europe 2020 Strategy [
3]. The World Resources Institute revealed Material Flow Analysis (MFA) as an analytic tool that provides information of flows of materials, resources and products from economic activities to the environment. To be more specific, it is a physical analysis in the context of integrated environmental and economic accounting. MFA focuses on a defined region or a system within a designated time period and accounts for flows from which a rate can be calculated. [
4] A close conceptual pioneer is “Factor 4” [
5] or “Factor X” which interprets reduction of utilized resources. It has been declared that we should reduce material inputs in mass terms [
6,
7,
8], furthermore, increasing the efficiency of resource utilization has also been set as a development target for many economies since the 1990s [
9].
The environmental performance of human activities can be determined by the quantity of associated material flows which can indicate the type of its nature [
10], such as direct material input or domestic material consumption representing material intensity (e.g., DMC/GDP). In terms of resource productivity, there has been a great variety of Data Envelopment Analysis (DEA) applications to the performance evaluation of material use in many countries [
11,
12,
13,
14,
15,
16], such as discussions of a firm's productivity in different countries or regions, making comparisons of energy efficiency between economies or sectors, and trying to find a way for improvement. This is due to the fact that DEA can handle the complexity embedded in the relations among multiple inputs and outputs involved in many activities [
17]. In the context of measuring welfare, such as GDP, the assumption of radial efficiency measures used by DEA models appear to be appropriate and reasonable, not only because of their non-parametric framework but also because of the characteristic of input/output oriented operation. Moreover, the concept of decomposing the contributions of population (P), affluence (A) and technology (T) to the impact I = P × A × T, first proposed in the early 1970s [
18,
19] and evolving afterwards [
20,
21,
22], provides good linkages for realizing environmental impacts and assessing relative contributions of the factors mentioned above.
Taiwan has made fantastic progress in terms of the economy, enjoying a high economic growth rate during the latter half of the last century. The Taiwan economy used to be one of Asia’s Four Little Dragons, sharing equal fame with South Korea, Hong Kong and Singapore). However, not only because of its less robust economic growth in recent years but also because of its diplomatic dilemma and complex political situation, Taiwan’s global visibility has deteriorated in the past decade. This paper has thus attempted to find out Taiwan’s positioning in comparison with other economies in the world by applying different related approaches and methodologies. In this way, we may take a small step forward in the context of policy cycles and the decision-making process for instituting sustainable resource use in Taiwan. The indicators discussed in this study and relevant analyses may help to monitor progress and evaluate policies which aim at improving resource productivity, the efficient utilization of materials and sustainable development.
In order to assess resource productivity and to address its implications, this paper first presents the updated MFA database of Taiwan and some key indicators are addressed. Comparisons of material flow and resource productivity in the Asia-Pacific and EU-28 states, assessed through the concept of the Impact-Population-Affluence-Technology (IPAT) master equation, are described correspondingly. While environmental impact considered for the IPAT analyses can be set as extractive pressure, which is relevant to material intensity and resource utilization efficiency, this study adopts the method of DEA to evaluate the relative efficiency of resource utilization in the 38 economies considered. As a result, technological efficiency and pure efficiency (catch-up) can be quantified by incorporating the Malmquist Productivity Index (MPI).
2. Material Flow Analysis and Resource Productivity in Taiwan
There are several kinds of indicators commonly applied in MFA which can be grouped in to input, output and consumption indicators. According to the former literature [
23,
24,
25], input indicators, such as direct material input (DMI), measure the direct input of materials for use in the economy. The DMI includes those materials extracted from the domestic environment and imports which are used for production and consumption; DMI equals domestic (used) extraction plus imports. Output indicators, such as domestic processed output (DPO), account for the total weight of materials transformed to wastes and emissions, which are extracted from the domestic environment or imported and have been used in the domestic economy. It is necessary to note note that these materials might also come from stocks and the used extraction on stocks or exports is not included. Consumption indicators, domestic material consumption (DMC) measures the total amount of materials directly used in an economy (excluding indirect flows). Net Additions to Stock (NAS), measure the physical growth of the economy, in other words, the weight of new construction materials used in buildings and other infrastructure, and materials incorporated into new durable goods. Also of note is that decommissioned materials, such as old materials removed from stock as buildings or demolished or durable goods disposed of, if not recycled, are accounted for in DPO. NAS indicates the distance from flow equilibrium of inputs and outputs that may be regarded as a necessary condition of a sustainable mature metabolism [
24]. Physical Trade Balances (PTBs) measure the physical trade surplus or deficit of an economy, which is calculated as imports minus exports. PTBs indicate whether resource imports exceed resource exports and explain which one DMC is based on. In addition, this study adopts the MFA framework of the World Resources Institute (WRI) [
26,
27], and the follow-up elaboration of MFA methodology [
28]. The calculation procedures of key indicators are summarized as follows (indirect flows are not mentioned because of the difficulty in defining and evaluating them):DE = domestic extraction used; Imports = direct material input from trade (weight at border);DPO = domestic processed output, comprising water/air emissions, wastes, dissipatively used materials, and deliberate deposition; Exports = material amounts exported (weight at border);DMI = DE + Imports; DMC = DMI − Exports; PTBs = Imports − Exports.
As a result, productivity indicators can be constructed by combining a desired outcome with economy-wide MFA indicators. If the desired outcome is an economic performance indicator, information about eco-efficiency of the economy can also be provided. For instance, the indicator GDP per DMI indicates direct material productivity and GDP per DMC is also another broadly used productivity indicator. Therefore, measuring and monitoring productivity indicators over time allows us to examine the way in which material and/or resource use has been decoupled from economic growth, respective value added up. In addition, this can lead toward a more sustainable way for development.
There has been a continuing research program and a series of literature dedicated to material flow analysis in Taiwan [
29,
30,
31]. A database in accordance with official sources from Taiwan government organizations has been established and maintained since the 1990s and this study has further updated the data from the years 2006–2012. Incorporating the input/output analysis methodology suggested by the World Resource Institute [
26,
27] and Eurostat [
23], a modified MFA framework has been established. This relatively conclusive framework, which incorporates domestic extractions, imports, emissions, exports and indirect flows, has been implemented for the MFA studies in Taiwan [
10]. Extending and enhancing the studies mentioned above, the study has maintained and updated the MFA database of Taiwan from the year 2006–2012 using the following data sources: The Directorate General of Budget, Accounting and Statistics (DGBAS) of Executive Yuan; The Customs Administration (CA), Ministry of Finance and related official government organizations.
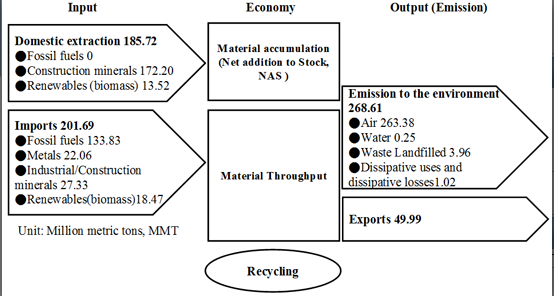
Figure 1 shows the MFA result of the Taiwan economy in the year of 2012. The domestic extract of materials amounts to 185.2 Million Metric Ton (MMT) with no fossil fuels extracted domestically. The material imported is 201.69 MMT in total, with a portion of 66% coming from imported fossil fuels. The air emissions to the environment, mostly the greenhouse gas emission, contribute 98% of the DPO.
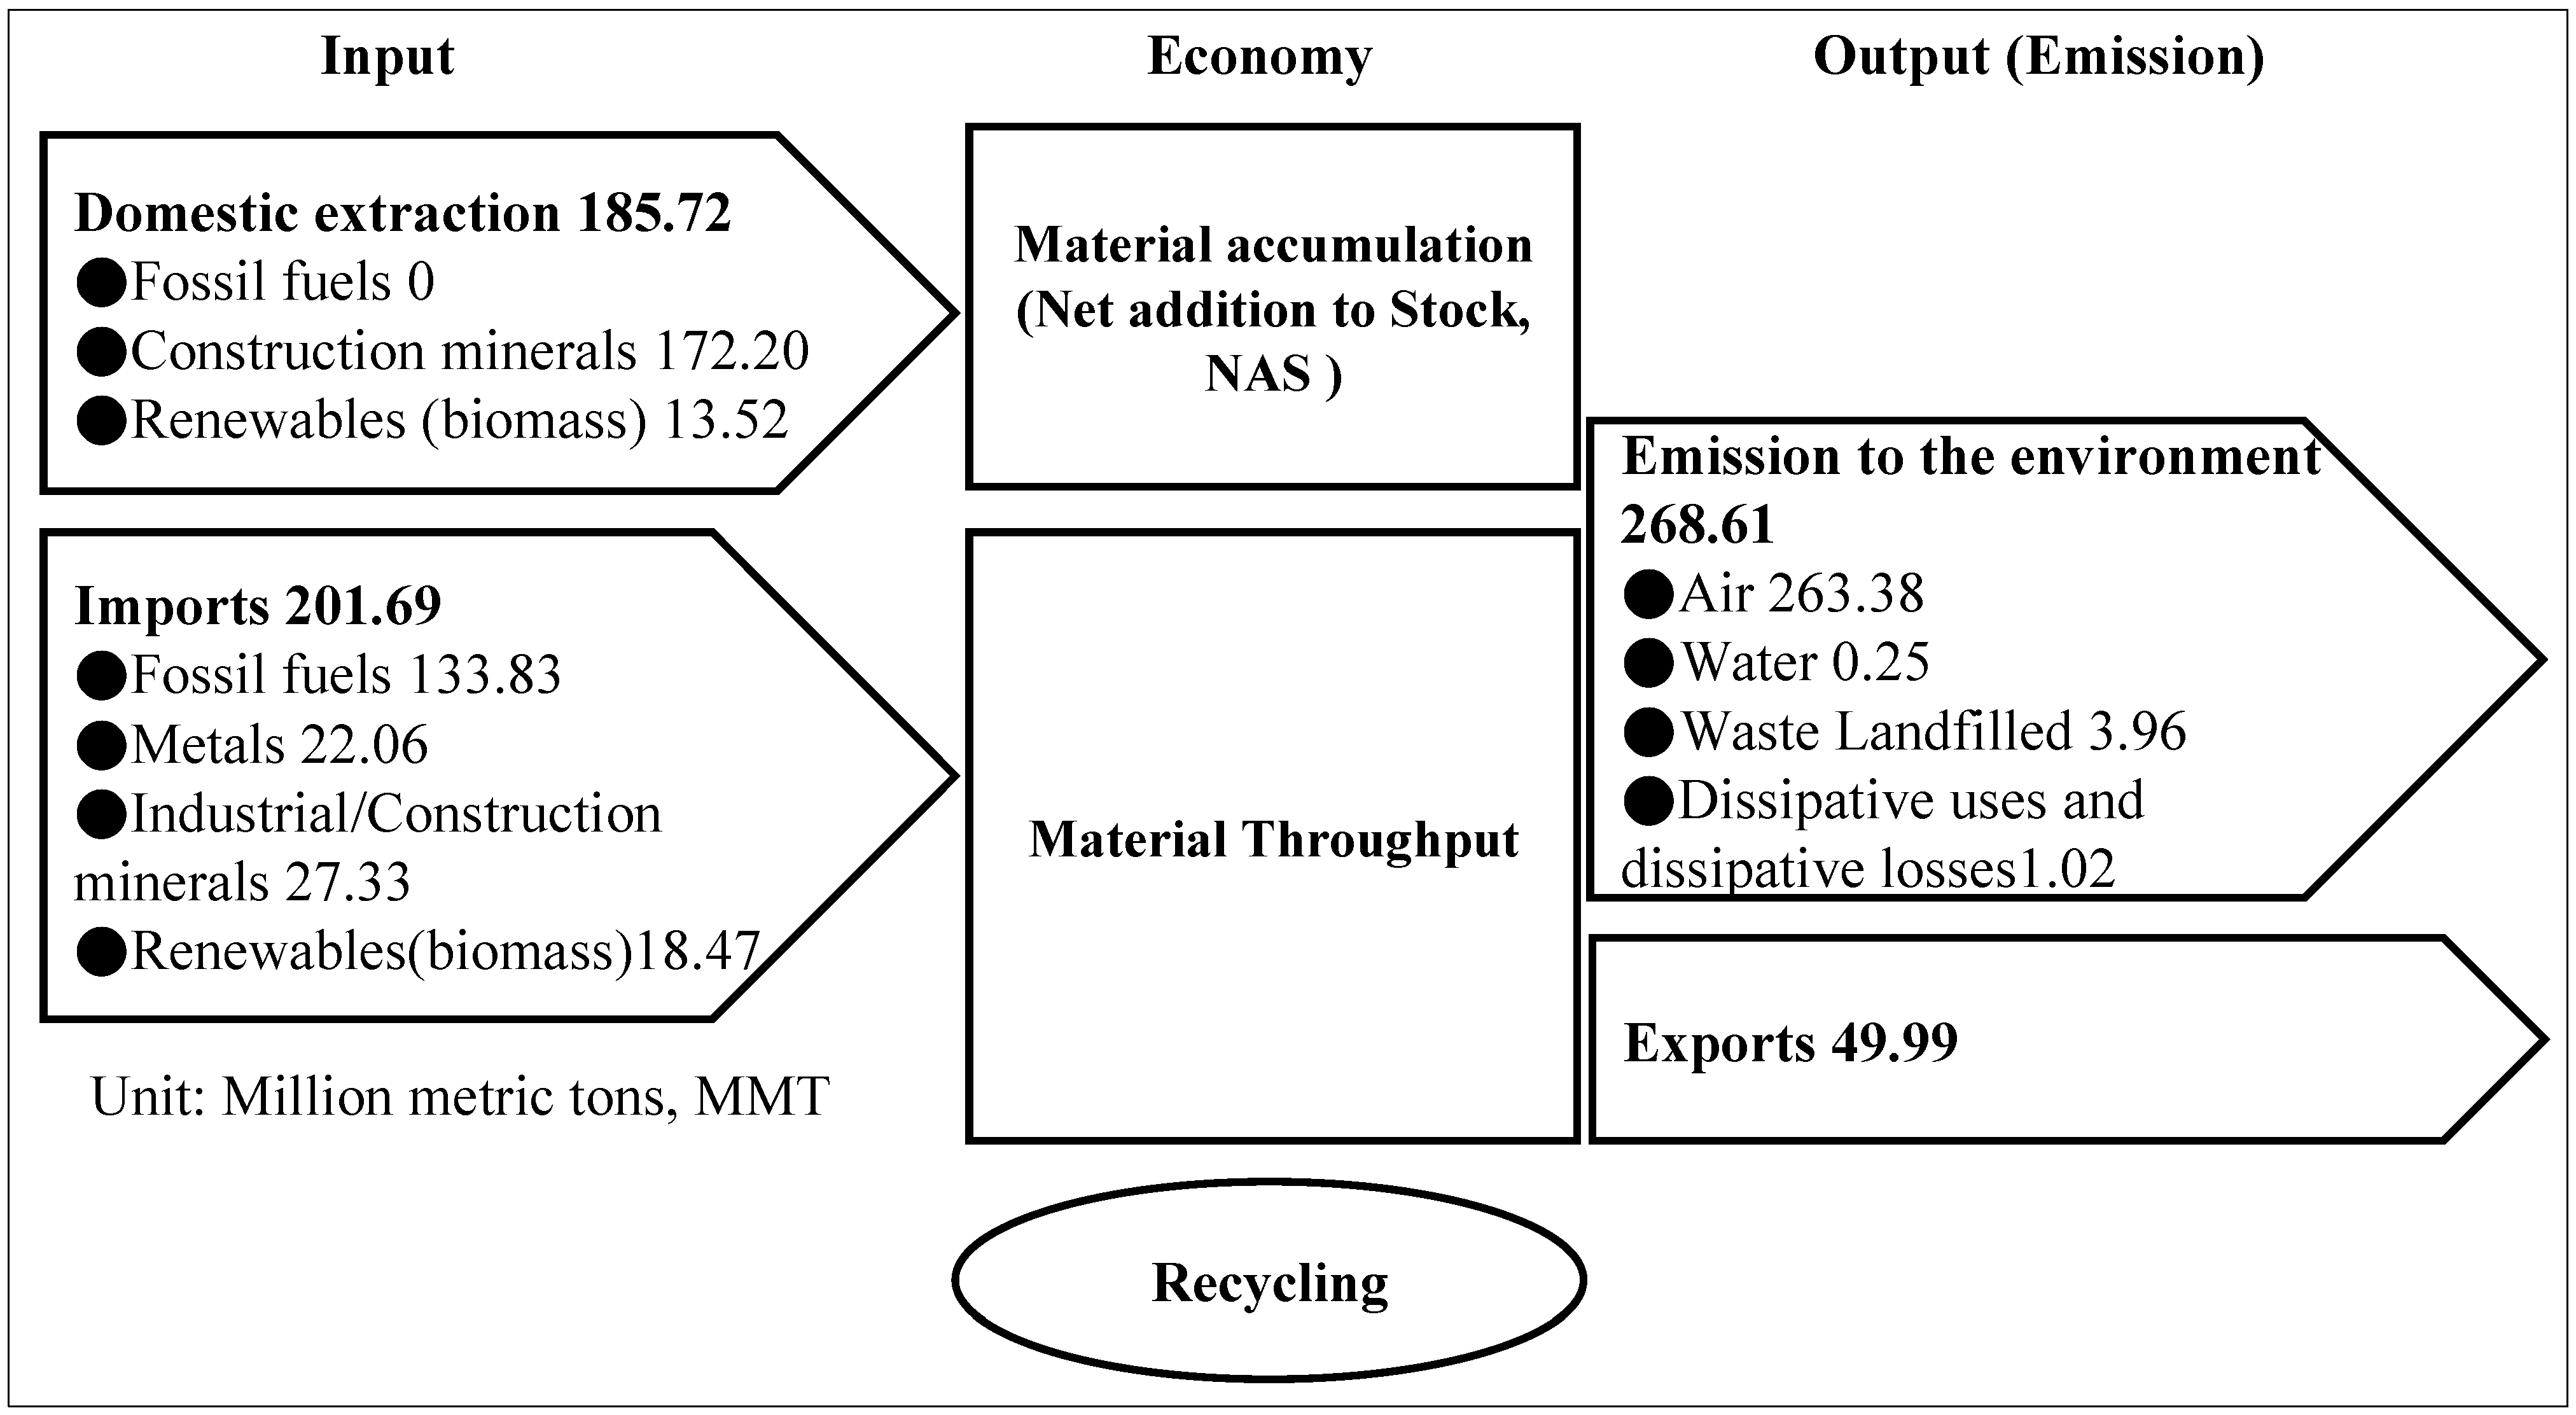
Extending the works mentioned above, this study has sought to analyze the DMI trend in comparison with GDP during the last two decades (
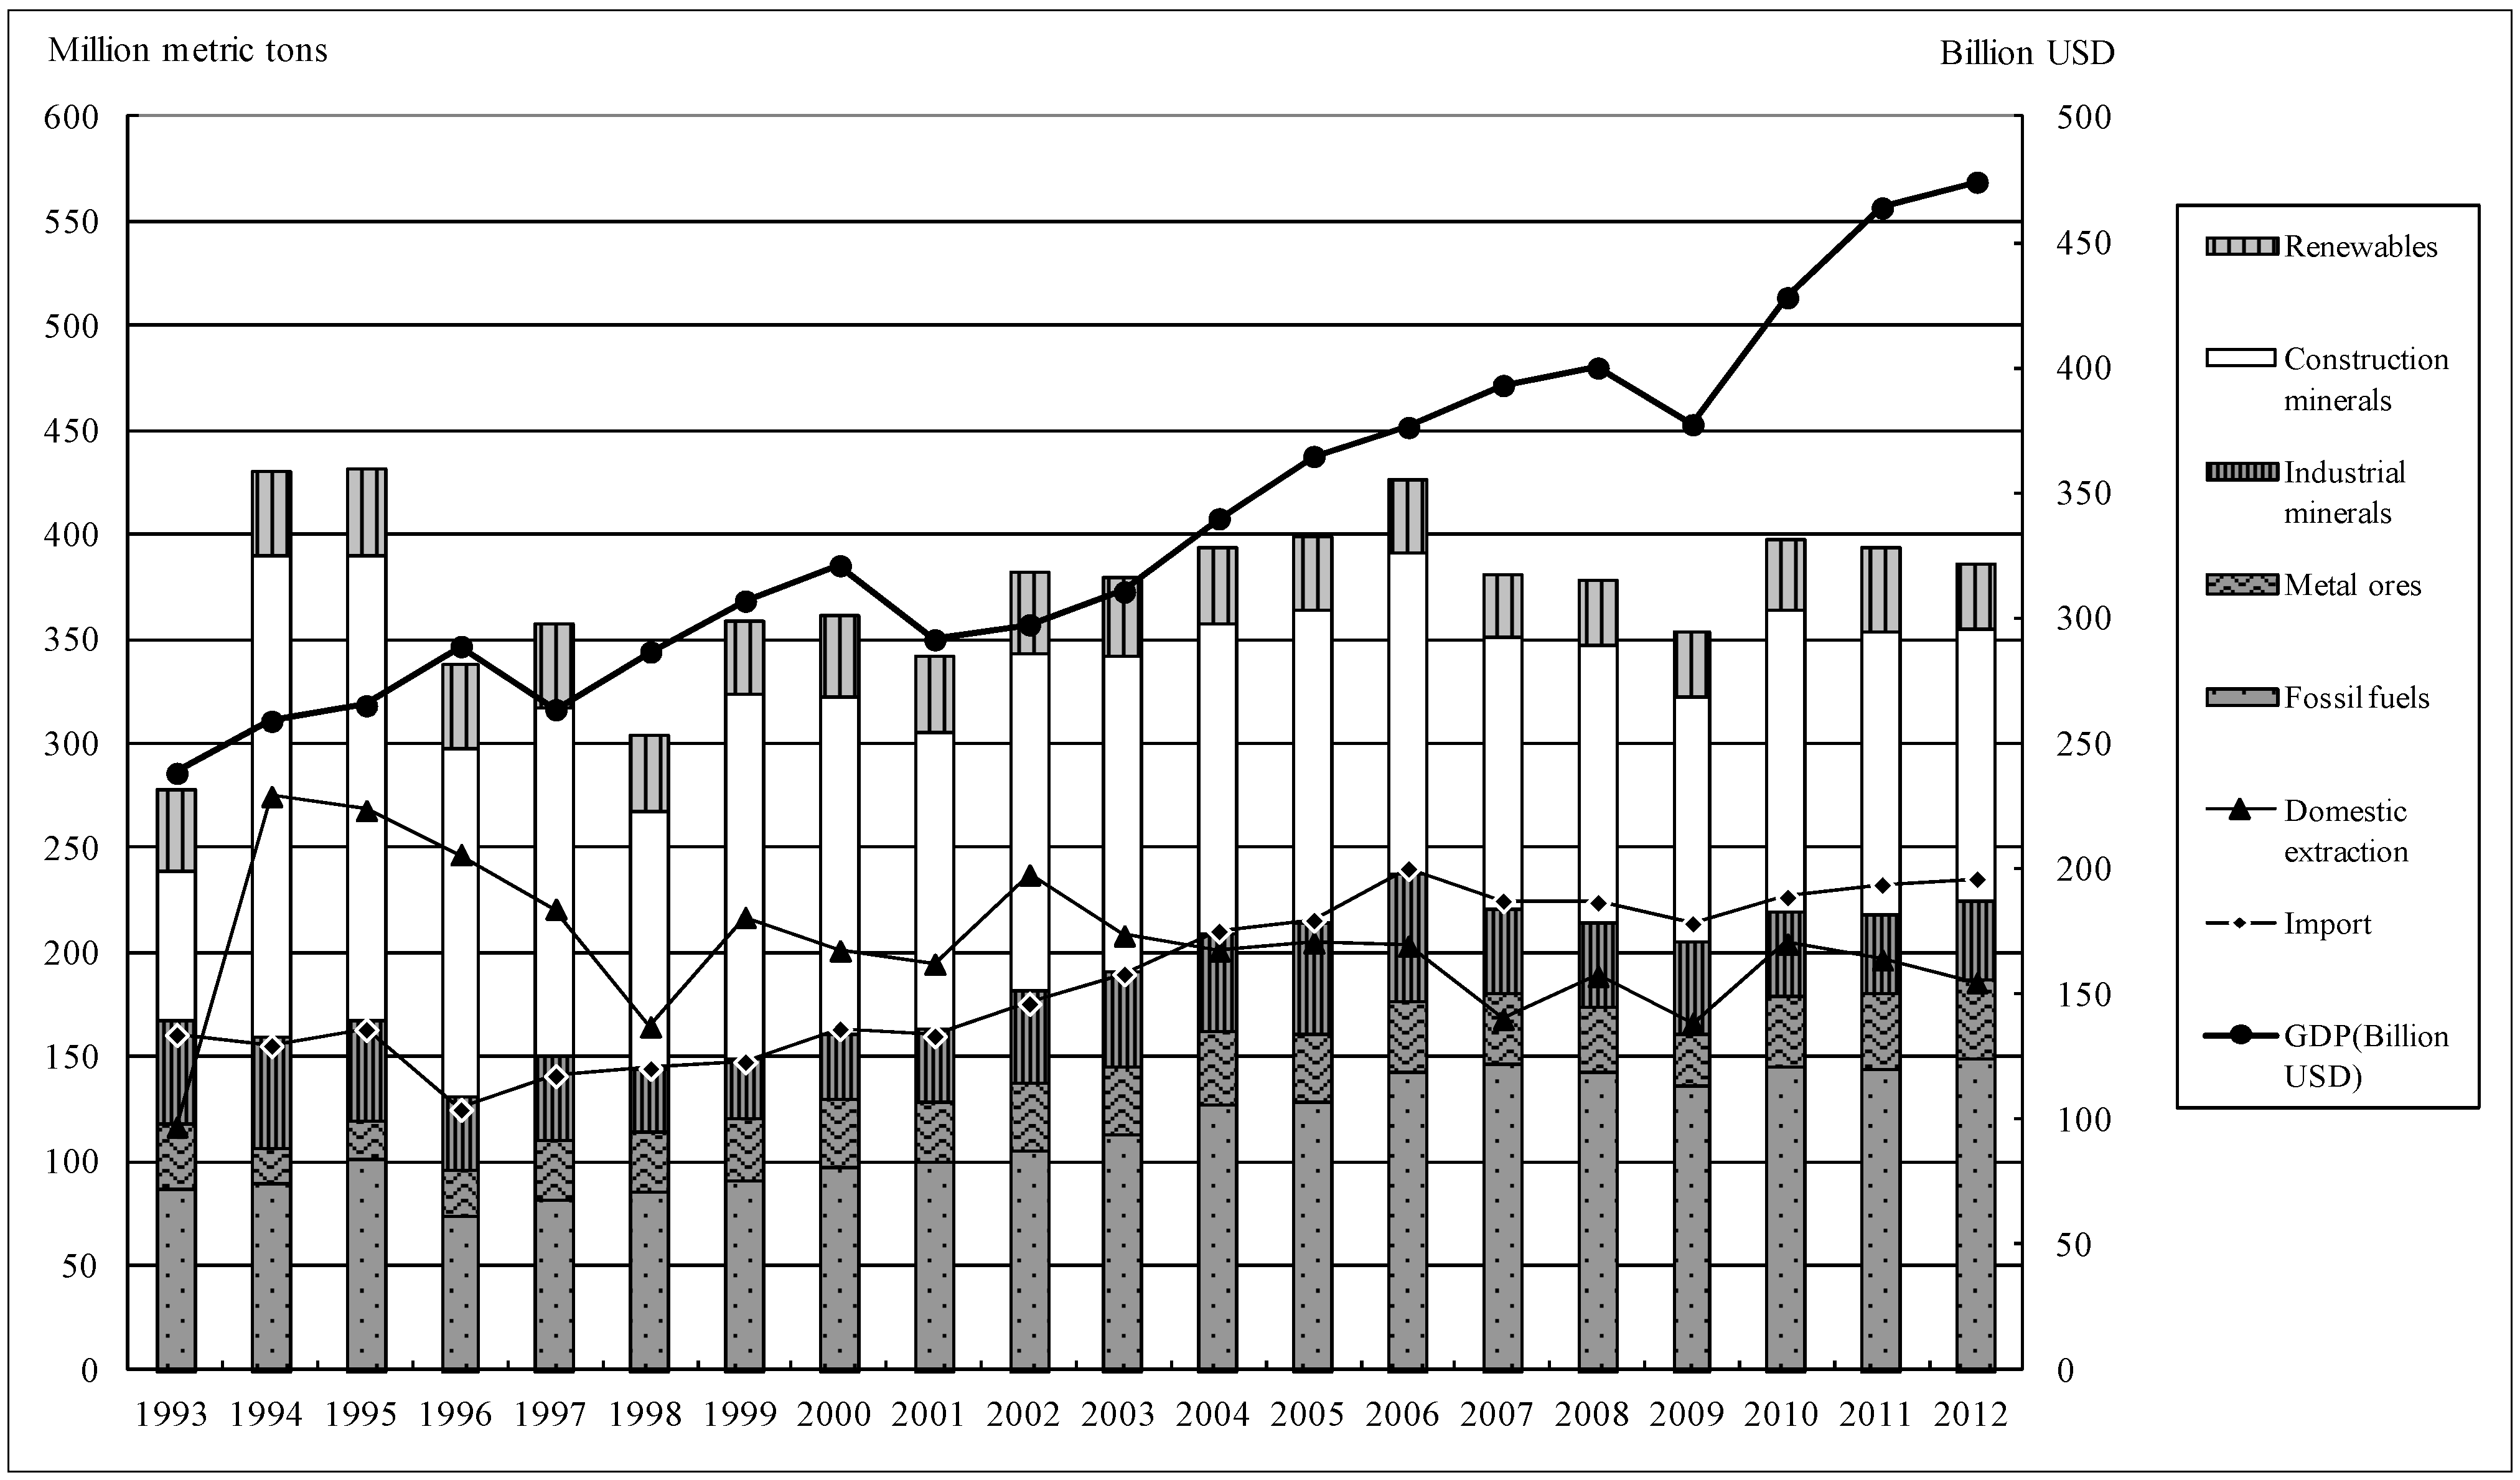
Figure 2). The results from a similar analysis with a focus on output-oriented indicators, DPO, are shown in
Figure 3. The trends from the period investigated can thus be summarized as follows: (1) The DMI went up around 2.83% and DMC increased about 2.13% per year on average; both of these were less than the average growth rate of GDP (increased 4.95% per year on average, at constant prices 2000). (2) In terms of outputs, conventional pollutant emission has apparently decreased since 2001, while the GHG emissions represent the majority of DPO. (3) Despite GHG emissions being similar to GDP growth before 2009, a dramatic change occurred after 2010. GHG emissions can be said to be relatively decoupled from economic growth,
i.e., the average growth rate of GHG emission was less than that of GDP.
Figure 1.
Balance diagram of material flows of Taiwan in 2012.
Figure 1.
Balance diagram of material flows of Taiwan in 2012.
Figure 2.
Trend and composition of domestic material input (DMI) along with gross domestic product (GDP) of Taiwan.
Figure 2.
Trend and composition of domestic material input (DMI) along with gross domestic product (GDP) of Taiwan.
Figure 3.
Trend and composition of domestic processed output (DPO) of Taiwan.
Figure 3.
Trend and composition of domestic processed output (DPO) of Taiwan.
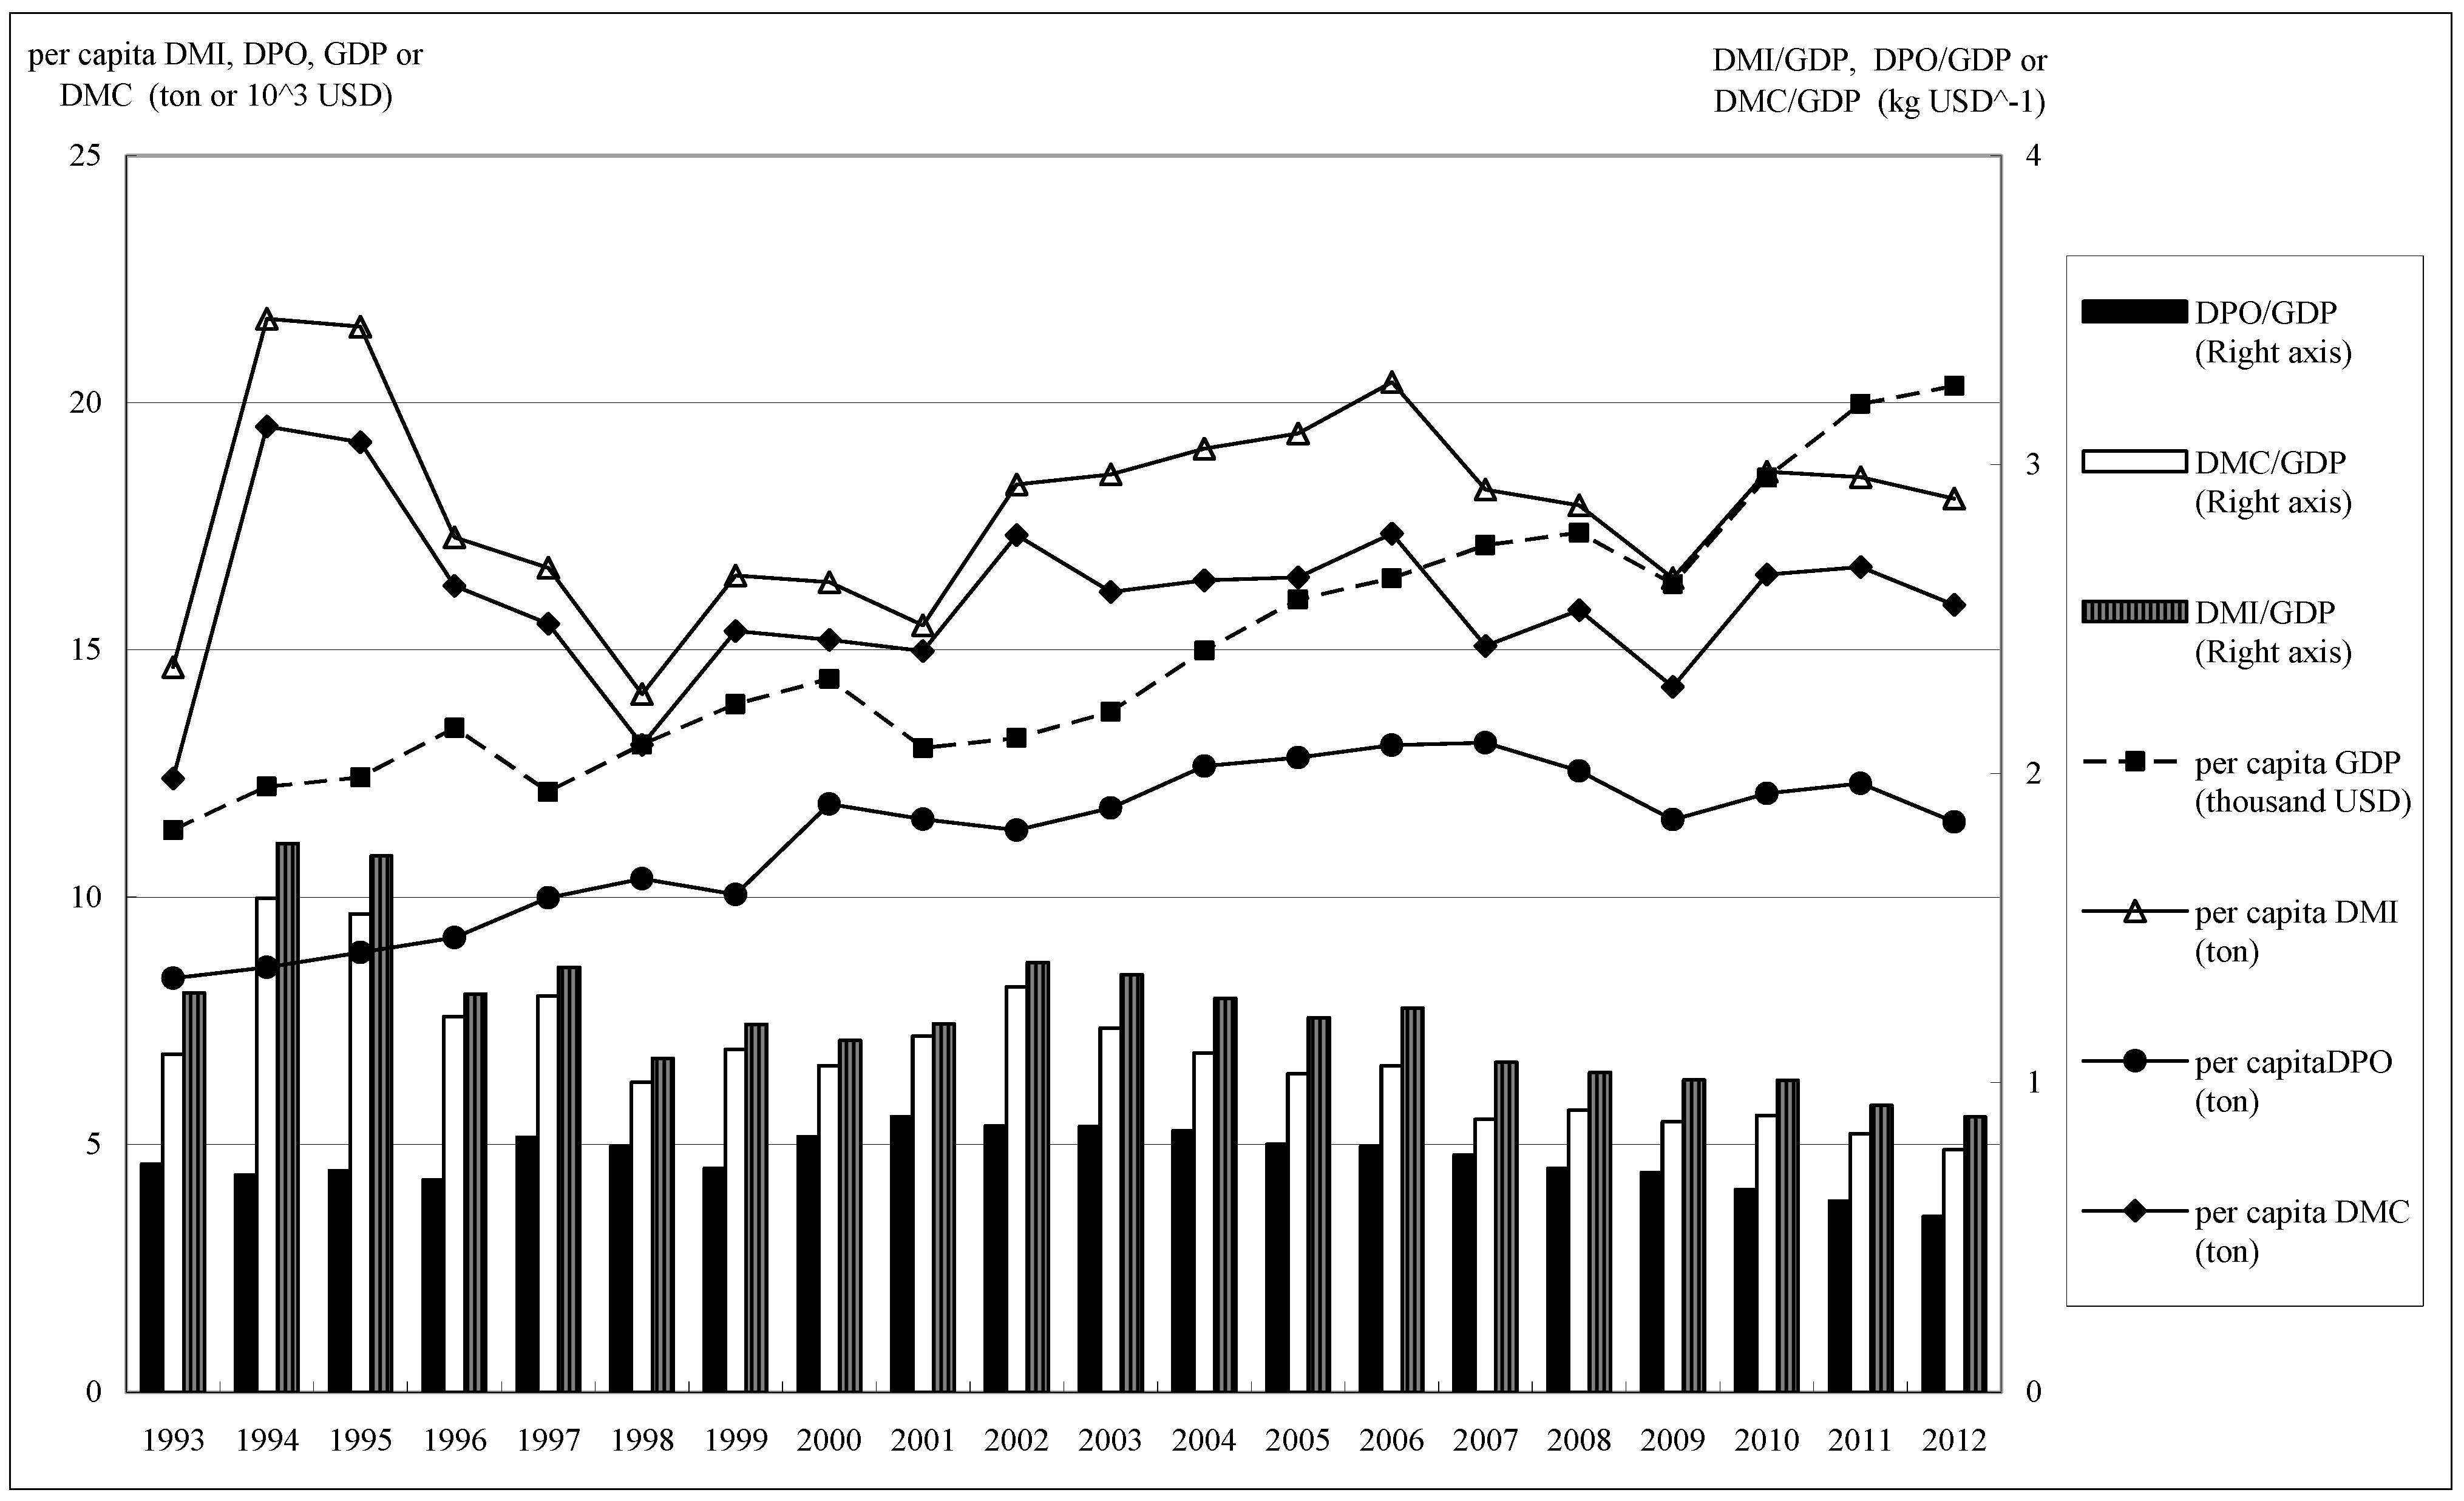
Moreover, this study referred to the proposed indicators of input-oriented, output-oriented and consumption-oriented ones from earlier research [
10,
23,
32,
33]. We found that the evaluation of resource productivity (or eco-efficiency as mentioned above) was usually expressed from an input-oriented perspective by calculating the ratio of welfare (e.g., economic products calculated by monetary units, such as GDP) to a unit of resource use (in physical units, such as DMI). In contrast, indicators of outflow intensity monitor the relationship between processed outputs (e.g., DPO) and economic products (e.g., GDP). Taking into consideration all the different viewpoints noted above, this study adopted the related indicators of efficiency, such as DMI/GDP (reciprocal of resource productivity), DPO/GDP and DMC/GDP. The three efficiency indicators represent respectively the material intensity, outflow intensity and another form of material intensity (or material efficiency) of an economy. The three indicators of per capita material requirements, per capita DMI, DPO and DMC, along with the three related indicators of intensity of the Taiwan economy over the last two decades are illustrated in
Figure 4. As shown in
Figure 4, the quantities of DMI/GDP dropped from 1.8–0.9 kg/USD (constant USD of year 2000). Both the other two related indicators of intensity depict a similar trend (DPO/GDP: 0.9–0.6 and DMC/GDP: 1.7–0.9). The value of per capita GDP rose from USD 11,000 in 1993 to USD 20,500 in 2012. The measures of per capita DMI, per capita DMC and per capita DPO are around 18, 15 and 10 tonnes, respectively. The indicators of intensity obviously showed clear decline trends over the past 10 years and the per capita material requirements have also come to be stabilized.
Figure 4.
Indicators derived from material flow analysis (MFA) for illustrating resource productivity of Taiwan.
Figure 4.
Indicators derived from material flow analysis (MFA) for illustrating resource productivity of Taiwan.
By attempting to compare resource productivity derived from MFA related indicators, this study collected and compiled various data sources of material flow statistics, such as statistics from Eurostat [
34] (statistical data started from Year 1990 and updated to Year 2011), CSIRO and UNEP Asia-Pacific Material Flows online database [
35] (statistical data started from Year 1970 and updated till Year 2008), the comparisons of per capita DMC and DMI can be summarized as follows (including EU- 28 states, 10 Asia-Pacific economies and Taiwan):
DMC per capita: In the year 2000, Australia and Ireland reached the highest volume of 49.1 and 44.3 tonnes respectively; Ireland dropped to 33.7 tonnes in 2008 and 21.6 tonnes in 2011, but Australia remained high around 49.2 tonnes in 2008. In the region of East Asia, Japan and Korea decreased from 12.9 to 10.5 tonnes and 18.2 to 18.1 tonnes during the period of 2000–2008 respectively; in contrast, Taiwan raised its volume to 15.2, 15.8 and 16.7 tonnes in the years of 2000, 2008 and 2011.
DMI per capita (without the Asia-Pacific region): In the year of 2000, Luxembourg, Ireland and Finland were the top three highest in DMI per capita, reaching 49.3, 47.5 and 41.0 tonnes respectively. Similar to DMC per capita, Ireland reduced its amount to 25.0 tonnes in 2011 and Luxembourg’s value also declined to 40.5 tonnes. In contrast, Taiwan’s DMI per capita increased from 15.9–18.5 during the period of 2000–2011.
3. IPAT Analysis
This section expounds the assessment of selected indicators derived from MFA by applying the master equation of IPAT [
18]. The report published by United Nations Environment Program (UNEP) [
33] provides an overview of resource use patterns. It also elaborates the possibilities of using sustainable and efficient resource to form a basis upon which sound policies can be envisaged to build sustainability and efficiency for the economy. By adopting the DMC as a proxy for impact of the IPAT equation, shown as Equation (1), the material intensity indicator of DMC/GDP can be defined as the technology response. That is, by setting I = DMC, P = population, A (per capita GDP) = GDP/population and T (material intensity, MI) = DMC/GDP, the changes of IPAT (or in the formation of differences) can be expressed as follows:
This formulation implies that any efforts to stabilize the impact will need to address both affluence and material intensity. The updated report “Recent trends in Material Flows and Resource Productivity in Asia and the Pacific 2013” [
33] indicates that population growth is now a less important driver of extractive pressure increasing load on the environment at an aggregated regional level, while growing affluence has become a more important driver. In addition, the report also claimed that due to the population growth, increasing material intensity was the major reason for the increase in extractive pressure over the past ten years. It is regrettable that Taiwan is not incorporated in the report. This study thus attempts to imitate the methodology and to include Taiwan for comparison. By denominating the GDP on the basis of exchange rate to a constant year 2000 USD, the IPAT comparison of 10 Asia-Pacific economies, EU-28 states and Taiwan can be summarized as in
Table 1. Based on the results from the IPAT decomposition analysis, an improvement of technology response (DMC/GDP or MI) in all economies can be observed. The progress of Germany, Ireland, Italy, Malta, United Kingdom and Japan in reducing DMC was also apparent, while in contrast, the growth rates of DMC in Romania and Vietnam exceeded 100%. Both Romania and Vietnam were probably in the emerging stage of development and consumed a relatively greater percentage of materials in contrast to their historical statistics. The material consumption (DMC) in Taiwan increased slightly and the material intensity in Taiwan, although improved, performs worst among the economies investigated.
Table 1.
Major drivers of changes in material consumption (DMC) for the selected economies in the Asia-Pacific region and EU-28 over the period of 2000–2008.
Table 1.
Major drivers of changes in material consumption (DMC) for the selected economies in the Asia-Pacific region and EU-28 over the period of 2000–2008.
| Country or Economy | △DMC (%) | △DMC (in MMT) | △P (%) | △A (%) | △MI (%) |
|---|
| BE: Belgium | 0% | 0.599 | 4% | 110% | −54% |
| BG: Bulgaria | 50% | 51.030 | −8% | 338% | −63% |
| CZ: Czech Republic | 6% | 10.548 | 1% | 283% | −73% |
| DK: Denmark | 9% | 12.183 | 3% | 110% | −49% |
| DE: Germany | −9% | −134.032 | 0% | 92% | −53% |
| EE: Estonia | 80% | 14.987 | −3% | 332% | −57% |
| IE: Ireland | −10% | −17.306 | 18% | 130% | −67% |
| EL: Greece | 15% | 23.116 | 3% | 163% | −57% |
| ES: Spain | 18% | 122.865 | 14% | 141% | −57% |
| FR: France | 1% | 9.763 | 6% | 102% | −53% |
| HR: Croatia | 83% | 31.755 | −4% | 239% | −44% |
| IT: Italy | −15% | −137.064 | 5% | 100% | −59% |
| CY: Cyprus | 77% | 11.780 | 12% | 144% | −35% |
| LV: Latvia | 20% | 6.867 | −8% | 370% | −72% |
| LT: Lithuania | 89% | 24.410 | −9% | 353% | −54% |
| LU: Luxembourg | 2% | 0.183 | 12% | 142% | −62% |
| HU: Hungary | 11% | 13.803 | −2% | 240% | −67% |
| MT: Malta | −11% | −0.157 | 7% | 102% | −59% |
| NL: Netherlands | 0% | 0.777 | 3% | 119% | −56% |
| AT: Austria | 8% | 15.643 | 4% | 108% | −50% |
| PL: Poland | 19% | 104.311 | 0% | 213% | −62% |
| PT: Portugal | 16% | 30.782 | 3% | 109% | −46% |
| RO: Romania | 219% | 378.193 | −8% | 496% | −42% |
| SI: Slovenia | 23% | 7.936 | 1% | 172% | −55% |
| SK: Slovakia | 53% | 28.675 | 0% | 367% | −67% |
| FI: Finland | 19% | 33.908 | 2% | 118% | −47% |
| SE: Sweden | 18% | 31.789 | 4% | 91% | −41% |
| UK: United Kingdom | −6% | −46.294 | 5% | 72% | −48% |
| AU: Australia | 12% | 111.393 | 12% | 128% | −56% |
| CN: China | 99% | 11,264.044 | 5% | 260% | −47% |
| IN: India | 46% | 1,673.370 | 13% | 128% | −43% |
| ID: Indonesia | 27% | 263.706 | 12% | 176% | −59% |
| JP: Japan | −19% | −304.913 | 1% | 2% | −21% |
| MY: Malaysia | 39% | 130.238 | 17% | 111% | −44% |
| PK: Pakistan | 40% | 225.921 | 16% | 98% | −39% |
| KR: Korea | 4% | 31.248 | 4% | 68% | −41% |
| TH: Thailand | 38% | 153.835 | 6% | 109% | −38% |
| VN: Viet Nam | 124% | 402.009 | 10% | 169% | −24% |
| TW: Taiwan | 8% | 25.547 | 3% | 19% | −12% |
4. Analysis of Resource Efficiency
Data envelopment analysis (DEA), which was first proposed by Charnes
et al. (1978) [
36], is a non-parametric method of efficiency analysis. The method measures the relative efficiency for each decision making unit (DMU) by comparing its input and output data with all other DMUs in the same dataset. DEA analysis will differ depending on the scale assumptions that underpin the model. Two scale assumptions are generally employed: constant returns to scale (CRS), and variable returns to scale (VRS). The latter encompasses both increasing and decreasing returns to scale. CRS reflects the fact that output will change by the same proportion as inputs are changed (e.g., a doubling of all inputs will double output); VRS reflects the fact that production technology may exhibit increasing, constant and decreasing returns to scale.
Because of the non-parametric characteristic of DEA and its flexible operation (either input or output oriented, depending on circumstances), it is a functional efficiency analyzing method for testing and verifying dematerialization and reduction of emissions (or pollution), which conforms to the goal and demand of MFA. On the basis of the compiled MFA database of 10 Asia-Pacific economies, EU-28 states, and Taiwan, this section assesses the efficiencies of resources utilization by applying DEA methods. Known as the CCR model, it uses linear programming to obtain the DMUs’ best production frontier. The CCR model has an input orientation and assumes CRS, which is appropriate when all DMUs are operating at an optimal scale and the technical efficiency score obtained from the CCR model is called overall technical efficiency (OTE). The mathematical programming method can be expressed as Equation (2):
where
θ is the technical efficiency value;
λ is the intensity weight;
xi is the K×1 input vector of the
ith DMU;
qi is the M × 1 output vector of the
ith DMU;
X is the K×N input matrix; and
Q is the M×N output matrix.
On the other hand, taking the effect of VRS into consideration, a more general form of the BCC model proposed by Banker
et al. can be applied [
37], which is an extension of the CRS DEA model and obtained by adding a convexity constraint, I1′
λ = 1, to the former equation as Equation (3):
where I1 is an N × 1 vector made up of ones.
The BCC model forms a convex hull of efficiency frontier which envelops the data points more tightly than the CCR model. The efficiency score obtained through the BCC model is called pure technical efficiency (PTE). In theory, OTE can be further decomposed into PTE and scale efficiency (SE, SE = OTE/PTE). As for the inputs/outputs to the efficiency analysis by DEA, we consider the economic products (GDP) as the only output. While incorporating population and material input (DMI) as factors of inputs, the derived efficiencies reflect fairly the affluence (GDP per capita) and resource productivity (GDP/DMI).
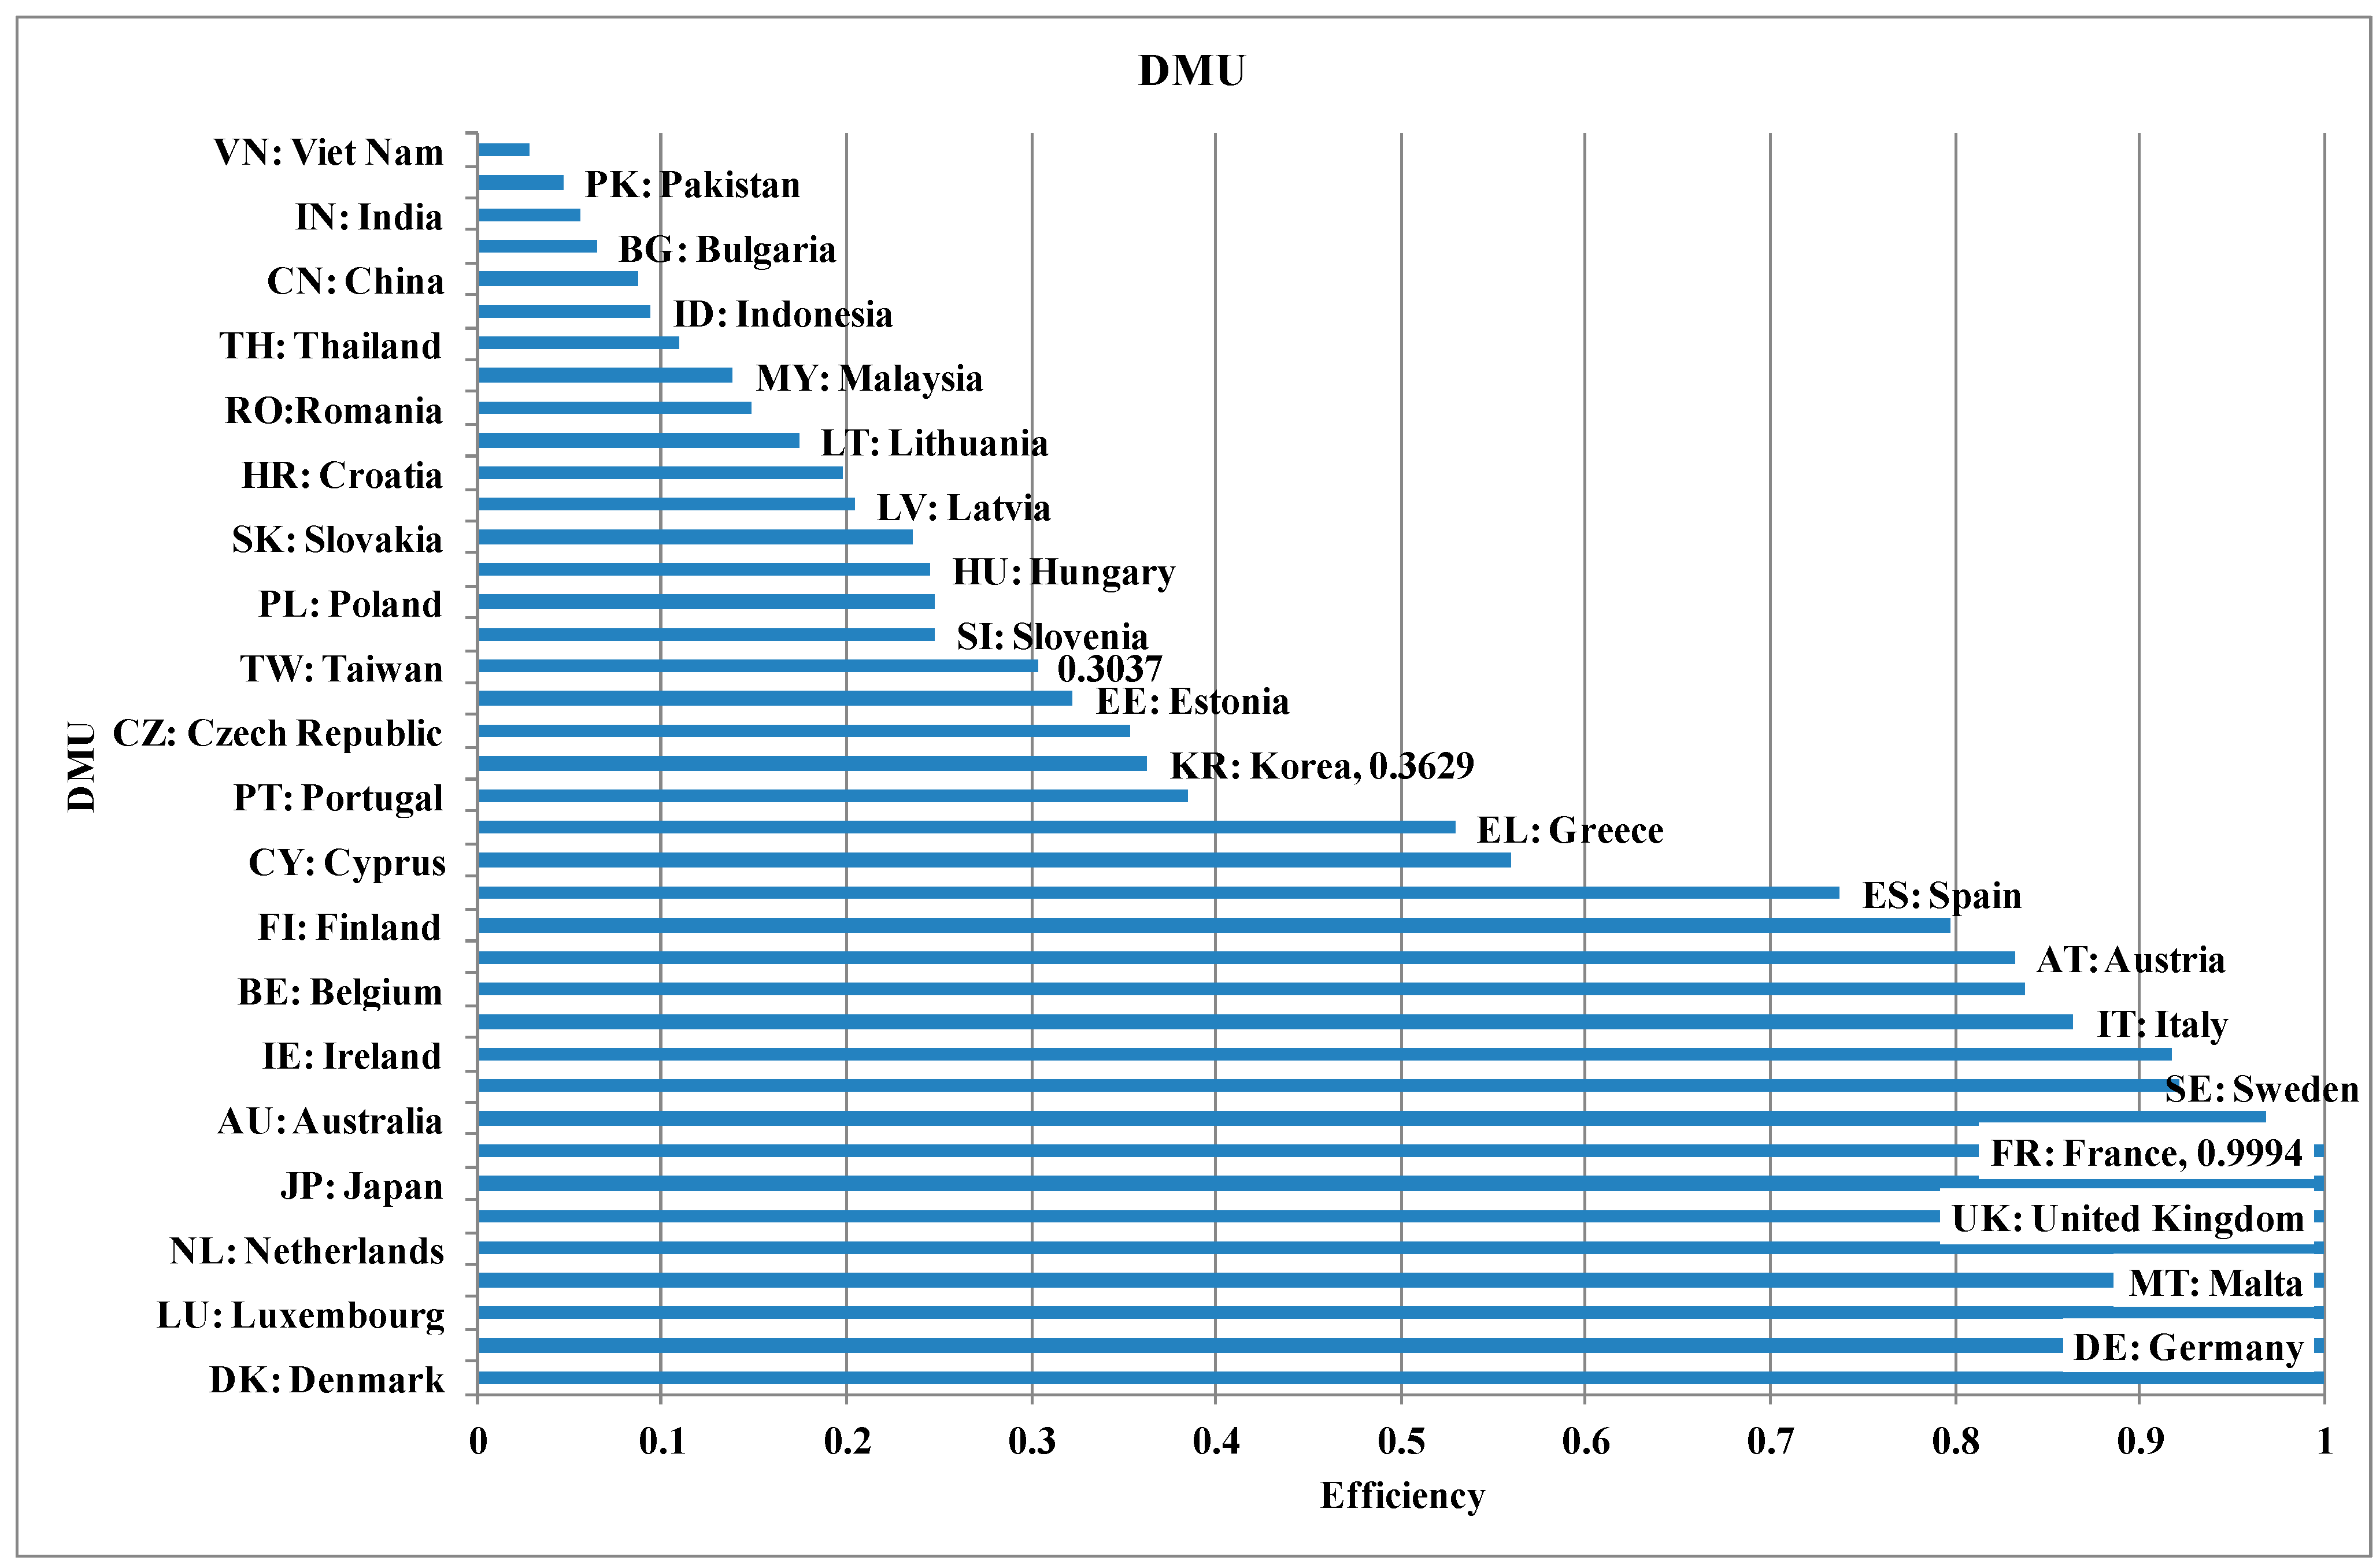
Figure 5 shows the DEA results of the BCC input-oriented model. In the year 2008, the economies of Denmark, Germany, Luxembourg, Malta, Netherlands, United Kingdom and Japan reached the efficiency frontier (with the best performance of aggregated affluence and resource productivity). The performance of Taiwan on resource productivity only ranks 23rd among the 39 economies compared. Nevertheless, there are two shortcomings in the BCC analysis within a specific period. The first one is that we cannot differentiate the change of efficiency over a span of years; the other is that the progress of technology cannot be fully taken into consideration.
Figure 5.
Resource efficiency analysis by adopting the BCC model (year 2008).
Figure 5.
Resource efficiency analysis by adopting the BCC model (year 2008).
We thus adopt the Malmquist Productivity Index (MPI), which provides performance analysis over a period of time based on the DEA model, to overcome the shortcomings. The MPI shows total factor production efficiency change of each DMU during the designated time period [
38]. It also evaluates the efficiency change of a DMU between two time periods. The values of MPI further imply that:
- (1)
MPI >1: It can be said that the DMU has harvested an increase in the efficiency of converting inputs to outputs from one period (t) to another (t + 1).
- (2)
MPI ≤1: This indicates respectively the status quo and regress in the relative efficiency from period (t) to period (t + 1).
The MPI measures the total factor productivity (TFP) change between two data points by calculating the ratio of the distances of each data point relative to a common technology. In general, MPI captures two major sources of productivity change: one is efficiency change (catch-up) and the other is technological change (frontier-shift or innovation, which means shifts in the frontier technology). Efficiency change (so-called overall technical efficiency-OTE which comprises pure technical efficiency-PTE and scale efficiency-SE, as mentioned before) is related to the degree of efforts that the DMU attains for improving its own efficiency by learning good practices or economies of scale. Frontier-shift (innovation) is the change in the efficient frontiers surrounding the DMU between two time periods, which implies the progress of technologies. In other words, technological change is the development of new products or the development of new technologies that allow methods of production to improve and results in the shifting upwards of the production frontier. The effects of catch-up and frontier-shift can be formulated as Equation (4):
where
and
denote the DMU data points in periods (
t) and (
t + 1);
and
represent the efficiencies of
and
with respect to period (
t) frontier;
and
represent the efficiencies of
and
with respect to period (
t + 1) frontier.
The product of (catch-up) and (frontier-shift) which is shown in Equation (5) yields the definition of MPI. The MPI can be further interpreted as the geometric mean of two efficiency ratios: one is the efficiency change measured by the period (
t) technology and the other is the efficiency change measured by the period (
t + 1) technology. It is an index representing TFP of the DMU, in that it reflects progress or regress in efficiency of the DMU along with progress or regress of the frontier technology.
Under the assumption of VRS and circumstance of input orientation, the empirical implementation of this study incorporated population, DMC as input factors, and GDP as the only output. The computed results from analyzing the data collected (11 Asia-Pacific economies and EU-28 states) over nine years (year 2000–2008) is shown in
Table 2. The results depict that those who performed the best in the perspective of fixed-time efficiency (such as UK and Japan in the former BCC model analysis) no longer take the lead when considering both learning and innovating effects. In contrast, those relatively emerging developing economies, such as Czech Republic, Hungary, Poland and Slovakia had better MPI scores. These economies appear to perform well both in learning (catch-up) and innovation (frontier-shift). Once more, the supplementary study target, the Taiwan economy, does not perform well in learning effect since its score of “Catch-up” is less than 1. Similarly, the economies including Cyprus, Slovenia, and Vietnam may have to face the issue of poor catch-up and make further progress on resource productivity.
Table 2.
Results from Malmquist Productivity Index (MPI) analysis of the Asia-Pacific economies and EU-28 states from year 2000–2008.
Table 2.
Results from Malmquist Productivity Index (MPI) analysis of the Asia-Pacific economies and EU-28 states from year 2000–2008.
| DMU | Catch-up | Frontier-shift | Malmquist | DMU/Statistics | Catch-up | Frontier-shift | Malmquist |
|---|
| BE: Belgium | 1.395 | 1.569 | 2.189 | PT: Portugal | 1.295 | 1.744 | 2.258 |
| BG: Bulgaria | 1.137 | 1.724 | 1.961 | RO: Romania | 1.970 | 1.813 | 3.571 |
| CZ: Czech Rep. | 2.472 | 1.940 | 4.794 | SI: Slovenia | 0.921 | 1.850 | 1.704 |
| DK: Denmark | 1.272 | 1.745 | 2.218 | SK: Slovakia | 1.689 | 1.840 | 3.108 |
| DE: Germany | 1.622 | 1.216 | 1.973 | FI: Finland | 1.303 | 1.818 | 2.368 |
| EE: Estonia | 1.156 | 1.075 | 1.243 | SE: Sweden | 1.249 | 1.590 | 1.986 |
| IE: Ireland | 1.383 | 1.880 | 2.599 | UK: United Kingdom | 1.424 | 1.330 | 1.894 |
| EL: Greece | 1.721 | 1.630 | 2.806 | AU: Australia | 1.682 | 1.475 | 2.480 |
| ES: Spain | 1.905 | 1.380 | 2.629 | CN: China | 2.370 | 1.235 | 2.927 |
| FR: France | 1.701 | 1.247 | 2.121 | IN: India | 1.217 | 1.489 | 1.813 |
| HR: Croatia | 1.018 | 2.017 | 2.053 | ID: Indonesia | 1.576 | 1.570 | 2.476 |
| IT: Italy | 1.662 | 1.275 | 2.120 | JP: Japan | 1.000 | 1.014 | 1.014 |
| CY: Cyprus | 0.974 | 1.124 | 1.095 | MY: Malaysia | 1.321 | 1.714 | 2.264 |
| LV: Latvia | 1.242 | 1.303 | 1.619 | PK: Pakistan | 1.025 | 1.664 | 1.705 |
| LT: Lithuania | 1.116 | 1.693 | 1.889 | KR: Korea | 1.201 | 1.459 | 1.752 |
| LU: Luxembourg | 1.000 | 1.692 | 1.692 | TH: Thailand | 1.025 | 1.600 | 1.641 |
| HU: Hungary | 1.771 | 1.805 | 3.197 | VN: Viet Nam | 0.787 | 1.772 | 1.394 |
| MT: Malta | 1.000 | 1.507 | 1.507 | TW: Taiwan | 0.783 | 1.527 | 1.195 |
| NL: Netherlands | 1.477 | 1.538 | 2.272 | Average | 1.392 | 1.567 | 2.180 |
| AT: Austria | 1.317 | 1.663 | 2.191 | Max | 2.472 | 2.017 | 4.794 |
| PL: Poland | 2.108 | 1.573 | 3.317 | Min | 0.783 | 1.014 | 1.014 |
5. Conclusions
This paper aimed to conduct an extended evaluation of sustainability related to material flow, since key factors derived from MFA can be an indication of reduced material use and, as well, the pursuit of high efficiency in the utilization of material is also an important issue for sustainability. According to the above findings, the study presented the statistics and descriptions of the updated MFA database in Taiwan (the newest statistics are for year 2012). Key indicators were selected to interpret and to quantify resource productivity and efficiency associated with the economy-wide MFA of Taiwan. This study also applied the IPAT master equation to measure the change of material intensity in Taiwan, and to make comparisons with another 10 Asia-Pacific economies and EU-28 states. Finally, the study extended the assessment of efficiency change in comparison to the 39 economies by applying methods of DEA. The summaries are drawn up as follows:
Generic material flow analysis of the Taiwan economy: The database for the MFA of Taiwan has been updated with the most current statistics up to the year 2012. In the most recent year of 2012, the estimation of DMI amounted to 421 MMT in 2012, in which over 92% of domestic extractions were construction minerals and about 66% of imports fossil fuels. The DPO, with emissions of pollutants, wastes and GHG included, amounted to 263 MMT, and nearly 99% of the outflow was GHG emission. According to the results from monitoring material flows in Taiwan for the past two decades, the DMI went up around 2.83% and DMC increased about 2.13% on average. Both the growth rates of the DMI and DMC were less than the growth rate of GDP, which was 4.95% on average. Additionally GHG emission was relatively decoupled with economic growth starting from the year of 2010.
Assessment of resource productivity for the Taiwanese economy: This study discussed and evaluated the key indicators of estimating resource productivity derived from MFA of Taiwan. The material intensity of DMI/GDP dropped from 1.8–0.9 kg/USD. Both the other two intensity-related indicators depict a similar trend (DPO/GDP: 0.9–0.6 and DMC/GDP: 1.7–0.9). The value of per capita GDP arose from USD 11,000 in 1993 to USD 20,500 in 2012. The measures of per capita DMI, per capita DMC and per capita DPO are around 18, 15 and 10 tonnes, respectively. It is obvious that the indicators of intensity have shown clear declining trends over the past 10 years and the per capita material requirements are also becoming stabilized. We can say that in Taiwan, the decoupling of environmental impact from economic growth has indeed occurred.
Decomposition of drivers for exploring the impact of material consumption: By adopting the report published by UNEP, this study supplemented related statistics of Taiwan and compared the result with the 10 Asia-Pacific economies and EU-28 states. Based on the results from the IPAT decomposition analysis, improvement of technology response (DMC/GDP or MI) in all economies can be observed. The progress of Germany, Ireland, Italy, Malta, the United Kingdom and Japan in reducing the impacts of DMC was also apparent. As for the performance of the supplementary study target, the change of material consumption (DMC) of Taiwan depicts a slightly increasing trend. The change of material intensity in Taiwan, although improved, performed worst among the economies investigated.
This study also compared Taiwan with other economies on resource efficiency by applying the DEA methods. Both the BCC model and the Malmquist Productivity Index were investigated with data collected from the year 2000–2008. Although six economies (Denmark, Germany, Luxembourg, Malta, Netherlands, the United Kingdom and Japan) performed the most efficiently in the fixed time of the year 2008, none of them were in the lead when considering the learning and innovating effects embedded in MPI. In contrast, the developing economies, such as Czech Republic, Hungary, Poland and Slovakia had better MPI scores. These economies appeared to perform well both in learning (catch-up) and innovation (frontier-shift). Once again, Taiwan dids not perform well in learning effect since its score of “Catch-up” is less than one. It can be concluded that the authors’ home country may have encountered development difficulties in the utilization of resources.
This study made an attempt in applying econometric methods derived from DEA to analyze resource utilization and comparison of efficiency. Except for the efforts of economies themselves, each of them can take another (especially in similar socio-economic circumstance and scale) as a benchmark to increase its efficiency and to achieve sustainable development, through such as experience, policy and initiative consulting. In general, the objective is to notify the policy makers of governments and also practitioners of another perspective of resource consumption; and most of all, that resource efficiency plays an important role in achieving sustainability. It can be predicted that the competitiveness of each economy in the world for improving human welfare will depend on the efficiency and scale at which new policy, technology or newly designed infrastructure that uses less materials is adopted. That is, this study aimed to conduct an extended evaluation of sustainability related to resource productivity based on material flow analysis. Since key factors derived from MFA can reflect the performances of the three dimensions of sustainable development, the assessment of such indicators can be regarded as an extended evaluation of sustainability.
As mentioned above, this study undertook the perspective to improve the country’s efficiency by learning good practices from other countries as well as economies of scale (efficiency change). Taiwan today is using resources less and less efficiently. Technological developments may not contribute significantly to mitigate the environmental impacts of production and consumption in Taiwan, a country surrounded by many emerging economies with strong competitiveness. To sum up, in order to return Taiwan to its days of glory, to restore its honored title as one of Asia’s Four Little Dragons, and to even facilitate it to become an economy of sustainable development in the world, it should be equipped with well-designed policies that not only focus on sustainable resource use but also take an integrated view of economic, social and environmental imperatives for the near future.


