Article

Model Estimation of Water Use Efficiency for Soil Conservation in the Lower Heihe River Basin, Northwest China during 2000–2008

1
State Key Laboratory of Water Environment Simulation, School of Environment, Beijing Normal University, Beijing 100875, China
2
College of Geomatics, Shandong University of Science and Technology, Qingdao 266590, China
3
Faculty of Resources and Environmental Science, Hubei University, Wuhan 430062, China
*
Author to whom correspondence should be addressed.
These authors contributed equally to this work.
Sustainability 2014, 6(9), 6250-6266; https://doi.org/10.3390/su6096250
Submission received: 29 April 2014 / Revised: 3 August 2014 / Accepted: 4 September 2014 / Published: 12 September 2014
(This article belongs to the Special Issue Environment and Energy: the Industrial Ecology perspective)

Abstract

:
There has been very limited research on water use efficiency for soil conservation (WUE-SC) in typical water scarce regions such as the lower Heihe River Basin, where there is serious wind erosion and the soil conservation service plays a key role in guaranteeing the ecological safety of Northern China. The soil conservation service, which was represented by the soil conservation amount (SC), was first estimated with an experiment-based model in this study. Then, the WUE-SC (i.e., SC/ET) was calculated on the basis of evapotranspiration (ET) data, and management implications were finally discussed. The results indicated the WUE-SC ranged between 0–98.69 t mm−1, and it first decreased and then increased on the whole during 2000–2008. Besides, the inter-annual variation of WUE-SC was mainly due to change in the potential soil loss. In addition, the WUE-SC showed significant spatial heterogeneity, and the average WUE-SC of the whole study area was very low due to spatiotemporal inconsistency between the potential soil loss and the vegetation coverage rate. Although there are some uncertainties, these results still can provide local managers with valuable information for water resource utilization and ecosystem management to improve water use efficiency.

1. Introduction

Water is usually the single most limiting factor for provision of ecosystem services, and water scarcity is impacting human welfare worldwide, especially in arid and semiarid regions that are very sensitive to climate change and land use and land cover change [1,2,3,4]. Agriculture in arid and semiarid regions relies heavily on irrigation of water diverted from rivers, and large-scale urban or agricultural development in these regions depends upon the ability to pump groundwater or convey freshwater over long distances from natural sources [5]. Besides, rapid socio-economic development drives land use change, which is altering the hydrologic system and increasing water needs for industrial, domestic and environmental uses, has potentially large impacts on water resources [6,7]. However, coincident with rapid growth in water demand is the potential for substantial reduction in water supplies in arid regions [8]. Runoff of many rivers in arid regions showed a declining trend under the influence of the climatic and land use change during the past decades [9]. As a result, the traditional water utilization approach in these arid and semiarid regions is now facing a big challenge, which appeals to people to develop water-saving irrigation and enhance water use efficiency for sustainable water use [10]. Enhancing water use efficiency is a critical response to growing water scarcity [11], and it is necessary to carry out in-depth research on water use efficiency, which can provide valuable reference information for scientific water resource allocation to make more efficient use of limited water resources [12,13,14]. In particular, it is urgent to analyze water use efficiency in these arid and semiarid regions in order to improve the capacity of these regions to provide the key ecosystem services that are essential to human well-being [15,16]. The water use efficiency or water productivity is the ratio of the net benefits from crop, forestry, fishery, livestock and mixed agricultural systems to the amount of water used to produce those benefits, and in the broadest sense it reflects the objectives of producing more ecological benefits at less social and environmental cost per unit of water consumed [11,17]. Many of the benefits that humans gain from ecosystems are directly or indirectly related to freshwater, which are commonly referred to as water related ecosystem services, e.g., water purification and soil conservation [14,18]. The ecosystems provide multiple ecosystem services, however, the current research on water use efficiency has generally focused only on crop water use efficiency, and there has been very limited research on water use efficiency for the provision of ecosystem services except crop production or primary production [11,19,20,21,22]. With a shift in resource management philosophy from production of food, fiber and forage to protection and restoration of ecosystems [23], it is surely necessary to analyze water use efficiency for the provision of other ecosystem services.
There is an increasing consensus about the importance of incorporating ecosystem services into resource management decisions, but there are still some difficulties in quantifying these ecosystem services and the corresponding water use efficiency [24]. On the one hand, it is difficult to quantify the provision of some ecosystem services, and previous research has generally focused on ecosystem service valuation that assigns values to ecosystem services provided by different land use types and can hardly provide the information on the quantification of ecosystem services [23,25,26]. More importantly, there is rarely available information on how to account for the impacts of the pattern of land uses or land-cover classes on the provision of ecosystem services [27]. Fortunately, the Millennium Ecosystem Assessment (MA) has provided the conceptual framework to assess or quantify the provision of ecosystem services [21], and there have also been some models to quantify some essential ecosystem services, e.g., Integrated Valuation of Ecosystem Services and Tradeoffs (InVEST) [24] and the system for identifying and zoning ecosystem services (SIZES) [28]. On the other hand, there are still some difficulties in accurately estimating the water used for the provision of ecosystem services, which is generally represented with evapotranspiration (ET) [29]. There have been some reliable methods for quantifying ET at a point or field scale for specific sites, but it is fairly difficult to apply such methods for quantifying ET at large scales [5]. Fortunately, some models such as GLEAM model and MODIS-ET model have been proposed for estimating ET with remotely sensed data, which is able to capture land surface information from large geographic extents [5,30,31].
The Heihe River Basin is the second largest inland watershed in China, and the lower Heihe River Basin is a typical arid and semiarid region in Northwest China, where the water scarcity has been intensifying and posing a threat to the sustainability of agricultural production and provision of essential ecosystem services such as primary production and soil conservation [12,13]. The precipitation is very limited in the lower Heihe River Basin, with the annual precipitation reaching approximately 37 mm and the maximum annual evapotranspiration exceeding 1000 mm. Since the precipitation is far less than the water requirement for crop and other vegetation, the water from Heihe River plays a key role in sustaining the agricultural ecosystem as well as other ecosystems [12]. However, runoff of Heihe River into the lower reach has declined significantly due to the impacts of human activities and climate change during the past decades [12,13], which has led to a series of ecological problems such as desertification and grassland degradation, and consequently posed a great threat on the ecological safety of Northern China. For example, serious desertification has made the Badain Jaran Desert in the Ejina Banner become a main sand source of sandstorms influencing Northern China, especially the Beijing-Tianjin region, which has suffered from frequent sandstorms in the spring for years [14]. Besides, the lower Heihe River Basin is an important ecological barrier of China, where the soil conservation service of vegetation plays a key role in guaranteeing the ecological safety of Northern China [12,13]. The Chinese central government started a program of water diversion in 2000 in order to tackle the water shortage issue and restore the ecological environment and control the desertification in the lower Heihe River Basin. Engineering measures have been applied since 2000, i.e., water diversion, lining diversion channels, irrigation efficiency improvement [15]—which have increased water supply to the lower Heihe River Basin and has allowed the ecological environment begin to recover. However, much remains unknown about the changes in ecosystem service provision and water use efficiency before and after the implementation of the program of water diversion [16], which can provide valuable information for improving the program of water diversion and the local ecosystem management. In particular, there has been very limited research on water use efficiency for provision of key ecosystem services such as the soil conservation service in the lower Heihe River Basin.
The soil conservation service plays a key role in reducing the soil erosion that has great impacts on ecosystem productivity [32,33,34]. Besides, there are always strong links between measures for soil conservation and measures for water conservation, in particular there are also links between water use efficiency and biological soil conservation, and this applies equally in arid and semi-arid regions [35]. Therefore, this study aims to analyze the soil conservation service which is represented by the soil conservation amount, and quantify the water use efficiency for soil conservation in the lower Heihe River Basin. First, soil conservation in the lower Heihe River Basin was quantified with the model developed by Dong (1998) [36] and Chen et al. (1996) [37]; then water use efficiency for soil conservation was calculated based on the ET data. Finally, the implication for the land management was discussed. The results of this study can contribute to better understanding the potential impact of climate change and land cover change on the provision of essential ecosystem services and improvement of water use efficiency.

2. Method and Materials
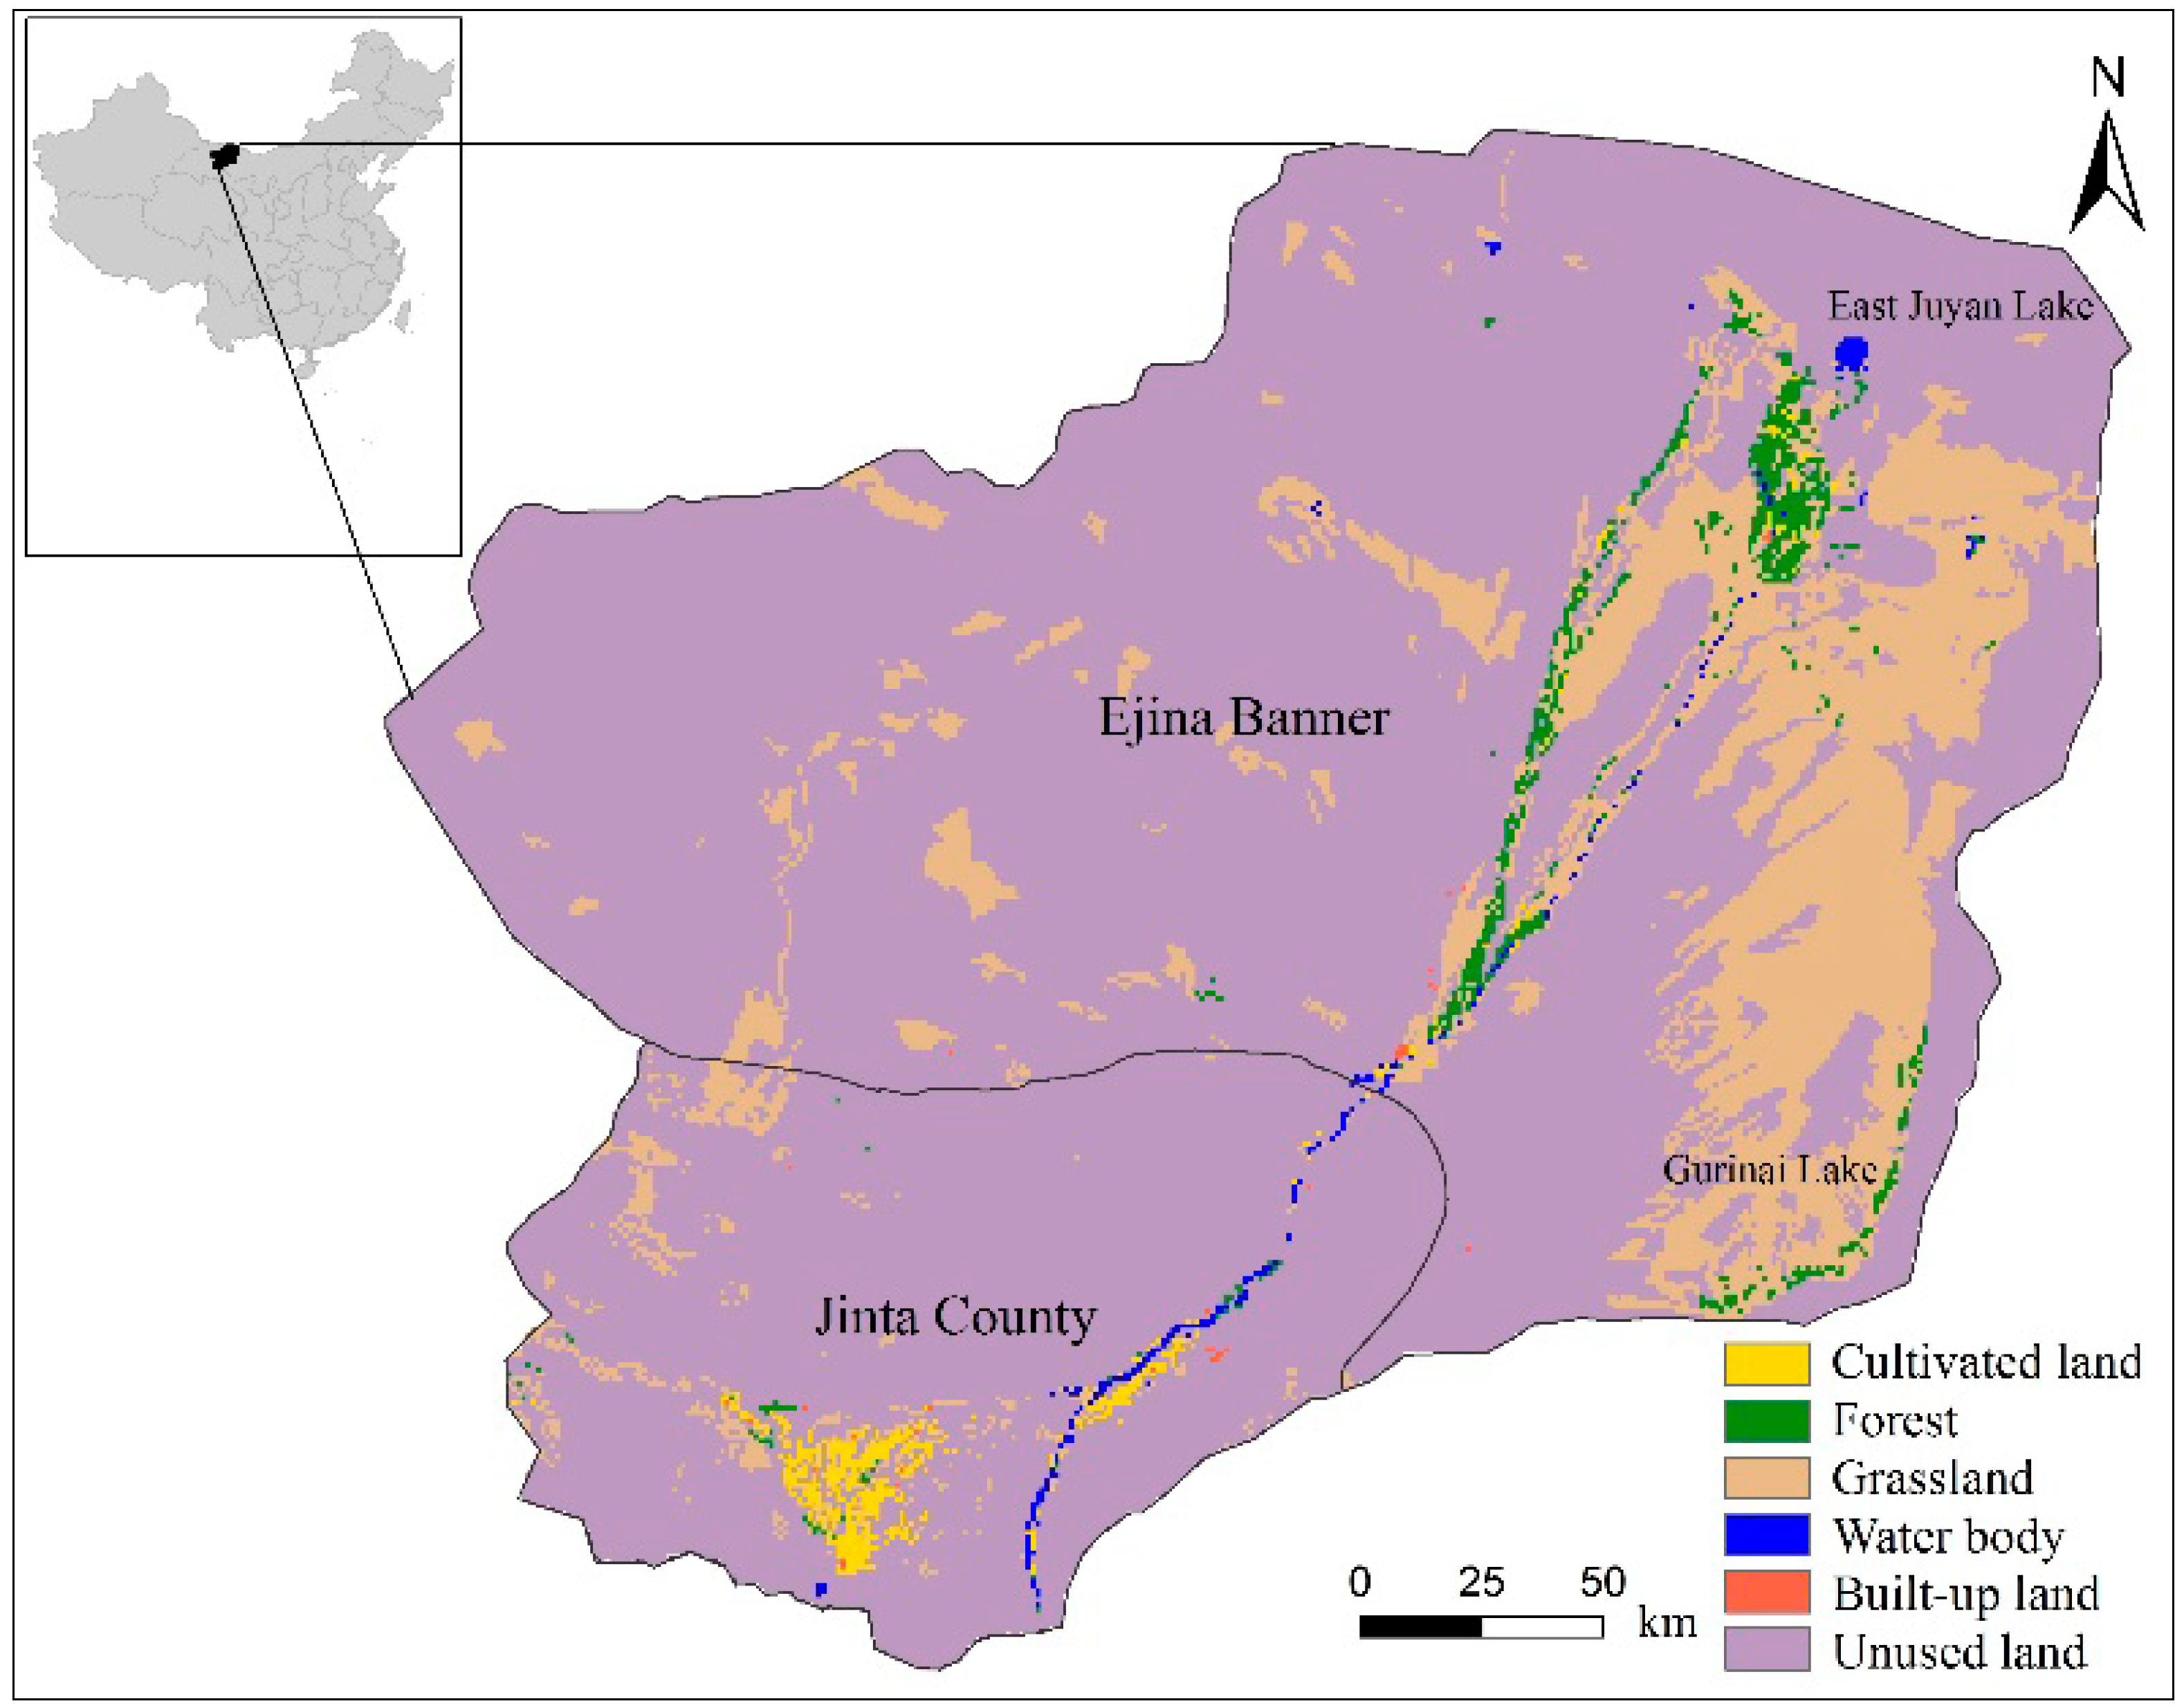
2.1. Study Area

The lower Heihe River Basin lies between 97.13°–103.12° E and 39.87°–42.79° N, with a total land area of approximately 7.71×10⁴ km2, covering most part of Jinta County in Gansu Province and Ejina Banner in Inner Mongolia Autonomous Region. It is a typical arid and semi-arid region, where there are frequently strong winds, sandstorms and very limited precipitation. Besides, most part of the lower Heihe River Basin is covered by unused land (e.g., sandy land and Gobi desert) and low-coverage grasslands, the area of which accounted for 82.95% and 14.14% of the total land area in 2008, respectively (Figure 1). Besides, there is mainly gray-brown desert soil and gray desert soil in the study area, making this region very susceptible to wind erosion. However, there is the second largest Populus euphratica forest of China in the Ejina Banner, which stands in the way of the strong winds into Northern China and serves as the first ecological barrier to intercept the sandstorms into China. The soil conservation service is the key ecosystem service provided by the vegetation in the lower Heihe River Basin, which plays a very important role in guaranteeing ecological safety at the regional and even national level. The vegetation growth in the lower reach heavily depends on the runoff of the Heihe River, however, the river’s supply of water to the lower reaches has declined sharply due to climate change and unreasonable water utilization during past decades and has led to serious vegetation deterioration, shrinkage of oases, intensified desertification and frequent sandstorms, all of which have threatened the provision of ecosystem services essential to the human well-being of local and national people and has done great harm to regional and even national ecological safety and sustainable development.
Figure 1. Location and land cover types of the lower Heihe River Basin in China in 2008.
Sustainability 06 06250 g001

2.2. Estimation of the Soil Conservation Service

The soil conservation service can be quantified by finding the difference between the actual soil loss of the landscape and the potential soil loss which assumes the landscape is bare [38,39], and the soil conservation rate can be calculated by dividing the potential soil loss by the actual soil loss as follows.
SC = SLpSLa
SCR = SC / SLp × 100%
where SC refers to the soil conservation amount (Unit: t), SCR is the soil conservation rate (Unit: %), i.e., the ratio of soil conservation amount to potential soil loss in percentage, and SLp and SLa are the potential and actual soil loss (Unit: t), which are estimated with an experiment-based model under the condition that there is and is not vegetation coverage in the study area as follows.
Sustainability 06 06250 i001
where SL is the amount of soil loss (Unit: t), including SLp under the condition that there is no vegetation coverage, and SLa under the condition that there is vegetation coverage in the study area; V is the wind velocity (Unit: m/s), H is the relative air humidity (Unit: %), SDR refers to the artificial surface destruction rate (Unit: %), which is the share of the artificially destructed land area in the total land area, d is the average soil particle radius (Unit: mm), F is the soil hardness, θ is the slope (Unit: °), D refers to the spatial extent of the study area (Unit: km), and t is the time (Unit: s). VCR is the vegetation coverage rate, which is calculated as follows.
VCR = (NDVINDVIsoil) / (NDVIvegNDVIsoil)
where VCR is the vegetation coverage rate, NDVI is the normalized difference vegetation index, NDVIsoil and NDVIveg are the signals from bare soil and dense green vegetation, which are set as seasonally and geographically invariant constants 0.00 and 0.71. In particular, VCR of the water body, the NDVI of which is below zero, is simply set to be 0.71 since the water body can completely prevent the wind erosion.

2.3. Measurement of the Water Use Efficiency for Soil Conservation

In its broadest sense, the water use efficiency is the net return for a unit of water used [11], and in previous research the crop water use efficiency is expressed as the amount of grain yield (e.g., kilograms of grain) obtained per unit of water consumption (e.g., cubic meters of water) [19,40]. Besides, depending on the type of water sources considered, crop water use efficiency is generally expressed as grain yield per unit water evapotranspired or grain yield per unit total water input (irrigation plus rainfall) [40]. For example, there are three major definitions of water use efficiency that are widely used, i.e., (1) Gross primary production (GPP) based water use efficiency: GPP/ET; (2) Net primary productivity (NPP) based water use efficiency: NPP/ET; (3) Net ecosystem carbon production (NEP) based water use efficiency: NEP/ET [20]. All these definitions only reflect the water use efficiency for primary production, but all involve ET, which is the most active process in the hydrological cycle and is also a major component of energy and water balance in agriculture ecosystems [41,42], and therefore the water consumption is also represented with ET in this study. In addition, since this study primarily focuses on the soil conservation service, which is one of the most important ecosystem services provided in the lower Heihe River Basin, the water use efficiency for the soil conservation is calculated as the soil conservation amount divided by ET as follows.
WUE-SC = SC / ET
where WUE-SC is the water use efficiency for soil conservation (Unit: t mm−1), SC is the soil conservation amount (Unit: t), and ET is the evapotranspiration (Unit: mm), which is assumed to be the water used by vegetation to provide the ecosystem services such as soil conservation. In this study, the average WUE-SC over a region was calculated as the area-weighted average value of all grid cells. It is noteworthy that the WUE-SC of water bodies was also calculated in the same way as other land cover types in this study.

2.4. Data Collection and Processing

It is necessary to gather and integrate detailed information of the study area, and a database was first built, covering geophysical factors, climate factors, vegetation factors, ET and land use data from 2000–2008. Climate factors include the daily relative air humidity and daily wind velocity, all of which may have great impacts on the spatial and temporal patterns of wind erosion. All of those climate data between 2000 and 2008 were derived from daily records of observation stations maintained by the China Meteorological Administration. The original meteorological data, which was saved in form of text, was interpolated into 1 km × 1 km grid data using gradient plus inverse distance squares method [43,44]. Besides, geophysical factors include the slope and soil properties. The slope data was obtained with the 90 m resolution digital elevation model data (DEM) which was downloaded from http://srtm.csi.cgiar.org/ [44]. The soil properties, including the average soil particle radius and soil hardness, were extracted from the HWSD soil dataset covering the Heihe River Basin and literatures [45,46]. In addition, the vegetation coverage rate was calculated with the cloud-free NDVI data from 2001–2011 in the Heihe River Basin [47]. What is more, the ET data for the study area were extracted from the monthly evapotranspiration datasets (2000–2012) with 1 km spatial resolution over the Heihe River Basin Version 1.0 [48]. This study also used the 1 km resolution land use data derived from Landsat TM/ETM images in 2000, 2005 and 2008, which were interpreted by Chinese Academy of Sciences (CAS) with the overall interpretation accuracy of 92.7% [49]. All these data were processed to be the same with the climate data in terms of their spatial reference and resolution.

3. Results and Discussion

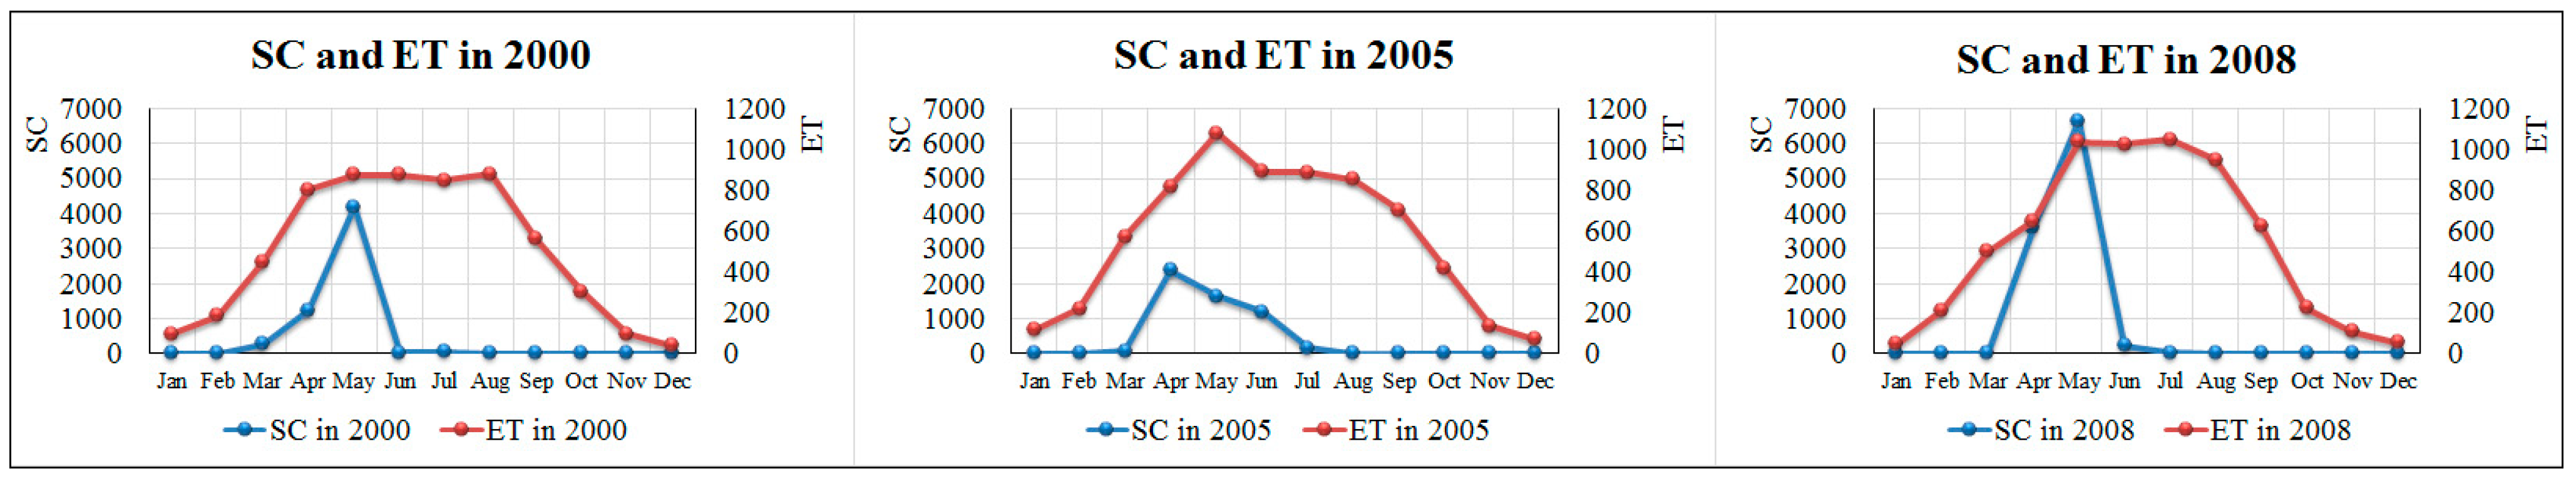
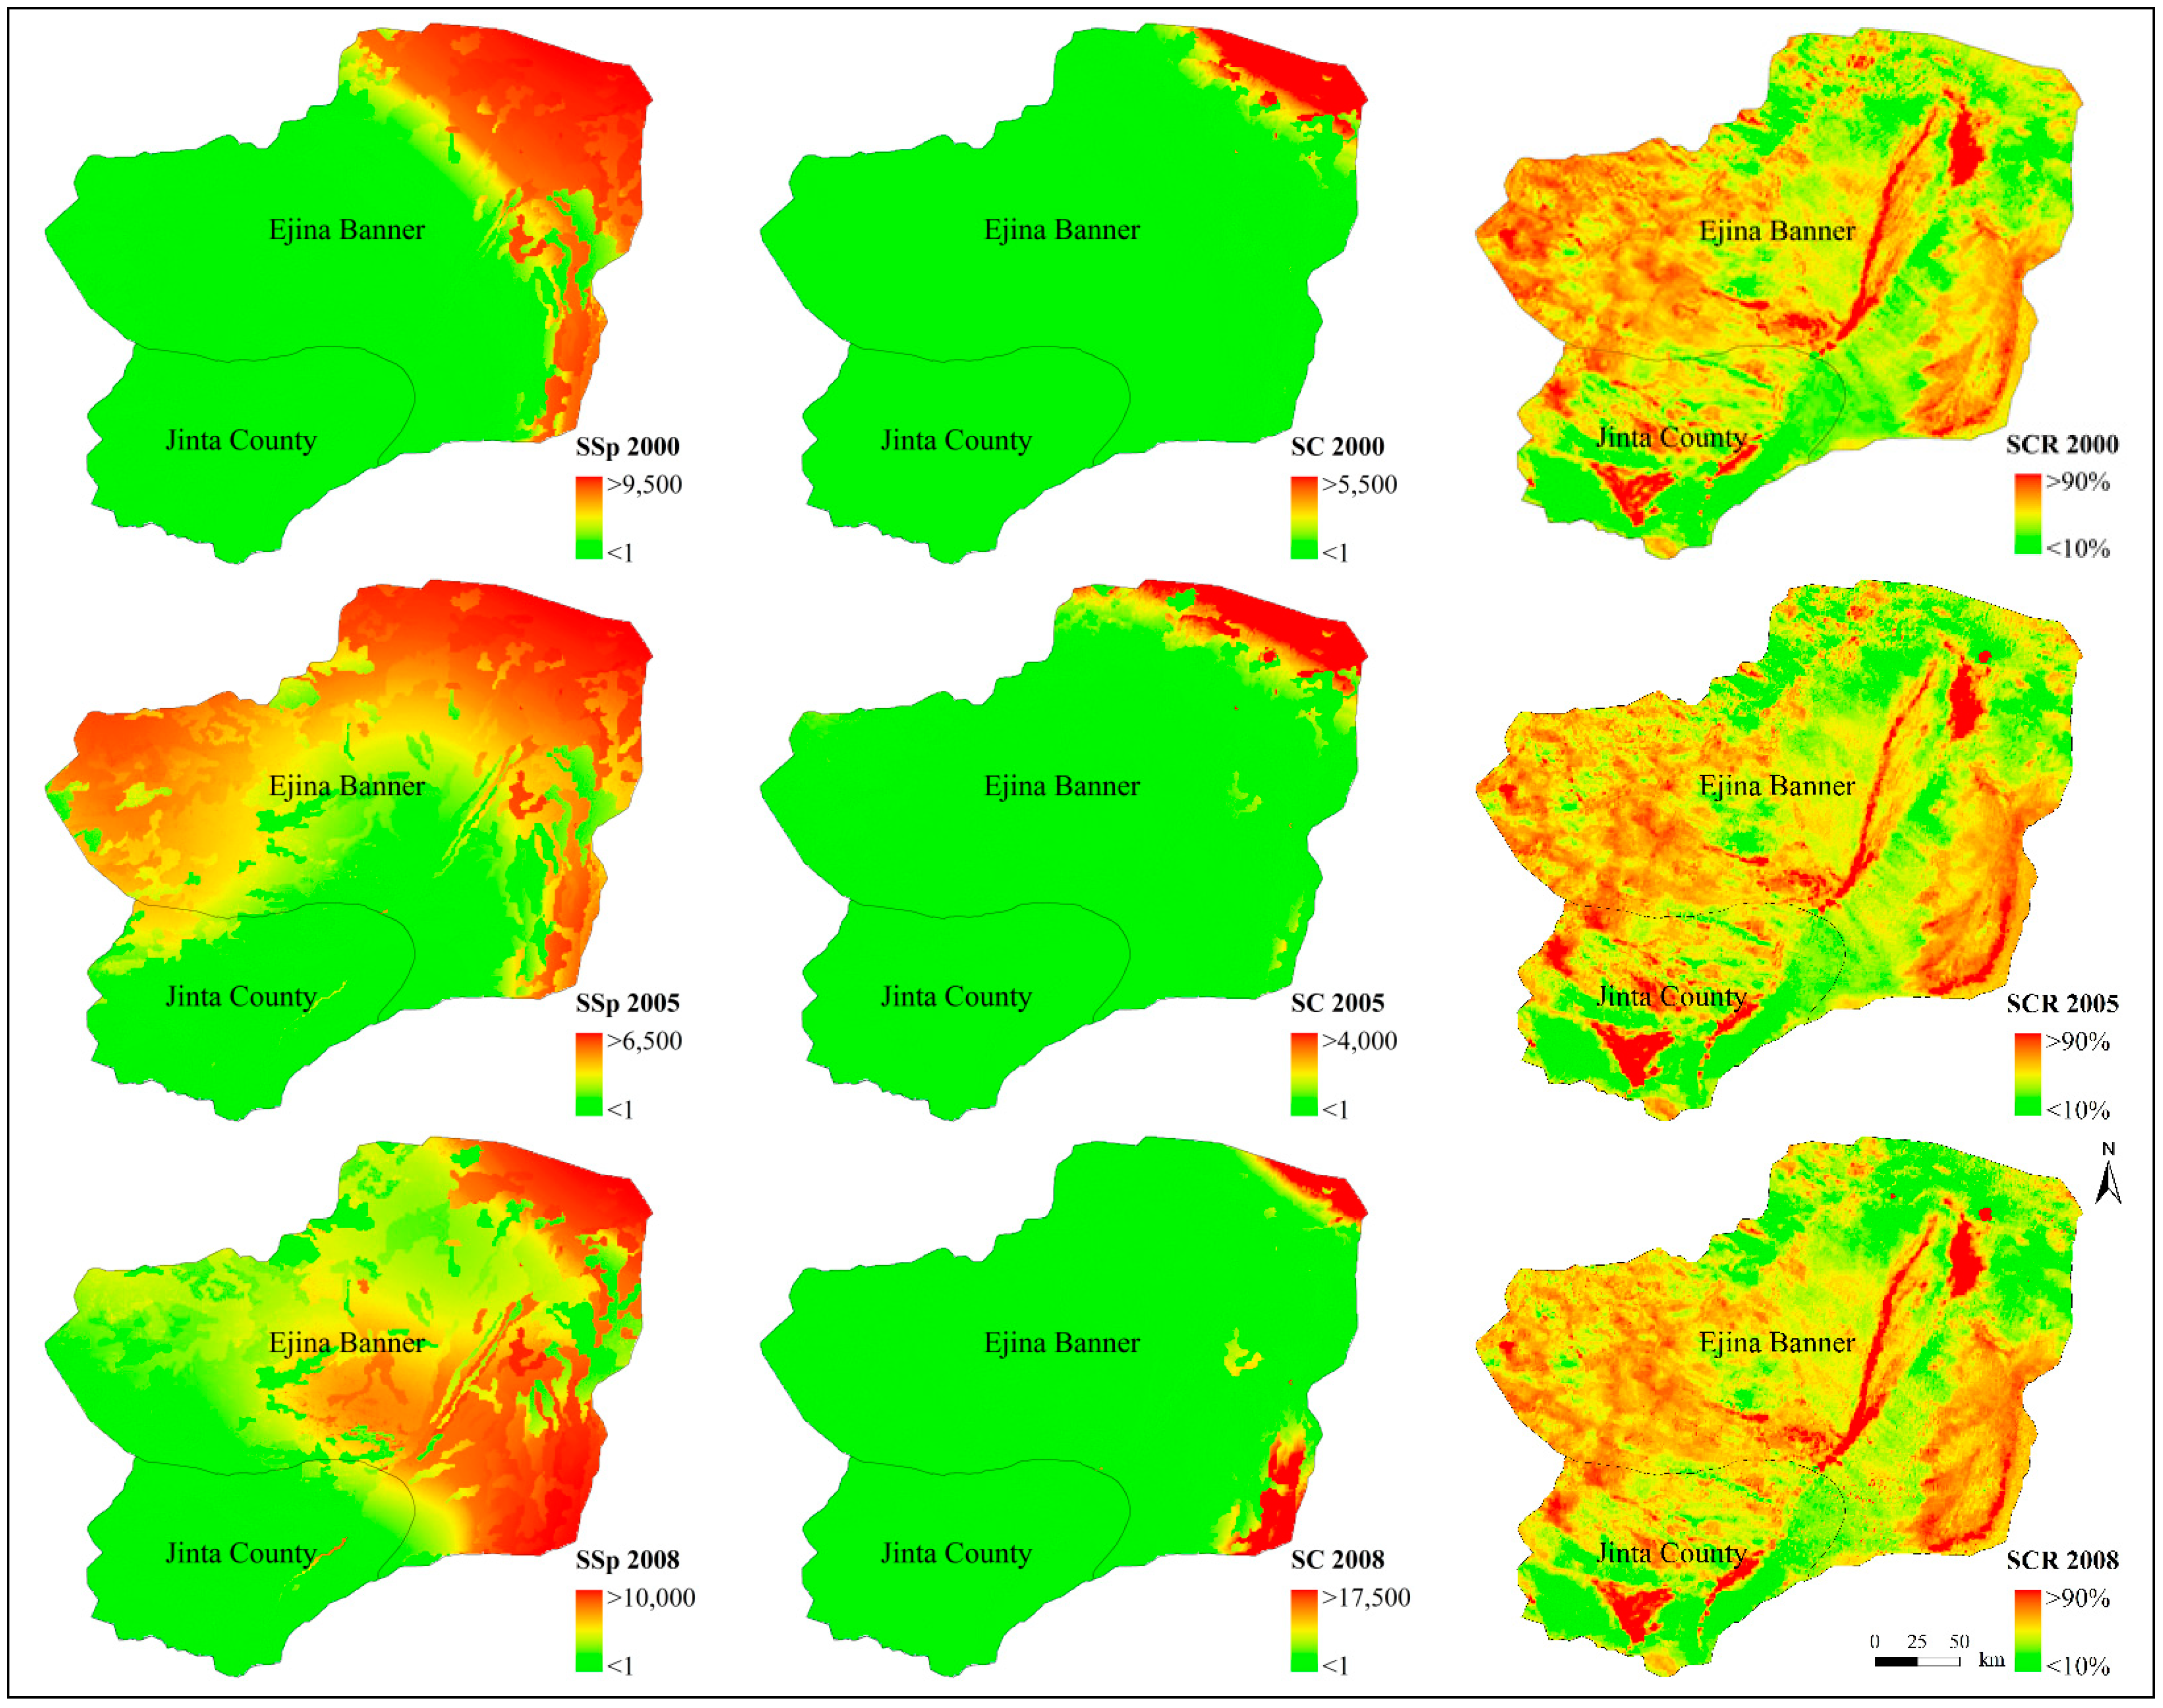
3.1. Spatiotemporal Variation of the Soil Conservation Amount

The results suggested that there was significant spatiotemporal variation of potential soil loss, soil conservation amount and soil conservation rate in the study area (Figure 2 and Figure 3). The annual soil conservation amount in the study area ranged between 0–8822 t km−2 a−1, with an average value of 75.47, 71.38 and 137.18 t km−2 a−1 in 2000, 2005 and 2008, respectively. Besides, the annual total soil conservation amount of the study area first decreased from approximately 5.80 million ton in 2000 to 5.4 million ton in 2005, but then increased to 10.55 million ton in 2008, showing significantinter-annual variation. In addition to the inter-annual variation, the soil conservation amount also showed obvious time-series variation at the monthly scale (Figure 2). The climax of the soil conservation amount occurred during March and May in 2000 and 2008 and during April and June in 2005, while there was very limited soil conservation in other months, indicating the soil conservation mainly occurred in the spring (Figure 2). There are frequently strong winds in the spring in the lower Heihe River Basin, which lead to the enormous increase of potential soil loss; what is worse, the vegetation coverage rate is generally very low in the spring when most vegetation just begins to grow, making the study area extremely susceptible to the wind erosion.
Figure 2. The monthly soil conservation amount (SC) (Unit: thousand ton) and ET (Unit: mm) in 2000, 2005 and 2008.
Sustainability 06 06250 g002
Although the soil conservation amount in the study area varied substantially across years, the overall spatial pattern of soil conservation was generally consistent during 2000–2008, with significant change only occurring in a few parts of the study area (Figure 3). Besides, the soil conservation amount was very low in most parts of the study area, and a high soil conservation amount only occurred in a few regions such as the northeast border region and the area near Gurinai Lake in the southeast border region. The soil conservation amount in the northeast border region showed an obvious decreasing gradient from the northeast to the southwest during 2000–2008, and the soil conservation amount in the southeast border region also showed an obvious decreasing gradient from the border part to the inner part in 2008. It is not surprising that the spatial pattern of the soil conservation amount is similar to that of the potential soil loss since the latter is the maximum of the former, but the soil conservation amount is also influenced by other factors such as the vegetation coverage rate. What is more, the soil conservation amount varied greatly among different land cover types. For example, the high soil conservation amount in 2008 occurred in the Gobi desert in the northeast border region, the water body over East Juyanhai Lake, the low-coverage grassland and sandy land in the southeast border region, where the vegetation coverage rate was generally low. The lowest soil conservation amount occurred in the Gobi desert near the southwest border, where both the vegetation coverage rate and potential soil loss were very low. It is somewhat surprising that the high soil conservation amount mainly occurred in the regions with the low vegetation coverage rate rather than the high vegetation coverage rate, indicating that the potential soil loss may have exerted more significant impacts on the soil conservation amount.
The soil conservation rate also showed significant spatial heterogeneity (Figure 3). The regions with the high soil conservation rate concentrated in the oases and irrigated areas along the main stream of Heihe River, where the vegetation coverage was in good conditions and the major land cover types included cultivated land, shrub forests, closed forest land and medium-coverage grassland. Besides, the soil conservation rate ranged between 2.62%–100% during 2000–2008, it first increased slightly during 2000–2005 and then decreased during 2005–2008, which is contrary to the change of the soil conservation amount. Although the average soil conservation rate was the highest in 2005, the soil conservation amount in 2005 was the lowest, indicating there were still some other factors that influenced the soil conservation amount, e.g., spatial heterogeneity of the potential soil loss. There was obvious spatial inconsistency between the potential soil loss and the soil conservation rate, which has significant impacts on the soil conservation amount, especially in the southwest part of the study area, where there was a large area of high-coverage vegetation. There was a high vegetation coverage rate in oases in the southwest part of the study area, but the potential soil loss is very low in this region, which leads to the extremely low soil conservation amount and fails to give full play to the potential of the high-coverage vegetation to reduce soil erosion. The soil conservation amount is influenced by the potential soil loss and the vegetation coverage rate, both of them generally show obvious spatial heterogeneity and consequently lead to the high location-dependence of the soil conservation amount, to which sufficient consideration should be given in ecosystem management.
Figure 3. The annual potential soil loss (SSp), annual soil conservation amount (SC) (Unit: t) and soil conservation rate (SCR) in 2000, 2005 and 2008.
Sustainability 06 06250 g003

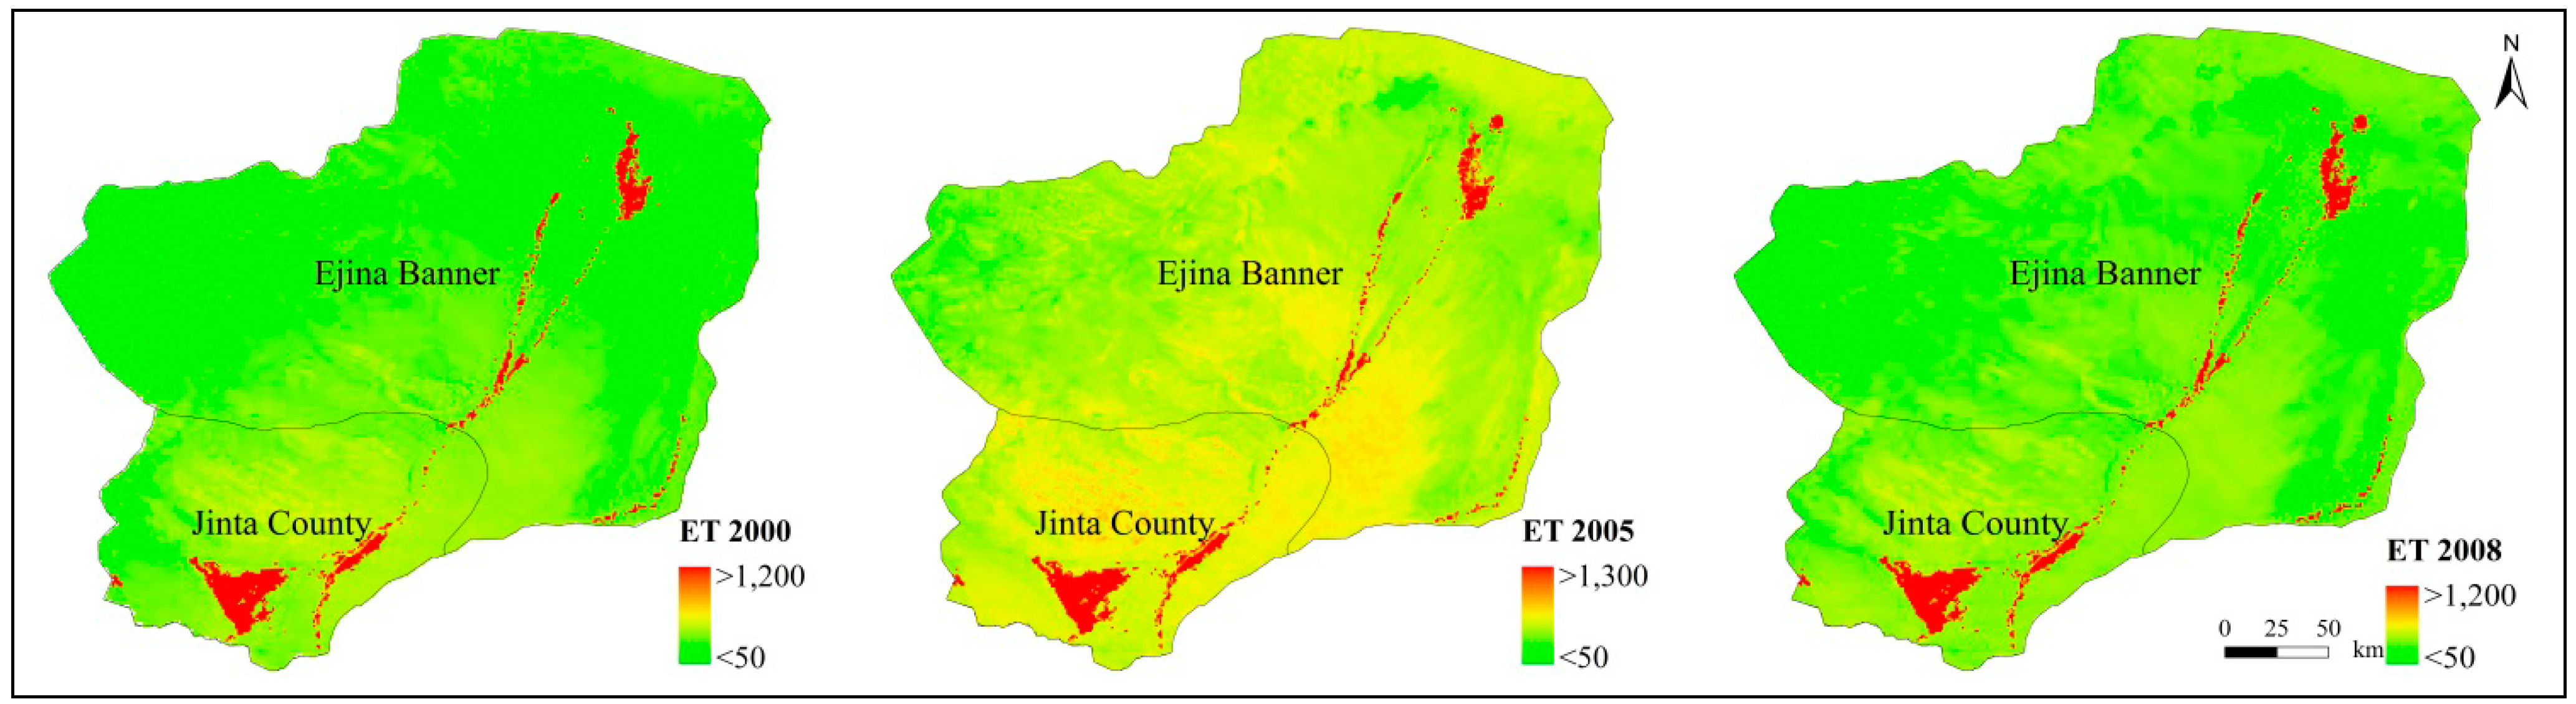
3.2. Spatiotemporal Variation of Evapotranspiration

The annual ET ranged between 12–1344 mm during 2000–2008, which showed significant spatial heterogeneity (Figure 4). It is very low in most part of the study area, where it generally ranged between 32–100 mm, and it is only high in the oases, East Juyanhai Lake and the regions along Heihe River. The highest ET was generally found in the forests, water body and irrigated croplands, while the lowest ET was found in the desert area and Gobi area. In particular, the highest ET in 2005 and 2008 occurred in the water body of East Juyanhai Lake, which reappeared in 2003. By comparison, ET was generally below 50 mm in the desert area, where the land surface is mainly covered by bare rock with sparse vegetation. There were widespread sandy land and Gobi desert in most part of the study area, where both the vegetation coverage rate and the water availability was very low. While thehigh-coverage vegetation such as the cultivated land and forests was generally distributed in the oases and the regions along the main stream of Heihe River, where there was high water availability. Besides, the annual ET first increased during the first half of the period (2000–2005), and then decreased after that, but the overall increase was significant in the entire study period. In addition, there was also obvious variation of the monthly ET, which was generally high during the growing season (from April to October) and low during the non-growing season (Figure 3). It is noticeable that there was obvious temporal inconsistency between the ET and the soil conservation amount (Figure 2). Most part of the ET occurred in the summer and autumn, while most part of the soil conservation amount concentrated in the spring, indicating only a part of the ET was used to provide the soil conservation service. What is more, since the precipitation of the study area is very limited (approximately 37 mm), it has very limited impacts on the change of ET, other factors such as the water diversion of Heihe River and land use and land cover change may have played a key role in influencing the spatiotemporal variation of ET.
Figure 4. Spatial pattern of the annual ET in 2000, 2005 and 2008.
Sustainability 06 06250 g004

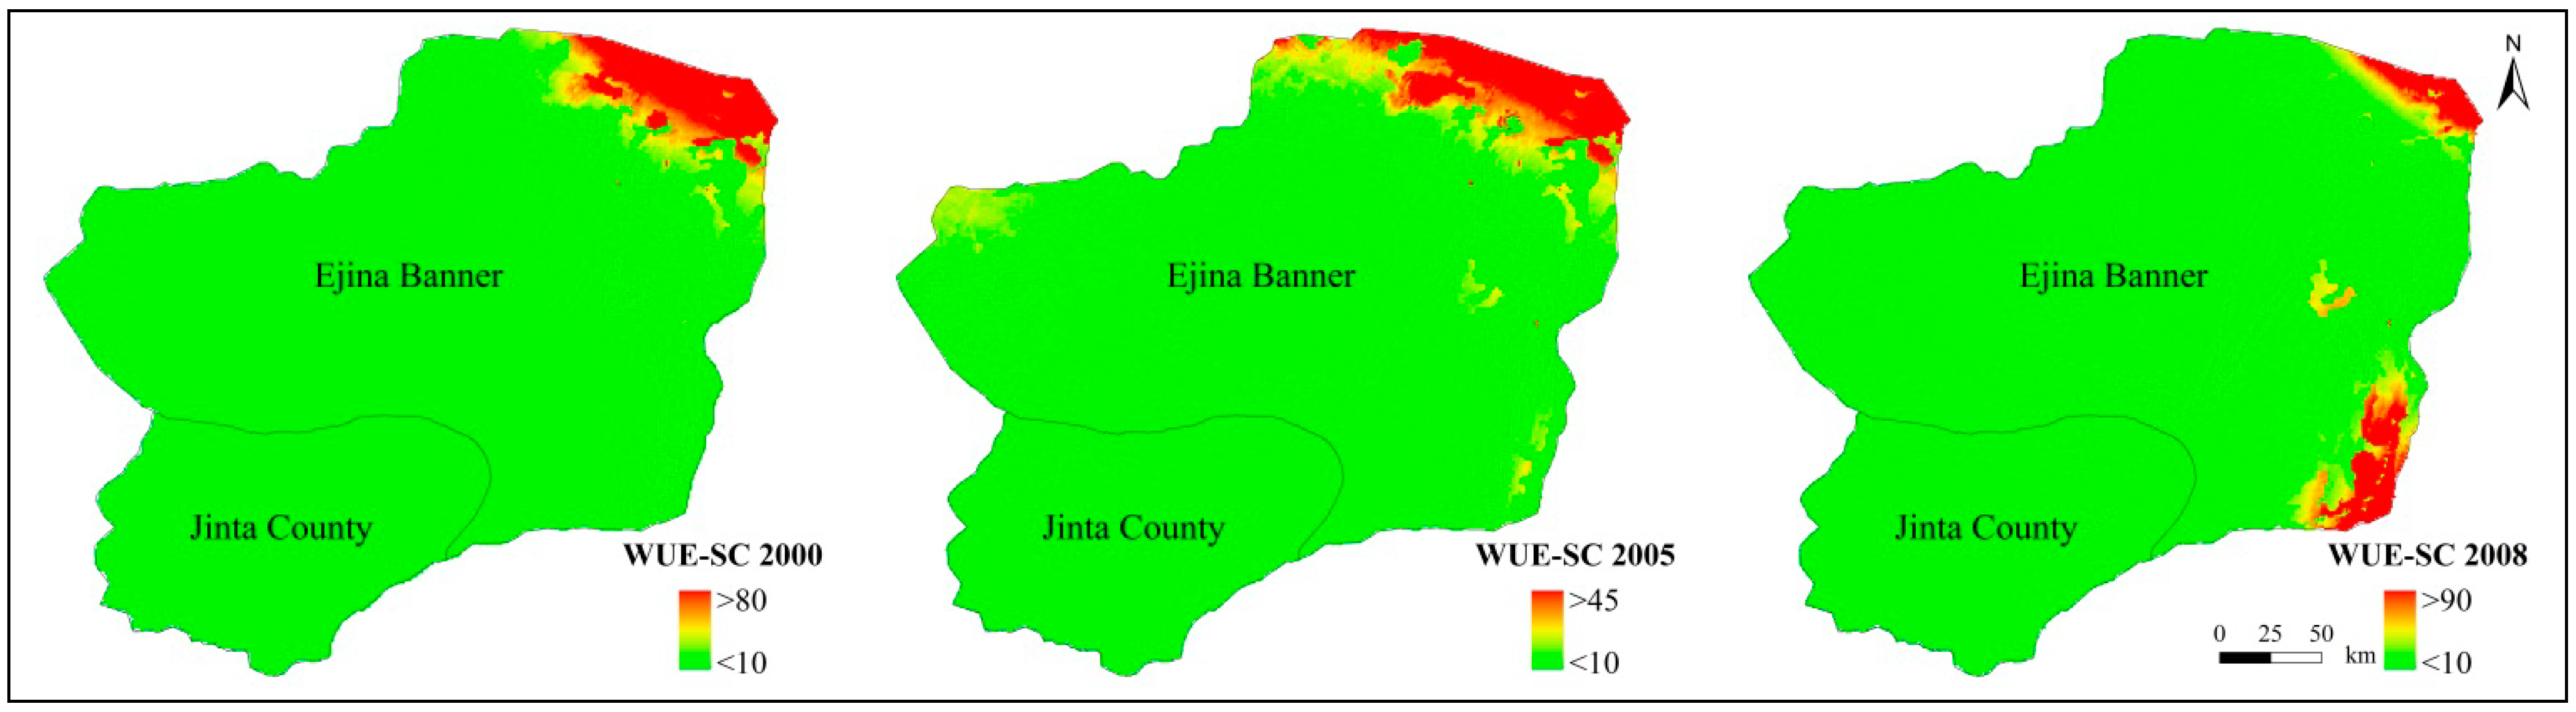
3.3. Spatiotemporal Variation of the Water Use Efficiency for Soil Conservation

The WUE-SC in the study area showed significant spatial heterogeneity and ranged between 0–98.69 t mm−1 during 2000–2008, indicating that approximately 98.69 t soil loss had been reduced by using 1 mm ET in a 1 km grid cell at most. The WUE-SC was below 1.00 t mm−1 in most part of the study area, and the regions with high WUE-SC mainly concentrated in the northeast part and southeast part of the study area, showing a spatial pattern similar to that of the soil conservation amount during 2000–2008. For example, the highest WUE-SC occurred in the low-coverage grassland and Gobi desert near the northeast broader region, low-coverage grassland, shrub forest and sandy land near the northeast broader region. The WUE-SC is also very high in the medium-coverage or low-coverage grassland in some part of Ejina Oasis. Besides, the average WUE-SC reached 1.10, 0.89, 1.68 t mm−1 in 2000, 2005 and 2008, respectively, which was very low on the whole and first decreased slightly and then increased during the study period (Figure 5). In addition, the spatial pattern of WUE-SC kept consistent in most part of the study area, but it changed significantly in some regions in the southeast part and northeast part during 2005–2008. The WUE-SC decreased by 1–37 t mm−1 in most regions in the northeast part of the study area, and it increased in only a few regions in the northeast part, with the increment showing a decreasing gradient from the broader to the inner part. In particular, the WUE-SC has decreased very obviously in the water body of East Juyanhai Lake, which has reappeared in 2003 due to the water diversion. By comparison, the WUE-SC increased significantly in the southeast part of the study area during 2005–2008, with an increment of 1–10 t mm−1 in the regions around Gurinai Lake, and even 10–97 t mm−1 in some parts near the southeast broader.
Figure 5. The water use efficiency for soil conservation (WUE-SC) in 2000, 2005 and 2008.
Sustainability 06 06250 g005
It has been reported that uneven changes in environmental factors can lead to spatially heterogeneous responses of WUE to environmental change [20], and this also applies to the WUE-SC (Figure 2). The average WUE-SC decreased by 19.09% during 2000–2005, and the average ET increased by 18.47%, while there was no significant change in the soil conservation amount (decreasing by 5.42%), indicating that the change in the WUE-SC was mainly due to the change in the ET during 2000–2005. The ET increased during 2000–2005 because more water had been allocated to the lower reach since the ecological water transfer project was implemented. In particular, East Juyanhai Lake near Ejina oasis reappeared in the year 2003, the water body of this lake greatly increasing the ET. By comparison, the average WUE-SC increased by 88.76% during 2005–2008, the ET only decreased by 3.89%, while the soil conservation amount increased by 82.15%, suggesting the change in the soil conservation amount made a great contribution to the increase of the average WUE-SC. Besides, there was no obvious change in the soil conservation rate during 2005–2008, which reached 57.36% and 55.98% in 2005 and 2008, respectively, indicating that the vegetation coverage change did not lead to significant change in the soil conservation amount. However, during 2005–2008 the potential soil loss increased remarkably by 88.76%, which led to the significant increase of the soil conservation amount and consequently an improvement in the average WUE-SC. In particular, the potential soil loss increased most obviously in the southeast part of the study area (Figure 2), which is close to Badain Jaran Desert, with an increment of 1000–5000t/km2 and an increment rate of 20%–50% in most parts of this region during 2005–2008. In this region, the wind speed increased significantly during 2005–2008; there is widespread sand that is very susceptible to wind erosion on the edge of Badain Jaran Desert, and even a slight increase of the wind speed may lead to significant increase of potential soil loss in this region. Although there was no significant change in the soil conservation rate and ET in this region, the remarkable increase in the potential soil loss evidenced the vegetation’s full capacity to reduce wind erosion, leading to a significant increase in the regional soil conservation amount and improvement of the overall WUE-SC of the study area. In summary, during 2000–2005, the ET increased since more water was allocated to the lower reach of the Heihe River Basin, while the wind speed increased significantly in the southeast part of the study area during 2005–2008, which led to the obvious increase of potential soil loss.
The overall low WUE-SC in the study area is mainly due to the spatiotemporal inconsistency between the potential soil loss and the vegetation coverage rate. For example, the vegetation coverage rate is very low in most part of the regions where the potential soil loss is high. Although ET is low in these regions and the soil conservation amount may be high, the soil conservation rate is generally very low, which indicates there is still some scope to increase the soil conservation amount and improve the WUE-SC. Besides, the potential soil loss is generally very low in the regions with a high vegetation coverage rate, especially in the western part of the study area, and the ability of the vegetation to reduce wind erosion in these regions is not fulfilled, and the high ET due to high vegetation coverage rate leads to an even lower WUE-SC. In addition, vegetation coverage is generally high in the summer and autumn, while the strong winds that lead to high potential soil loss mainly occur in the spring, and the temporal inconsistency between the vegetation coverage rate and the potential soil loss may also contribute to the low WUE-SC.

3.4. Uncertainties and Future Improvements

Since both wind erosion and evapotranspiration are very complex processes that are influenced by various interactive factors, it is very difficult to accurately estimate the soil conservation amount and ET, which inevitably leads to some uncertainties in the estimation results of the WUE-SC. First, this study has estimated the soil conservation amount with an experimental model, which may be not completely suitable for the lower Heihe River Basin, and it is necessary to adjust the model parameters according to field observation data in future research. Besides, the data accuracy also has great impacts on the estimation results of the WUE-SC, even if most of the model input data are from available data sources that have been validated. For example, the total soil conservation amount of the study area in this study (5.48–10.55 million ton) is much less than that in previous research (62.96 million) [46], but the average soil conservation rate in this study (55.32%–57.36%) is much higher than that in previous research (33.5%) [46]. On the one hand, this may be due to the inconsistency in the study area boundaries between previous study and this study, which may lead to some difference in the results. On the other hand, the wind velocity and the relative air humidity were set to be constant in previous research, which inevitably led to some bias in the estimation results. Although this study used the daily meteorological data from meteorological stations, which are very accurate, there may be still many uncertainties due to the data interpolation. In addition, the soil conservation amount in this study only involves the local soil erosion in the study area, and the sandstorms intercepted by the vegetation in the study area are not considered in this study, which may lead to underestimation of the soil conservation amount and consequently make the WUE-SC underestimated. For example, the Populus euphratica forests in Ejina Banner play an important role in intercepting sandstorms from Mongolia [50,51], but it is very difficult to accurately estimate the amount of intercepted sandstorms, which has not been considered in this study. What is more, the biological characteristics of vegetation with the same vegetation coverage rate may also influence the soil conservation amount and the WUE-SC, the role of which has not been considered in this study since there is still a lack of related long-term observation data, and therefore it is necessary to carry out more in-depth research with more field observation data in the future.

3.5. Suggestions to Management and Policy Makers

Although there are some uncertainties, the results of this study can still provide valuable reference information for water management and ecosystem management in the study area and other regions. A most important issue in sustainable land use is how to maintain the functioning of ecosystem processes and to ensure thereby the provision of ecosystem services, and it is necessary to enhance the water use efficiency to leave enough water in rivers to sustain ecosystems and meet the growing demands of cities and industries [11,52]. The results of this study, including the spatial patterns of the WUE-SC, potential soil loss, soil conservation amount and rate, can provide valuable reference information for the land use management and water management to improve the water use efficiency and balance the water availability and the provision of the soil conservation service. For example, the soil conservation service is highly location-dependent since it is influenced by the potential soil loss and the vegetation coverage rate, both of which generally show obvious spatial heterogeneity, and the results of this study show that there is high spatiotemporal inconsistency between the soil conservation rate and the potential soil loss, which may lead to the low overall soil conservation amount (Figure 2). All these results can provide significant reference information for increasing the provision of the soil conservation service. Besides, the high spatiotemporal inconsistency between potential soil loss and ET may lead to low WUE-SC. The high vegetation coverage rate can lead to a high soil conservation rate and high ET, but it does not always lead to a high soil conservation amount or high WUE-SC. The potential ability of the vegetation to reduce wind erosion can only be fulfilled in the regions with high potential soil loss. Therefore, it is very necessary to increase the soil conservation amount and improve WUE-SC by carrying out management measures such as adjustments to the spatial pattern of vegetation and water diversion, which can also be used to manipulate the balance of ecosystem services at the landscape scale [53]. In addition, natural resource management programs and land management decision making should consider the complex nature of trade-offs between ecosystem services [53,54]. It is especially necessary for local and regional ecosystem managers and policy makers to consider the balance between the water availability and provision of ecosystem services and coordinate trade-offs between different ecosystem services, the provision of which competes for increasingly scarce water resources [54,55].

4. Conclusions

This study estimated the soil conservation amount and the WUE-SC in the lower Heihe River Basin during 2000–2008. The results indicated that the WUE-SC first decreased and then increased on the whole during 2000–2008. Besides, the WUE-SC showed significant spatial heterogeneity and it was very low in most part of the study area where the main land cover type was unused land, and the high WUE-SC mainly occurred in the northeast and southeast part of the study area where the potential soil loss was high and the ET was low. In addition, the overall low WUE-SC was mainly due to spatiotemporal inconsistency between potential soil loss and vegetation coverage rate. What is more, the decrease of WUE-SC during 2000–2005 was mainly due to an increase in the ET, while the increase of WUE-SC during 2005–2008 was mainly attributed to a significant increase in potential soil loss. There are some uncertainties in the estimation results of soil conservation in this study, and it is necessary to carry out more in-depth research on the accurate estimation of WUE-SC. Nevertheless, the results of this study can still provide local and regional ecosystem managers with important reference information for improving ecosystem management to increase soil conservation amounts and improve water use efficiency. In particular, the spatiotemporal inconsistency between potential soil loss and vegetation coverage rates can provide valuable reference information for the improvement of water diversion and manipulation of the spatiotemporal pattern of vegetation coverage to improve WUE-SC.

Acknowledgments

This research was financially supported by the major research plan of the National Natural Science Foundation of China (Grant No. 91325302) and the Key Project funded by the National Key Programme for Developing Basic Science in China (Grant No. 2010CB950900), data support from Heihe Plan Science Data Center is also greatly appreciated.

Author Contributions

Haiming Yan made substantial contributions to the acquisition of data, analysis and interpretation of the data and drafting and revising the article; Jinyan Zhan made substantial contributions to the concept and design of the article, helped to revise the manuscript, and produced the final approval of the version; Bing Liu provided good advices throughout the paper, and contributed to the manuscript revisions; and Yongwei Yuan made substantial contributions to the acquisition and analysis of data.

Conflicts of Interest

The authors declare no conflict of interest.

References

  1. Saue, T.; Kadaja, J. Water limitations on potato yield in Estonia assessed by crop modelling. Agr. Forest Meteorol. 2014, 194, 20–28. [Google Scholar] [CrossRef]
  2. Rockström, J.; Gordon, L. Assessment of green water flows to sustain major biomes of the world: Implications for future ecohydrological landscape management. Phys. Chem. Earth. 2001, 26, 843–851. [Google Scholar]
  3. Klik, A.; Eitzinger, J. Impact of climate change on soil erosion and the efficiency of soil conservation practices in Austria. J. Agr. Sci. 2010, 148, 529–541. [Google Scholar]
  4. Deng, X.Z.; Huang, J.K.; Rozelle, S.; Uchida, E. Growth, population and industrialization, and urban land expansion of China. J. Urban Econ. 2008, 63, 96–115. [Google Scholar]
  5. Yang, Y.T.; Shang, S.H.; Jiang, L. Remote sensing temporal and spatial patterns of evapotranspiration and the responses to water management in a large irrigation district of North China. Agr. Forest Meteorol. 2012, 164, 112–122. [Google Scholar]
  6. Vörösmarty, C.J.; Green, P.; Salisbury, J.; Lammers, R.B. Global water resources: Vulnerability from climate change and population growth. Science 2000, 289, 284–288. [Google Scholar]
  7. Wagner, P.; Kumar, S.; Schneider, K. An assessment of land use change impacts on the water resources of the Mula and Mutha Rivers catchment upstream of Pune, India. Hydrol. Earth Syst. Sci. 2013, 10, 1943–1985. [Google Scholar]
  8. Gober, P. Desert urbanization and the challenges of water sustainability. Curr. Opin. Env. Sust. 2010, 2, 144–150. [Google Scholar]
  9. Zhang, Q.; Singh, V.P.; Sun, P.; Chen, X.; Zhang, Z.X.; Li, J.F. Precipitation and streamflow changes in China: Changing patterns, causes and implications. J. Hydrol. 2011, 410, 204–216. [Google Scholar]
  10. Deng, X.P.; Shan, L.; Zhang, H.P.; Turner, N.C. Improving agricultural water use efficiency in arid and semiarid areas of China. Agr. Water Manag. 2006, 80, 23–40. [Google Scholar]
  11. Molden, D.; Oweis, T.; Steduto, P.; Bindraban, P.; Hanjra, M.A.; Kijne, J. Improving agricultural water productivity: Between optimism and caution. Agr. Water Manag. 2010, 97, 528–535. [Google Scholar]
  12. Xiao, H.L.; Cheng, G.D. Water issue and management at basin level in Heihe River, Northwestern China. J. Desert Res. 2006, 26, 1–5. (In Chinese) [Google Scholar]
  13. Feng, Q.; Cheng, G.D.; Endo, K.N. Towards sustainable development of the environmentally degraded River Heihe basin, China. Hydrolog. Sci. J. 2001, 46, 647–658. [Google Scholar] [CrossRef]
  14. Wu, Z.T.; Wu, J.J.; Liu, J.H.; He, B.; Lei, T.J; Wang, Q.F. Increasing terrestrial vegetation activity of ecological restoration program in the Beijing–Tianjin Sand Source Region of China. Ecol. Eng. 2013, 52, 37–50. [Google Scholar] [CrossRef]
  15. Xi, H.Y.; Feng, Q.; Si, J.H.; Chang, Z.Q.; Cao, S.K. Impacts of river recharge on groundwater level and hydrochemistry in the lower reaches of Heihe River Watershed, northwestern China. Hydrogeol. J. 2010, 18, 791–801. [Google Scholar]
  16. Ji, X.B.; Kang, E.; Chen, R.S.; Zhao, W.Z.; Zhang, Z.H.; Jin, B. The impact of the development of water resources on environment in arid inland river basins of Hexi region, Northwestern China. Environ. Geol. 2006, 50, 793–801. [Google Scholar]
  17. Hillel, D. Small-Scale Irrigation for Arid Zones: Principles and Options; FAO: Rome, Italy, 1997. [Google Scholar]
  18. Koschke, L.; Lorz, C.; Fürst, C.; Lehmann, T.; Makeschin, F. Assessing hydrological and provisioning ecosystem services in a case study in Western Central Brazil. Ecol. Process. 2014, 3, 1–15. [Google Scholar]
  19. Faramarzi, M.; Yang, H.; Schulin, R.; Abbaspour, K.C. Modeling wheat yield and crop water productivity in Iran: Implications of agricultural water management for wheat production. Agr. Water Manag. 2010, 97, 1861–1875. [Google Scholar]
  20. Tian, H.Q.; Chen, G.S.; Liu, M.L.; Zhang, C.; Sun, G.; Lu, C.Q.; Xu, X.F.; Ren, W.; Pan, S.; Chappelka, A. Model estimates of net primary productivity, evapotranspiration, and water use efficiency in the terrestrial ecosystems of the southern United States during 1895–2007. Forest Ecol. Manag. 2010, 259, 1311–1327. [Google Scholar]
  21. Millennium Ecosystem Assessment. Millennium Ecosystem Assessment Synthesis Report; Island Press: Washington, DC, USA, 2005. [Google Scholar]
  22. Xu, Z.G.; Xu, J.T.; Deng, X.Z.; Huang, J.K.; Uchida, E.; Rozelle, S. Grain for green versus grain: conflict between food security and conservation set-aside in China. World Dev. 2006, 34, 130–148. [Google Scholar]
  23. Prato, T. Multiple attribute decision analysis for ecosystem management. Ecol. Econ. 1999, 30, 207–222. [Google Scholar]
  24. Nelson, E.; Mendoza, G.; Regetz, J.; Polasky, S.; Tallis, H.; Cameron, D.; Chan, K.M.; Daily, G.C.; Goldstein, J.; Kareiva, P.M. Modeling multiple ecosystem services, biodiversity conservation, commodity production, and tradeoffs at landscape scales. Front. Ecol. Environ. 2009, 7, 4–11. [Google Scholar]
  25. Sutton, P.C.; Costanza, R. Global estimates of market and non-market values derived from nighttime satellite imagery, land cover, and ecosystem service valuation. Ecol Econ. 2002, 41, 509–527. [Google Scholar]
  26. Spangenberg, J.H.; Settele, J. Precisely incorrect? Monetising the value of ecosystem services. Ecol. Complex. 2010, 7, 327–337. [Google Scholar]
  27. Fürst, C.; Frank, S.; Witt, A.; Koschke, L.; Makeschin, F. Assessment of the effects of forest land use strategies on the provision of ecosystem services at regional scale. J. Environ. Manag. 2013, 127 (Suppl.), S96–S116. [Google Scholar] [CrossRef]
  28. Shi, N.N.; Zhan, J.Y.; Wu, F.; Du, J.F. Identification of the core ecosystem services and their spatial heterogeneity in Poyang Lake area. Front. Earth Sci. Prc. 2009, 3, 214–220. [Google Scholar]
  29. Courault, D.; Seguin, B.; Olioso, A. Review on estimation of evapotranspiration from remote sensing data: From empirical to numerical modeling approaches. Irrig. Drainage Syst. 2005, 19, 223–249. [Google Scholar]
  30. Miralles, D.; Holmes, T.; de Jeu, R.; Gash, J.; Meesters, A.; Dolman, A. Global land-surface evaporation estimated from satellite-based observations. Hydrol. Earth Syst. Sc. 2011, 7, 8479–8519. [Google Scholar]
  31. Mu, Q.Z.; Zhao, M.S.; Running, S.W. Improvements to a MODIS global terrestrial evapotranspiration algorithm. Remote Sens. Environ. 2011, 115, 1781–1800. [Google Scholar]
  32. Araya, T.; Cornelis, W.; Nyssen, J.; Govaerts, B.; Gebregziabher, T.; Oicha, T.; Getnet, F.; Raes, D.; Haile, M.; Sayre, K. Impact of Conservation Agriculture on Runoff, Soil Loss and Crop Yield on a Vertisol in the Northern Ethiopian Highlands, Proceedings of 19th World Congress of Soil Science: Soil Solutions for a Changing World, Brisbane, Australia, 1–6 August 2010.
  33. Fu, B.J.; Liu, Y.; Lü, Y.H.; He, C.S.; Zeng, Y.; Wu, B.F. Assessing the soil erosion control service of ecosystems change in the Loess Plateau of China. Ecol. Complex. 2011, 8, 284–293. [Google Scholar]
  34. Wu, F.; Deng, X.Z.; Yin, F.; Yuan, Y.W. Projected changes of grassland productivity along the representative concentration pathways during 2010–2050 in China. Adv Meteorol. 2013. [Google Scholar] [CrossRef]
  35. Hudson, N.W. Soil and Water Conservation in Semi-Arid Areas; FAO: Rome, Italy, 1987. [Google Scholar]
  36. Dong, Z.B. Establishing Statistic Model of Wind Erosion on Small Watershed Basis. Bull. Soil Water Conserv. 1998, 18, 55–62. (In Chinese) [Google Scholar]
  37. Chen, W.N.; Dong, Z.B.; Li, Z.S.; Yang, Z.T. Wind tunnel test of the influence of moisture on the erodibility of loessial sandy loam soils by wind. J. Arid Environ. 1996, 34, 391–402. [Google Scholar]
  38. Ta, W.Q.; Dong, Z.B.; Caidan, S. Effect of the 1950s large-scale migration for land reclamation on spring dust storms in Northwest China. Atmos. Environ. 2006, 40, 5815–5823. [Google Scholar]
  39. Lü, P.; Dong, Z.B. The dependency of sand transport rate by wind on the atmospheric stability: A numerical simulation. Geomorphology 2008, 99, 296–301. [Google Scholar]
  40. Singh, R.; Garg, K.K.; Wani, S.P.; Tewari, R.K.; Dhyani, S.K. Impact of water management interventions on hydrology and ecosystem services in Garhkundar-Dabar watershed of Bundelkhand region, Central India. J. Hydrol. 2014, 509, 132–149. [Google Scholar] [Green Version]
  41. Oki, T.; Kanae, S. Global hydrological cycles and world water resources. Science 2006, 313, 1068–1072. [Google Scholar]
  42. Burba, G.G.; Verma, S.B. Seasonal and interannual variability in evapotranspiration of native tallgrass prairie and cultivated wheat ecosystems. Agr. Forest Meteorol. 2005, 135, 190–201. [Google Scholar]
  43. Mardikis, M.; Kalivas, D.; Kollias, V. Comparison of interpolation methods for the prediction of reference evapotranspiration—An application in Greece. Water Resour. Manag. 2005, 19, 251–278. [Google Scholar]
  44. Wu, F.; Zhan, J.Z; Yan, H.M.; Shi, C.C.; Huang, J. Land cover mapping based on multisource spatial data mining approach for climate simulation: A case study in the farming-pastoral ecotone of North China. Adv Meteorol. 2013. [Google Scholar] [CrossRef]
  45. Nachtergaele, F.; van Velthuizen, H.; Verelst, L.; Batjes, N.; Dijkshoorn, K.; van Engelen, V.; Fischer, G.; Jones, A.; Montanarella, L.; Petri, M. Harmonized World Soil Database; FAO: Rome, Italy; IIASA: Laxenburg, Austria, 2008. [Google Scholar]
  46. Han, Y.W.; Tuo, X.S.; Gao, J.X.; Liu, C.C.; Gao, X.T. Assessment on the Sand-fixing Function and Its Value of the Vegetation in Eco-function Protection Areas of the Lower Reaches of the Heihe River. J. Nat. Resour. 2011, 26, 58–65. (In Chinese) [Google Scholar]
  47. Li, J.; Jie, Z. The cloud-free NDVI data from 2001 to 2011 in the Heihe River Basin. Heihe Plan Sci. Data Cent. 2013. [Google Scholar] [CrossRef]
  48. Wu, B.; Yan, N.; Xiong, J.; Bastiaanssen, W.G.M.; Zhu, W.; Stein, A. Validation of ETWatch using field measurements at diverse landscapes: A case study in Hai Basin of China. J. Hydrol. 2012, 436–437, 67–80. [Google Scholar]
  49. Deng, X.Z.; Huang, J.K.; Rozelle, S.; Uchida, E. Growth, population and industrialization, and urban land expansion of China. J. Urban Econ. 2008, 63, 96–115. [Google Scholar]
  50. Hou, L.G.; Xiao, H.L.; Si, J.H.; Xiao, S.C.; Zhou, M.X.; Yang, Y.G. Evapotranspiration and crop coefficient of Populus euphratica Oliv forest during the growing season in the extreme arid region northwest China. Agr. Water Manag. 2010, 97, 351–356. [Google Scholar]
  51. Qi, S.Z.; Luo, F. Land-use change and its environmental impact in the Heihe River Basin, arid northwestern China. Environ. Geol. 2006, 50, 535–540. [Google Scholar]
  52. Batchelor, C. Improving water use efficiency as part of integrated catchment management. Agr. Water Manag. 1999, 40, 249–263. [Google Scholar]
  53. Yapp, G.; Walker, J.; Thackway, R. Linking vegetation type and condition to ecosystem goods and services. Ecol. Complex. 2010, 7, 292–301. [Google Scholar]
  54. Shi, Z.H.; Ai, L.; Fang, N.F.; Zhu, H.D. Modeling the impacts of integrated small watershed management on soil erosion and sediment delivery: A case study in the Three Gorges Area, China. J. Hydrol. 2012, 438, 156–167. [Google Scholar]
  55. Shi, Z.H.; Cai, C.F.; Ding, S.W.; Wang, T.W.; Chow, T.L. Soil conservation planning at the small watershed level using RUSLE with GIS: A case study in the Three Gorge Area of China. Catena 2004, 55, 33–48. [Google Scholar]

