Article

Estimation of Real-Time Flood Risk on Roads Based on Rainfall Calculated by the Revised Method of Missing Rainfall

1
Interdisciplinary Program of Information Systems, Pukyong National University, Busan, Korea
2
Department of Computer Science and Engineering, University of Colorado Denver, Denver, CO 80204, USA
3
Department of IT Convergence and Application Engineering, Pukyong National University, Busan, Korea
*
Author to whom correspondence should be addressed.
These authors contributed equally to this work.
Sustainability 2014, 6(9), 6418-6431; https://doi.org/10.3390/su6096418
Submission received: 11 July 2014 / Revised: 22 August 2014 / Accepted: 9 September 2014 / Published: 18 September 2014
(This article belongs to the Special Issue Ubiquitous Green IT System for Sustainable Computing)

Abstract

:
Recently, flood damage by frequent localized downpours in cities is on the increase on account of abnormal climate phenomena and the growth of impermeable areas due to urbanization. This study suggests a method to estimate real-time flood risk on roads for drivers based on the accumulated rainfall. The amount of rainfall of a road link, which is an intensive type, is calculated by using the revised method of missing rainfall in meteorology, because the rainfall is not measured on roads directly. To process in real time with a computer, we use the inverse distance weighting (IDW) method, which is a suitable method in the computing system and is commonly used in relation to precipitation due to its simplicity. With real-time accumulated rainfall, the flooding history, rainfall range causing flooding from previous rainfall information and frequency probability of precipitation are used to determine the flood risk on roads. The result of simulation using the suggested algorithms shows the high concordance rate between actual flooded areas in the past and flooded areas derived from the simulation for the research region in Busan, Korea.

1. Introduction

The frequency and intensity of natural disasters are increasing due to global warming and climate change. Even if the related technique for weather forecasting is very developed, flooding damage from localized torrential rain and typhoons, due to climate change and the growth of impermeable areas by urbanization, is not shrinking in the world. Most cities have important infrastructures, such as roads, and they also have high population densities. For this reason, cities are severely damaged if inundation occurs in the cities. As a typical example, the torrential rain that poured in Seoul, Korea, between 26 July 2011 and 27 July 2011, caused 62 deaths and resulted in 980 flood victims and 19,215 inundated homes, according to official figures [1].
Because of repeated flood damage like this, many studies in the world are being conducted regarding methods that can be used to reduce flood damage and establish proper countermeasures. In this study, we are focused on flooding on roads, which is the basis of all means of transportation.
Many researchers are engaged in studies relating to flooding. Research on the development of a flood risk index is representative of these kinds of studies. The flood risk index was originally developed for an indicator, which is analysis of the death toll by flooding. Today, the flood risk index has been used as a criterion to give priority for solving flood damage. It has established the set-up for flood prevention measuring in many countries. Many international organizations, including OECD (Organization for Economic Cooperation and Development), UNDP (United Nations Development Program), UNCSD (United Nations Commission on Sustainable Development) and UNEP (United Nations Environment Program), have developed the risk assessment index for natural disasters, such as flooding, and have given the risk information to each country. These risk indexes are used to help Third World countries by offering assistance from the UN [2]. Furthermore, many countries are heavily invested to establishing ways to prepare for floods at a government level. In particular, Japan faces the most danger for natural disasters, such as earthquakes and typhoons. The government of Japan developed a flood vulnerability index and uses it to establish flood prevention measures. Many scholars abroad have had their research related to flood risk published. Connor and Hiroki proposed a method for assessing flood vulnerability caused by climate change in order to help make decisions for structural and non-structural countermeasures to reduce flood vulnerability [3]. Birkmann proposed a strategy to reduce the vulnerability of flooding by analyzing factors for environmental, social and economic risk [4].
However, a flood risk index should be comprised not of national factors, but rather of local factors, because regional characteristics can affect the type of flooding that occurs in a particular area. In other words, it is hard to apply the flood risk index of one country to another country, because flooding is affected by regional characteristics. Many studies are being carried out regarding the flood risk in Korea, which is the object of this study. Similarly to the government of Japan, in Korea, the potential flood damage concept was introduced in the Water Vision 2020, which was planned by the Ministry of Land, Transport and Maritime Affairs (MLTMN). In this concept, the flood risk index is calculated based on the possibility of damage for each region [5]. Lim et al. [2] suggested a method to define and apply an appropriate index that can measure the risk of regional flood damage and used the pressure-state-response structure to develop the flood risk index. Kim et al. [6] quantitatively analyzed the severity of flash floods by estimation of a flash flood index from probability rainfall data in a test basin. Jo et al. [7] developed a new flood index that measures the severity of floods in small ungauged catchments for use in local flood predictions by regression analysis between the new flood index and rainfall patterns.
Looking into previous research, most of the studies are about flood preparation for large units, such as a city or a large basin. There is a lack of research on sudden local flooding for a small area (unit), which has occurred with higher frequency recently [7].
Todays, research on a real-time system is trending in computer science, and studies for automation and real-time systems are being carried out in many areas, such as e-Learning [8], e-Meeting [9], GPS [10,11], and so on. Accordingly, we are interested in estimating rainfall in real time for a specific location, not a given time period.
The ultimate goal of this study is to develop a flood risk index of an intensive type targeted at roads as a part of a study about sudden local flooding. To calculate the real-time accumulated rainfall, which is a decisive factor of the flood risk index on a road link, the inverse distance weighting method (IDW) is used along with the real-time accumulated rainfall observed directly at the Automatic Weather System (AWS) and updated in real time through the web. In addition to this factor, the flooding history of roads, the rainfall range causing flooding, calculated from accumulated rainfall information when flooding has arisen in the past, and standard frequency probability precipitation for road design are selected as factors to determine the flood risk index for roads.

2. Factors for Road Flood Risk Index

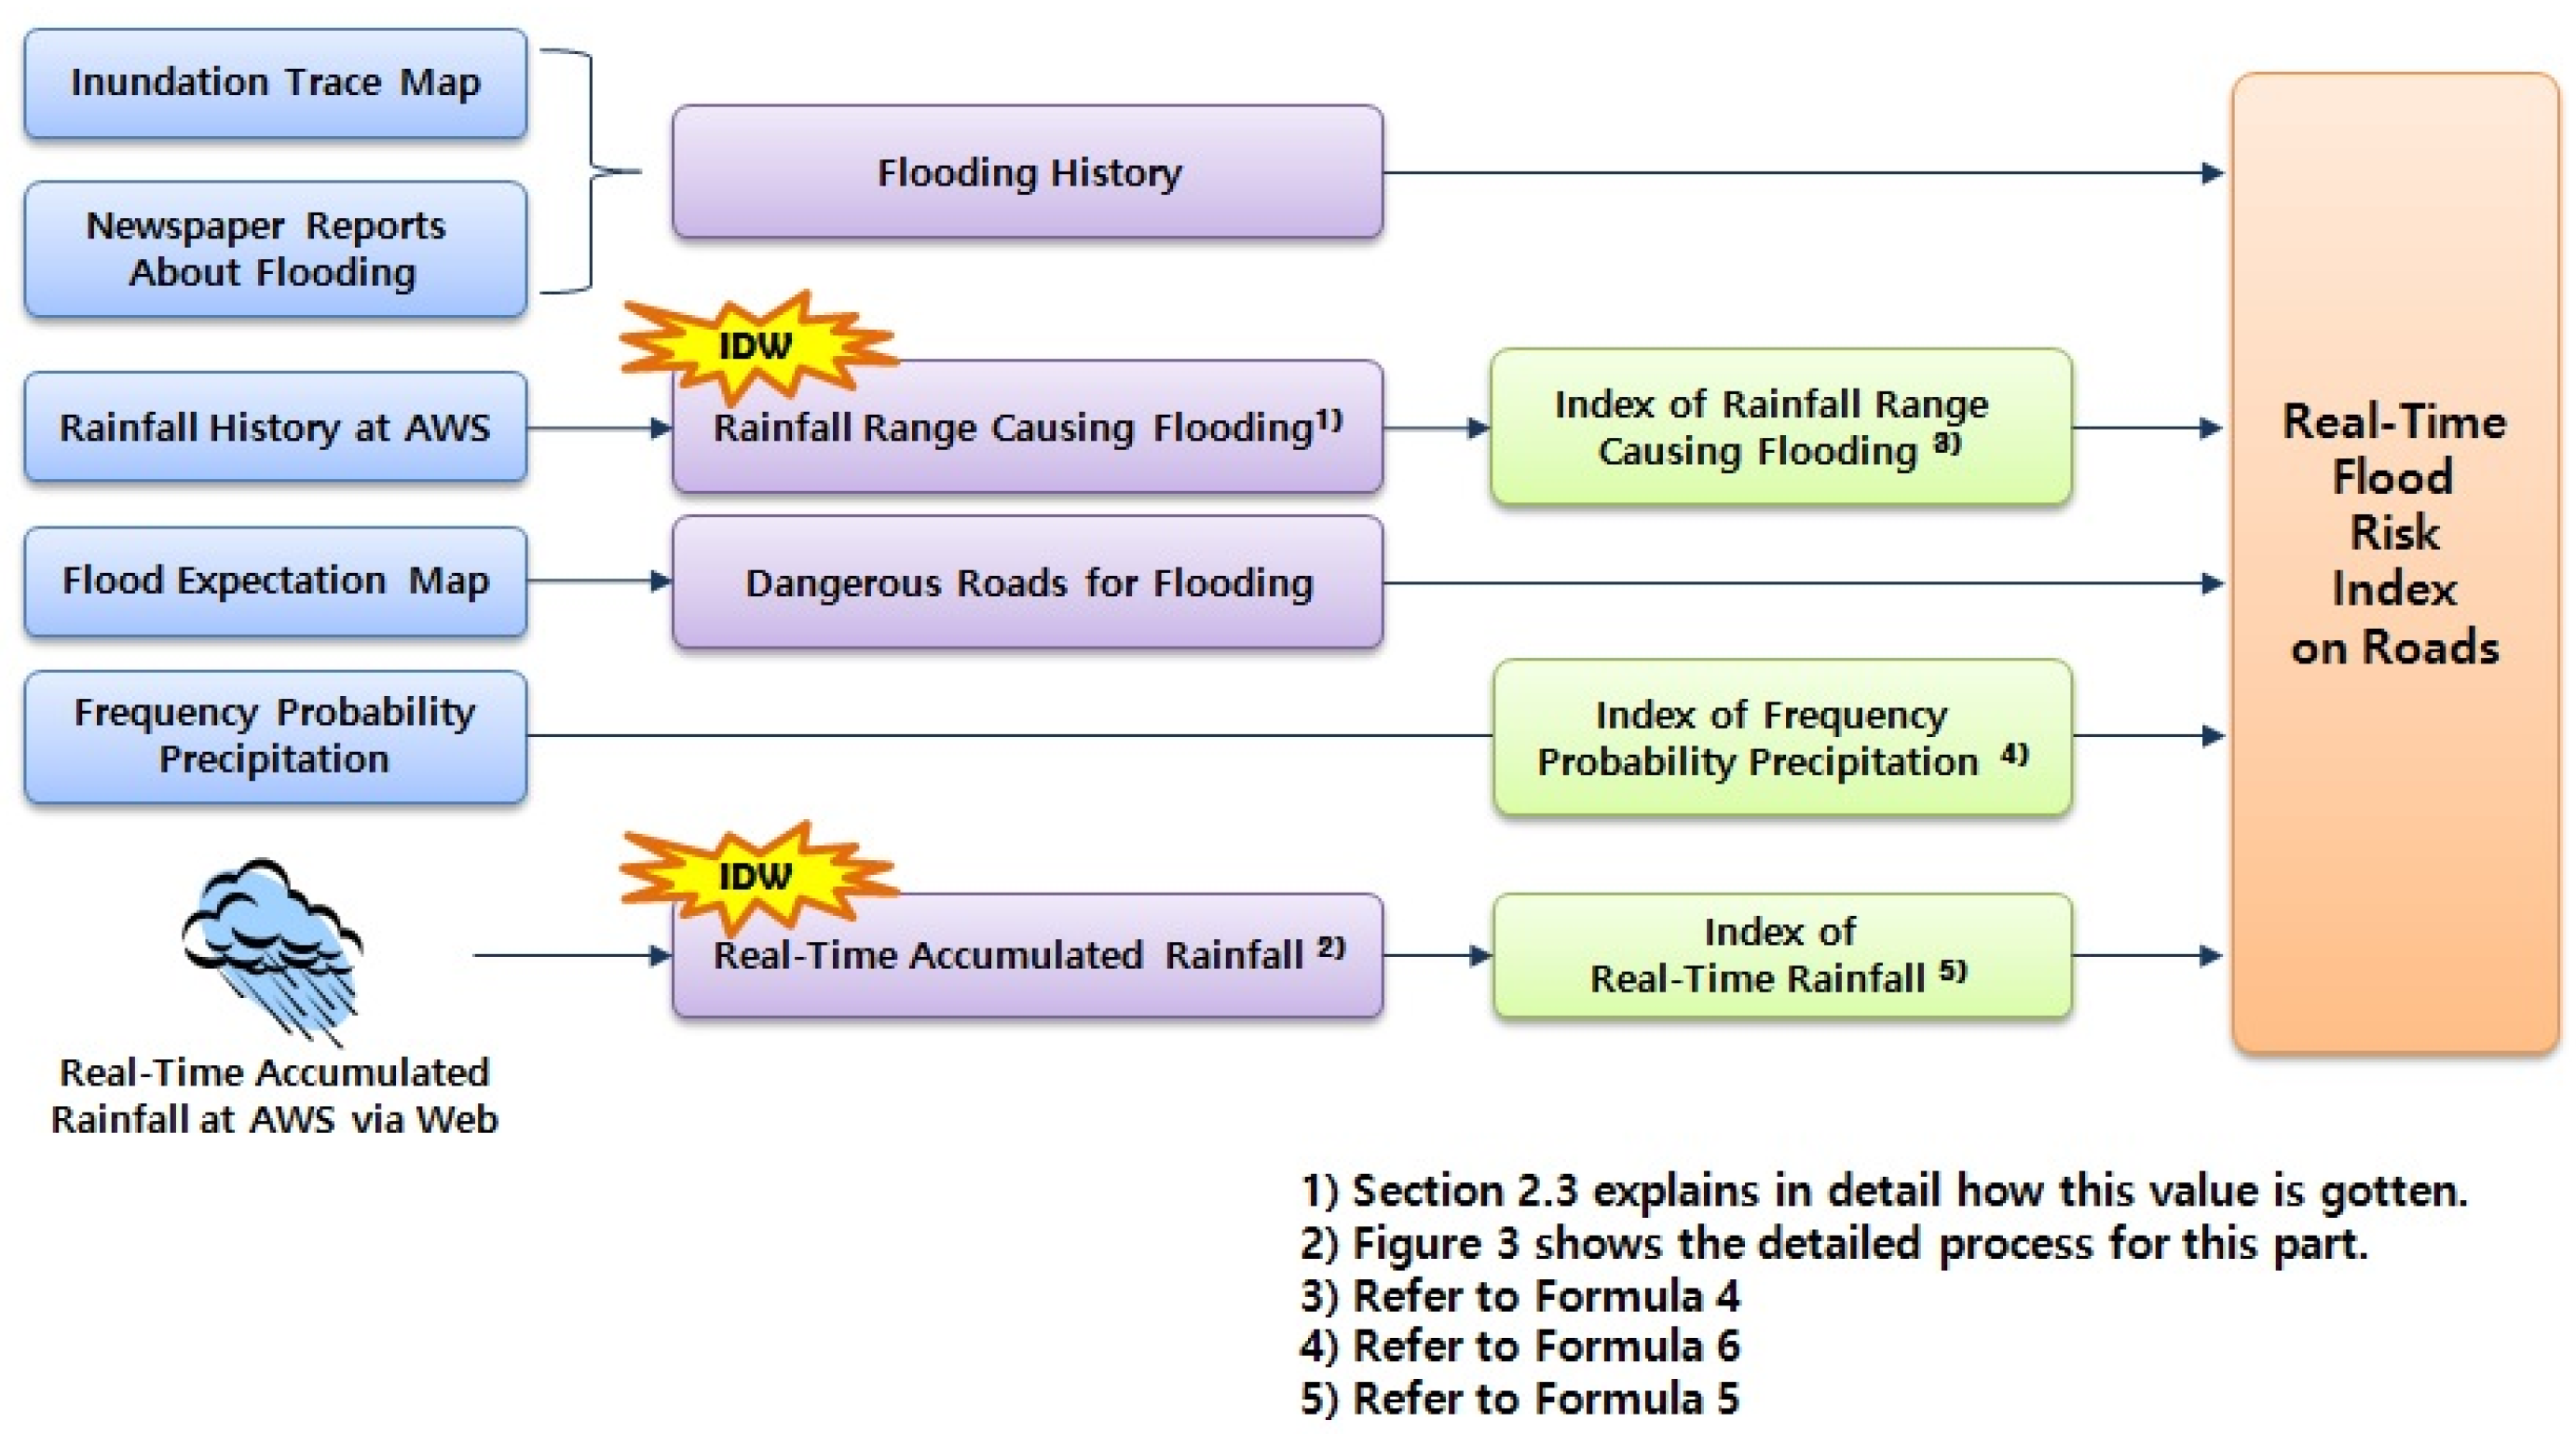
2.1. The Whole Process

A road is composed of a number of records, which are named road links on map data, because a road has many change points, due to intersections, curves, etc. Therefore, a flood risk index is calculated individually for each road link. The flooding history of each road, the rainfall range causing flooding, dangerous roads for flooding, real-time accumulated rainfall and standard frequency probability precipitation are used as factors for the flood risk index of a road link in this study. Figure 1 shows the flowchart for the process to calculate a flood risk index of a road link.
Figure 1. The flowchart for the development of the real-time flood risk index on roads. AWS, Automatic Weather System.
Sustainability 06 06418 g001

2.2. Flooding History

The collection and analysis of flooding history information is the general work to develop the flood risk index, because areas prone to flooding are exposed to flooding damage easily [12].
The flooded roads are extracted in two ways in this study. First, the flooded regions (inundation trace map) provided as a type of vector (polygon type) and the ones made by the governmental organization (Korea Cadastral Survey Corporation) are used for this work. Road links included in these flooded regions of the research region (Busan, Korea) are extracted. The extraction work of flooded roads is completed by using the system tools provided by ArcGIS Desktop. The road links included in the area are those that the named attribute disaster type has “flooding” as the value by using the Select and Clip tools. From this work, approximately 2398 road links out of 69,408 road links of the research region were extracted.
Second, the road links restricted by flooding are extracted using newspaper reports related to flooding from 2007 to 2011. Fifty-one reports of flooding events were collected, and 534 road links were extracted by identification work with a real map. Finally, approximately 3007 road links out of a total of 69,408 road links of the research region were extracted through these two methods. Figure 2 shows the extracted road links as a map.
Figure 2. Extracted road links from the flooding history.
Sustainability 06 06418 g002

2.3. Rainfall Range Causing Flooding

To find the rainfall range causing flooding on each road link, the information of accumulated rainfall at AWS stations when flooding has arisen in the past and the IDW method are used.
The accumulated rainfall is not actually observed at a road link. For this reason, we regard a road link as a missing rainfall site and use IDW, which is one of the revised methods of missing rainfall, to calculate the probable rainfall on a road link.

2.3.1. The Revised Method of Missing Rainfall

There are many methods to revise missing rainfall. Among them, the arithmetic average method (AA), the inverse distance weighting method (IDW) and the coefficient of correlation weighting method (CCW) are suitable for processing by computer systems, because they do not need an ex ante analysis [13]. In this study, the IDW method is selected, because it is the most commonly used method in weather-related systems. Formulas (1) and (2) are shown below in relation to the calculation formula of the IDW method.
Z ( s o ) =   i = 1 n w i × Z ( s i )
where Z ( s o ) is the revised rainfall (mm) at s o , Z ( s i ) is the observed rainfall (mm) at s i , n is the number of observing sites and w i is the weight of s i .
w i =   d i o p i = 1 n d i o p   i = 1 n w i = 1
where d i o is the distance between s i and s o and p is the degree of weight changes by distances. Commonly, p is set as 2.0, and also, the result of IDW method is the best when p is set as 1.5 or 2.0 [13].

2.3.2. Rainfall Range Causing Flooding at AWS
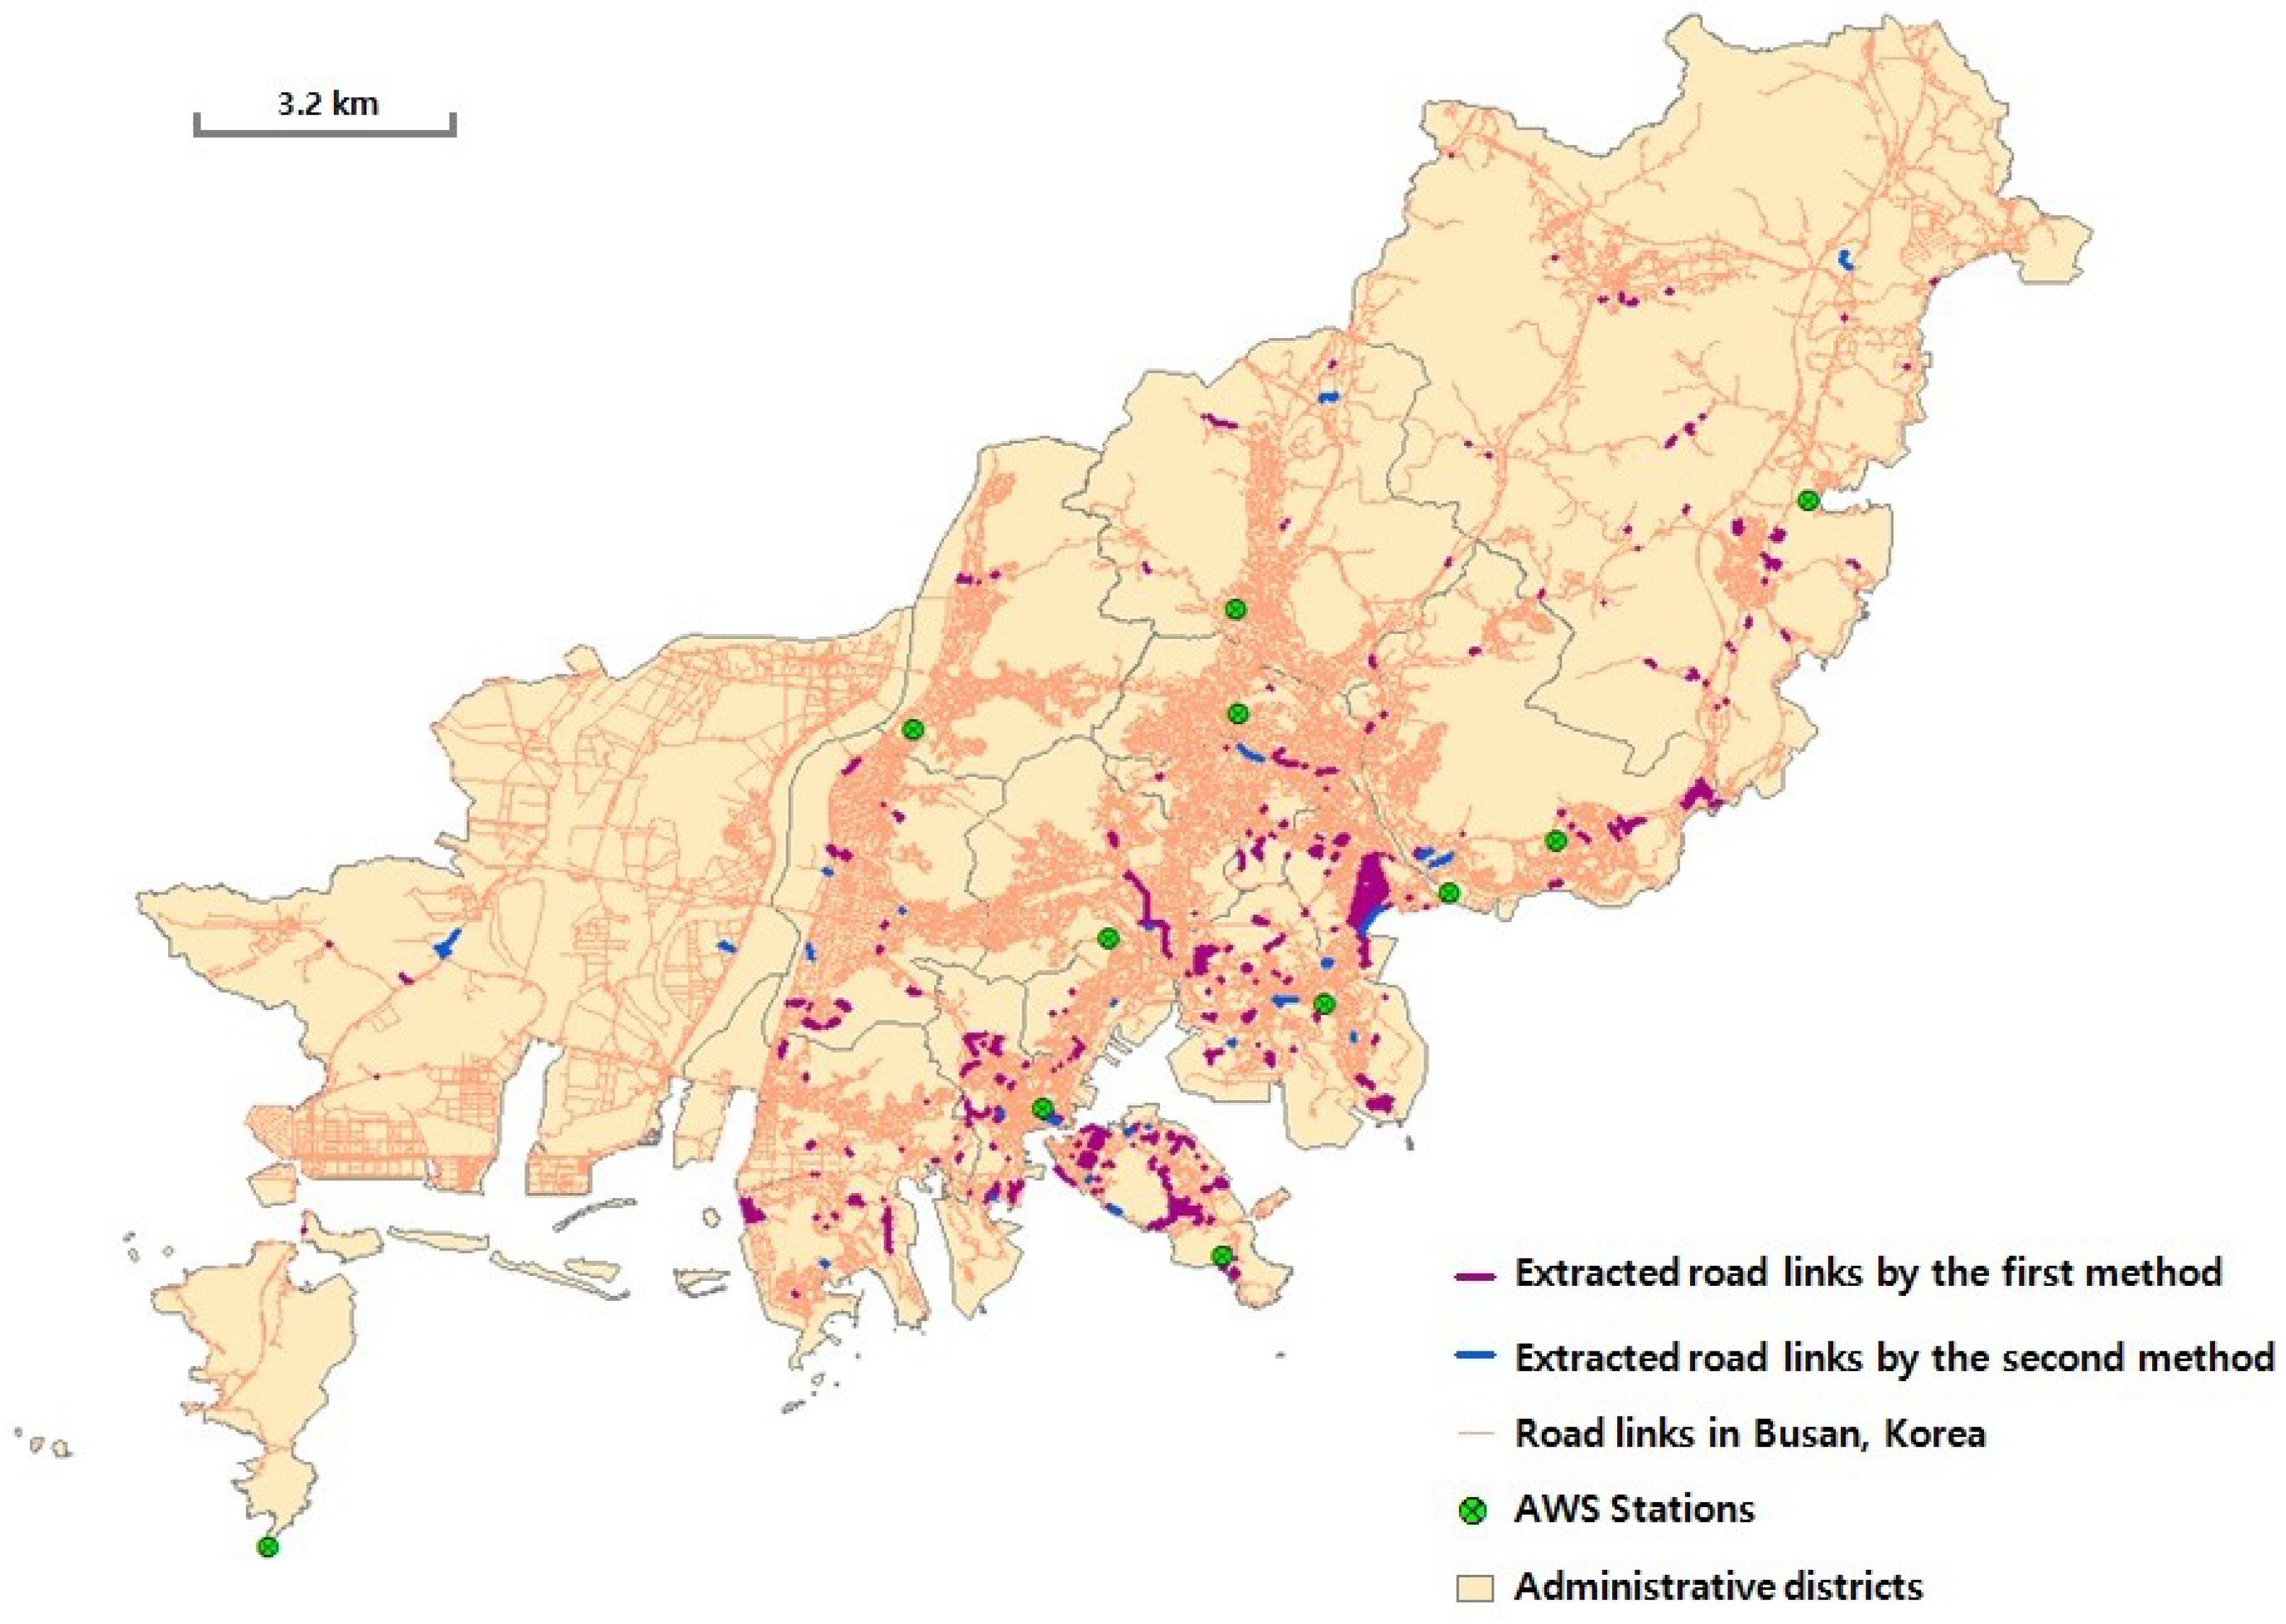
The maximum and minimum values of 15-minute and one-hour accumulated rainfalls, respectively, have been extracted at AWS stations for the past five years, from 2007 to 2011. These four values (the maximum of 15 minutes of accumulated rainfall, the minimum of 15 minutes of accumulated rainfall; the maximum of one hour of accumulated rainfall and the minimum of one hour accumulated rainfall) at each AWS site become rainfall ranges causing flooding. Table 1 shows four values used as the rainfall ranges causing flooding at 11 AWS stations in Busan, which is the research region.

2.4. Frequency Probability Precipitation

The frequency probability of precipitation is calculated by the rainfalls, which is relevant to the appropriate interval recurrence of the past maximum rainfalls through probability analysis. It mainly has been used to design hydraulic structures.
The flood risk index of a road link with a flooding history is determined by using the rainfall range causing flooding, which is based on the past rainfall information. However, if there is no flooding history on a road link, then there is no need to measure the range of flood damage rainfall in that area. Table 2 shows the probability precipitation on rainfall frequency for the road design provided from the government office in the research region, Busan, South Korea.
Table 2. The frequency probability precipitation (mm) in Busan, Korea.
Frequency Years 51020305080100
Minutes
1016.924.027.128.831.033.134.0
6057.079.091.198.1106.9114.9130.4
12080.2111.0128.3138.2150.6161.9183.9
18096.1133.1153.6165.4180.2193.7220.0
240111.4154.2177.9191.5208.5224.1254.4
360129.3178.8205.7221.2240.6258.3292.7
540149.9207.1238.4256.5279.0299.7309.4
Note: Provided by the Korea Ministry of Land, Infrastructure and Transport.

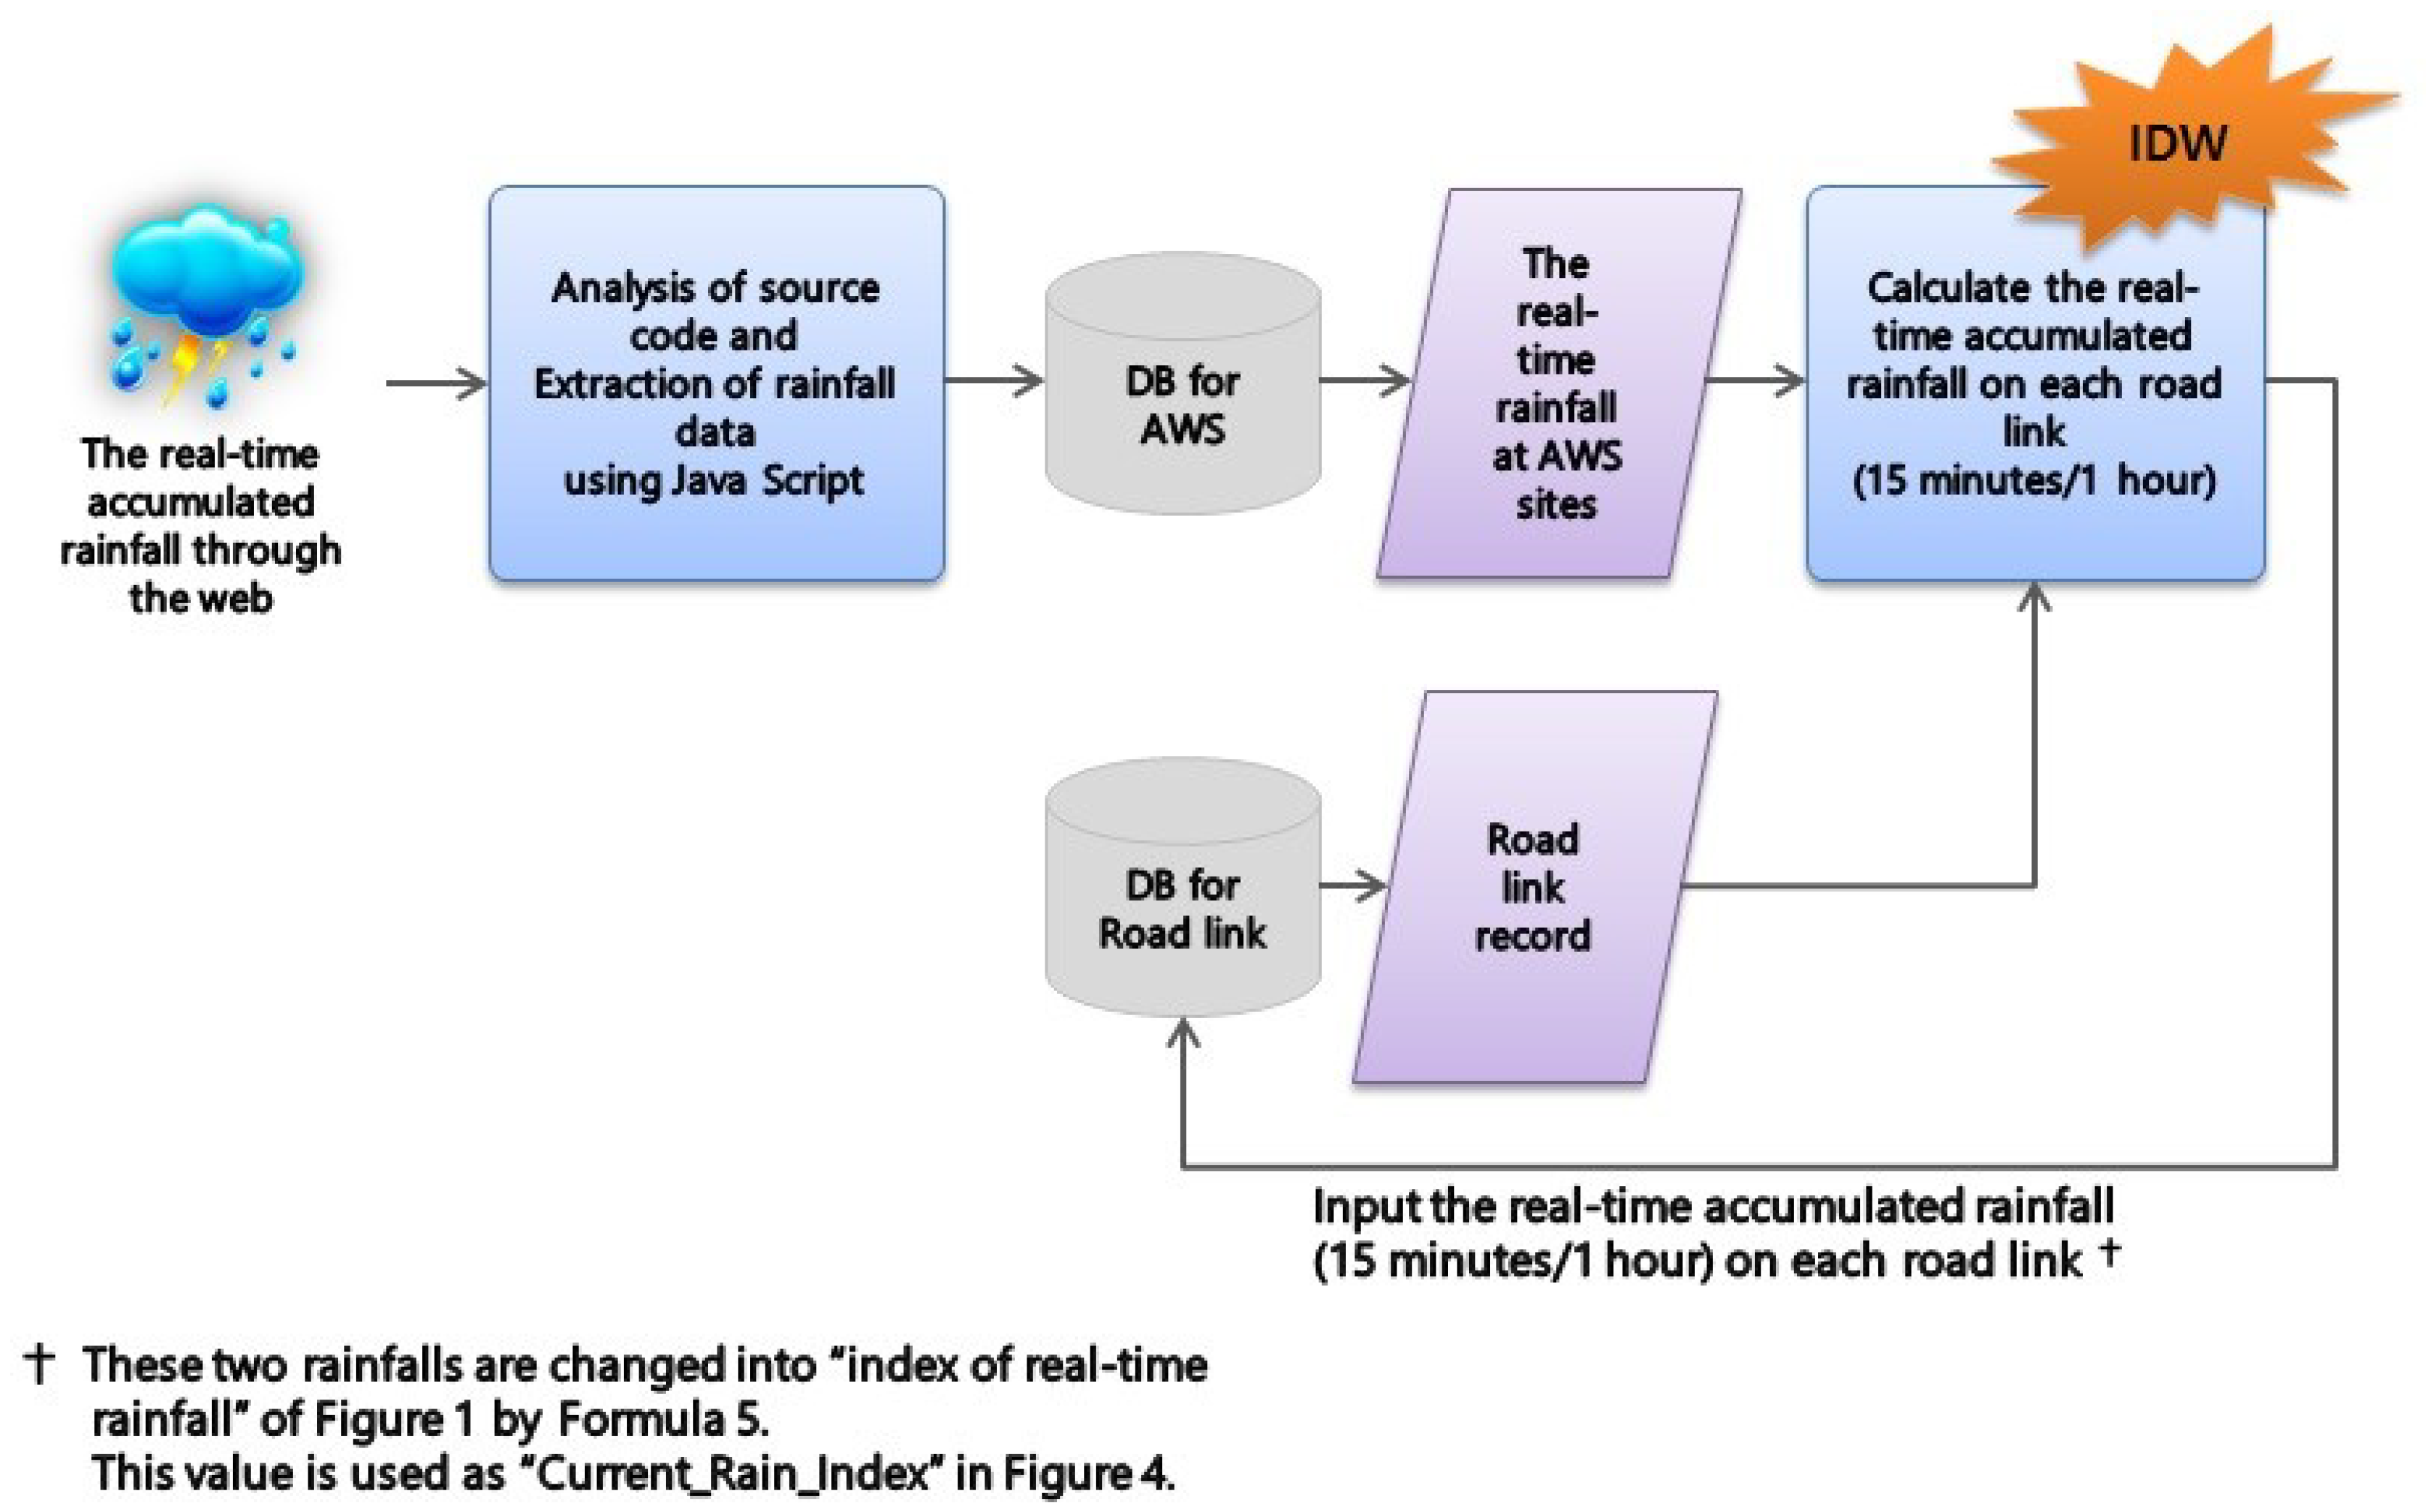
2.5. Real-Time Accumulated Rainfall

Fifteen-minute and one-hour accumulated rainfalls at AWS stations are updated and can be acquired every minute through the web page of the Meteorological Administration. Therefore, the real-time accumulated rainfalls at the AWS stations are taken from the web; then, the real-time accumulated rainfall on each road link is estimated using the observed rainfall information at AWS stations and the IDW method. Figure 3 shows the process to calculate the real-time accumulated rainfall on a road link.
Figure 3. Process for calculating the real-time accumulated rainfall on each road link. IDW, Inverse Distance Weighting.
Sustainability 06 06418 g003

3. Development of a Real-Time Flood Risk Index on Roads

3.1. Revision of Rainfall-Related Factors

To develop the flood risk index in this study, two kinds of accumulated rainfall data, 15-minute and 1-hour accumulated rainfalls, are used. In order to convert these two accumulated rainfalls into only one value, Formula (3), as below, is used.
R a i n f a l l R e l a t e d   F a c t o r
= ( 15   m i n u t e s   a c c u m u l a t e d   r a i n f a l l 15 ) × α
+ (   1   h o u r   a c c u m u l a t e d   r a i n f a l l 60 ) × ( 1 α ) ,   w h e r e ,   0 α 1
That is to say, one minute of accumulated rainfall is calculated respectively from 15-minute and one-hour accumulated rainfalls. The weighted value is approached by the method that is based on the relative importance of the details of each indicator through the preferences of experts and residents of that area. In this method, the fact that there is no difference between the weighted value and non-weighted value in terms of the evaluation results is reported [2]. Moreover, the inappropriate weighted value misleads the final results, and because of that, we attempted to use an equally weighted value for each factor. As a result, the minute unit rainfall is acquired by using two kinds of rainfall. Formulas (4)–(6), which are used in order to revise rainfall-related factors, are as follows:
Maximum index of RRCF  = (   Max .  of  15  minutes RRCF 15   ) × α + (   Max .  of  1  hour RRCF 60   ) × ( 1 α )
Minimum index of RRCF  = (   Min .  of  15  minutes RRCF 15   ) × α + (   Min .  of  1  hour RRCF 60   ) × ( 1 α )
where, 0 ≤ α ≤ 1, RRCF is the rainfall range causing flooding and maximum index/minimum index of RRCF are the sub-indexes for the values of rainfall ranges causing flooding.
Current _ Rain _ Index  = (   realtime  15  minutes ACRF 15   ) × α + (   realtime  1  hour ACRF 60   ) × ( 1 α )
where, 0 ≤ α ≤ 1, ACRF is accumulated rainfall and Current_Rain_Index is a sub-index for the real-time accumulated rainfall.
Frequency _ Rain _ Index  = ( 15  minutes rainfall on each FY 15 ) × α + ( 1  hour rainfall on each FY 60 ) × ( 1 α )
where, 0 ≤ α ≤ 1, FY is frequency years and Frequency_Rain_Index is a sub-index for the frequency probability precipitation.

3.2. Algorithm of Real-Time Flood Risk Index on Roads

3.2.1. Levels of Flood Risk Index

In this study, the flood risk index is divided into five levels with reference to the Emergency Action Plan (EAP). The higher the level is, the more dangerous the flooding on a road can be.
EAP is the legal plan to minimize the damage when facilities collapse or when there is a risk of collapse. It will be given for one of five hierarchical categories: “no risk”, “attention”, “cautions”, “alert” and “critical.” From among these, “critical” is the highest level, that is to say the most dangerous level [1].

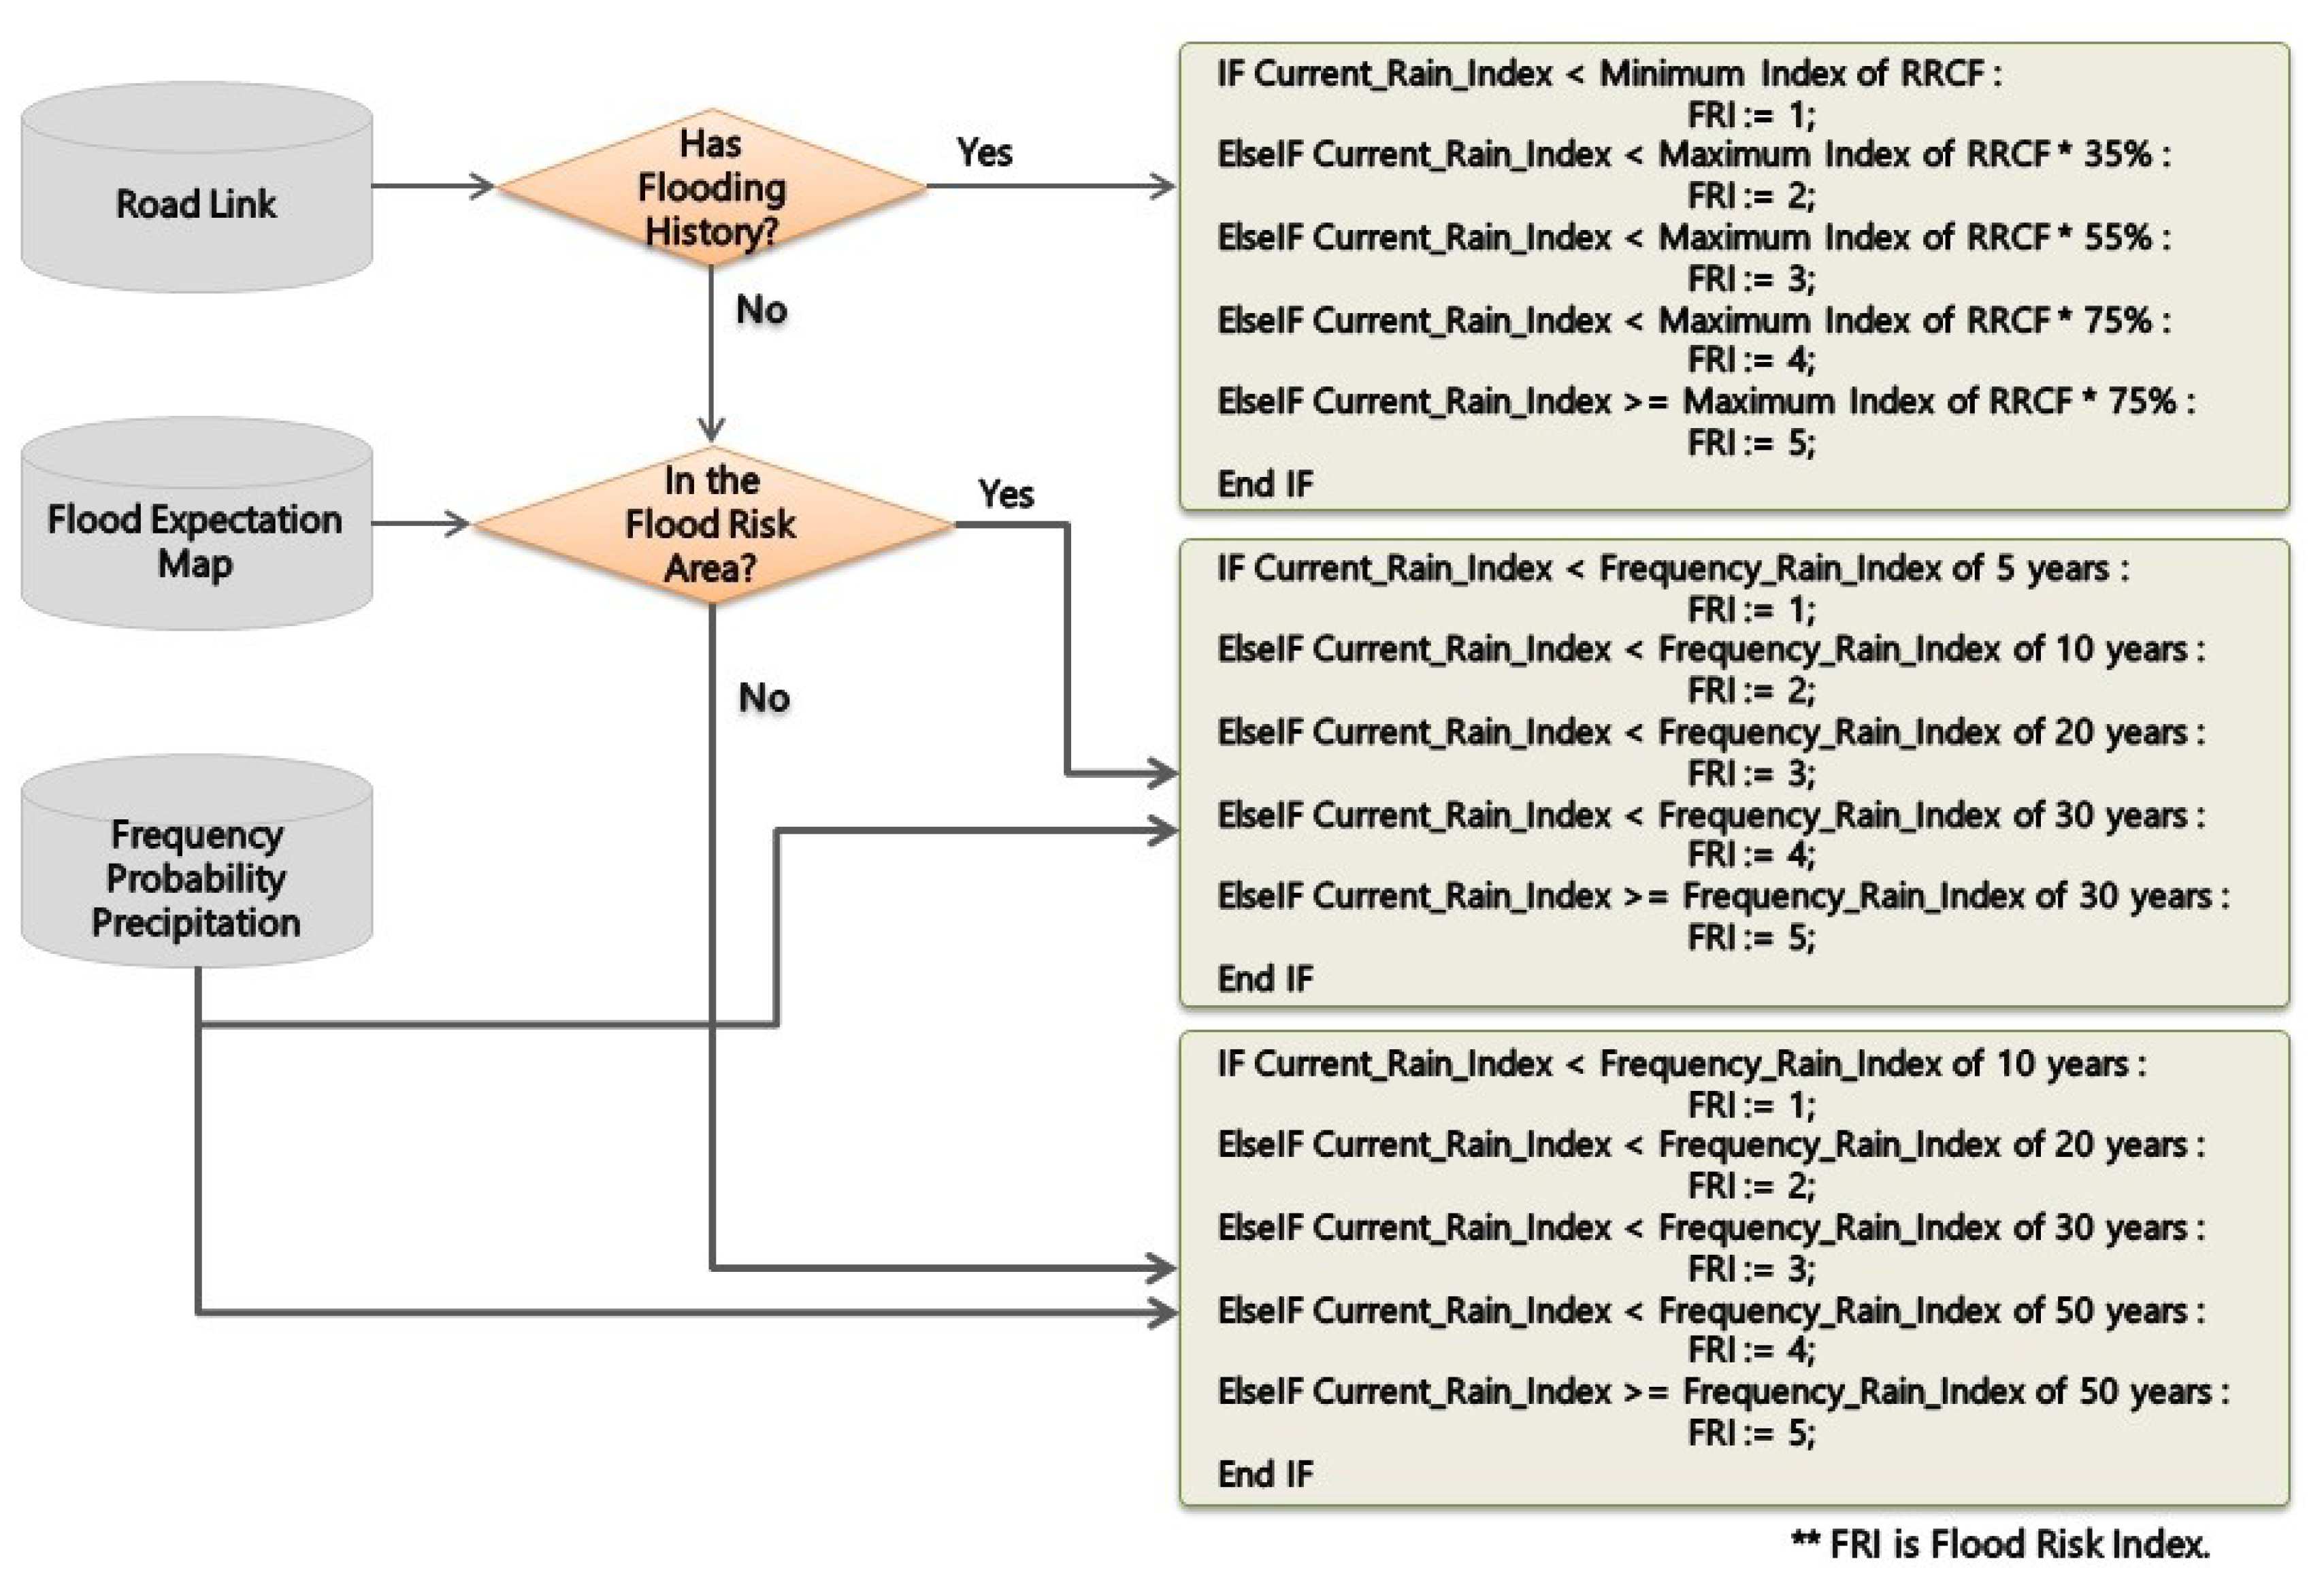
3.2.2. Decision Algorithm of Flood Risk Index
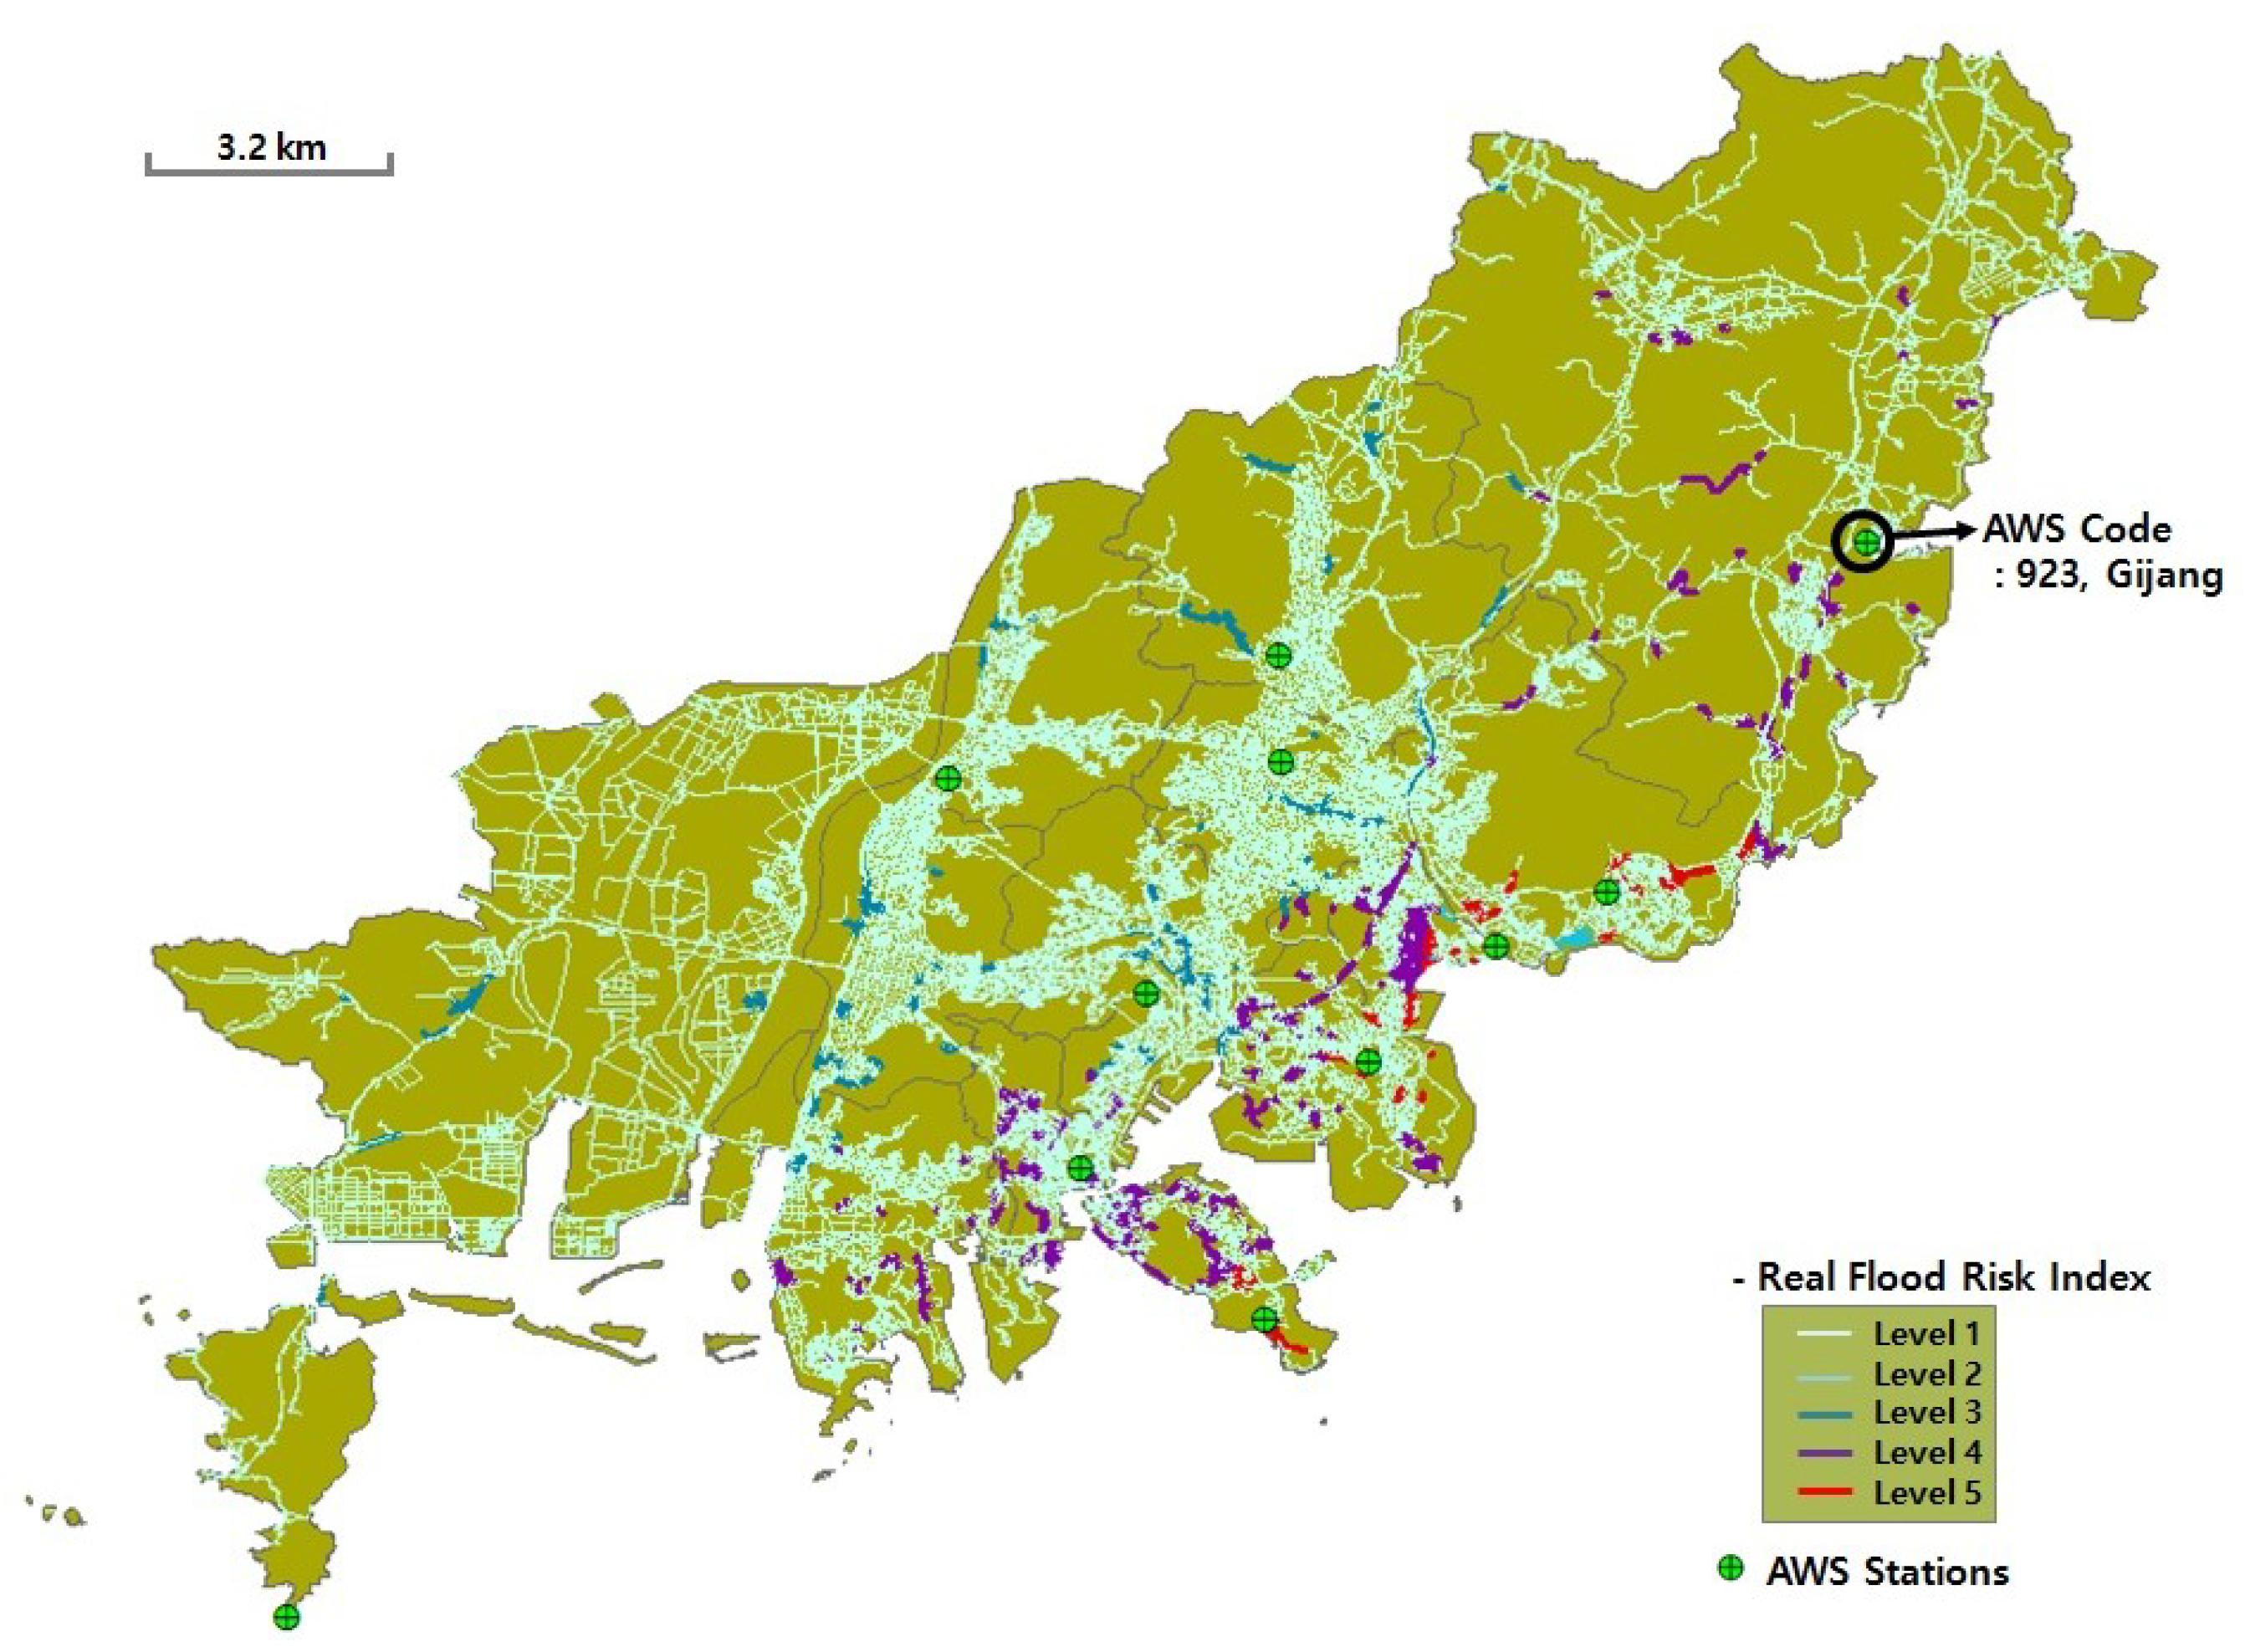
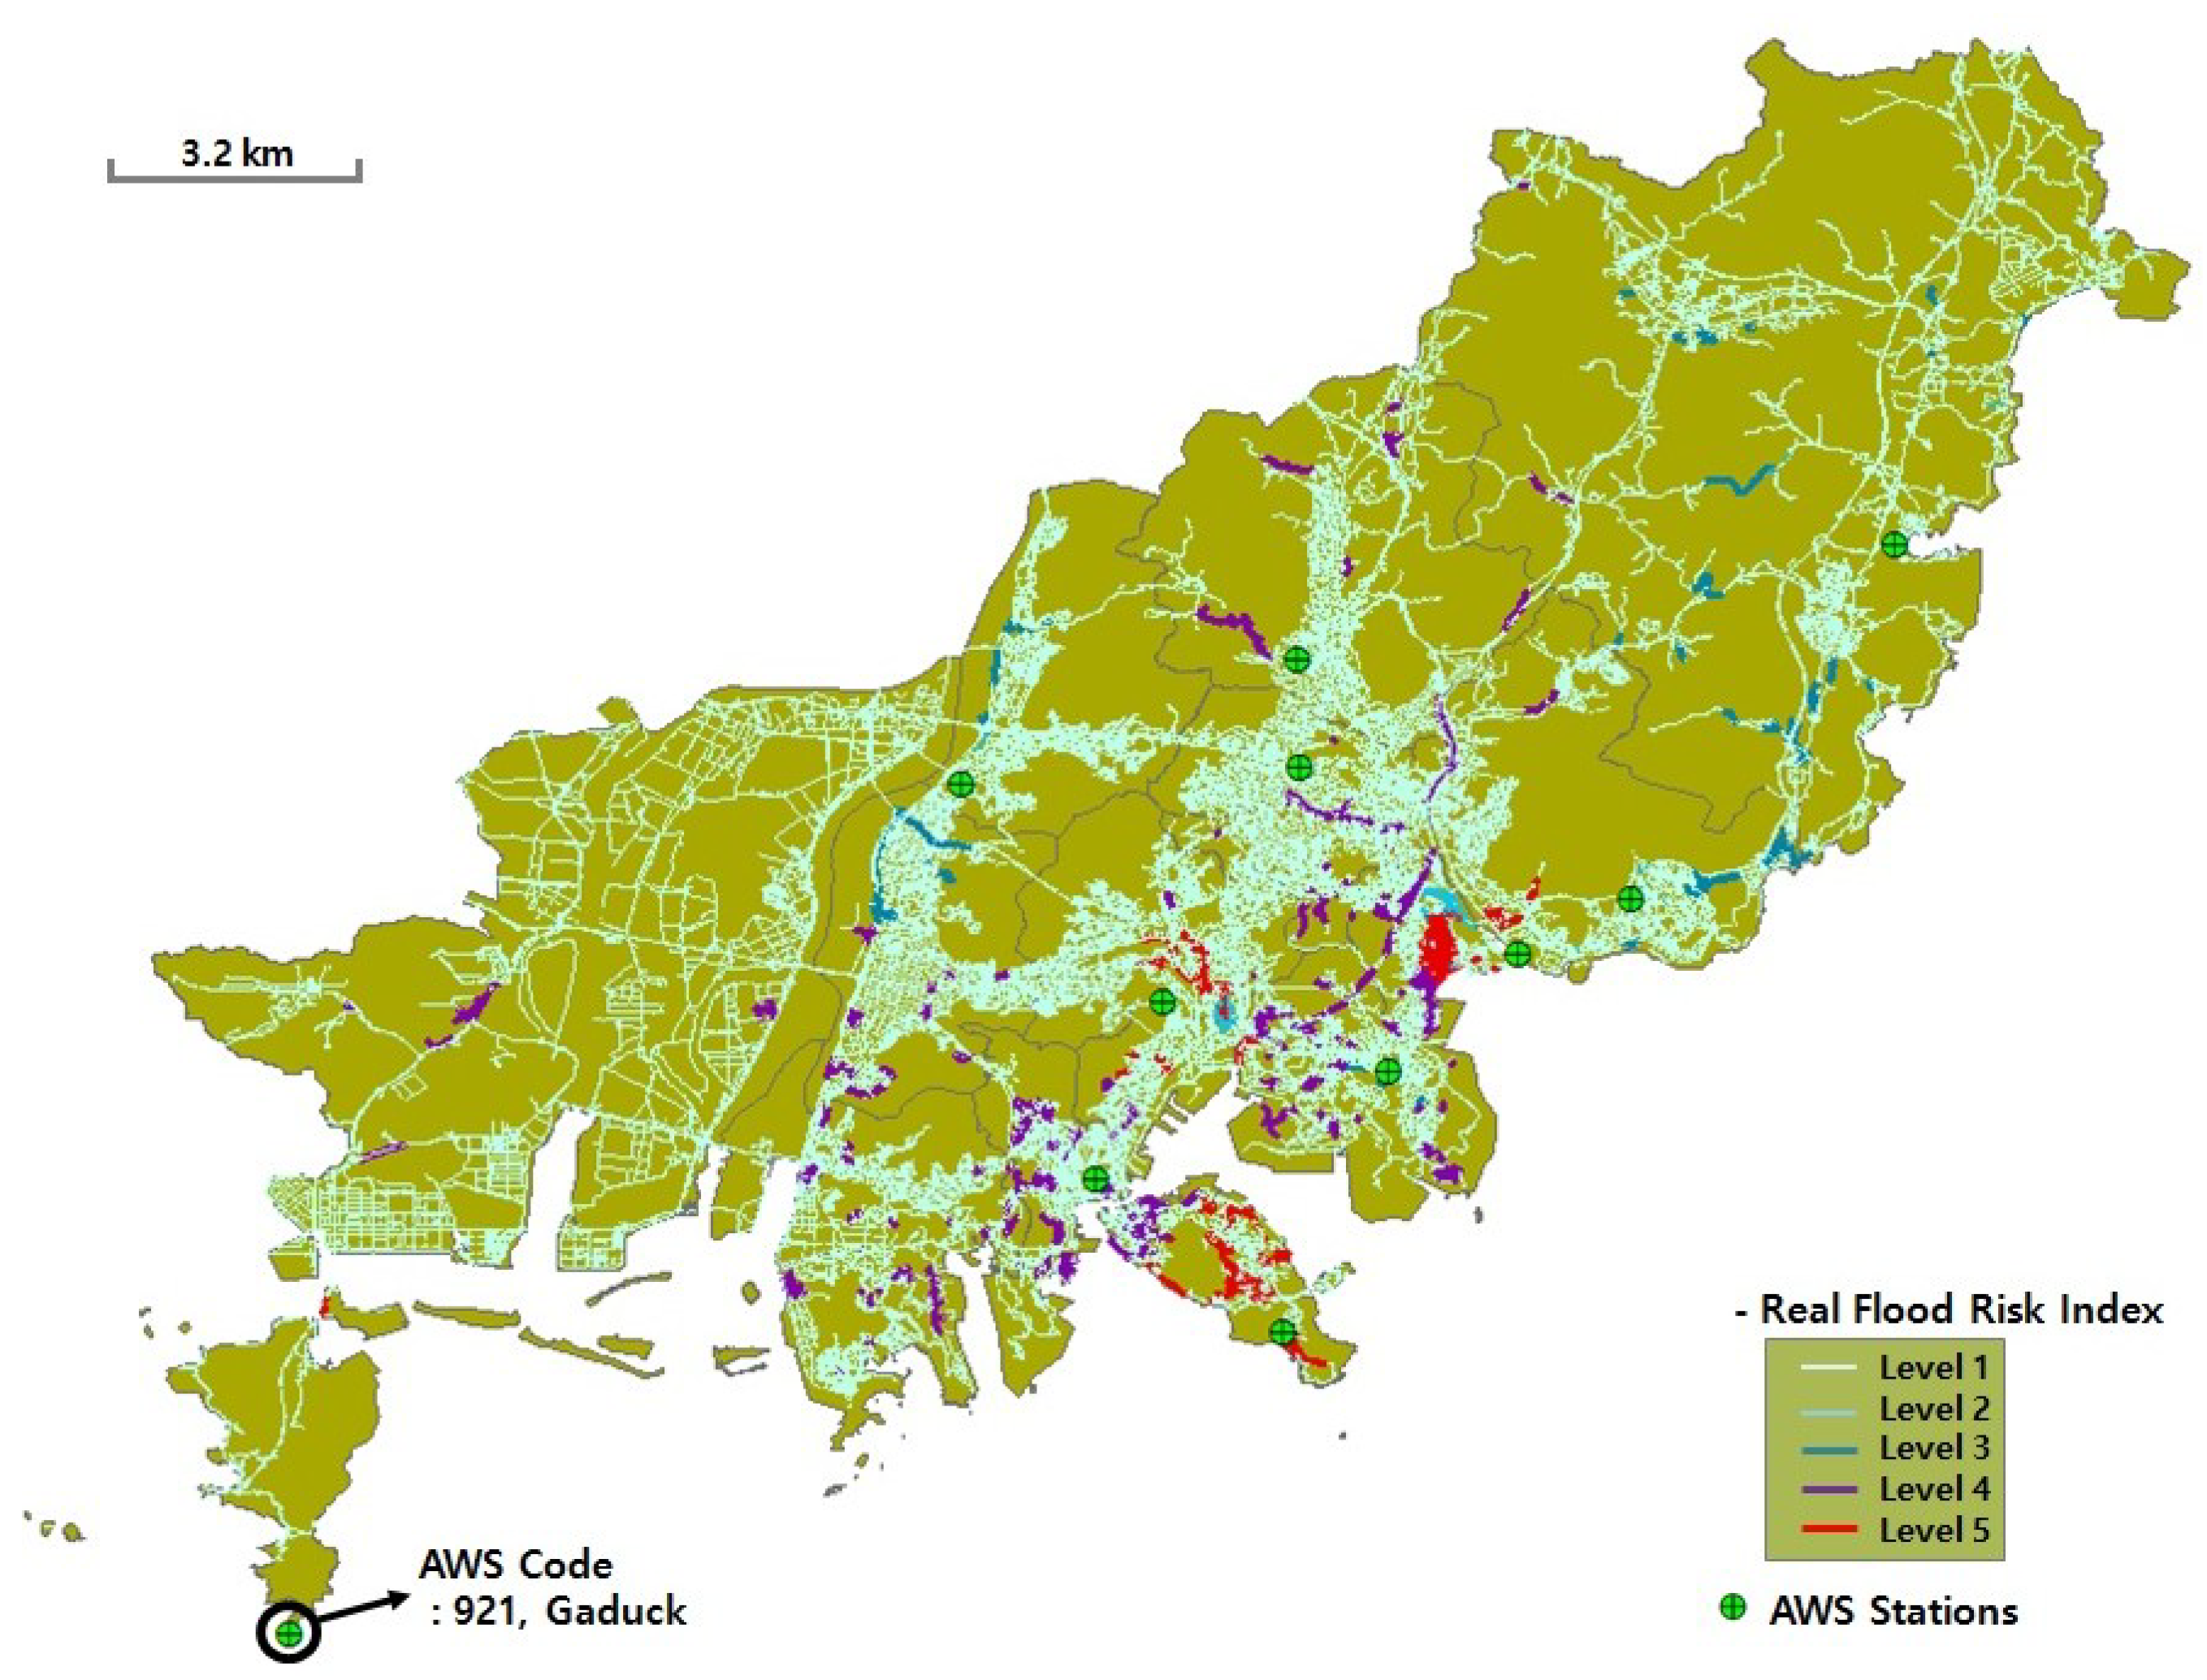
To develop the flood risk index on roads, the algorithm is split into two parts: the road links with flooding history or with no flooding history. If the road has no flooding history, it is considered as a dangerous road for flooding if it is included in the flood expectation map.
If a road link has a flooding history, its flood risk index is determined according to the rate between the index of the rainfall range causing flooding Formula (4) and the index of current rainfall Formula (5). However, if there is no flooding history on the roads, it is divided again by whether the road link is included in the flood risk area of the flood expectation map. Then, its flood risk index is determined according to the rate between the index of the frequency probability precipitation Formula (6) and the index of current rainfall Formula (5). Figure 4 shows the algorithm to determine the flood risk index on roads in real time, as suggested in this study.
Figure 4. The algorithm to develop the road’s flood risk index in real time.
Sustainability 06 06418 g004

4. Simulations

To verify the suggested algorithm for the real-time flood risk index on roads, we collected the flood events for the last six years from 2007 to 2012 and simulated two cases that caused much damage to the research region, Busan, Korea. The date/time and rainfall information at that time are shown in Table 3.
Table 3. The real-time rainfall information of simulated data (mm).
AWS stations1. 7 July 2009 07:202. 15 July 2012 12:15
CodeName15 minutes1 hour15 minutes1 hour
159Busan15.572.023.554.0
910Youngdo13.550.527.546.0
938Busanjin9.550.528.556.0
940Dongrae4.536.518.538.0
942Daeyeon18.581.514.541.0
941Bookgu2.028.05.024.5
950Saha16.068.029.560.5
937Haeundae22.571.56.523.5
939Gumjung4.031.014.533.0
921Gaduck0.523.517.048.5
923Gijang12.546.54.512.5
In the case of Simulation 1, 310 mm was reported per day in Busan, and this was the most accumulated rainfall in 18 years. It was reported that 10 road regions were flooded. We extracted the 66 road links by comparing the realistic map to flooded roads at the time. For Simulation 2, a maximum of 80 mm per hour and 231 mm per day was recorded in Busan. A total of 17 road regions were flooded at that time, and we extracted 179 road links through the map data. Figure 5 and Figure 6 show the results of the simulation as a map.
Figure 5. The result of Simulation 1 (7 July 2009).
Sustainability 06 06418 g005
Figure 6. The result of Simulation 2 (15 July 2012).
Sustainability 06 06418 g006
Table 4 shows the result of the simulation in more detail. The number of links that reached more than Level 4 was 43 out of 66 for Simulation 1 and 166 out of 170 for Simulation 2.
Table 4. The result of simulation in detail.
Road LinksSimulation 1Simulation 2
FRI(7 July 2009)(15 July 2012)
Level 102
Level 216
Level 3225
Level 41470
Level 52996
Total of road links66179
Accordance rate65.2%92.7%
Note: The accordance rate was calculated with links having more than level 4 as Flood Risk Index (FRI).
To compare the two results, the east and west part of the areas are clearly different from each other. In the case of Simulation 1, the amount of rainfall for the AWS station (923, Gijang) marked to the east of Figure 5 is three times more than Simulation 2. Therefore, road links that are close to this AWS station have a higher level of flood risk index than Simulation 2. For a similar reason, road links near the marked AWS station (921, Gaduck) of Simulation 2 have a higher level than Simulation 1.

5. Conclusions

In this study, we suggested a method to develop a flood risk index on a road that is of an intensive type. This is a study about sudden local flooding, which has been occurring with greater frequency recently, in contradistinction to a flood risk index for a large unit, such as a city or a large basin, which has previously been researched in general. The aim of this study is the development of a flood risk index on road links using real-time accumulated rainfall to give information for the flood risk of roads to drivers in advance.
Flooding history, the rainfall range causing flooding, real-time accumulated rainfall and frequency probability precipitation are used as factors that determine the flood risk index on a road link in real time. First, we collected the flooding history data of road links from the inundation trace map and newspaper reports and extracted 3007 road links out of a total of 69,408 road links of the research region (Busan, South Korea). Then, every road link is allocated a rainfall range causing flooding calculated by the analysis of past rainfall information at AWS stations and real-time accumulated rainfall using the amount of rainfall at AWS stations updated every minute through the Internet by the Korea Meteorological Administration. In these cases, AWS stations have rainfall information, but a road link has none, because its rainfall is not measured directly. For this reason, we need a method to estimate the amount of rainfall on a road link using observed rainfall at AWS stations. To interpolate rainfall, we consider a road link as an unmeasured missing rainfall site; then, the inverse distance weighting (IDW) method, which is one of the revised methods for missing rainfall, was selected to calculate the probable accumulated rainfall on each road link. The IDW method is a suitable method in a computing system, and it is commonly used to assess precipitation, because of its simplicity. In other words, the IDW method is more appropriate than other revised methods for a real-time computing system, which is our development system environment in this study. Lastly, the frequency probability precipitation for a road’s design is used to determine a flood risk index of a road link that has no flooding history.
We simulated the proposed algorithm for two cases, which were actual flooded sites in the past on 7 July 2009 and 15 July 2012. According to Table 4, the accordance rate between roads having more than Level 4 and actual flooded roads in the past is 65.2% for Simulation 1 and 92.7% for Simulation 2. That is to say, there is a consistency of about 79% on average. Therefore, we think the suggested method to develop a flood risk index on a road in real time is more suitable for sudden local flooding than previous research. Furthermore, the results of the simulation were applied to the routing system [14]. The most efficient safe path was searched when the road links having more than Level 4 were blocked.
In practice, however, it is possible that a road could be flooded by not the amount of rainfall, but road circumstances, such as sewer drain construction. If a case like this happens, roads should be controlled by force regardless of the result of the flood risk index derived by a system. Therefore, a disaster manager to monitor real-time information about flooding situation is demanded. For this reason, it is advantageous to combine this study with the study of real-time information.
With the expansion of the Internet and the advent of smartphones, people now are able to get easy access to and extend their activities on the web [15]. Therefore, if information about roads having flood risk and safe paths is provided to people in advance through smartphone applications connected to an intelligent transportation system (ITS) or a navigation system, the damage caused by traffic congestion and drivers’ isolation could be decreased.
As many people share information through social networking service (SNS), the analysis of web documents of SNSs also is being studied currently [16,17,18]. Especially, people share much information, such as disaster areas or damage information in the case of a natural disaster, like flooding. In this situation, people upload not only text information, but also pictures or GPS information on the Internet. Disaster managers could grasp whether flooding occurs or not on roads by comparing the color [19] or resolution [20] of roads before-and-after flooding. Furthermore, they can know the locations where a disaster happens by GPS analysis [10,11].

Acknowledgments

The authors are grateful to the Natural Hazard Mitigation Research Group and the National Emergency Management Agency of South Korea for financial support (Foundation Item No. NEMA-NH-C-D-2012-0243) for carrying out this work.

Author Contributions

Eunmi Kim developed the concept, simulated the algorithm and drafted the manuscript, which was revised by Kyung Hyun Rhee and Ilkyeun Ra. Chang Soo Kim supervised the overall work. All authors have read and approved the final manuscript.

Conflicts of Interest

The authors declare no conflict of interest.

References

  1. Kim, E.M.; Rhee, K.H.; Kim, C.S. Study on the Method of Development of Road Flood Risk Index by Estimation of Real-time Rainfall Using the Coefficient of Correlation Weighting Method. J. Korea Multimed. Soc. 2014, 17, 478–489. [Google Scholar] [CrossRef]
  2. Lim, K.S.; Choi, S.J.; Lee, D.R.; Moon, J.W. Development of Flood Risk Index Using Causal Relationships of Flood Indicators. Korean Soc. Civ. Eng. 2010, 30, 61–70. [Google Scholar]
  3. Connor, R.F.; Hiroki, K. Development of a Method for Assessing Flood Vulnerability. Water Sci. Technol. 2005, 51, 61–67. [Google Scholar]
  4. Birkmann, J.; Krings, S.; Renaud, F. Vulnerability Assessment to Floods at the Local Level. In Proceedings of the 4th ISFD International Symposium on Flood Defense, Toronto, ON, Canada, 6–8 May 2008.
  5. Choi, C.I.; Kim, W. Implications of the Flood Risk Assessment in Urban and Regional Planning. Korea Plan. Assoc. 2006, 41, 143–155. [Google Scholar]
  6. Kim, E.S.; Choi, H.I.; Jee, H.K. Estimation of the Flash Flood Index by the Probable Rainfall Data for Ungauged Catchments. Korean Soc. Hazard Mitig. 2010, 10, 81–88. (In Korean) [Google Scholar]
  7. Jo, D.J.; Son, I.O.; Choi, H.I. Development of a New Flood Index for Local Flood Severity Predictions. Korea Water Resour. Assoc. 2013, 46, 47–58. [Google Scholar] [CrossRef]
  8. Gupta, V.; Chauhan, D.S.; Dutta, K. Incremental Development & Revolutions of E-learning Software Systems in Education Sector: A Case Study Approach. Hum. Centric Comput. Inf. Sci. 2013. [Google Scholar] [CrossRef]
  9. Berena, A.J.; Chunwijitra, S.; Okada, H.; Ueno., H. Shared Virtual Presentation Board for e-Meeting in Higher Education on the WebELS Plaform. Hum. Centric Comput. Inf. Sci. 2013. [Google Scholar] [CrossRef]
  10. Hong, S.T.; Chang, J.W. A New k-NN Query Processing Algorithm Based on Multicasting-based Cell Expansion in Location-based Services. J. Converg. 2013, 4, 5–10. [Google Scholar]
  11. Luo, Y.; Hoeber, O.; Chen, Y. Enhancing Wi-Fi Fingerprinting for Indoor Positioning Using Human-centric Collaborative Feedback. Hum. Centric Comput. Inf. Sci. 2013, 3. [Google Scholar] [CrossRef] [Green Version]
  12. Kim, C.S.; Kim, E.M.; Rhee, K.H. A study on the Database Construction Using Flooding Danger Information of Road. In Proceedings of the International Conference on Computer Applications and Information Processing Technology, Prague, Czech, 27–29 June 2013; pp. 72–75.
  13. Han, M.S.; Kim, C.S.; Kim, H.S.; Kim, H.R. A Study on the Revised Methods of Missing Rainfall Data for Real-time Forecasting Systems. Korea Water Resour. Assoc. 2009, 42, 131–139. [Google Scholar] [CrossRef]
  14. Yang, C.H.; Son, Y.T.; Yang, I.C.; Kim, H.M. Development Algorithms for Providing Evacuation and Detour Route Guidance Under Emergency Conditions. Korean Soc. Road Eng. 2009, 11, 129–139. [Google Scholar]
  15. Jeong, W.H.; Kim, S.J.; Park, D.S.; Kwak, J. Performance Improvement of a Movie Recommendation System based on Personal Propensity and Secure Collaborative Filtering. J. Inf. Process. Syst. 2013, 9, 157–172. [Google Scholar] [CrossRef]
  16. Kwon, A.R.; Lee, K.S. Opinion Bias Detection Based on Social Opinions for Twitter. J. Inf. Process. Syst. 2013, 9, 538–547. [Google Scholar] [CrossRef]
  17. Inm, H. Mining Consumer Attitude and Behavior. J. Converg. 2013, 4, 29–35. [Google Scholar]
  18. Song, Y.M.; Kim, E.M.; Kim, C.S. An Implementation of Expression System of Disaster Area by Twitter Filtering and Geocoding. In Proceedings of the 6th FTRA International Symposium on Advances in Computing Communications Security and Applications, Jeju, Korea, 23–25 April 2014.
  19. Ghimire, D.; Lee, J.H. A Robust Face Detection Method Based on Skin Color and Edges. J. Inf. Process. Syst. 2013, 9, 141–156. [Google Scholar] [CrossRef]
  20. Yang, X.; Peng, G.; Cai, Z.; Zeng, K. Occluded and Low Resolution Face Detection with Hierarchical Deformable Model. J. Converg. 2013, 4, 11–14. [Google Scholar]

