1. Introduction
A number of catastrophic building failures due to severe and impulsive earthquakes have taken place worldwide since last few decades. In the aftermath of the 1994 Northridge and 1995 Kobe earthquakes, some scientists have raised special concerns as to ordinary buildings that are vulnerable to strong impulsive near-fault (NF) ground motions [
1,
2,
3]. The NF ground motions recording from recent earthquakes are different from general ground motions in that they contain a strong-narrow band pulse of the spectral acceleration at short to intermediate periods [
4,
5,
6]. Once ordinary frame buildings with relatively short vibration periods undergo these NF ground motions, inter-story drifts generated tend to be considerable due to strong ground acceleration pulses delivered into the column bases [
7,
8,
9,
10]. The implementation of seismic base isolation results in economical and practical solution that mitigates the magnitude of the seismic force by providing both lateral flexibility and energy dissipation through the insertion of the isolation device [
11,
12,
13,
14,
15]. The base isolation systems conceptually pertaining to passive vibration control technologies contribute to shifting the fundamental (or natural) time period of the structure away from the high pulse of the spectral acceleration where the structures are mostly affected. Consequently, a basic scheme for adequately implementing the isolation system on the column base is to separate the main structure from the ground in an effort to avoid severe seismic damage.
The most common base isolation devices used over many years by engineers are lead-rubber bearing (LRB) isolators which combine isolation function and energy dissipation in a single compact unit [
16,
17]. Such LRB isolator devices provide vertical load support, horizontal flexibility, supplemental damping, and centering force to the structure from earthquake attack. In addition, they require minimal cost for installation and maintenance as compared to other passive vibration control devices [
18,
19]. The LRB isolator typically consists of laminated rubber layers with a lead core plug down its center as illustrated in
Figure 1.
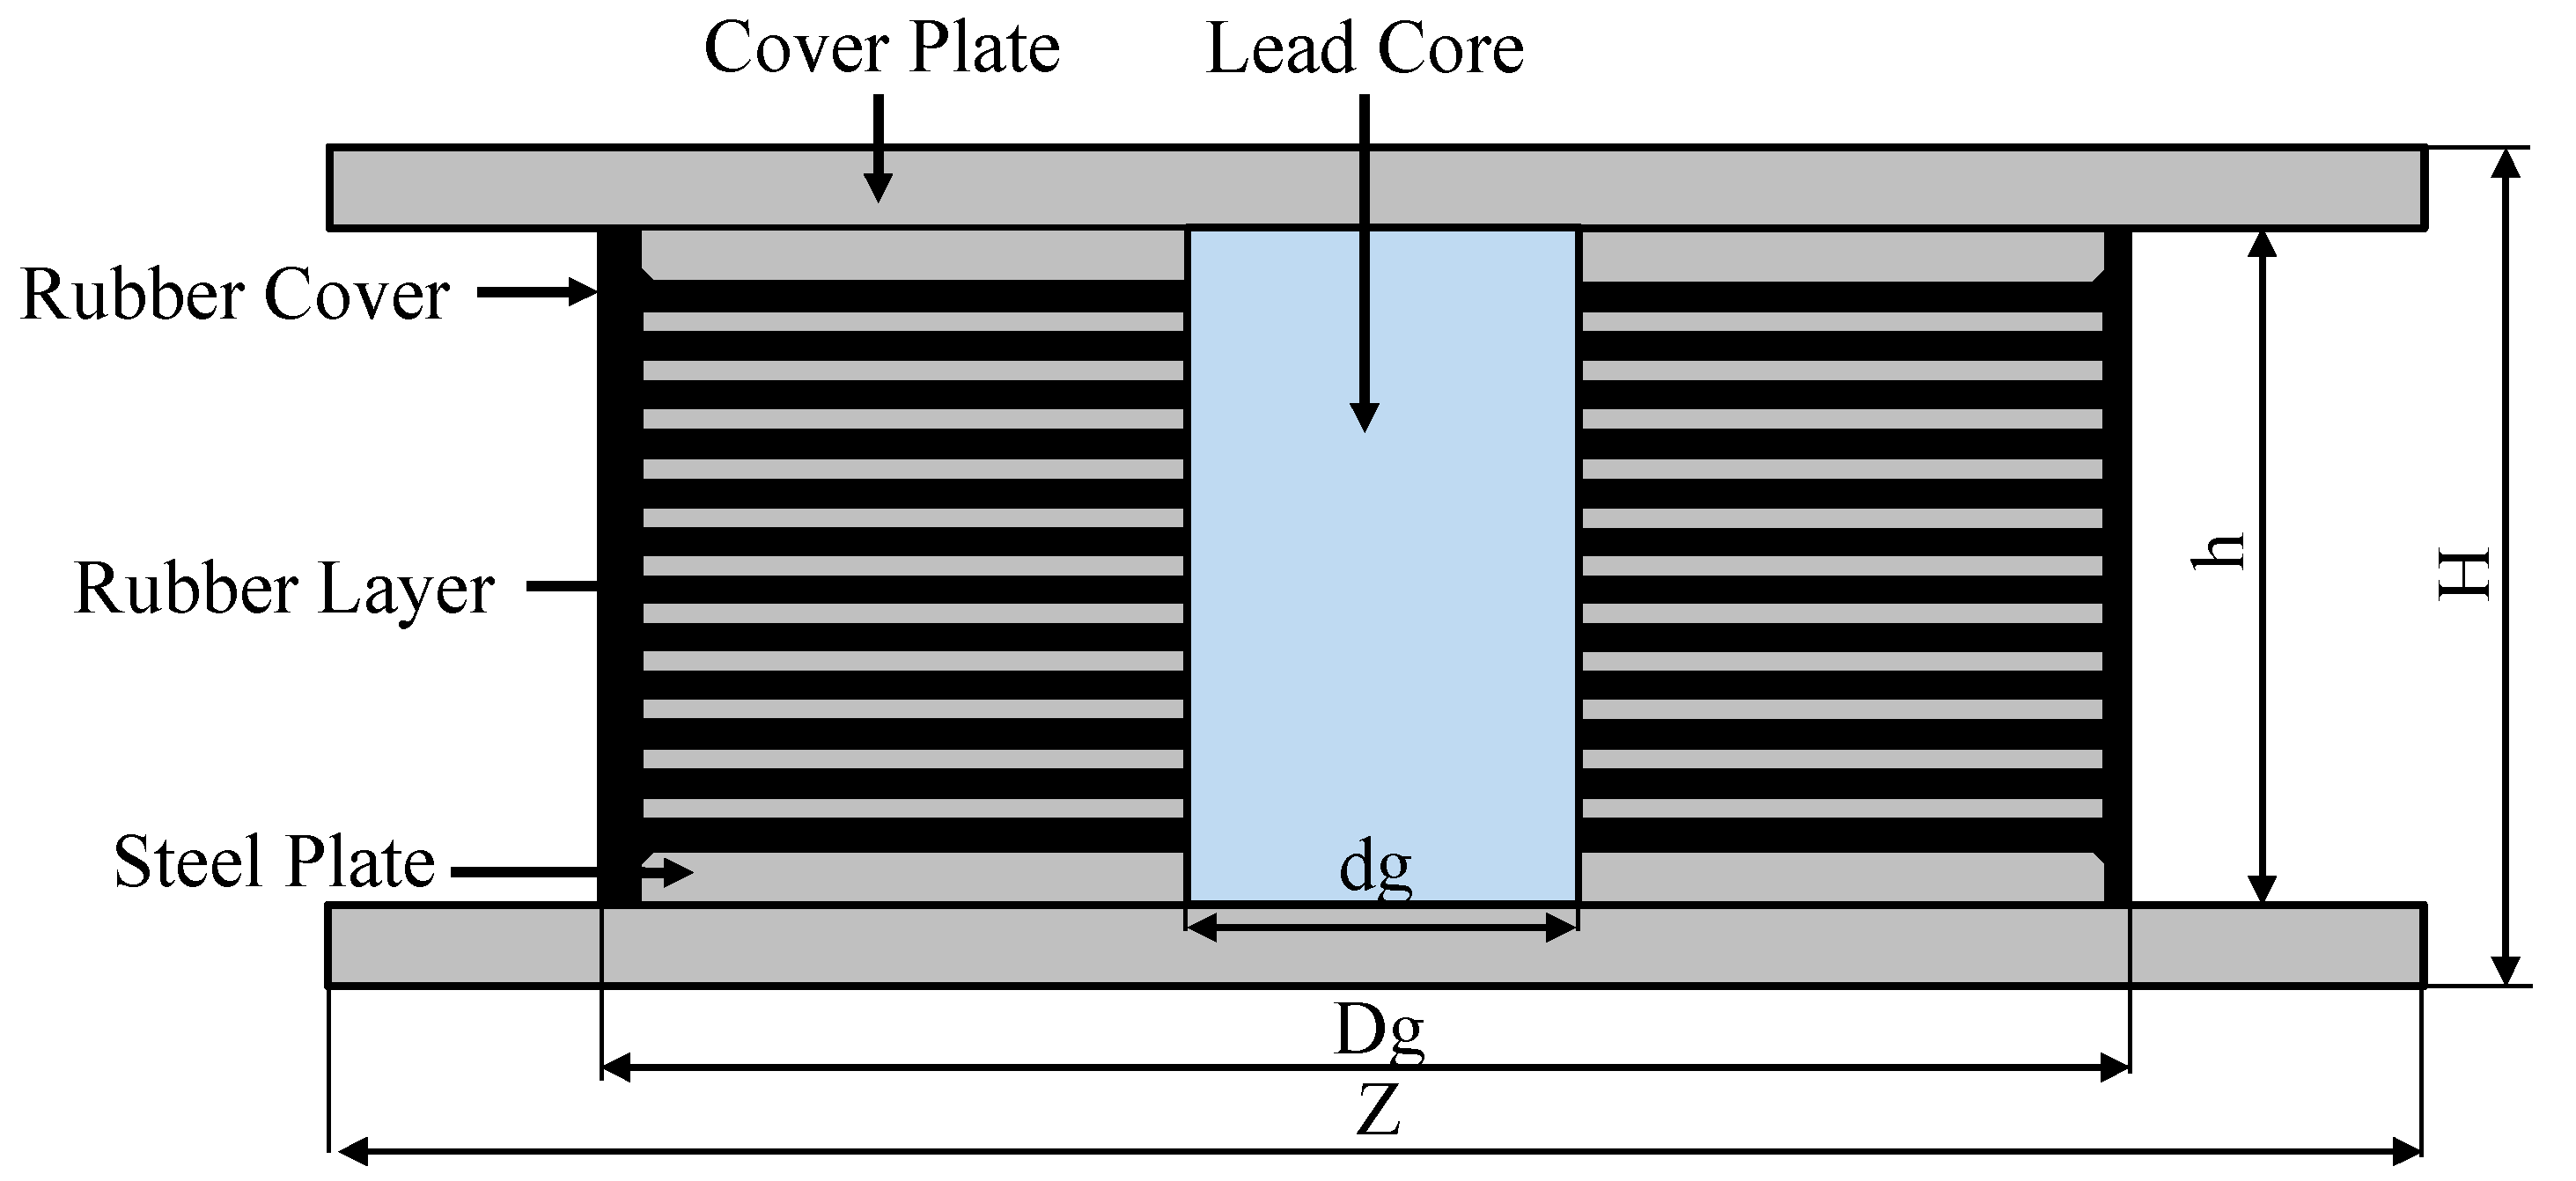
Figure 1.
Typical lead-rubber bearing (LRB) isolator device.
Figure 1.
Typical lead-rubber bearing (LRB) isolator device.
The low damping elastomers constructed with elastomeric rubber bearings generally behave as an elastic manner toward external response. Thus, they can instantly supply isolation capacity, additional flexibility, and elastic recentering force to the LRB isolator device [
20]. On the other hand, the lead core which yields at the relatively low shear stress responds with perfectly elasto-plastic loops, and hence offers not only sufficient energy dissipation but also supplemental damping component. The inner reinforcing steel plates stacked up constrain the laminated rubber layers from lateral expansion, and provide high vertical stiffness resisting gravity loads. The typical LRB isolator has considerable maximum shear strains corresponding to between 125% and 200% because reinforcing steel plates have little effect on the shear stiffness. Therefore, the installation of the LRB isolator devices may be necessary for the frame buildings with an intention to mitigate structural damage.
A considerable amount of practical research associated with the use of this elastomeric LRB isolator has been conducted for several years. The early stage of research development has mainly focused on LRB responses estimated through experimental observations and numerical analyses, including LRB system design [
21]. The stiffness models were developed to predict the force-displacement response of the LRB isolator device. On the other hand, recent researches have been trending toward the application of LRB isolation systems in the building structure [
3,
13,
14,
15]. The LRB isolators with hardening behavior were developed for low to mid-rise buildings located in the moderate seismicity area, and besides, the behavior of the base-isolated building was accurately predicted by nonlinear dynamic analyses performed with relatively long-period ground motions. Most recently, some researchers have been starting to evaluate seismic performance and capacity for the base-isolated multi-story building structure subjected to several NF ground motions [
13,
14,
15]. Overall, NF ground motions produce strong acceleration pulses with undesirable effects on the response of the superstructures, thereby causing severe failure and instability in the superstructure. Accordingly, the LRB base isolators are required for building structures located on the NF sites in that they are very effective to reduce such ground accelerations transmitted into the superstructure. Notwithstanding that seismic performance for the base-isolated building under the NF ground motion leads many engineers and scientists to attract sufficient interest, there is a lack of proper research until now to implement the LRB isolator devices practically used in the actual frame building. Therefore, it is necessary to examine extensively the response of different LRB isolators with the combination of recentering and damping properties for the isolated steel frame building experiencing several NF ground motions.
This study is intended to mainly investigate seismic capacity and performance for LRB-isolated frame buildings located on the NF site area so as to address issues mentioned above. Two LRB isolator models used in the practical field are firstly selected for design and analyses. The mechanical properties of these isolator models, which are determined to comply with a recommendation specified in the common building design code [
22,
23,
24], are introduced to reproduce their force-displacement responses. The LRB isolators presented herein are modeled as nonlinear component springs with the mechanical properties for the purpose of simulating isotropic hardening behavior during the analyses. The six story concentrically braced frame buildings with perimeter moment-resisting frames are designed in accordance with the current design guideline [
22,
24], and then modeled as two dimensional (2D) symmetric frame models. In this study, they can be classified as either LRB-isolated frame models or as-built frame models according to whether base isolation systems are installed or not. The individual frame models are evaluated with respect to seismic performance characterized by inter-story drifts and base shear forces after performing nonlinear dynamic time-history analyses with several NF ground motion records, and then compared to each other. Finally, statistical investigation based on analysis results should be conducted in order to fairly verify the effectiveness of the LRB base isolation system in the multi-story building structure.
2. LRB Isolator Devices
The LRB isolator is composed of an elastomeric bearing made by laminated rubber layers with steel shim plates, cover plates, and a lead core located on its center. The typical LRB isolator device is shown in
Figure 1. This LRB isolator device can combine the function of isolation and recentering in a single unit (
i.e., elastomeric bearing), thereby giving structural support, horizontal flexibility, and recentering force to the isolation system [
20,
21]. Furthermore, it produces the required amount of supplemental damping and energy dissipation by adjusting the size of the lead core. The energy dissipation generated by the yielding of the lead core achieves an equivalent viscous damping coefficient up to approximately 30%, and effectively reduces the horizontal displacement. The LRB isolators are usually fabricated in circular sections, and sometimes produced with more than one lead core.
Two LRB models practically used in the construction field (
i.e., LRB1 and LRB2) are selected in this study. Including geometric details illustrated in
Figure 1, mechanical properties needed to simulate their force-displacement responses are presented in
Table 1. As shown in
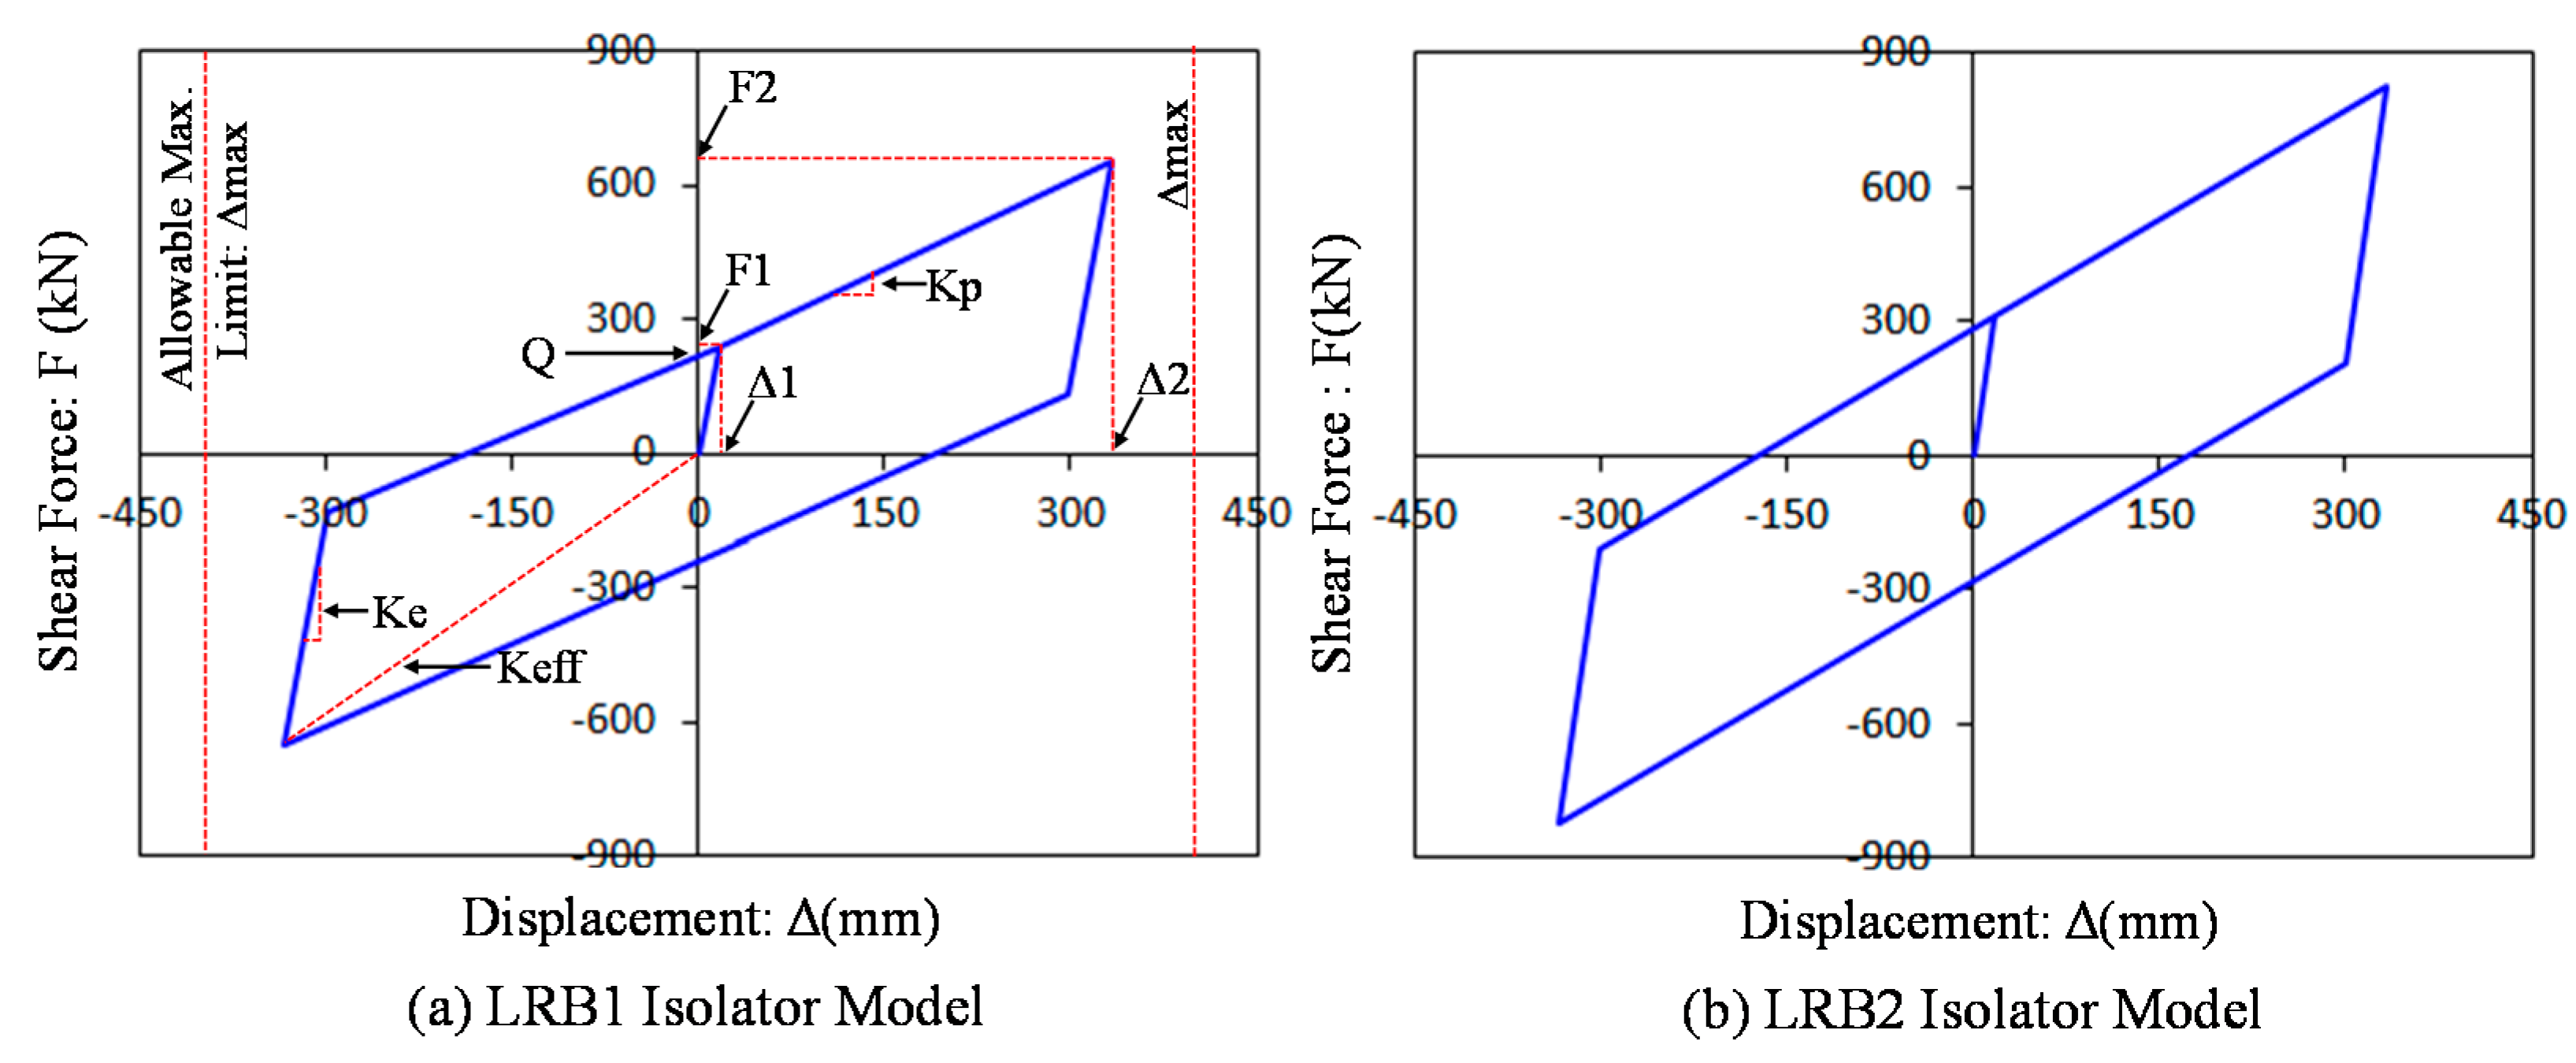
Figure 2, the force-displacement responses can be ideally modelled as bilinear hysteresis loops. The bilinear hysteresis loops considered herein are defined as four key parameters given in
Table 1 per each LRB model, such that: yield displacement (Δ1), yield force (F1), specified design displacement (Δ2), and its corresponding force (F2). The elastic stiffness (K
e) and the post-yield stiffness (K
p) are also defined as the equations involved with these four parameters as follows:
Table 1.
Properties of the LRB isolator models.
Table 1.
Properties of the LRB isolator models.
| Model ID | Δmax (mm) | Fv (kN) | F1 (kN) | F2 (kN) | Δ1 (mm) | Δ2 (mm) | Q (kN) | Ke (kN/mm) | Kp (kN/mm) | Keff (kN/mm) | λeff | Z (mm) | Dg (mm) | dg (mm) | H (mm) | h (mm) | te * (mm) |
|---|
| LRB1 | 400 | 3170 | 259 | 651 | 16 | 333 | 239 | 16.19 | 1.24 | 1.95 | 22.3% | 800 | 750 | 170 | 397 | 337 | 203 |
| LRB2 | 400 | 5780 | 308 | 823 | 16 | 333 | 282 | 19.25 | 1.62 | 2.47 | 20.8% | 900 | 850 | 185 | 382 | 322 | 200 |
Figure 2.
Hysteresis loops of the presented LRB isolator devices modeled as bilinear curves.
Figure 2.
Hysteresis loops of the presented LRB isolator devices modeled as bilinear curves.
The effective stiffness of the hysteretic behavior (K
eff) can be modelled the secant line by means of the ratio as in the following equation:
The characteristic strength indicating force-intercept at the zero displacement (Q) can be also expressed as the function of the post-yield stiffness as follows:
The hysteretic loop area (E
iso) representing the amount of energy dissipation can be obtained from the equation as follows:
The effective viscous damping coefficient (λ
eff) is proportional to the amount of energy dissipation, but inversely related to both the effective stiffness and the square displacement. This damping coefficient also depends on four key parameters, which it refers:
The mechanical properties obtained from calculations in the above equations are summarized in
Table 1. The LRB2 model was designed with geometric parameters which are larger diameters and smaller heights, as compared to those of the LRB1 model. Owing to this parametric property, the slope of the LRB2 model which indicates the stiffness to resist horizontal displacement is overall stiffer than that of the LRB1 model. In addition to the stiffness, other properties such as force capacity, maximum allowable vertical load (F
v), and characteristic strength can be similarly affected by the size of the LRB model. In contrast, the LRB2 model exhibits slightly lower damping coefficient than the LRB1 model as expected in Equation (6). Both LRB models have the same maximum allowable horizontal displacement (Δ
max = 400 mm), representing 1.2 times the length of Δ2.
3. Frame Model and Design
All prototype buildings were designed in accordance with current design guidelines [
22,
23,
24] so as to examine the effect of base isolation systems under earthquake events. They were assumed to be located on the stiff soil site (
i.e., site class D per ASCE 7-05 definition [
24]) in the Los Angeles (LA) area, and be subjected to a 10% probability of exceedance in 50 year (10% in 50 years) seismic hazard corresponding to design-based earthquake (DBE). The seismic design category (SDC) class D is considered to be a high seismicity as stipulated in the ASCE 7-05 design code was applied for frame design. Including dead and live loads (DLs and LLs), basic design conditions are summarized in
Table 2. The mapped spectral accelerations for 0.2- and 1-s periods were taken as 2.35 g and 1.41 g, respectively. The response modification factors were taken as the value of 6 consistent with concentrically brace frame (CBF) structures [
22]. The sizes of structural members (
i.e., brace, beam, and column members) were designed in accordance with the AISC-LRFD manual [
23]. A set of horizontal loads corresponding to the DBE force level should be generated on the basis of equivalent load transformation procedure in order to perform initial frame design through 2D nonlinear pushover analyses. The inter-story drifts obtained from these analyses resulted in the significant design criteria. The member sizes for prototype frame buildings were revised until inter-story drift ratios could fulfill 2% allowable maximum limits [
22,
24]. Furthermore, P-delta amplification factors computed by using analysis results were examined whether stability limits could be satisfied or not.
Table 2.
Basic conditions for frame design (DL: dead loads; LL: live loads).
Table 2.
Basic conditions for frame design (DL: dead loads; LL: live loads).
| Located Area | Loads (Other) | Loads (Roof) | SDC | Site Condition | Occupancy Category |
|---|
| LA Area | DL: 4.12kPa, LL: 2.39kPa | DL: 4.50kPa, LL: 0.96kPa | D Class | Stiff Soil (Class D) | Ordinary Structures |
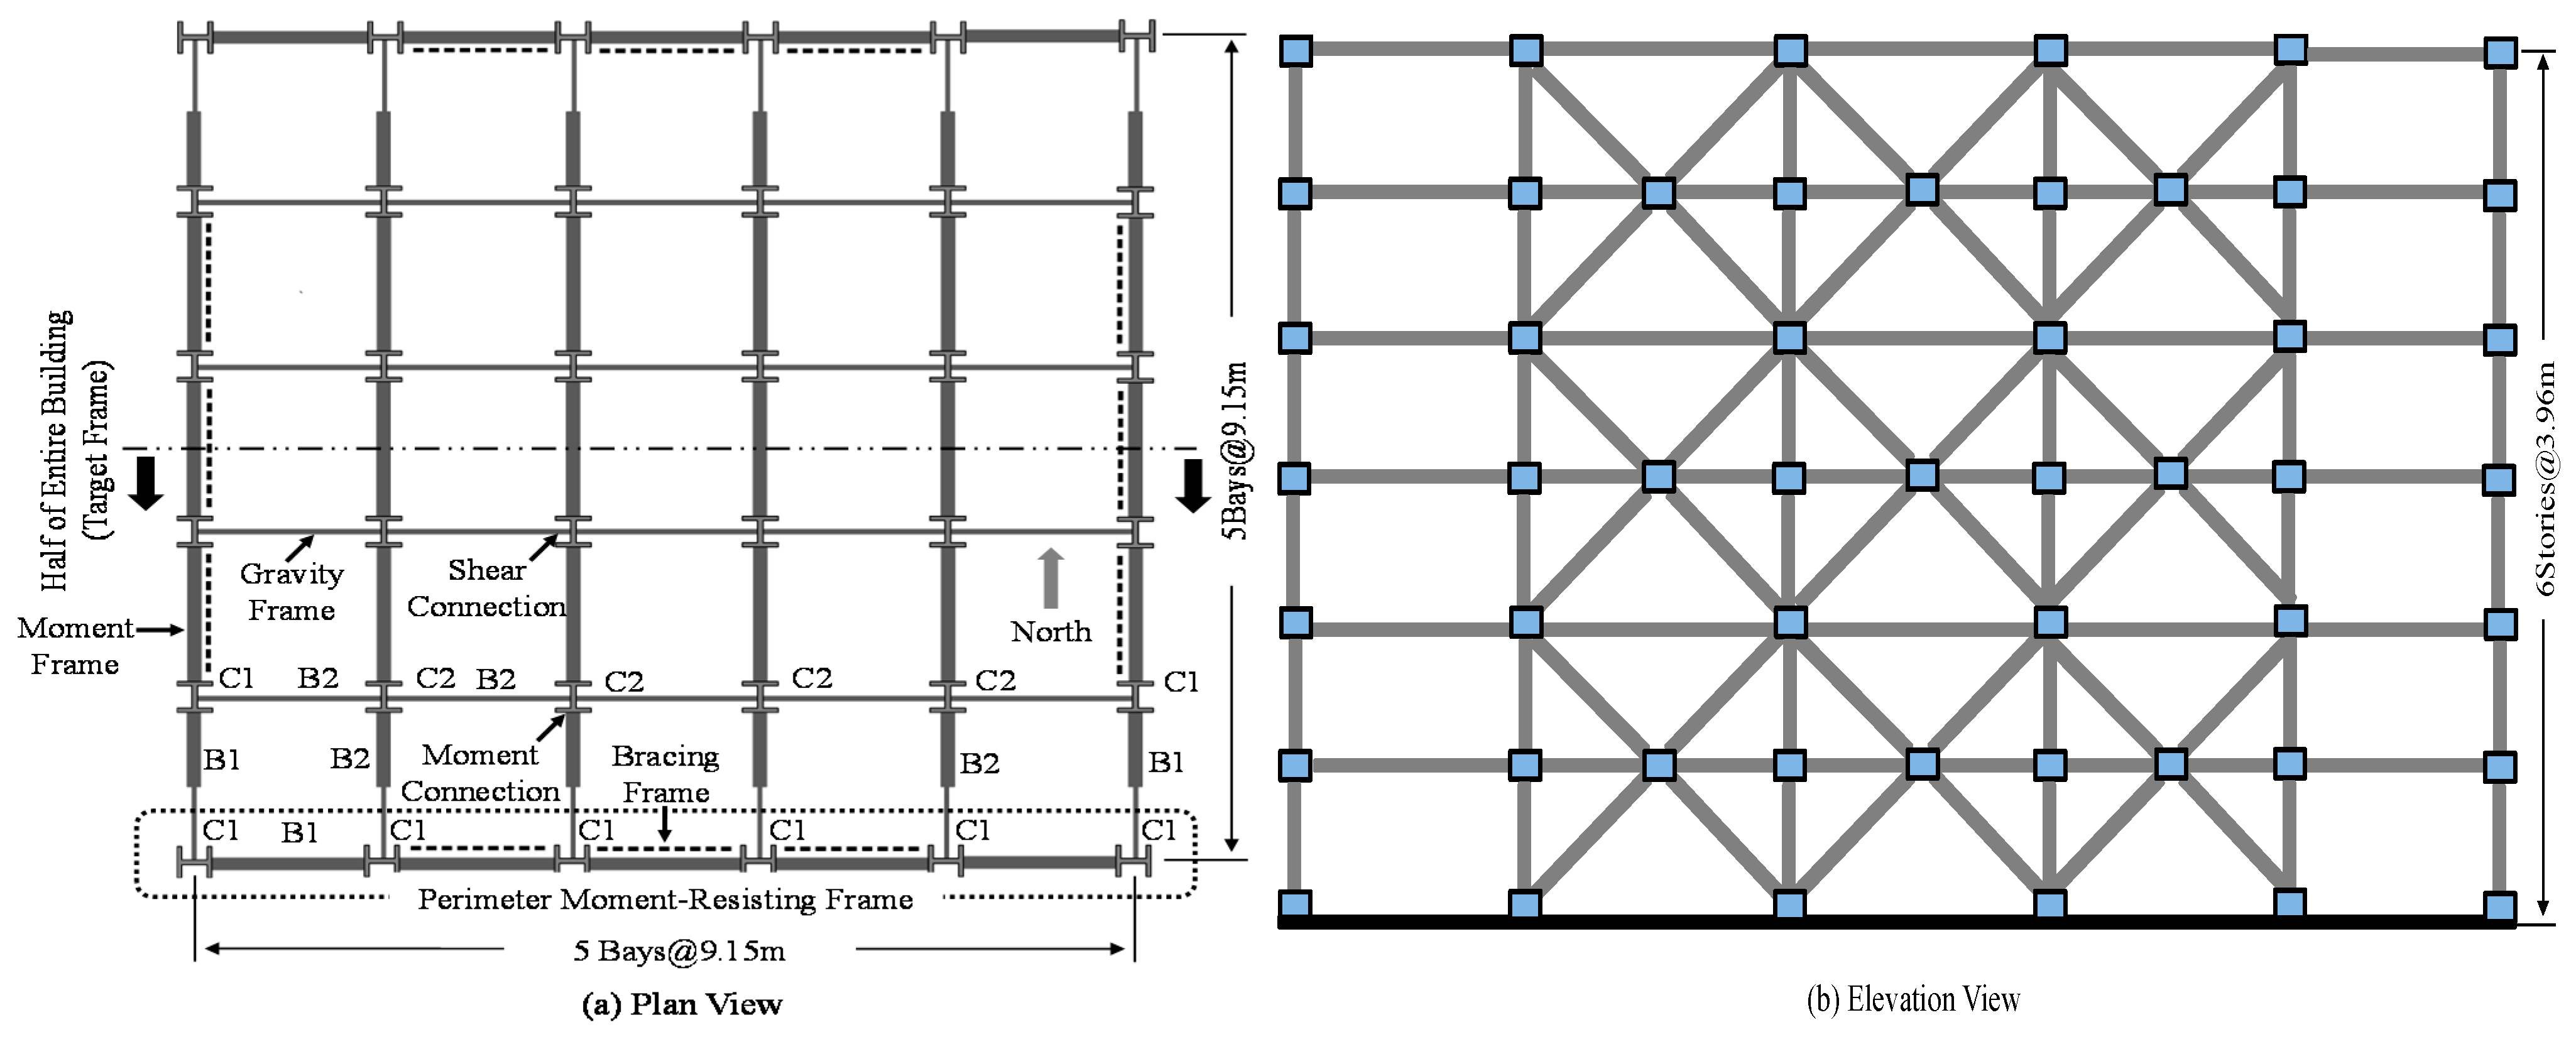
The prototype buildings presented herein were constructed as 6 story steel frame structures with perimeter moment-resisting CBFs to sustainably withstand lateral loads (e.g., wind and earthquake loads). They were designed under essentially regular condition without in-plane torsional effect, owing to symmetrical plan with masses and stiffnesses uniformly distributed. A plan view of 6 story square buildings with five 9.15 m bays is described in
Figure 3a. Three braced frame bays denoted as the dashed lines in the figure were installed on each side. The moment-resisting frames described as the thick lines in the plan view were built with fully restrained-welded beam-to-column connections while the inside gravity load-resisting frames were built with simple pinned connections only withstanding shear force. The elevation view of the perimeter moment-resisting frame is shown in
Figure 3b. Two story X-braced frame systems were accepted for frame design among various types of CBF systems. All of the CBF buildings have 3.96m story height. Column sections were designed with the uniform sizes throughout all stories while beam sections assigned to the higher stories were designed with smaller beam sizes (
i.e., W18x50 beam size). The details for assigning member sizes to frame design are summarized in
Table 3.
Figure 3.
Design of six story braced frame buildings.
Figure 3.
Design of six story braced frame buildings.
Table 3.
Member sizes for prototype braced frame buildings.
Table 3.
Member sizes for prototype braced frame buildings.
| Story | Column * (C1) | Beam * (B1) | CBF ** | Internal Column * (C2) | Internal Beam* (B2) |
|---|
| 1 | W14x109 | W24x84 | HSS6x6x3/8 | W12x87 | W24x68 |
| 2 | W14x109 | W24x84 | HSS6x6x3/8 | W12x87 | W24x68 |
| 3 | W14x109 | W24x68 | HSS6x6x3/8 | W12x87 | W24x68 |
| 4 | W14x109 | W24x68 | HSS6x6x3/8 | W12x87 | W24x68 |
| 5 | W14x109 | W18x50 | HSS6x6x1/4 | W12x87 | W24x68 |
| 6 | W14x109 | W18x50 | HSS6x6x1/4 | W12x87 | W24x68 |
4. Analytical Modeling
The analytical spring models mostly used for simulating the behavior of LRB isolator devices are constructed with the OpenSEES program with an intention to perform nonlinear dynamic time-history analyses [
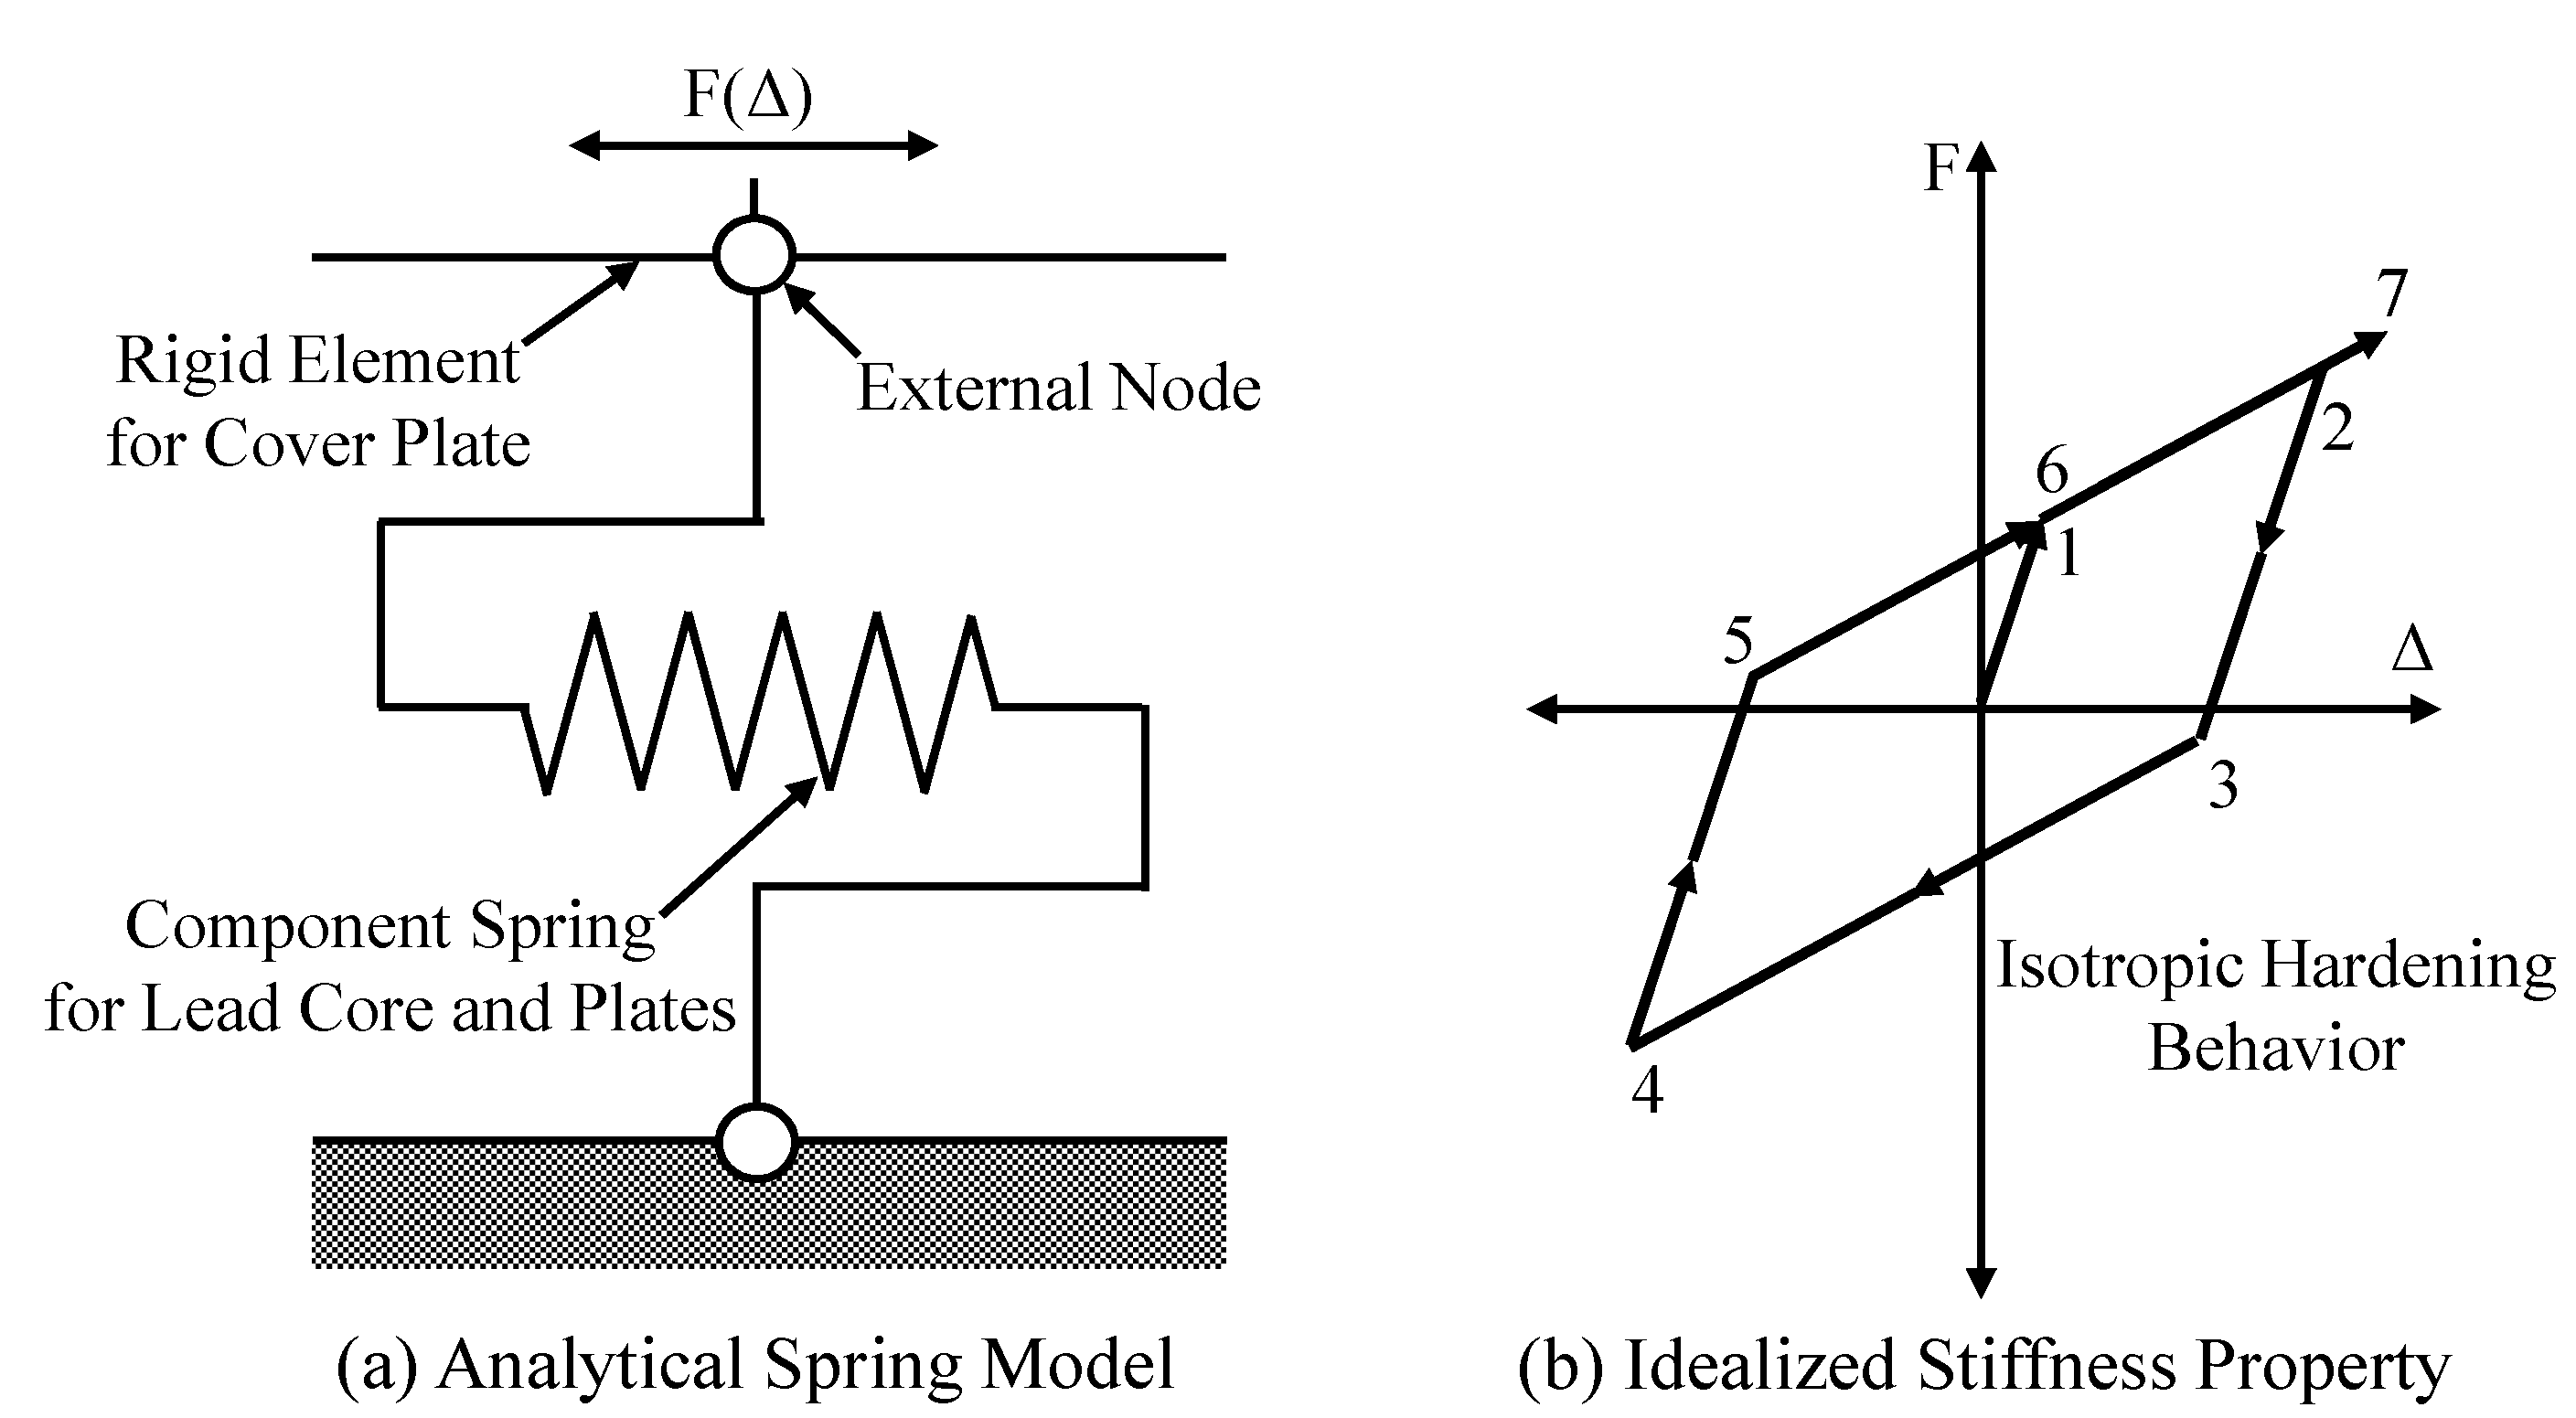
25]. The modeling attributes are illustrated in
Figure 4. The main part of the LRB isolator (
i.e., elastomeric rubber and lead core) was modeled as the zero-length nonlinear component spring while the cover plate was modeled as the rigid element (see
Figure 4a). The behavior of the LRB isolator can be ideally characterized by the bi-linear stiffness model using three key parameters such as initial stiffness (K
e), yield force (F1), and post-yield stiffness (K
p) (see
Figure 2 and
Figure 4b), and simply simulated by using isotropic hardening material command provided in the OpenSEES program. It was assigned to the component spring element for the purpose of reproducing the force-displacement response curve. The analytical component spring models classified herein as LRB1 and LRB2 were installed on the base-isolated frame model (see
Figure 5). Each LRB spring model includes the force-displacement response presented in
Figure 2. The column bases of as-built frame model without base isolation are considered to be fixed. Accordingly, LRB-isolated frame models (
i.e., LRB1 and LRB2 models) have flexible end boundary conditions while as-built frame models possess fixed end boundary conditions.
Figure 4.
Analytical modeling attributes for component spring and its behavioral property.
Figure 4.
Analytical modeling attributes for component spring and its behavioral property.
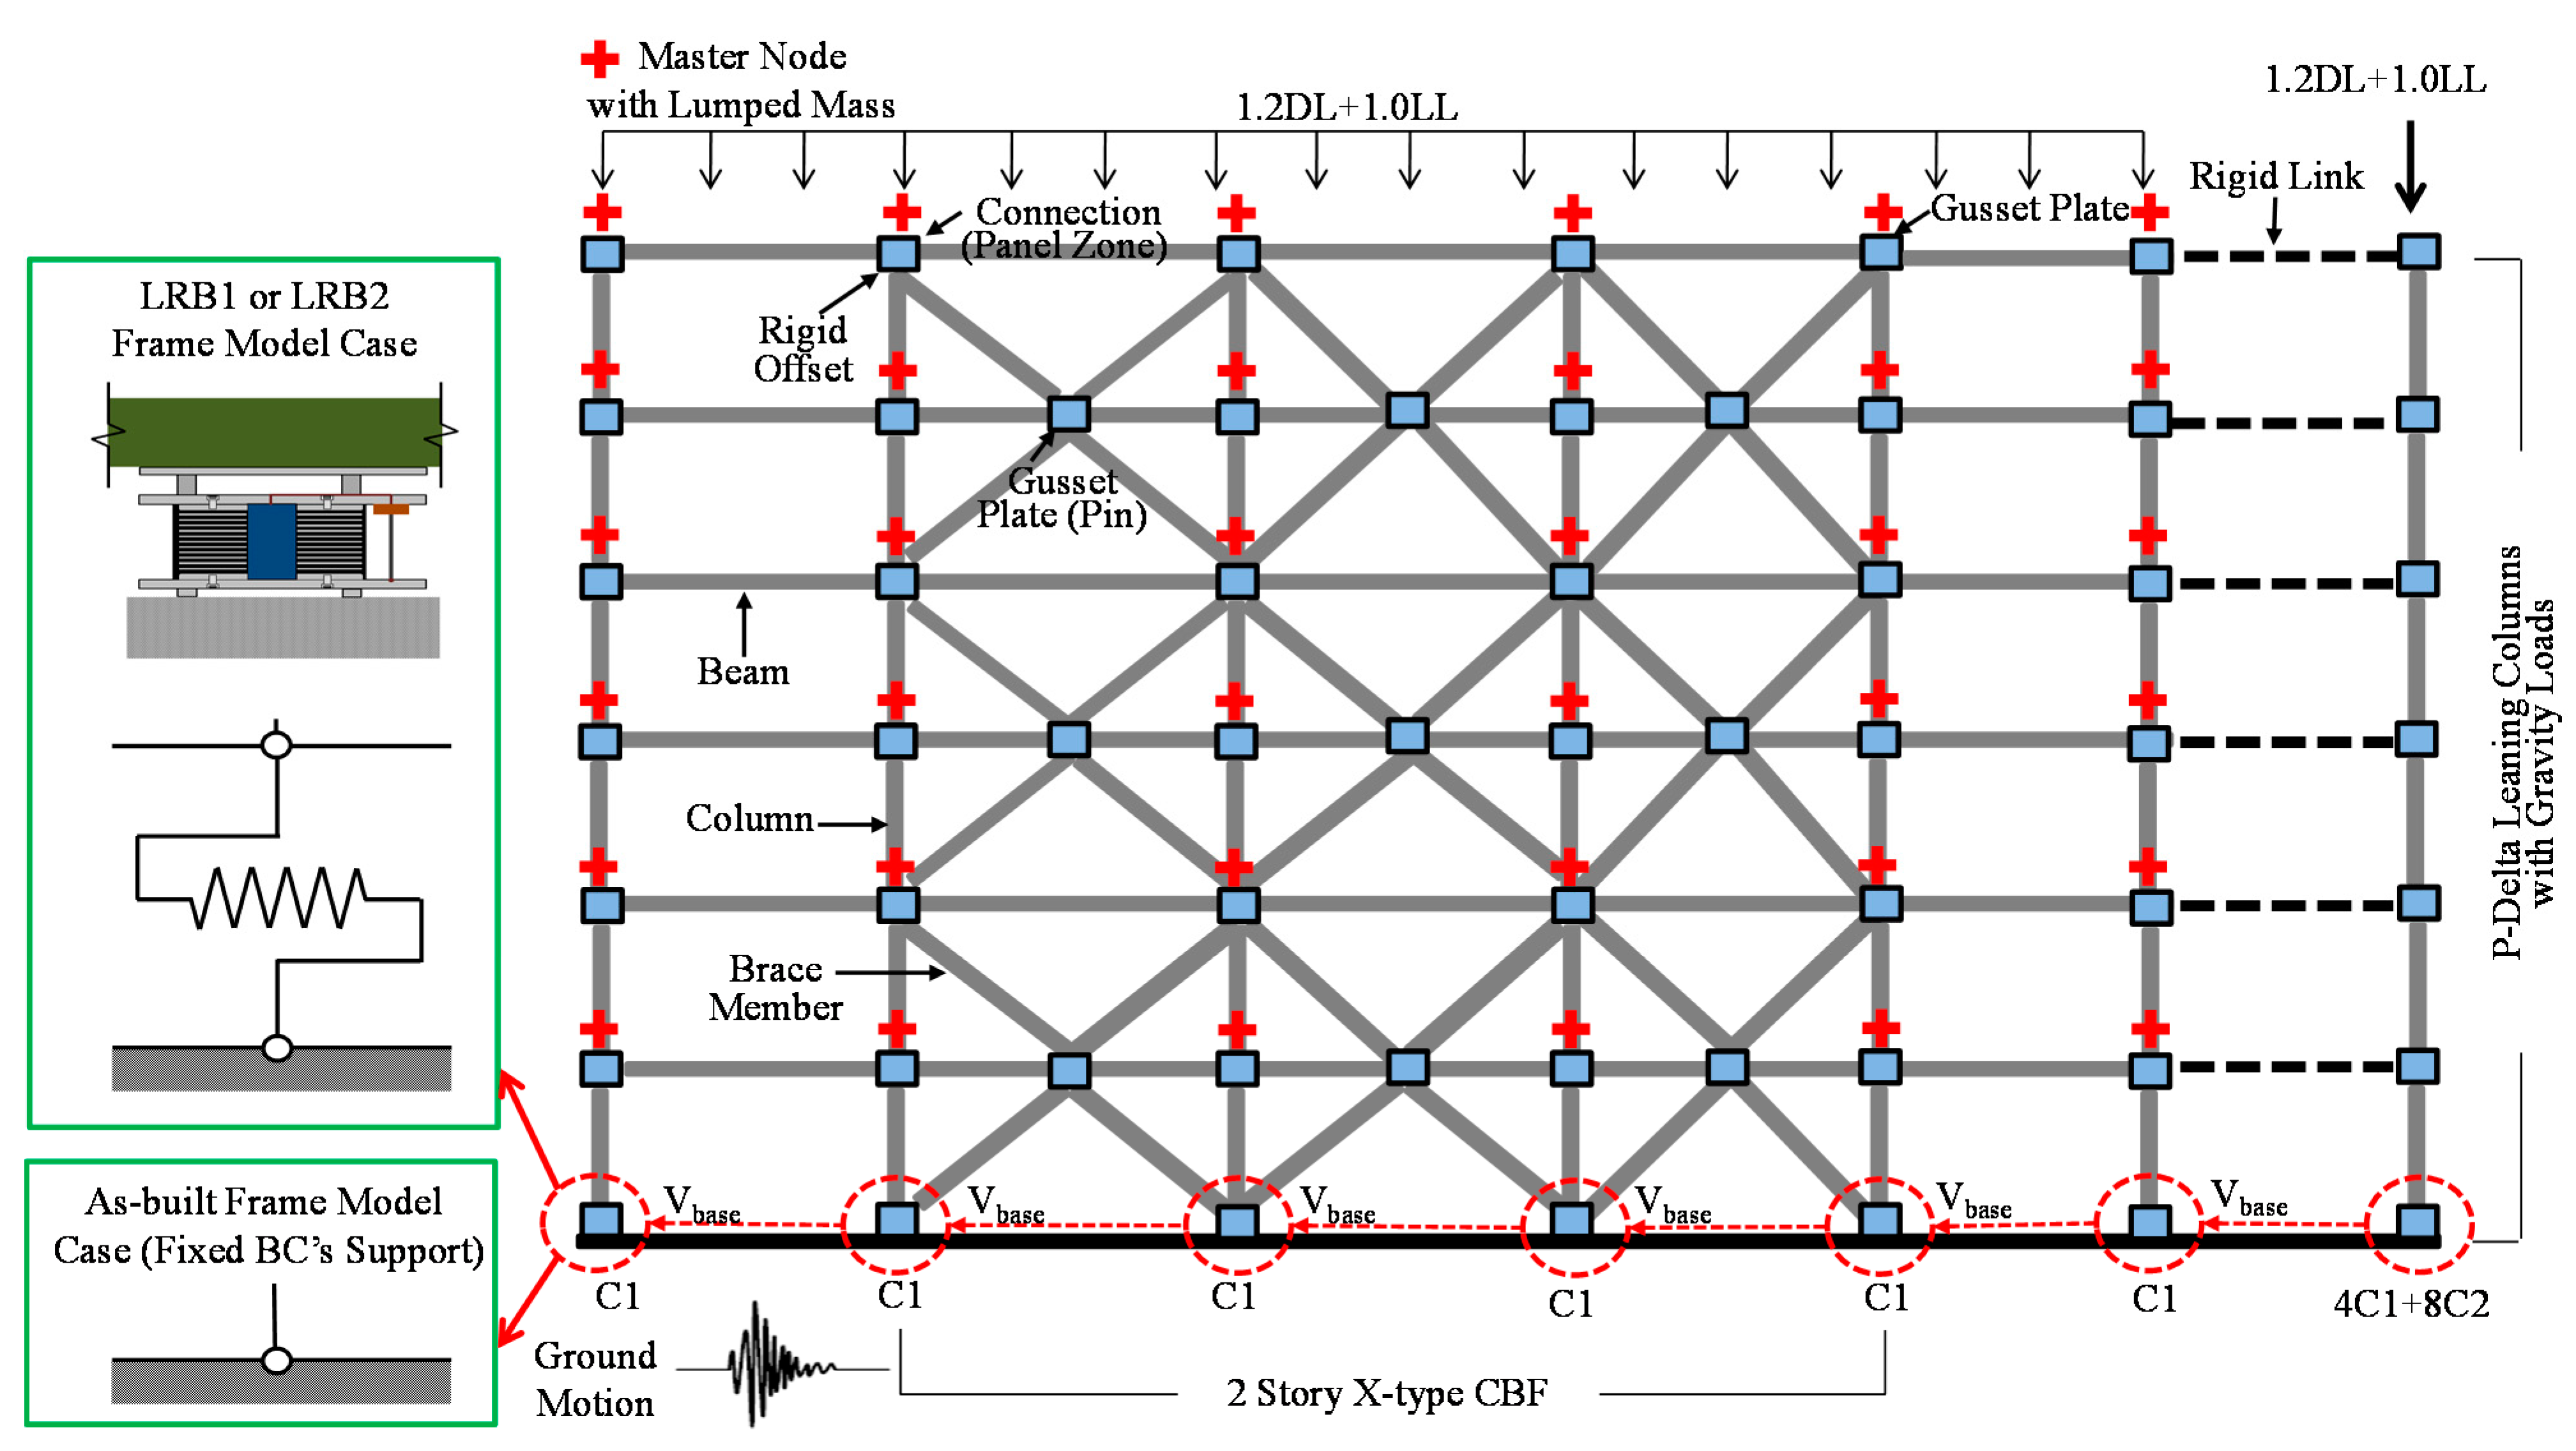
The modeling attributes for prototype frame buildings are shown in
Figure 5. All building models are symmetrical to their center axes with uniform mass and stiffness distribution, and thus can be modelled as 2D frame models. The 2D frame models consisting of perimeter moment-resisting frames and gravity load-resisting frames were used for nonlinear dynamic time-history analyses with several NF ground motions. The beam and column members in the moment-resisting frame were modeled as nonlinear beam-column elements with 2D fiber sections aiming to reproduce inelastic behavior. P-delta coordinate transformations incorporating to these nonlinear elements were taken into consideration for simulating geometric nonlinearity involving with second-order large deformation. The welded-type moment connections between beam and column as well as the stiffening gusset plates were constructed with the rigid offsets assigned to the beam members. The leaning column members in the interior gravity load-resisting frames are required to withstand half of entire building weight. These leaning columns were modeled as elastic beam-column elements with geometric section properties (e.g., cross-section area, second moment of inertia, and torsional moment of inertia), and mainly subjected to dead plus live loads. The rigid links replaced for concrete slabs or diaphragm constraints were equipped between perimeter frames and interior frames so that each floor should translate as a rigid body. All steel members were fabricated with Gr. 50 steel containing 1.5% strain hardening ratio. The transient equilibrium method suggested by Newmark [
26] was used to perform the nonlinear dynamic time-history analyses. According to common practice for code designed steel structures [
27,
28], an effective viscous damping coefficient of 5% was applied to the analytical frame models. The effective damping can be generated by using the Rayleigh command provided in the OpenSEES program. The point masses composed of dead loads plus 0.2 times live loads were assigned to individual nodes in order to generate shear forces resulting from ground acceleration. The resulting data such as shear forces and displacements were collected by using the recorder command.
Figure 5.
Modeling attributes for 2D frame models.
Figure 5.
Modeling attributes for 2D frame models.
The brace members were also modeled as nonlinear beam-column elements with 2D fiber sections. The modeling of the brace members is shown in
Figure 6. The discrete fiber sections that contain nonlinear material behavior can configure the cross-section of the hollow steel tube. The section properties were assigned to the integration points distributed over the nonlinear beam-column element. The brace members were connected to other members as pinned connections because they were considered to be structural elements only subjected to axial forces. For this reason, the brace member with the hollow tube section is susceptible to buckling in compression. The initial imperfection generated by offsetting the node on the middle of the brace member may be required to reproduce buckling failure in the frame model. The brace member under compression behaves as elastic until it reaches the buckling state (P
cr). Global buckling that indicates the peak load suddenly occurs at the middle of the brace member prior to the compressive yielding of the brace member. Moreover, other characteristic branches concerning negative stiffness after post-buckling, unloading, elastic tension reloading, and uniaxial tensile yielding (P
y) are also found at the hysteretic behavior curve (see
Figure 6b).
Figure 6.
Modeling of the brace members.
Figure 6.
Modeling of the brace members.
5. Near-Fault Ground Motions
The ground motion data based on historic earthquake records were developed as a part of the FEMA/SAC project [
29]. A set of 20 ground motion time histories (10 two-components) were selected to represent near-fault (NF) ground motions from earthquakes possessing a variety of faulting mechanisms (e.g., strike, rupture, oblique, and thrust) in the magnitude of 6.7 to 7.4 on the Richter scale (see
Table 4). The individual components of each ground motion couple were rotated with 45 degrees away from fault-normal and fault-parallel orientations. The closest distances to reach shall crustal faults are ranged from 0 to 10 km, and the closest distances for blind thrust faults are ranged from 6 to 18 km [
30,
31]. These magnitudes and distance ranges govern the UBC Seismic Hazard Zone 4 for return periods of 10% in 50 years [
29,
30,
31]. Detailed information on the NF ground motions used in the analyses is given to
Table 4 with the variability of magnitude, distance from the epicenter, and duration time. All of NF ground motions presented herein have been derived from historical earthquake recordings. The maximum and minimum peak ground accelerations (PGAs) are also given to this table. Owing to the variability of NF ground motions used herein, statistical investigations with respects to base shear forces and inter-story drifts for individual model cases are conducted after observing the analysis results.
Table 4.
Near-fault ground motion data used for nonlinear dynamic analyses (PGA: peak ground acceleration).
Table 4.
Near-fault ground motion data used for nonlinear dynamic analyses (PGA: peak ground acceleration).
| Ground Motion ID | Earthquake Record | Richter Scale | Distance (km) | Duration (sec) | Max. PGA (g) | Min. PGA (g) |
|---|
| NF01 | 1978 Tabes | 7.4 | 1.2 | 50 | 0.90 | −0.86 |
| NF02 | 1979 Tabes | 7.4 | 1.2 | 50 | 0.98 | −0.75 |
| NF03 | 1989 Loma Prieta (Los Gatos) | 7 | 3.5 | 25 | 0.72 | −0.64 |
| NF04 | 1989 Loma Prieta (Los Gatos) | 7 | 3.5 | 25 | 0.46 | −0.44 |
| NF05 | 1989 Loma Prieta (Lex Dam) | 7 | 6.3 | 40 | 0.59 | −0.69 |
| NF06 | 1989 Loma Prieta (Lex Dam) | 7 | 6.3 | 40 | 0.37 | −0.28 |
| NF07 | 1992 Mendocino | 7.1 | 8.5 | 60 | 0.64 | −0.62 |
| NF08 | 1992 Mendocino | 7.1 | 8.5 | 60 | 0.60 | −0.66 |
| NF09 | 1992 Erzincan | 6.7 | 2.0 | 21 | 0.43 | −0.31 |
| NF10 | 1992 Erzincan | 6.7 | 2.0 | 21 | 0.46 | −0.27 |
| NF11 | 1992 Landers | 7.3 | 1.1 | 50 | 0.71 | −0.71 |
| NF12 | 1992 Landers | 7.3 | 1.1 | 50 | 0.61 | −0.80 |
| NF13 | 1994 Northridge (Rinaldi) | 6.7 | 7.5 | 15 | 0.62 | −0.89 |
| NF14 | 1994 Northridge (Rinaldi) | 6.7 | 7.5 | 15 | 0.38 | −0.39 |
| NF15 | 1994 Northridge (Olive View) | 6.7 | 6.4 | 60 | 0.51 | −0.73 |
| NF16 | 1994 Northridge (Olive View) | 6.7 | 6.4 | 60 | 0.60 | −0.56 |
| NF17 | 1995 Kobe | 6.9 | 3.4 | 60 | 1.09 | −0.73 |
| NF18 | 1995 Kobe | 6.9 | 3.4 | 60 | 0.58 | −0.57 |
| NF19 | 1995 Kobe (Takatori) | 6.9 | 4.3 | 40 | 0.79 | −0.51 |
| NF20 | 1995 Kobe (Takatori) | 6.9 | 4.3 | 40 | 0.38 | −0.42 |
Figure 7 shows 5% damped spectral accelerations (Sg) for individual NF ground motions according as the fundamental time period of the structure (T) increases. The mean (or average) spectral acceleration for 20 NF ground motions with 1.0 scale factors (SF) is also plotted as the red line in this figure. The base shear forces required for seismic design are easily estimated by utilizing these response spectra since the structures are assumed to behave as single degree of freedom (SDOF) systems subjected to independent earthquake ground motions. The OpenSEES program can provide the computational command to estimate the fundamental time periods of the LRB frame models, which have an influence on the initial stiffness of the used LRB isolator devices, including those of the as-built frame models. On finding out the fundamental time period of the relevant structure, the peak response of the structure can be estimated by reading the acceleration value from the response spectrum curve for appropriate natural frequency or fundamental time period. The mean response spectral acceleration for the as-built frame model was taken as approximately 1.38 g for 0.8 s fundamental time period while that for the LRB-isolated frame model (
i.e., LRB1 frame model) was taken as 0.89 g for 1.35 s one (see
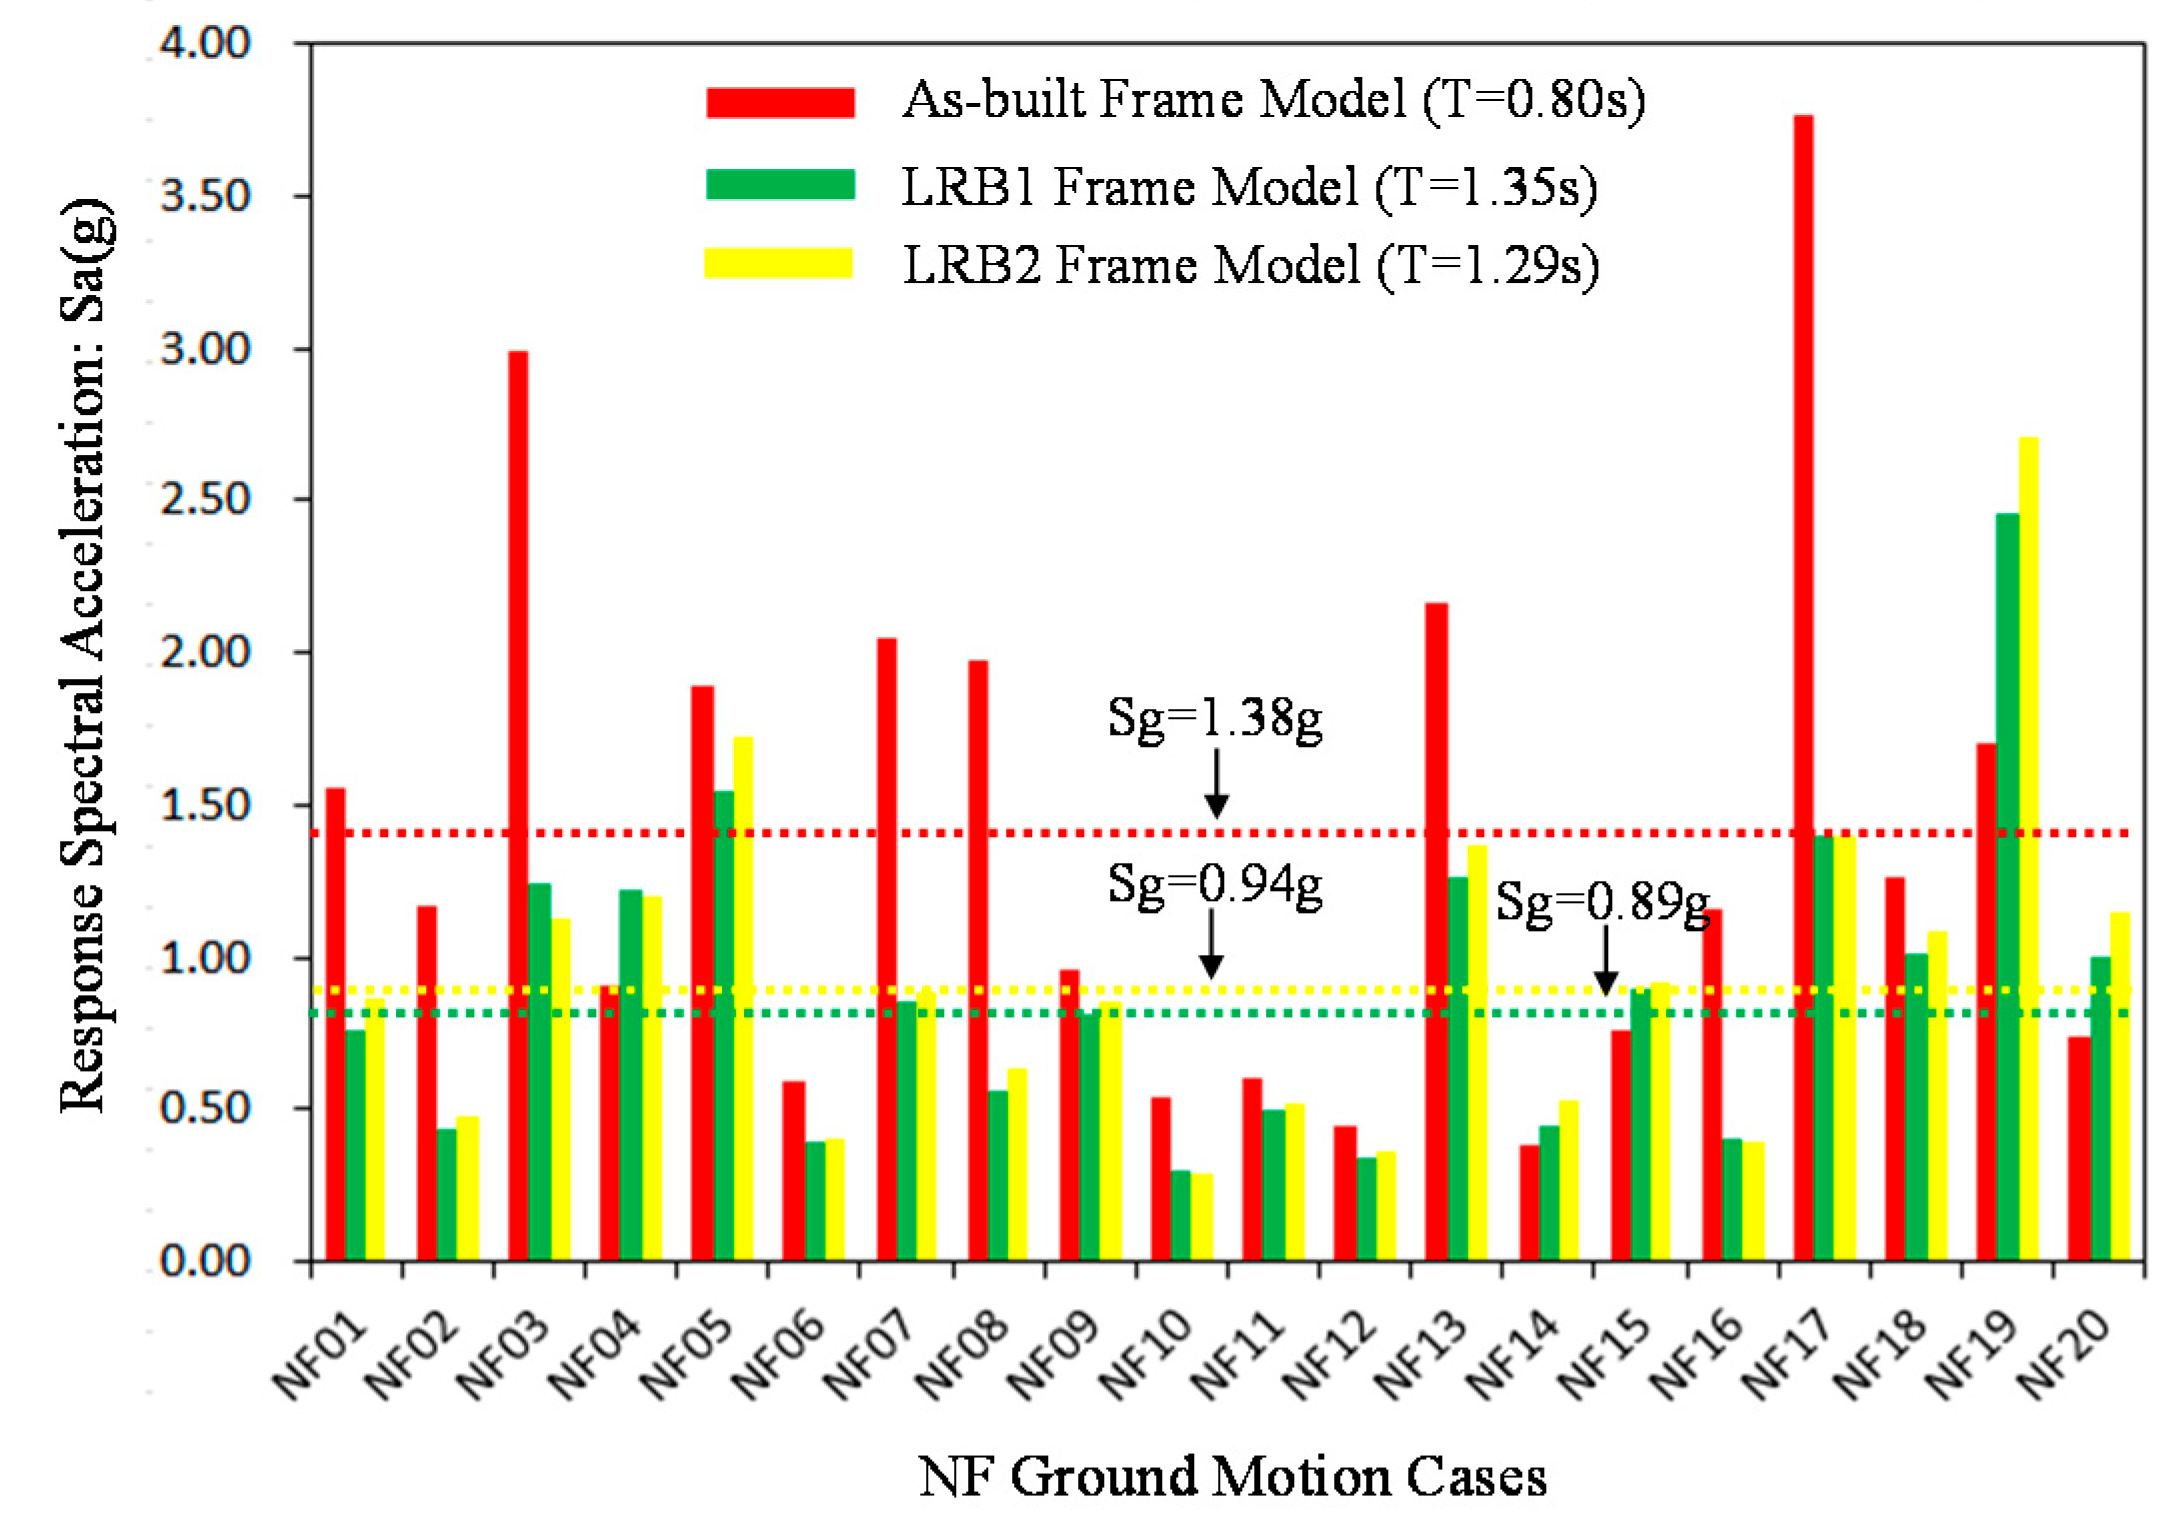
Figure 7). The LRB isolators extend the fundamental time period of the structure away from the high band of the spectral acceleration, meaning that they contribute effectually toward reducing seismic shear forces converted from ground accelerations. The response spectral accelerations for individual NF ground motion data according to each model case are presented in
Figure 8. The limits of the mean response spectral accelerations for individual model cases (
i.e., 1.38 g, 0.94 g, and 0.89 g for As-built, LRB2, and LRB1 frame model, respectively) are also plotted as dashed lines in the figure.
Figure 7.
5% damped spectral accelerations for near-fault ground motions (scale factor (SF) = 1.0) and fundamental time periods for individual model cases.
Figure 7.
5% damped spectral accelerations for near-fault ground motions (scale factor (SF) = 1.0) and fundamental time periods for individual model cases.
Figure 8.
Response spectral accelerations for individual ground motion data according to each model case.
Figure 8.
Response spectral accelerations for individual ground motion data according to each model case.
6. Seismic Responses
The nonlinear dynamic time-history analyses were performed on 2D frame models with 20 NF ground motion data mentioned above in an attempt to check the efficacy of LRB isolation systems in the frame building. The seismic responses of the LRB-isolated frame models were compared to those of the as-built frame model in terms of roof displacements, base shear forces, and inter-story drifts. The resulting curves from time-history analyses performed with representative NF08 ground motion data are presented as compared to each frame model in
Figure 9,
Figure 10 and
Figure 11.
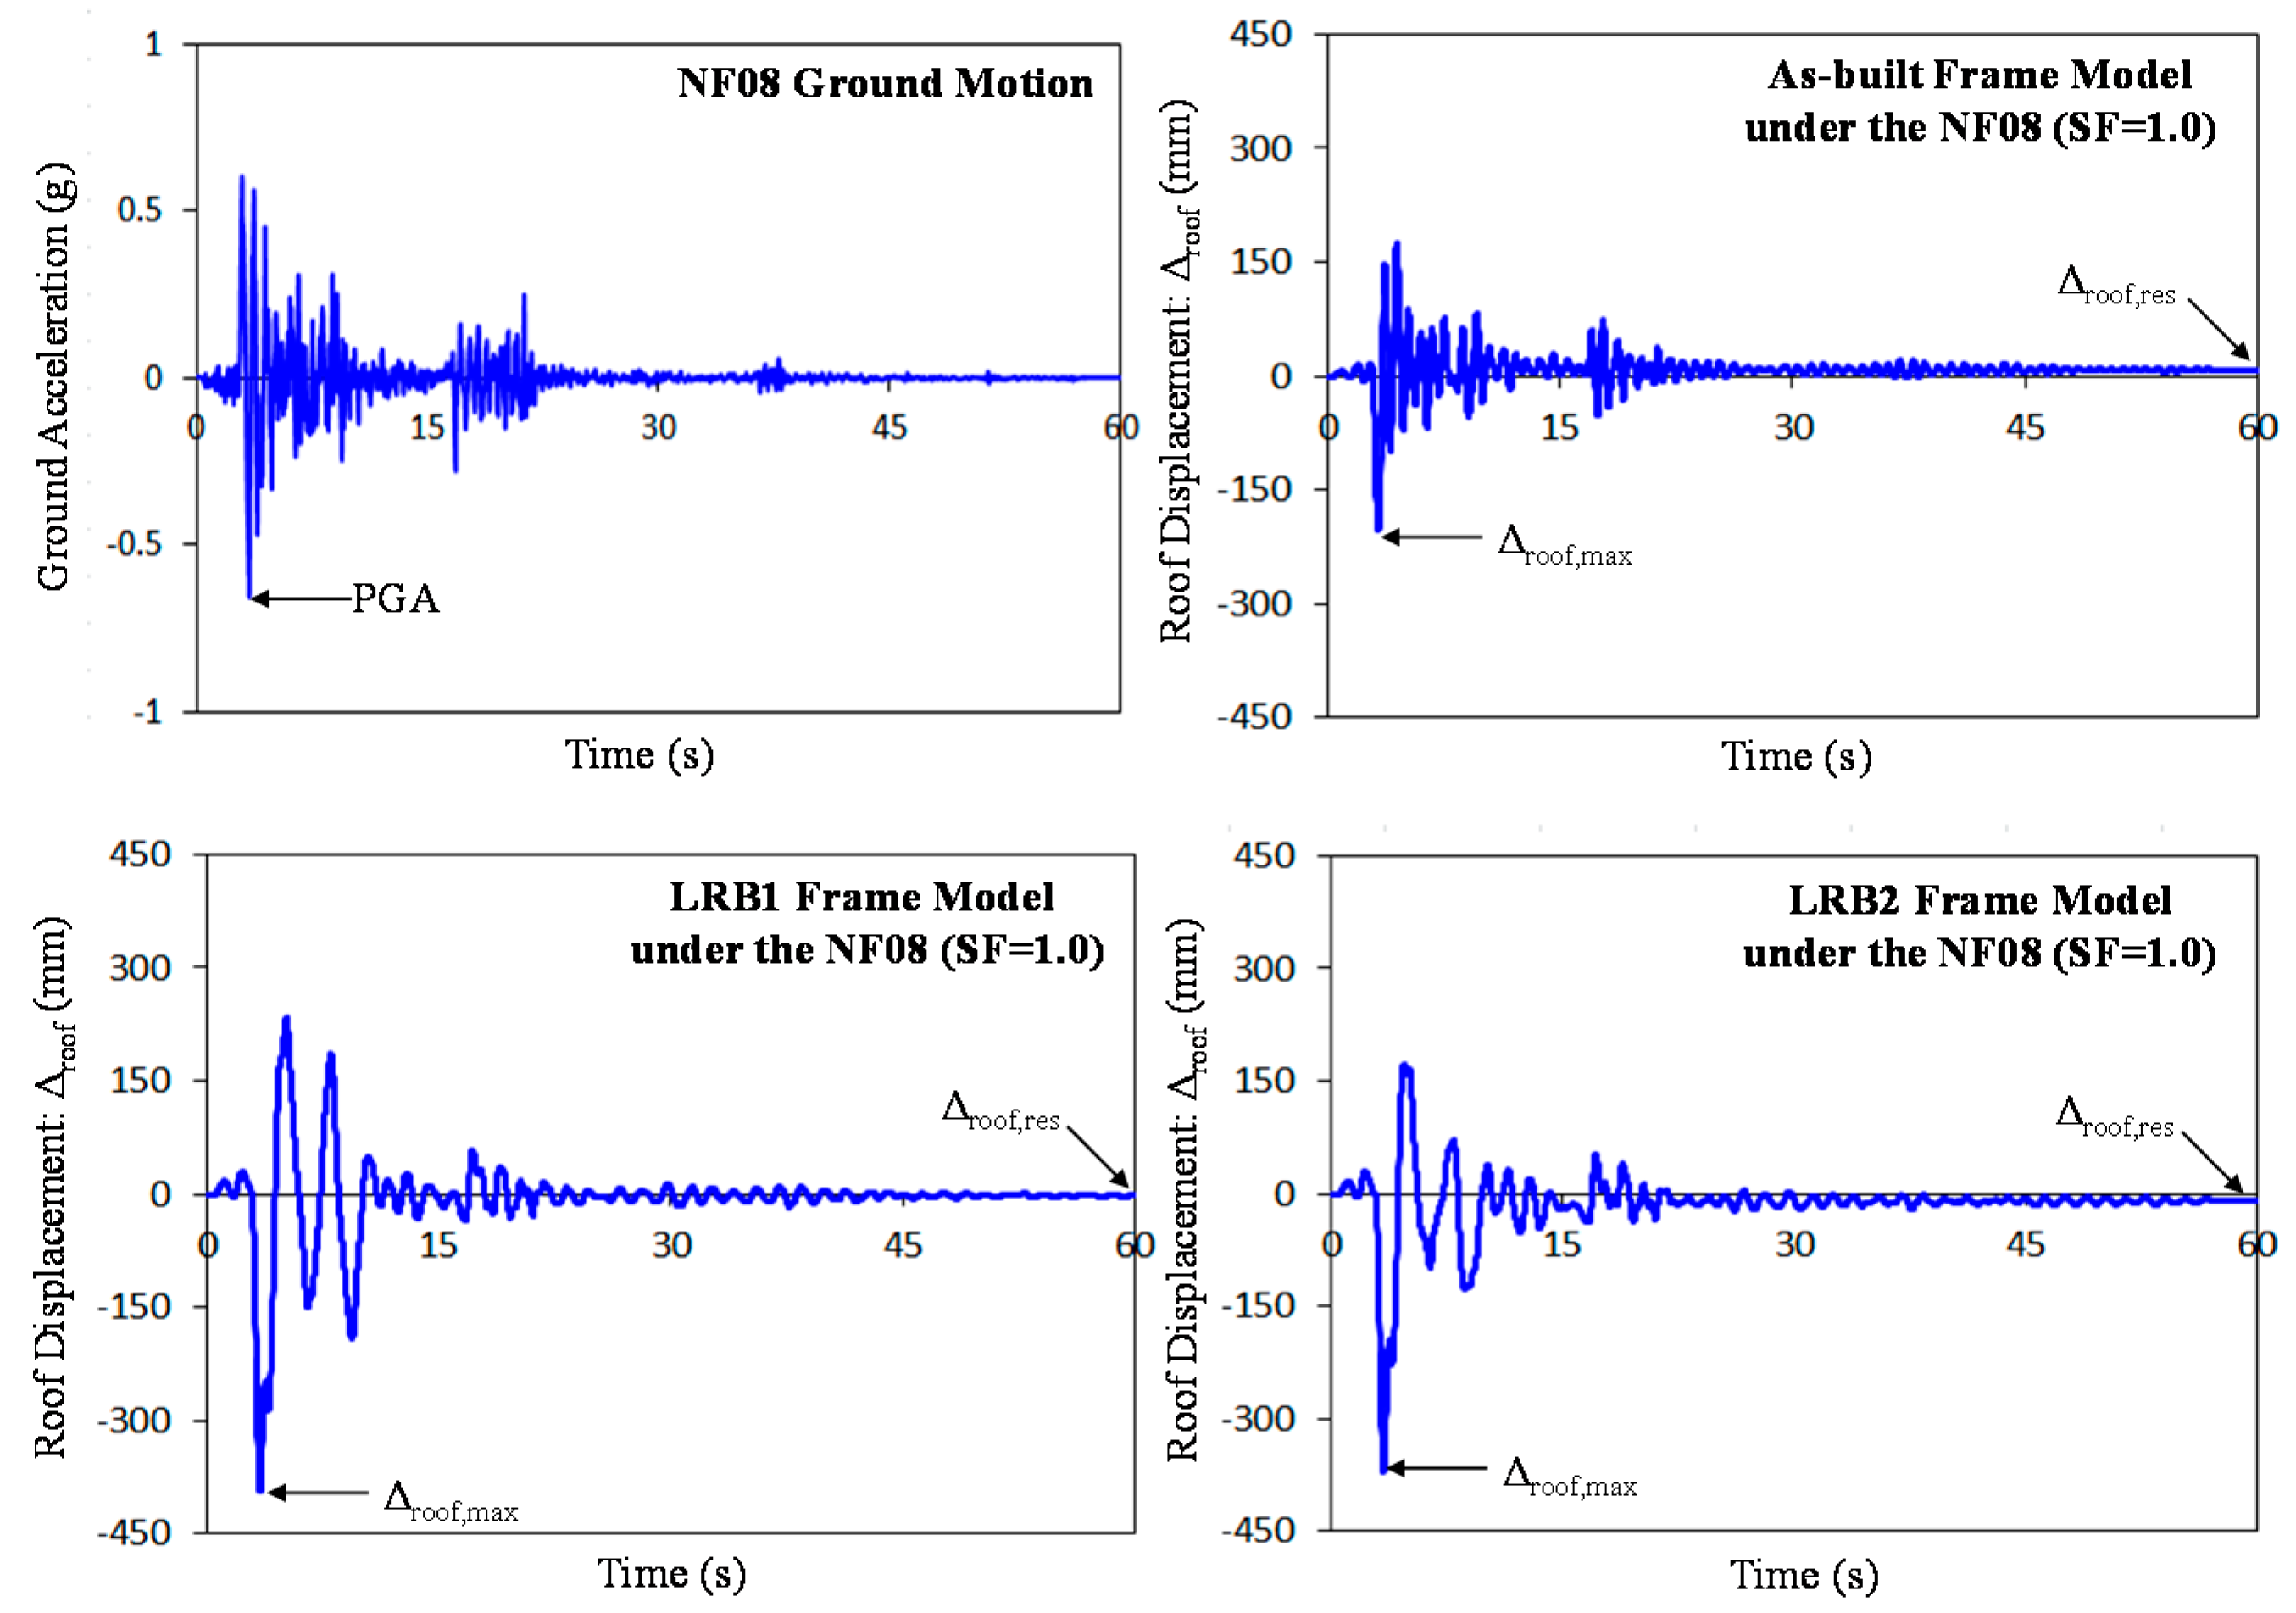
Figure 9.
Nonlinear dynamic analysis results (time vs. roof displacement curves).
Figure 9.
Nonlinear dynamic analysis results (time vs. roof displacement curves).
Figure 10.
Nonlinear dynamic analysis results (roof displacement vs. total base shear force curves).
Figure 10.
Nonlinear dynamic analysis results (roof displacement vs. total base shear force curves).
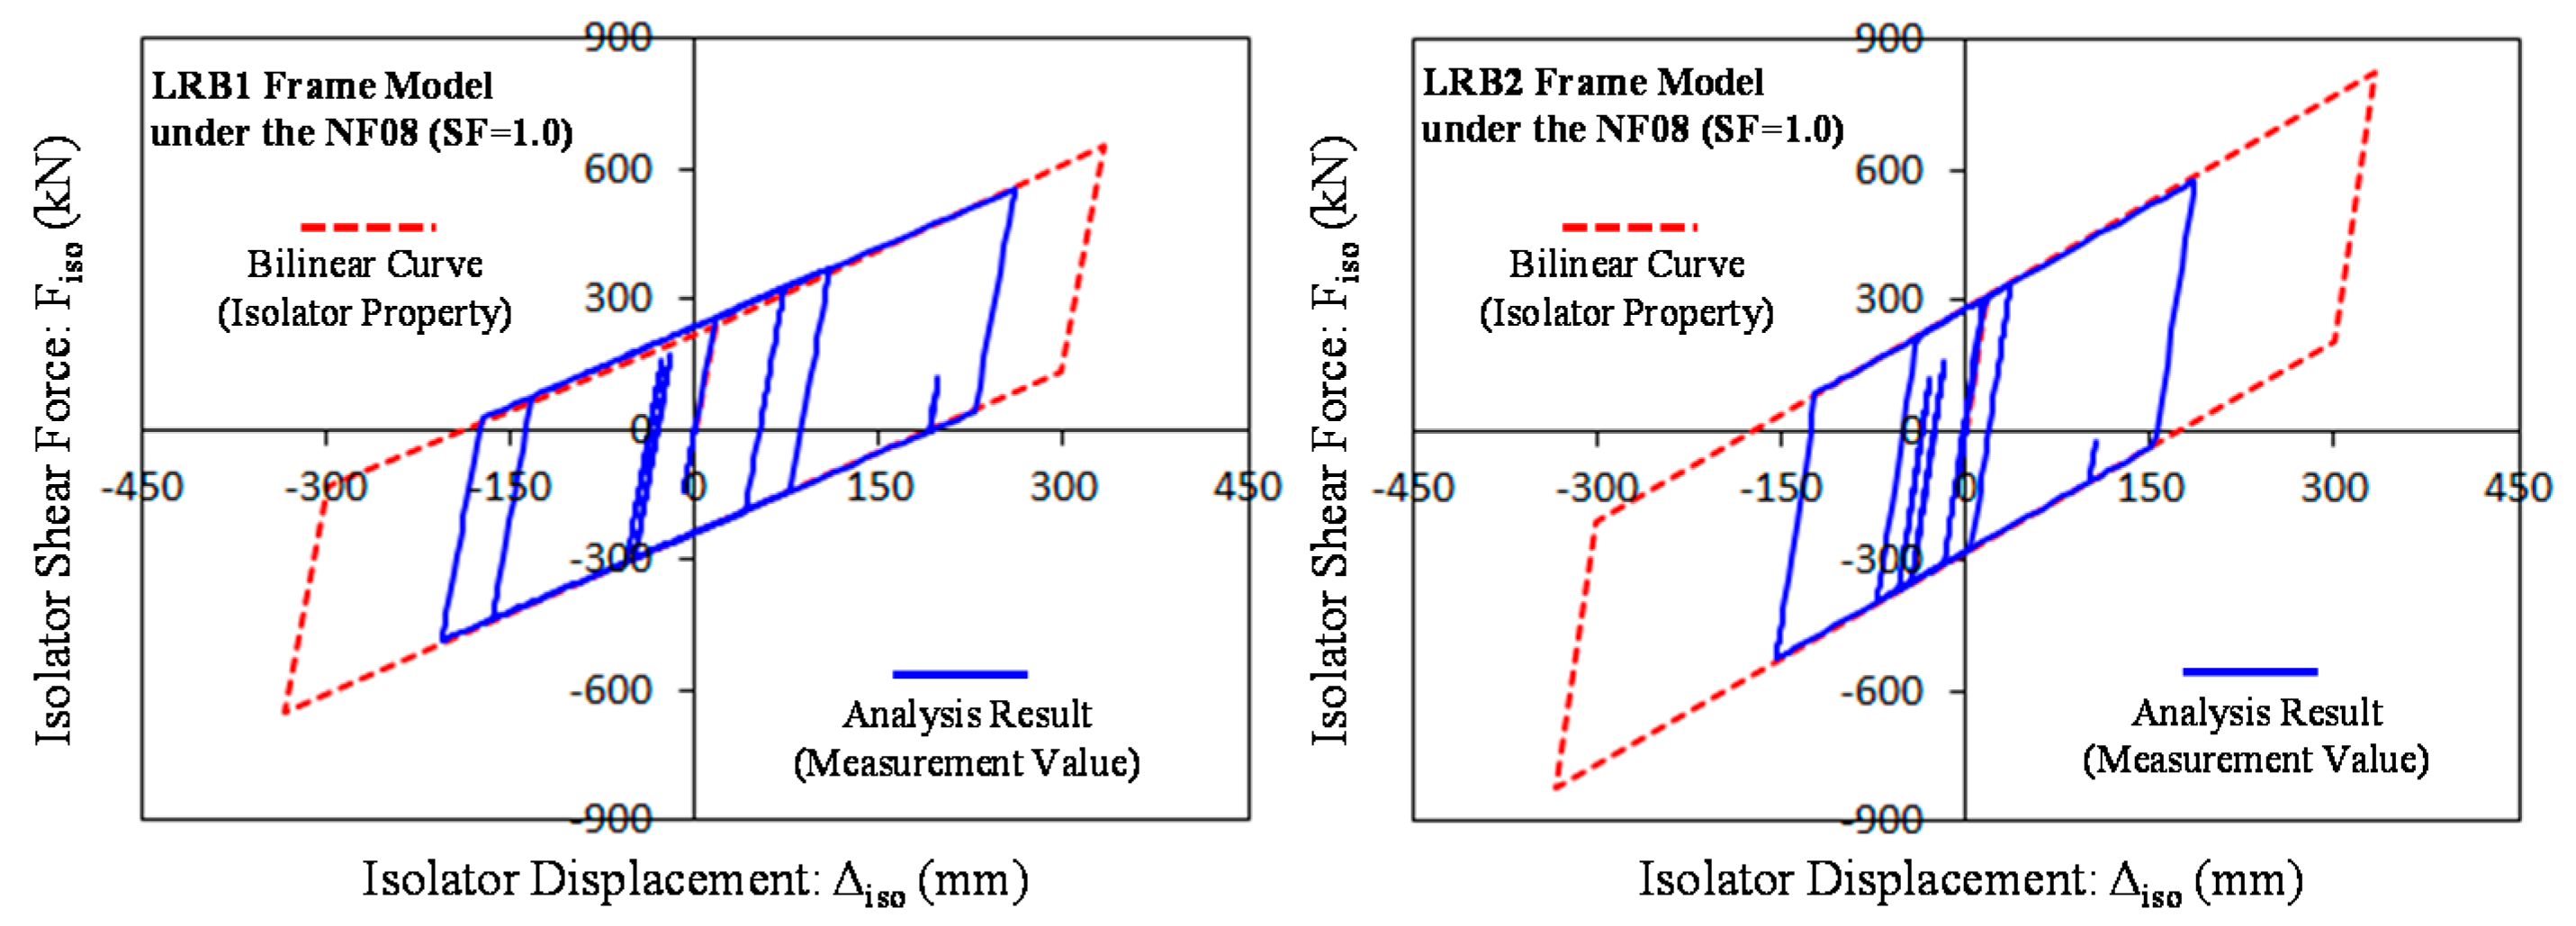
Figure 11.
Displacement vs. shear force curves measured at the exterior column-base isolator.
Figure 11.
Displacement vs. shear force curves measured at the exterior column-base isolator.
The NF08 ground motion has a relatively long duration time (60 s) with 0.66 g peak ground acceleration (PGA). The time
versus roof displacement curves presented in
Figure 9 are obtained after conducting time-history analyses on three comparative frame models subjected to this ground motion. The LRB-isolated frame models show larger maximum roof displacements than the as-built frame model without base isolation because they are equipped with flexible end boundary conditions. The maximum roof displacements for the LRB1 and LRB2 frame model under the NF08 ground motion with 1.0 scale factor are approximately 400 mm and 390 mm, respectively. On the other hand, the maximum roof displacement of the as-built frame model is approximately 200 mm, indicating almost half of the maximum roof displacements of the LRB-isolated frame models. The generation times of maximum roof displacements are almost same for each frame model, and commonly follow PGA time by about 1 s. As compared to the as-built frame model, both larger amplitudes and more vibrations are displayed in the LRB-isolated frame models with relatively longer fundamental time periods.
For another analysis results, the roof displacement
versus total base shear force curves are presented in
Figure 10. The total base shear forces are obtained by summing up all reaction forces measured at the column bases. The LRB-isolated frame models exhibit smaller total base shear forces than the as-built frame model regardless of having much larger maximum roof displacement. Overall, the maximum total base shear forces of the as-built frame model, which is two times greater than those of the LRB-isolated frame models, are delivered into the superstructure. Therefore, LRB isolator devices acting as laterally flexible stiffnesses equipped on boundaries between superstructures and substructures alleviate structural damage effectually as reducing the generation of base shear forces changed from ground accelerations. As shown in the figures, the force-displacement responses of the LRB-isolated frame models can be characterized as bilinear hysteresis loops similar to the behavior of the typical LRB isolator. It indicates that the behavior of the entire building is considerably affected by the mechanical property of the used base isolation system. The LRB2 frame model has slightly larger maximum total base shear force than the LRB1 frame model on the ground of inherent characteristics for the LRB isolator devices used. The isolator displacement
versus shear force curves measured at the exterior column-base isolator (see C1 position of
Figure 5) are also investigated to verify adequacy for the analytical modeling of the base isolation system. As shown in
Figure 11, the bilinear approximation curves plotted based on isolator properties (dashed red lines) have good agreements with the measured analytical results (solid blue lines) in terms of initial stiffness, yield force, post-yield stiffness, and force at the specific point.
7. Statistical Investigations
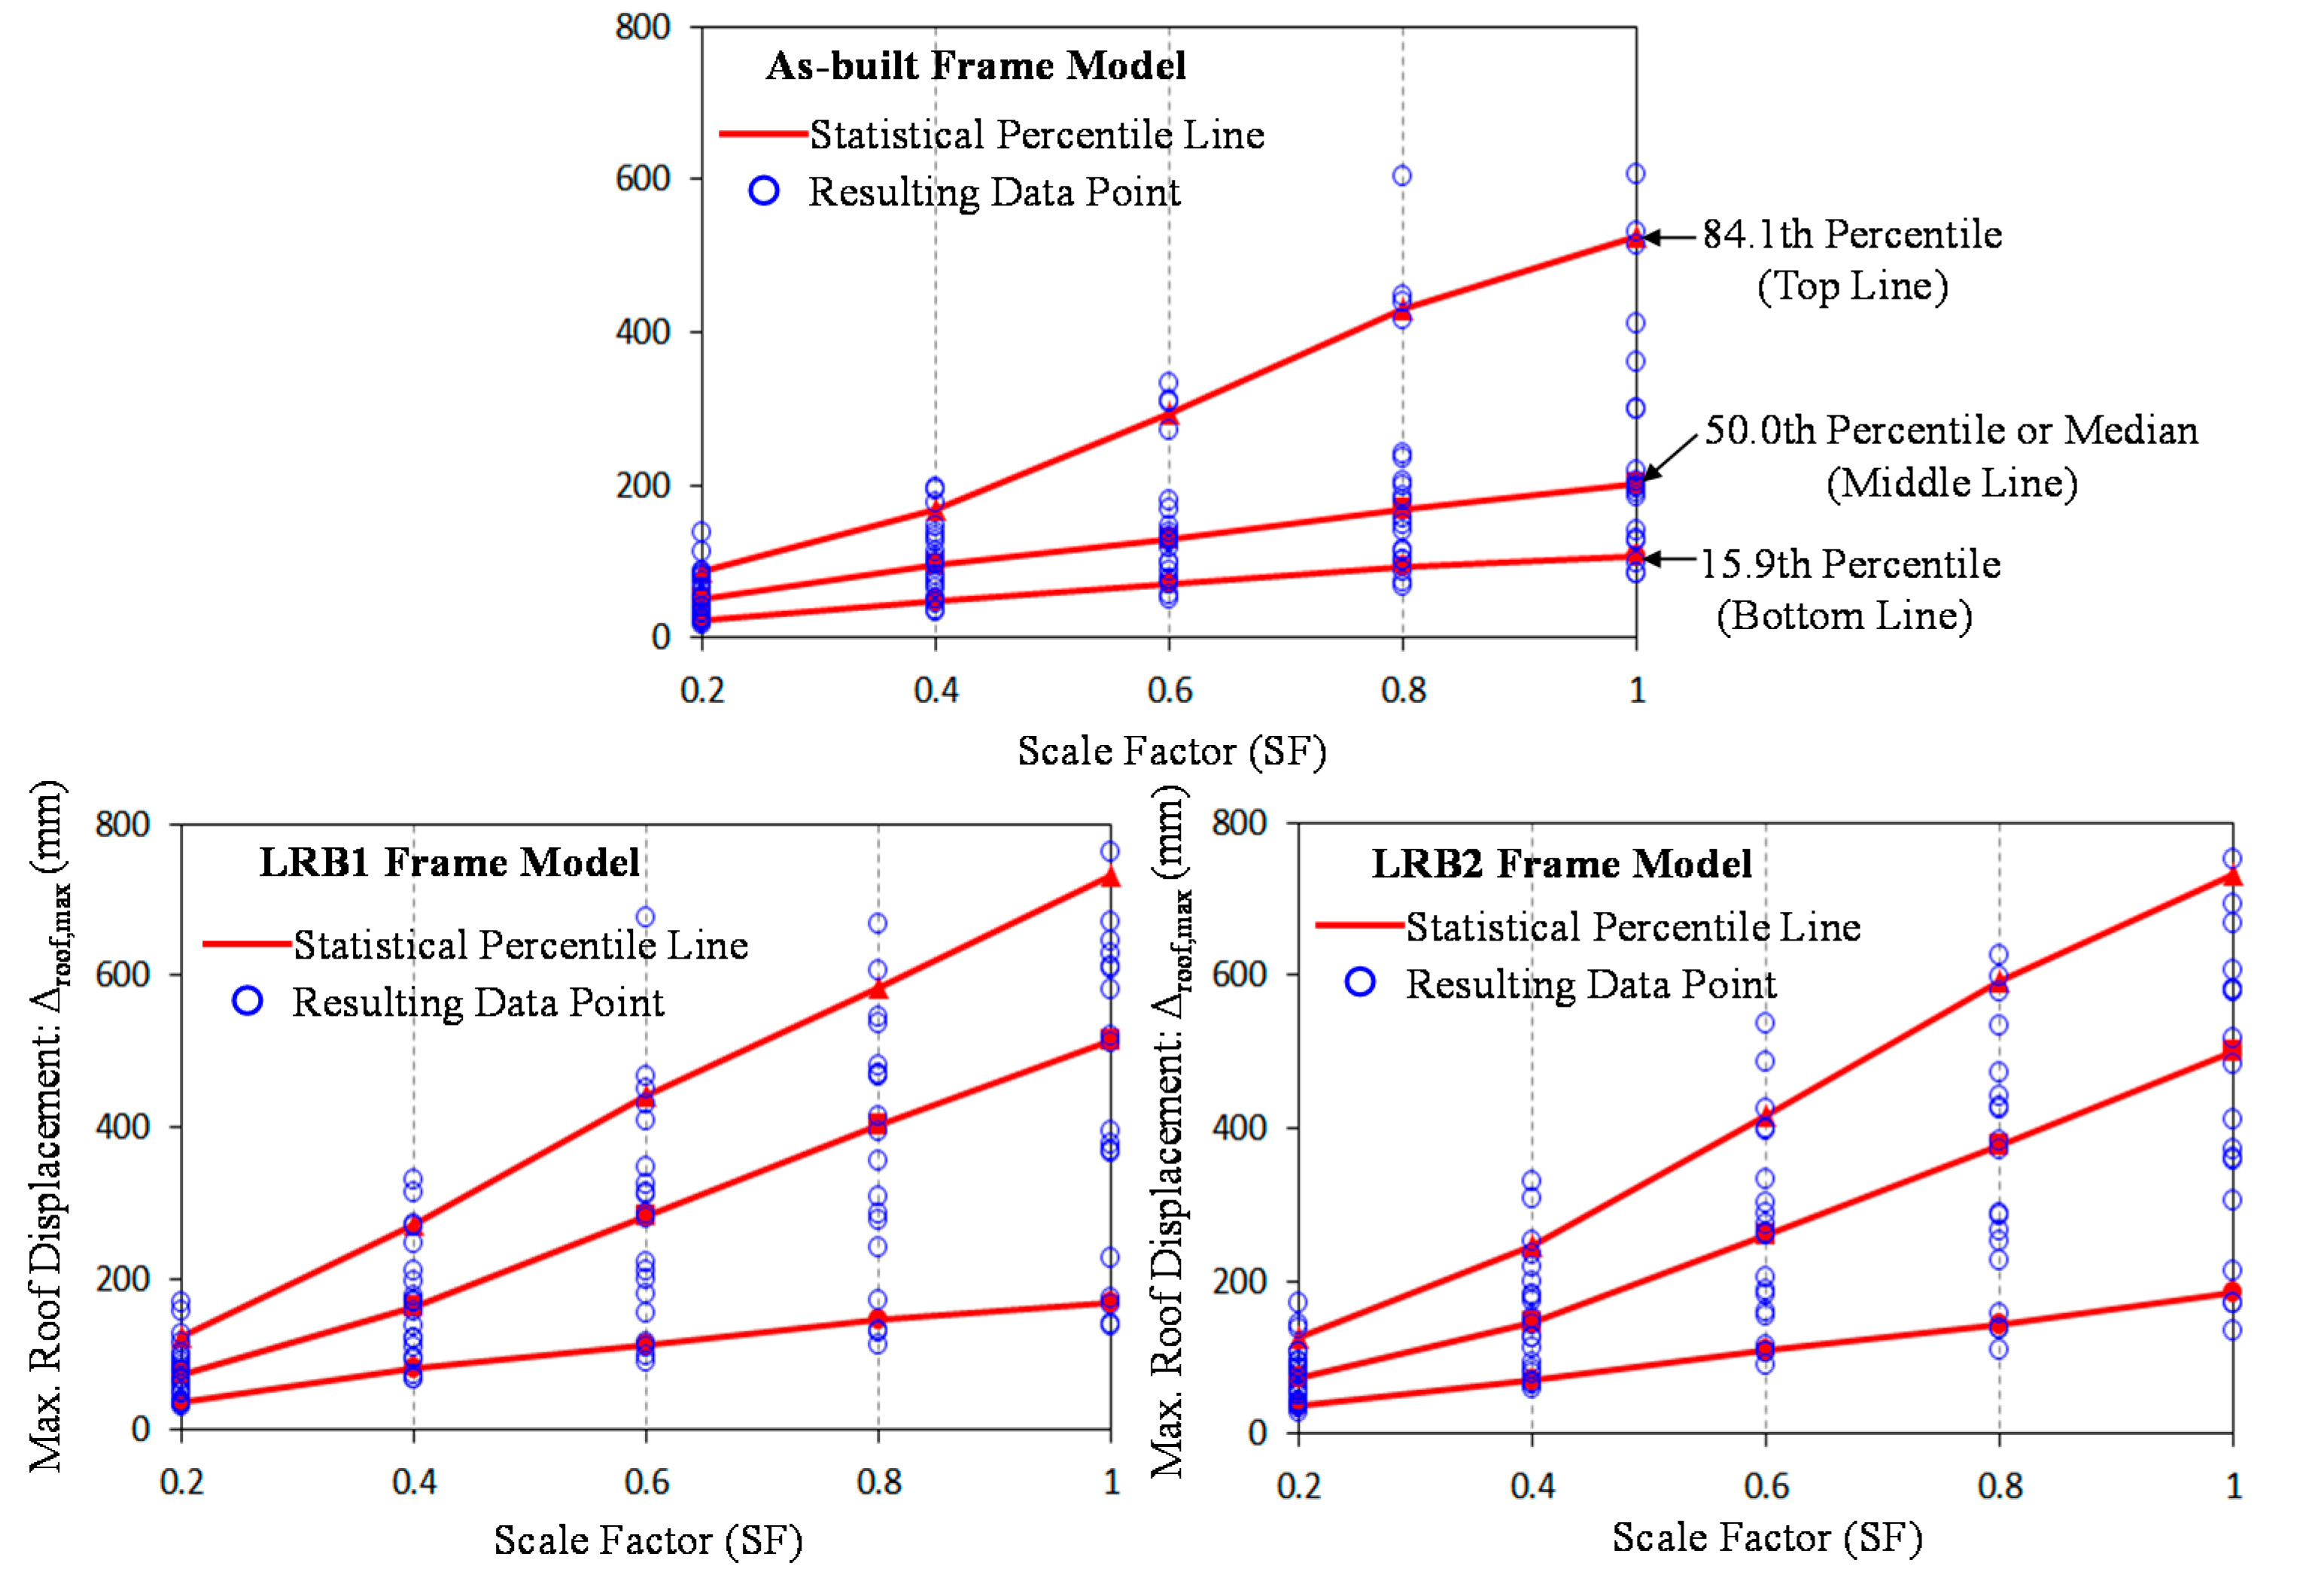
The statistical investigations into seismic responses were conducted based on the results of several time-history analyses for the purpose of reliably accessing not only seismic performance but also the extent of structural damage. The statistical investigations of the maximum roof displacements (Δ
roof,max) for individual frame models according to increasing scale factors are illustrated in
Figure 12. The statistical lines indicating 15.9th, 50.0th (or median), and 84.1th percentile ranks are drawn in the graphs together with individual resulting data points obtained from all analysis results. As the scale factor of the ground motion increases at a fixed rate, the statistical lines for the values of the maximum roof displacements gradually ascend in the straight curves. The ranges of data scatter increase as well. The LRB-isolated frame models that permit base movements in the direction of the ground motion show larger statistical values than the as-built frame model. Furthermore, the LRB1 model has slightly higher statistical percentile lines (approximately 5%) than the LRB2 model owing to more flexible LRB properties.
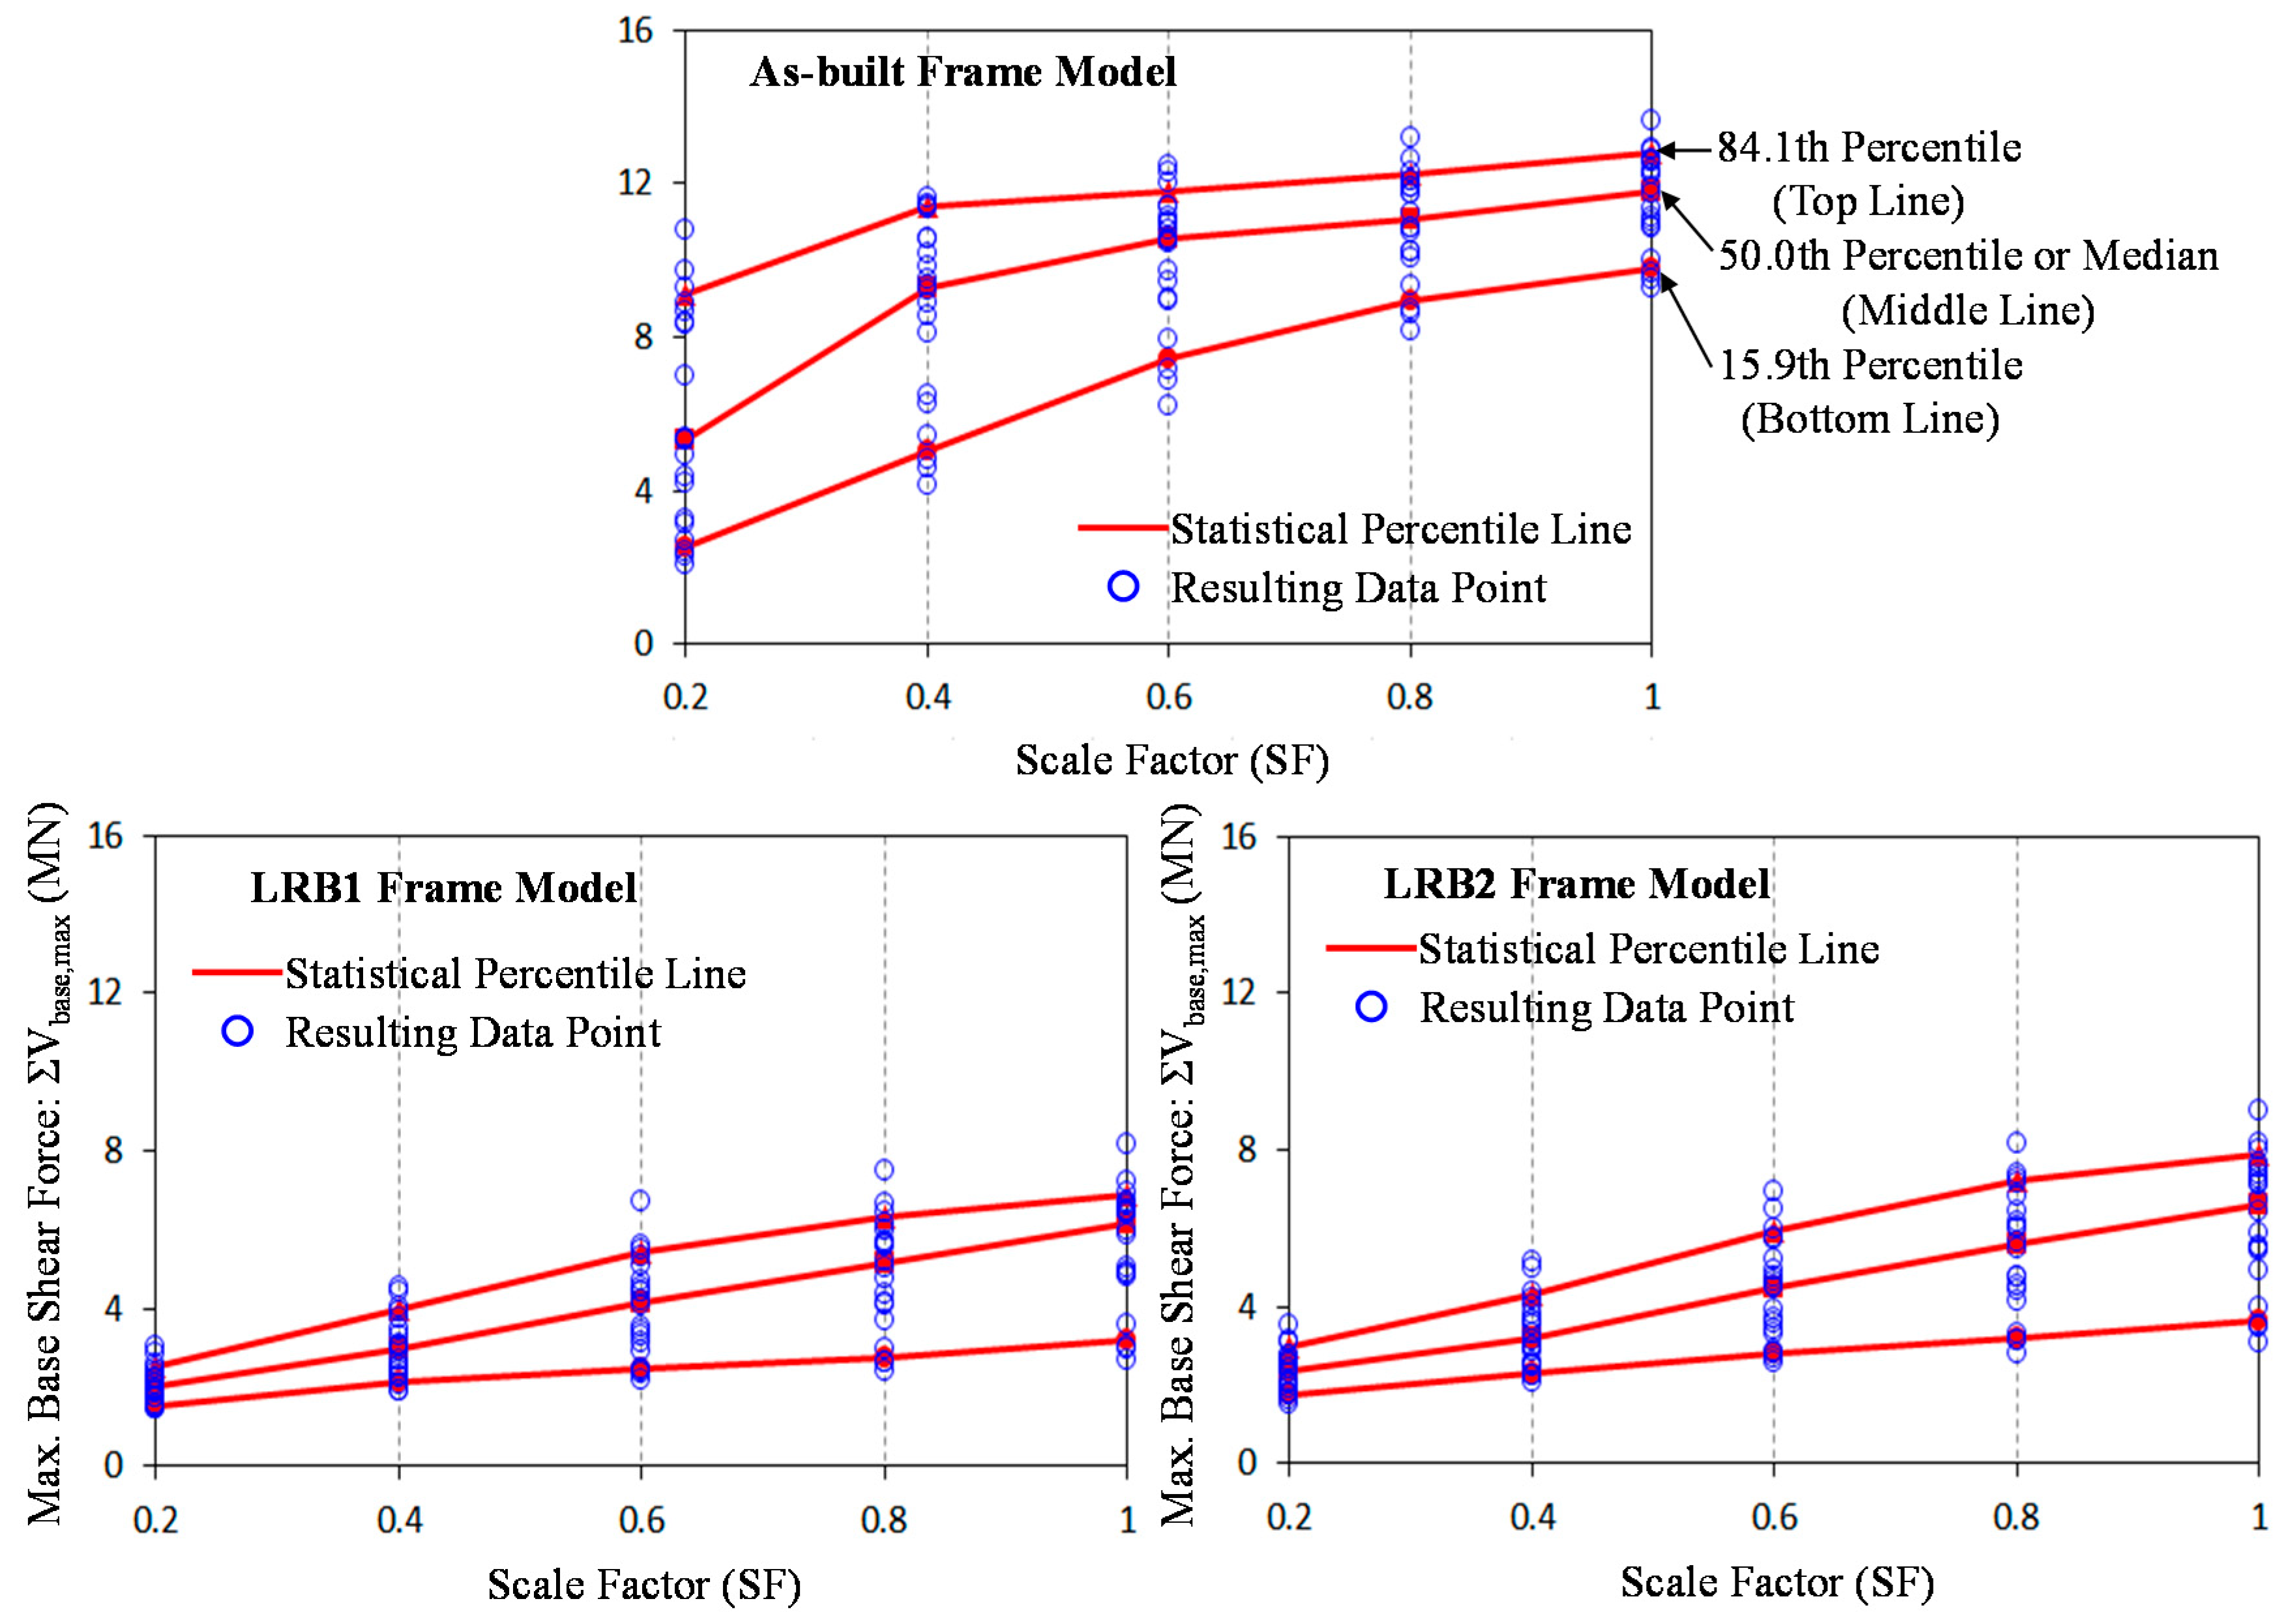
For another investigation variables, maximum total base shear forces (ΣV
base,max) for individual frame models according to increasing scale factors are presented in
Figure 13. The statistical values for the maximum total base shear forces are commonly proportional to the scale factors of the ground motions increasing as well. As expected, the as-built frame model is susceptible to higher base shear forces in comparison of other LRB-isolated frame models. When examining the distribution of the total base shear forces at the graphs, it can be found that the LRB base isolators lead the generation of the base shear force to alleviate considerably.
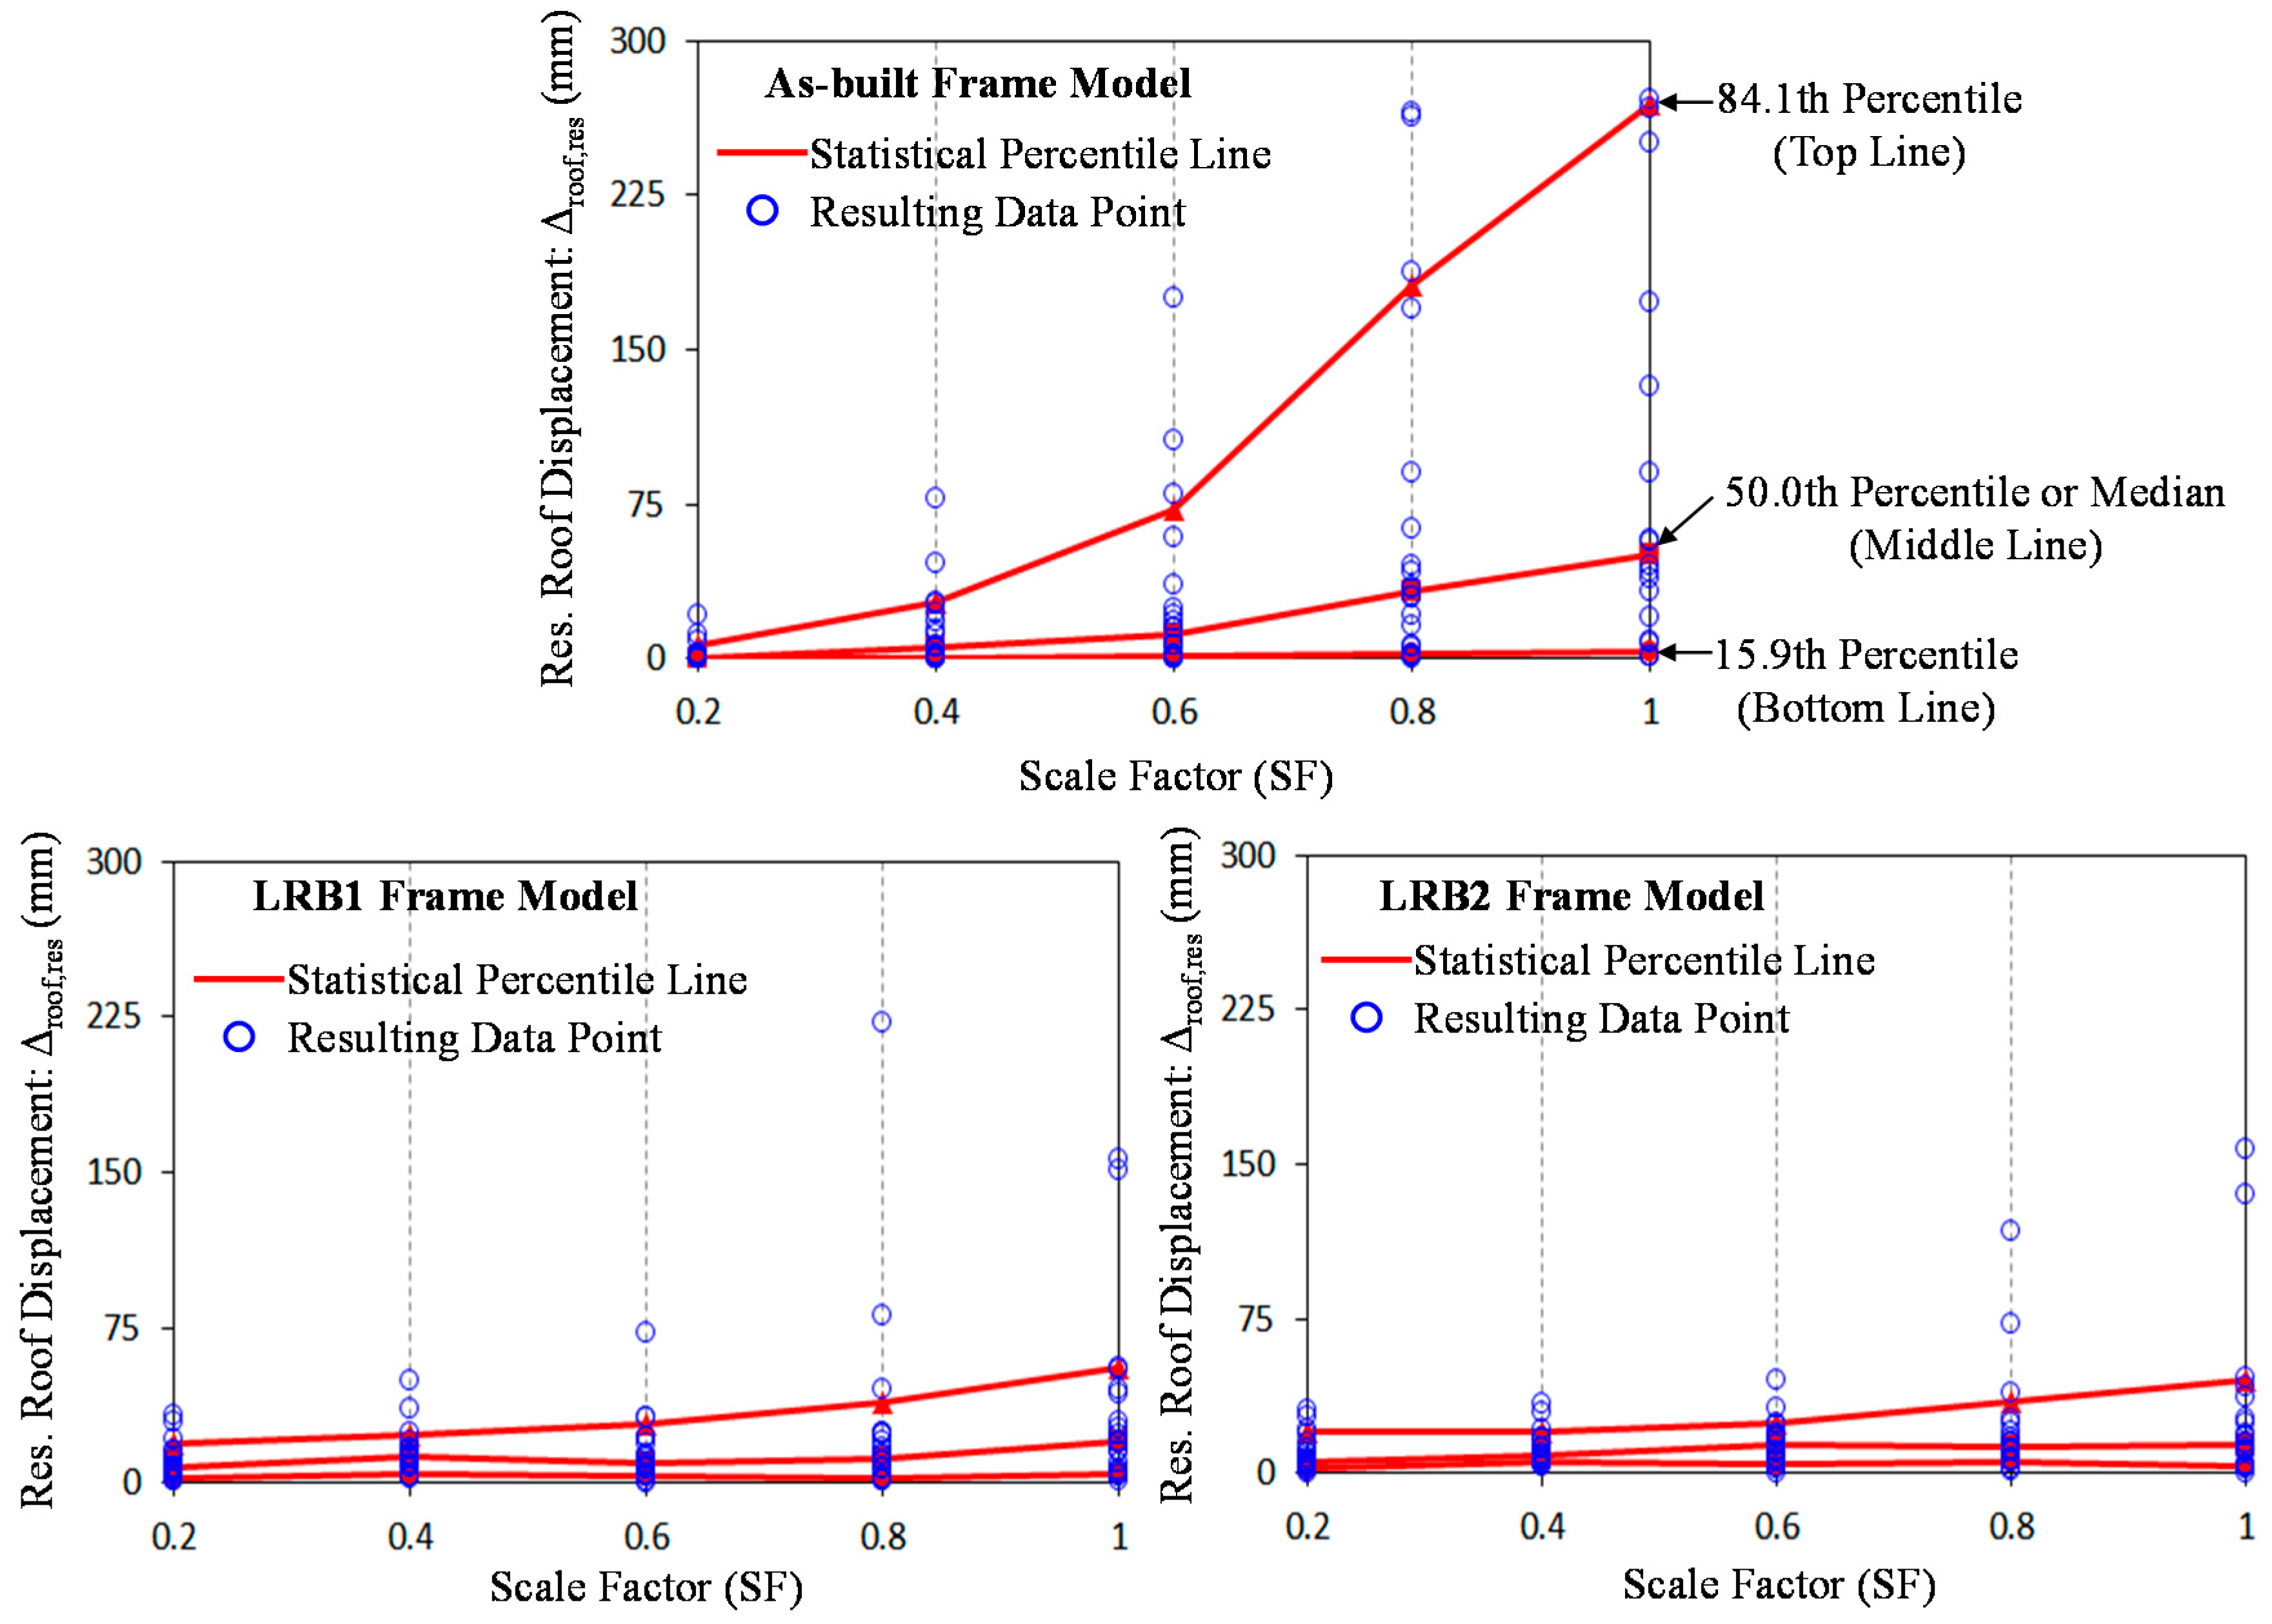
After earthquake events, a statistical inquiry into the distribution of the residual roof displacements is required to figure out the extent of structural damage generated by the transmitted base shear forces. The statistical investigations of the residual roof displacements (Δ
roof,res) for individual frame models according to increasing scale factors are presented in
Figure 14. The severe failures representing over 80mm residual roof displacements are mostly displayed at the graphs of the as-built frame model case, and generated even under the ground motions with the value of 0.6 scale factor. Therefore, the upper statistical percentile lines (50.0th and especially 84.1th percentile) for the distribution of the residual roof displacements ascend rapidly at the as-built frame model as increasing the scale factors of the ground motions. In contrast, the statistical lines of the LRB-isolated frame models show gentle ascent at the graphs of the residual roof displacements according to the increasing scale factors, meaning that these isolated frame models are little susceptible to structural damage even under strong ground motions. As compared to each frame model, the statistical values for maximum roof displacements, maximum total base shear forces, and residual roof displacements are finally summarized in
Table 5. The values of each mean and standard deviation (SD) are also presented in this table.
Figure 12.
Statistical investigations of the maximum roof displacements (Δroof,max) for individual frame models according to increasing scale factors.
Figure 12.
Statistical investigations of the maximum roof displacements (Δroof,max) for individual frame models according to increasing scale factors.
Figure 13.
Statistical investigations of the maximum total base shear forces (ΣVbase, max) for individual frame models according to increasing scale factors.
Figure 13.
Statistical investigations of the maximum total base shear forces (ΣVbase, max) for individual frame models according to increasing scale factors.
Figure 14.
Statistical investigations of the residual roof displacements (Δroof,res) for individual frame models according to increasing scale factors.
Figure 14.
Statistical investigations of the residual roof displacements (Δroof,res) for individual frame models according to increasing scale factors.
Table 5.
Comparison and summary of the statistical valises for maximum roof displacements, maximum total base shear forces, and residual roof displacements.
Table 5.
Comparison and summary of the statistical valises for maximum roof displacements, maximum total base shear forces, and residual roof displacements.
| Evaluation Item | Model ID | SF = 0.2 | SF = 0.4 | SF = 0.6 | SF = 0.8 | SF = 1.0 |
|---|
| 15.9% | 50.0% | 84.1% | Mean | SD | 15.9% | 50.0% | 84.1% | Mean | SD | 15.9% | 50.0% | 84.1% | Mean | SD | 15.9% | 50.0% | 84.1% | Mean | SD | 15.9% | 50.0% | 84.1% | Mean | SD |
|---|
| Δroof,max (mm) | As-Built | 23.7 | 50.3 | 86.8 | 56.6 | 32.2 | 47.4 | 96.4 | 166.9 | 101.2 | 49.4 | 71.0 | 127.6 | 294.8 | 148.2 | 86.1 | 91.8 | 167.7 | 430.7 | 212.4 | 144.5 | 107.0 | 200.6 | 524.4 | 287.9 | 204.3 |
| LRB1 | 35.6 | 72.7 | 122.6 | 77.8 | 38.9 | 80.2 | 162.1 | 270.7 | 169.4 | 79.5 | 112.0 | 281.9 | 442.6 | 283.4 | 147.4 | 144.8 | 403.6 | 584.6 | 400.2 | 202.5 | 168.2 | 515.3 | 731.2 | 508.7 | 295.6 |
| LRB2 | 38.0 | 73.8 | 126.5 | 77.4 | 38.9 | 71.2 | 146.1 | 245.9 | 159.2 | 77.5 | 109.3 | 261.1 | 416.1 | 263.4 | 129.0 | 144.1 | 377.1 | 591.0 | 376.8 | 186.6 | 185.4 | 500.3 | 731.1 | 503.9 | 267.1 |
| ΣVbase,max (MN) | As-Built | 2.5 | 5.3 | 9.1 | 5.8 | 2.8 | 5.0 | 9.3 | 11.4 | 8.6 | 2.4 | 7.4 | 10.5 | 11.8 | 10.0 | 1.8 | 8.9 | 11.0 | 12.2 | 10.9 | 1.4 | 9.8 | 11.8 | 12.8 | 11.6 | 1.2 |
| LRB1 | 1.5 | 2.0 | 2.5 | 2.0 | 0.4 | 2.1 | 3.0 | 4.0 | 3.0 | 0.8 | 2.4 | 4.1 | 5.4 | 4.0 | 1.2 | 2.8 | 5.1 | 6.3 | 4.9 | 1.4 | 3.2 | 6.2 | 6.9 | 5.6 | 1.5 |
| LRB2 | 1.8 | 2.3 | 3.0 | 2.3 | 0.5 | 2.3 | 3.2 | 4.3 | 3.3 | 0.9 | 2.8 | 4.5 | 5.9 | 4.4 | 1.3 | 3.2 | 5.6 | 7.2 | 5.4 | 1.5 | 3.7 | 6.6 | 7.9 | 6.2 | 1.7 |
| Δroof,res (mm) | As-Built | 0.3 | 0.6 | 6.4 | 2.8 | 5.1 | 0.4 | 5.5 | 26.9 | 13.4 | 19.0 | 0.8 | 12.1 | 72.7 | 29.1 | 43.5 | 1.8 | 32.2 | 181.7 | 65.5 | 83.2 | 3.5 | 50.6 | 269.6 | 117.2 | 137.4 |
| LRB1 | 2.5 | 7.2 | 19.3 | 10.2 | 8.6 | 4.8 | 12.8 | 23.2 | 14.9 | 10.9 | 3.3 | 9.2 | 28.6 | 14.8 | 16.1 | 2.0 | 11.9 | 38.5 | 27.0 | 48.3 | 4.5 | 19.8 | 55.6 | 35.3 | 42.6 |
| LRB2 | 2.4 | 6.0 | 20.5 | 9.6 | 8.4 | 5.6 | 9.0 | 20.0 | 12.4 | 8.1 | 4.0 | 13.6 | 24.0 | 14.6 | 10.7 | 5.6 | 13.1 | 34.6 | 21.7 | 26.7 | 2.9 | 14.3 | 45.3 | 29.6 | 41.0 |
In the frame, the responses of the LRB base isolators are also investigated through the nonlinear dynamic time-history analyses. The necessary data were collected by measuring forces and displacements at the exterior column base isolator. According to increasing scale factors, maximum isolator displacements for individual LRB-isolated frame models (Δ
iso,max) are presented in
Figure 15. The LRB1 frame model presents a similar ascent slope pattern as the LRB2 frame model on the occasion of increasing scale factors, but has larger statistical values owing to more flexible behavior displayed at the LRB isolator. The ranges of data scatter indicating the degree of uncertainty are determined by the value of standard deviations. At every scale factors, larger mean values and standard deviations are found at the LRB1 frame model.
Figure 15.
Statistical investigations of the maximum isolator displacements (Δiso,max) for individual LRB-isolated frame models according to increasing scale factors.
Figure 15.
Statistical investigations of the maximum isolator displacements (Δiso,max) for individual LRB-isolated frame models according to increasing scale factors.
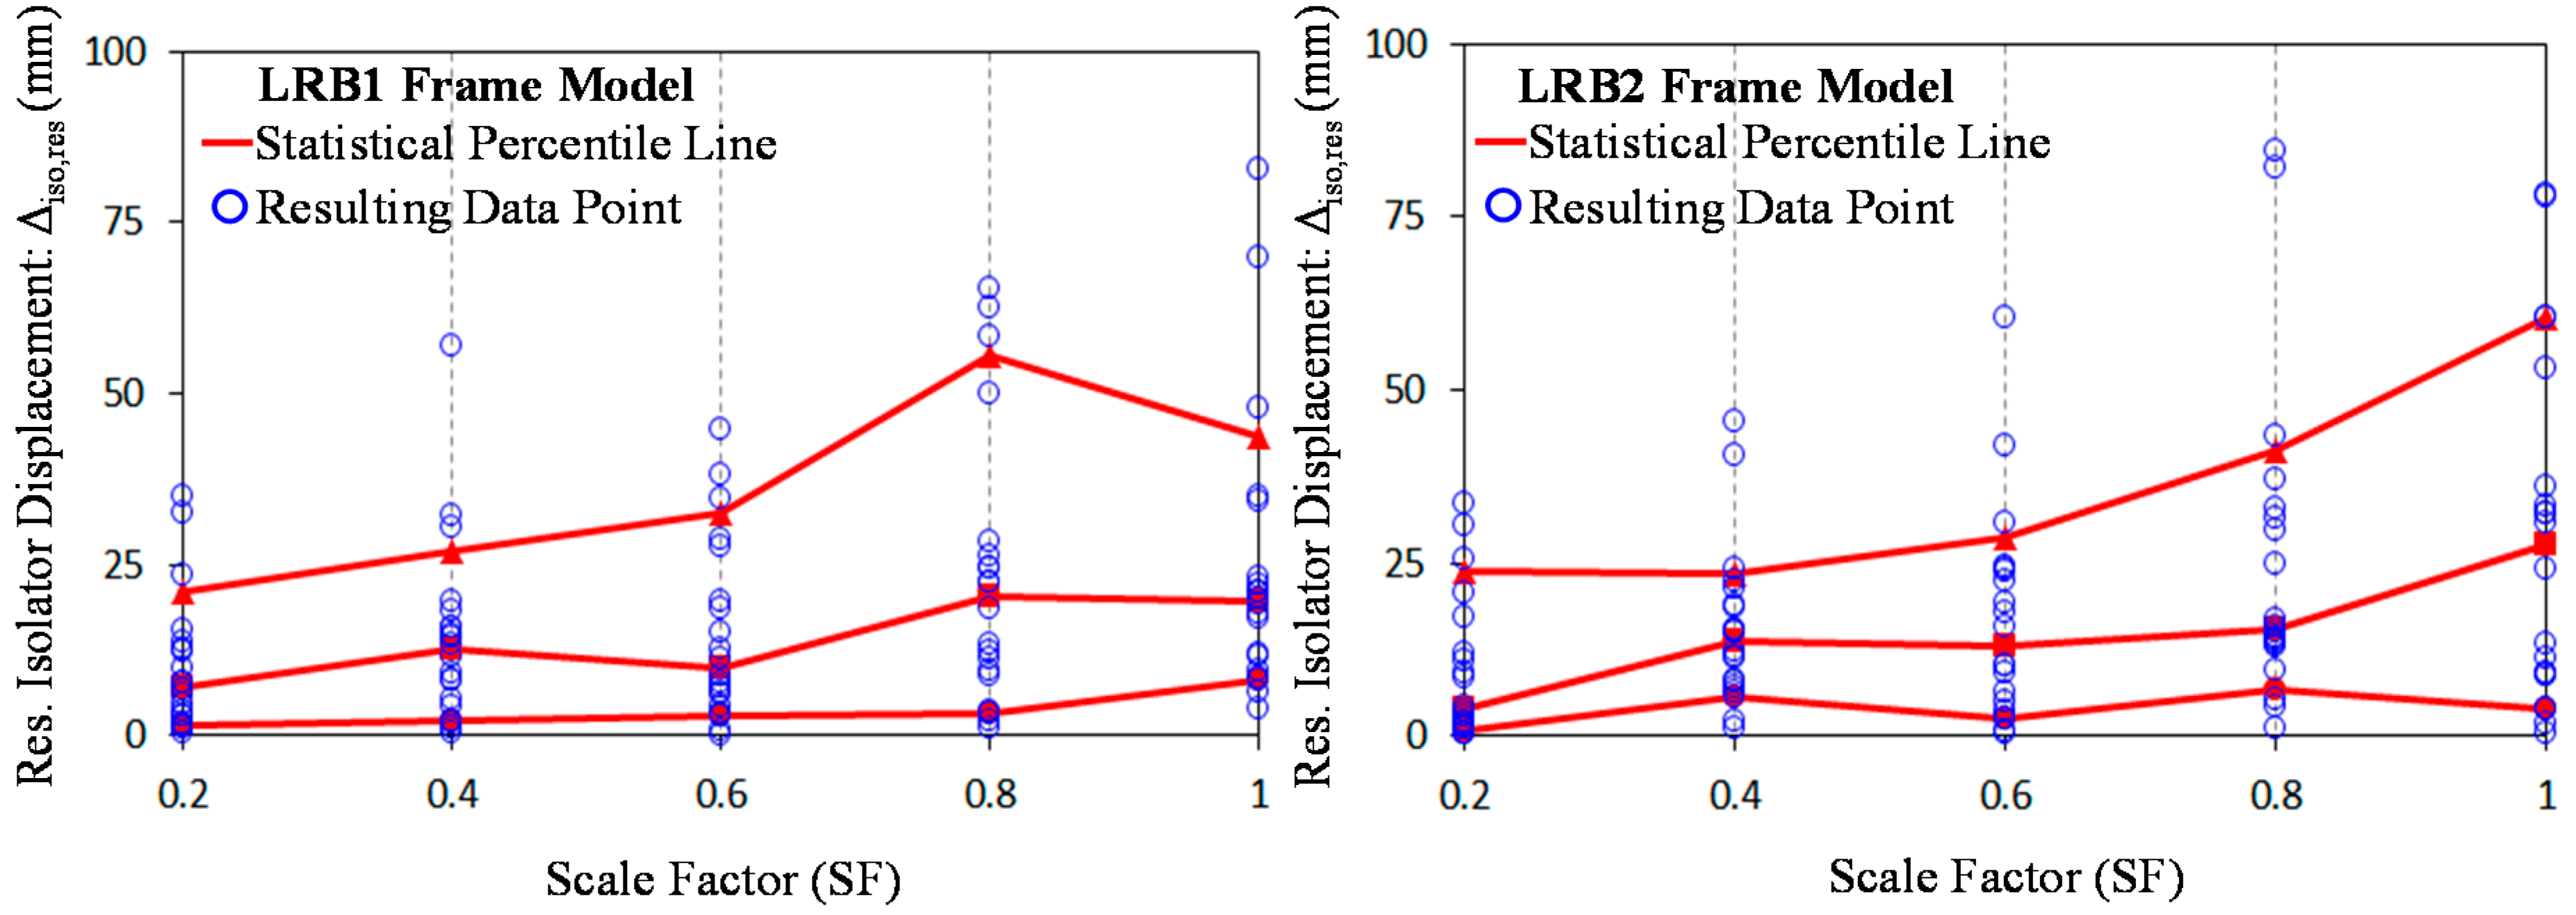
As shown in
Figure 16, residual isolator displacements (Δ
iso,res) are also presented for the purpose of conducting more statistical investigations required to make sure the performance of the LRB isolators in the frame building. After checking residual roof displacements presented in
Figure 14, it can be affirmed that there is a little difference to corresponding residual isolator displacements. This implies that most of relative residual displacements occur at the base isolation system.
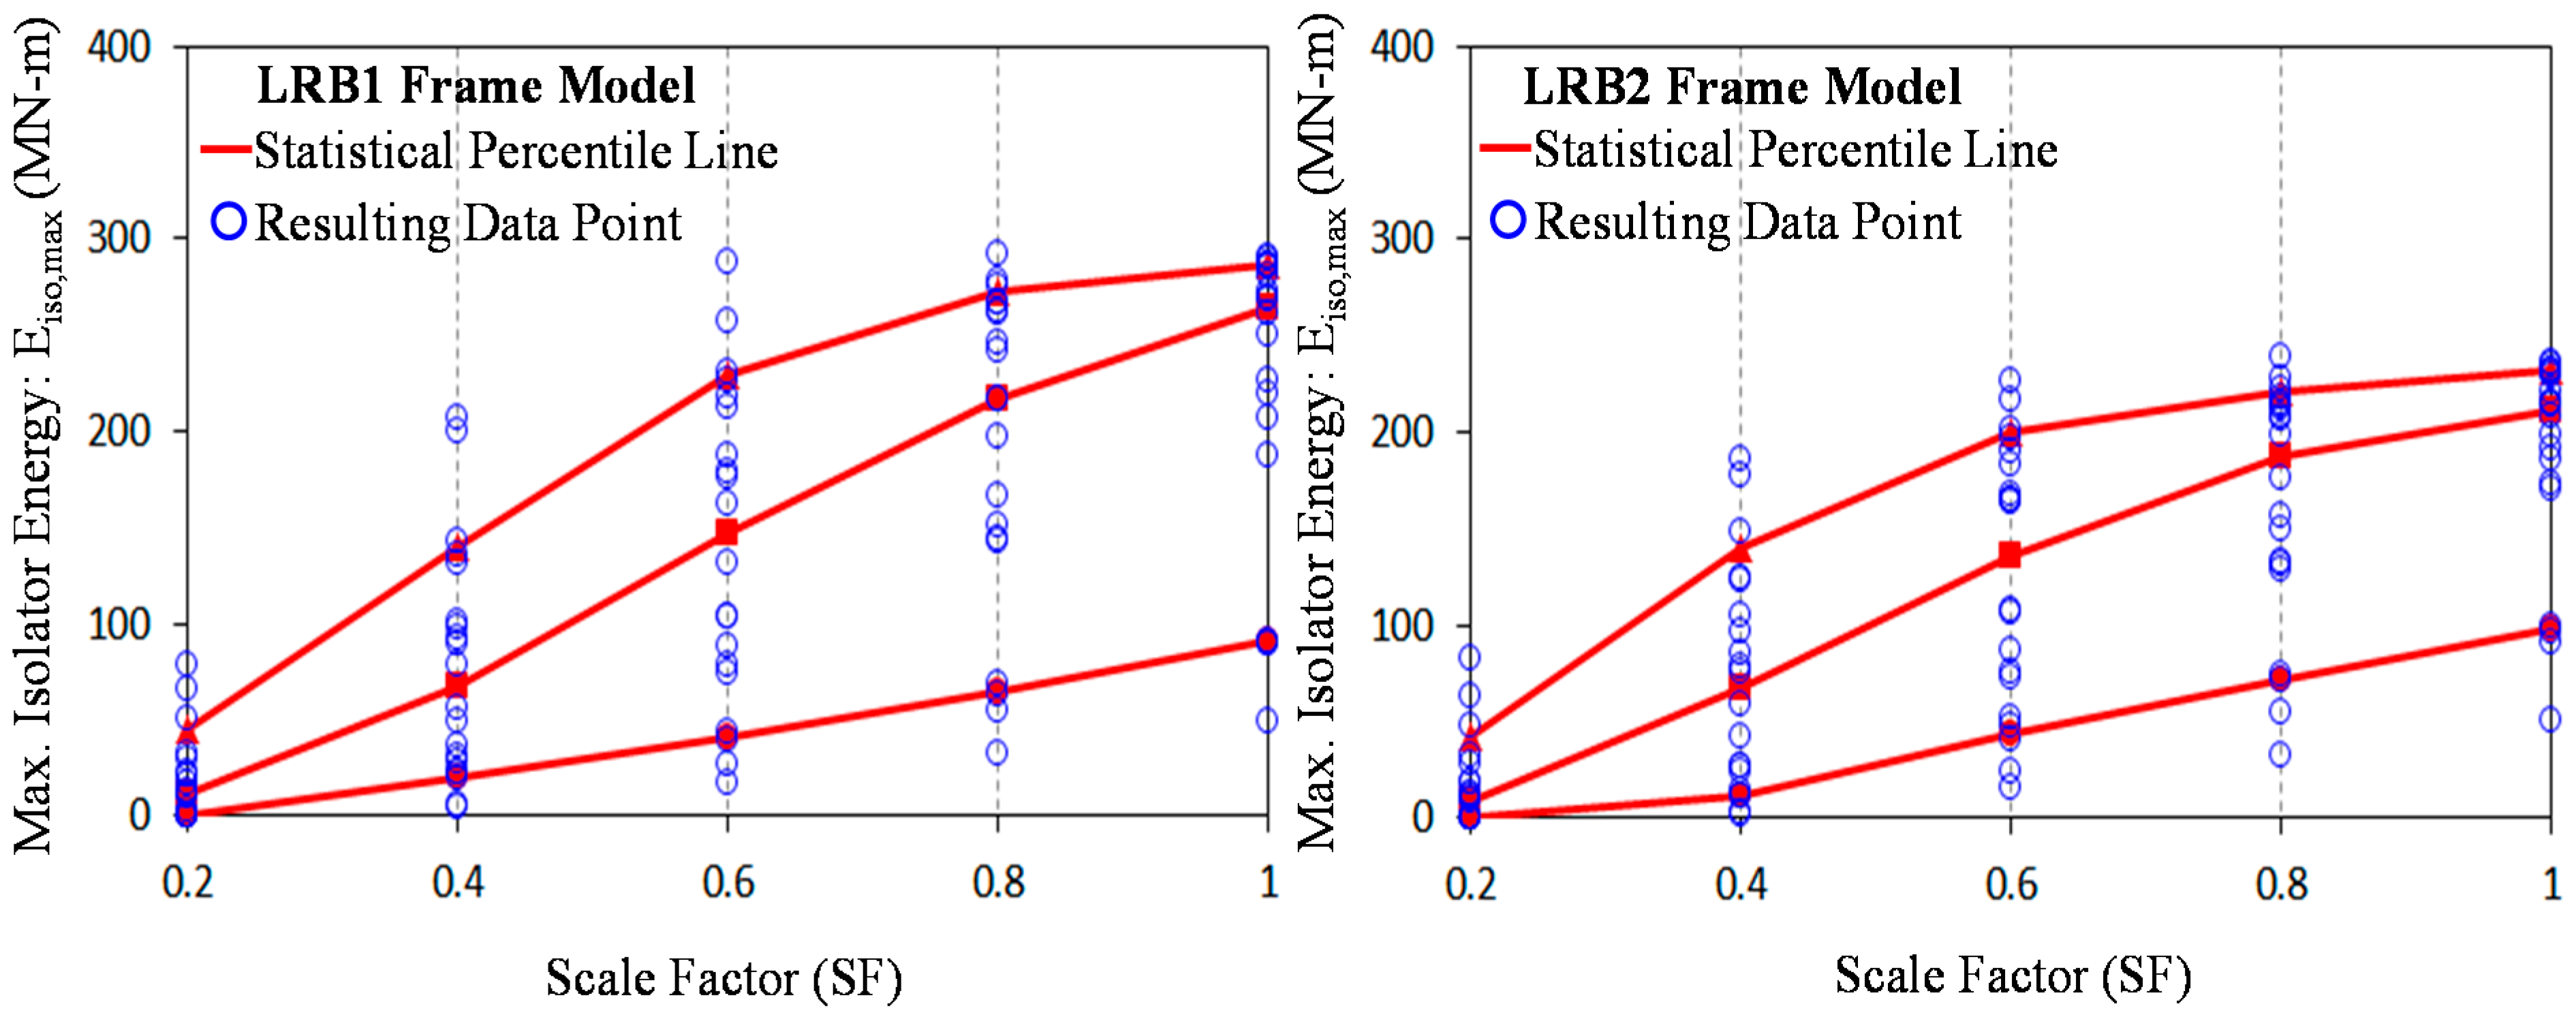
In addition to isolation function, it is important to check energy dissipation capacity in the single base isolator during NF ground motions. The statistical investigations of the maximum isolator energies (E
iso,max) for individual LRB-isolated frame models according to increasing scale factors are presented in
Figure 17. When the isolation system is fully excited by each of the NF ground motions, dissipated energy corresponds to the area of the hysteresis force-displacement loop as given to
Figure 11. As expected, the graphs of the maximum isolator energies show a totally similar pattern as those of the maximum isolator displacements, including the distributional trends of data scatter. As compared to each LRB-isolated frame model, the statistical values for the maximum isolator displacements, residual isolator displacements, and maximum dissipated isolator energies are summarized in
Table 6. Similarly, this table also presents the values of each mean and standard deviation (SD).
Figure 16.
Statistical investigations of the residual isolator displacements (Δiso,res) for individual LRB-isolated frame models according to increasing scale factors.
Figure 16.
Statistical investigations of the residual isolator displacements (Δiso,res) for individual LRB-isolated frame models according to increasing scale factors.
Figure 17.
Statistical investigations of the maximum isolator energies (Eiso,max) for individual LRB-isolated frame models according to increasing scale factors.
Figure 17.
Statistical investigations of the maximum isolator energies (Eiso,max) for individual LRB-isolated frame models according to increasing scale factors.
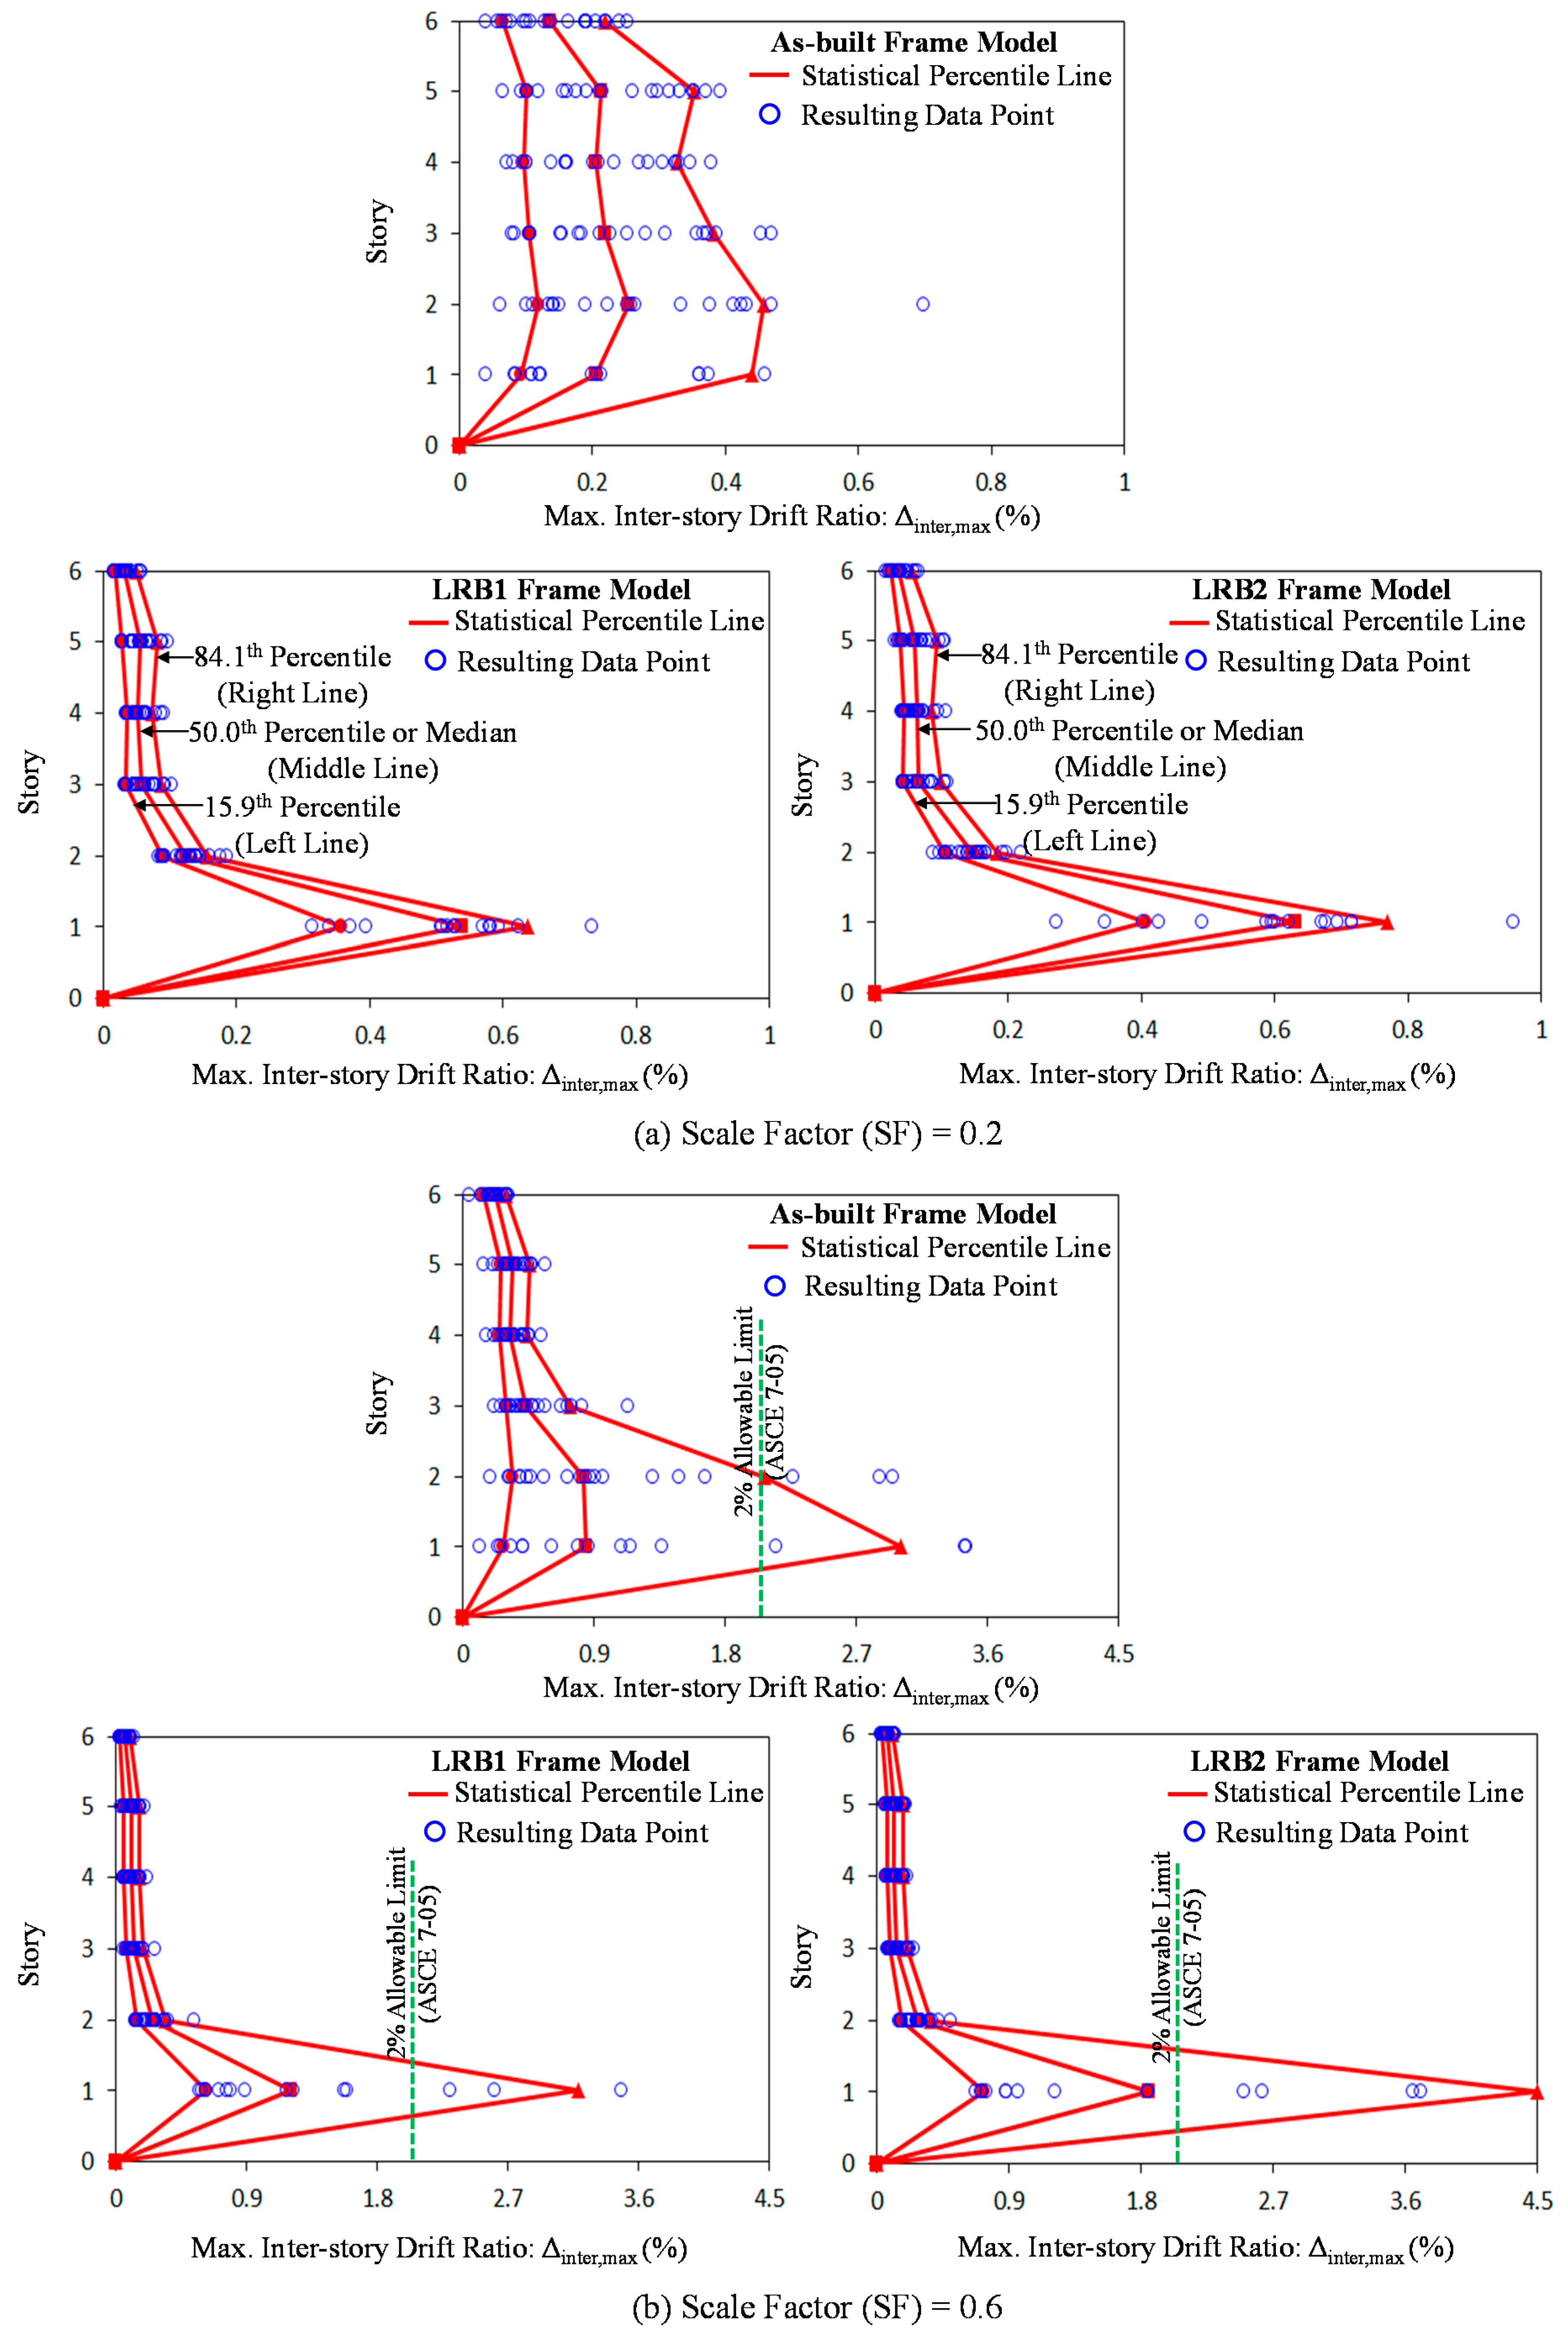
According to the availability of base isolation implementation, seismic performance and structural damage for individual 6 story frame models subjected to NF ground motions can be evaluated through the observation of maximum inter-story drifts and residual inter-story drifts after nonlinear dynamic time-history analyses. The allowable maximum inter-story drift limits (generally taken as 2%) stipulated in the ASCE7-05 design code are plotted as the dashed lines in
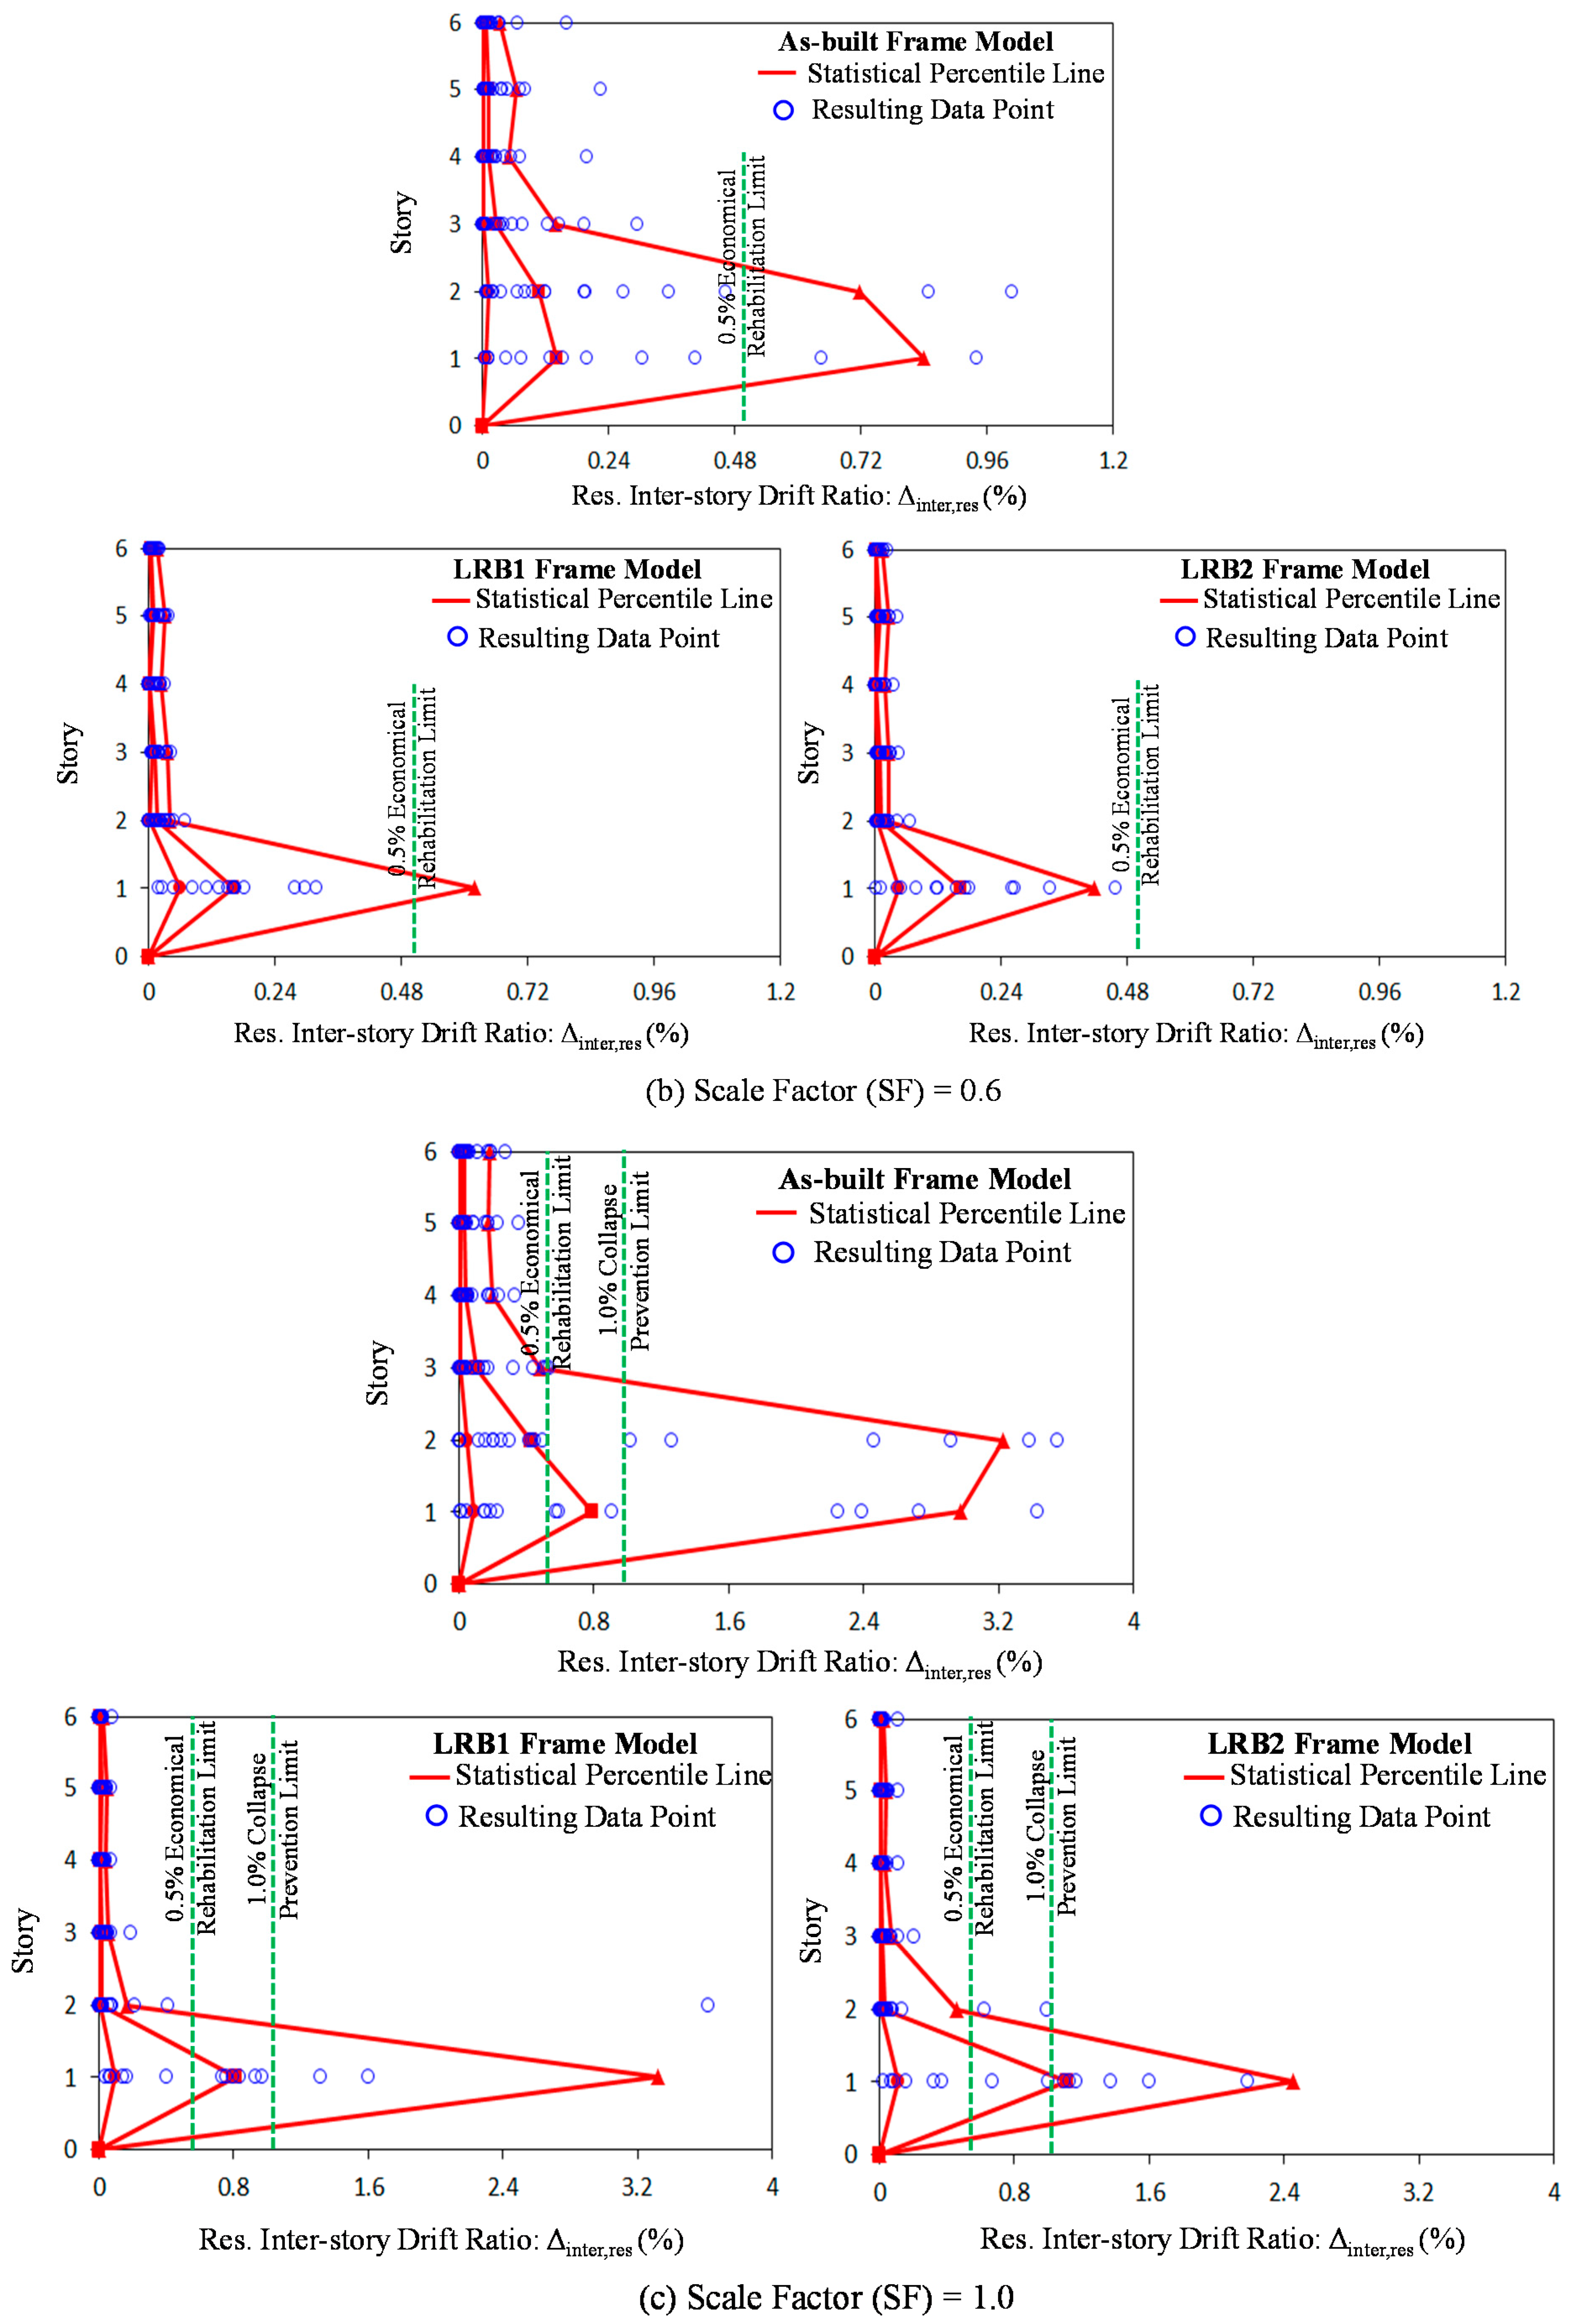
Figure 18. Two residual inter-story drift limits required for either economical rehabilitation or completely collapse decision (0.5% or 1.0% limit) are also plotted as the dashed lines in
Figure 19. Some scientists suggest that if the residual inter-story drifts are greater than 0.5%, from an economic point of view, building owners had better rebuild the entire structure rather than repair only damaged parts [
32]. Although the frame building undergoes residual inter-story drifts smaller than 0.5%, extra repair costs are indeed required to recover the laterally deformed structure to its original state one. Above all, building residents feel severe dizziness and nausea as the residual inter-story drift level begins to be over 1.0%. It represents the total loss of the frame building.
Figure 18.
Statistical investigations of the maximum inter-story drift ratios (Δinter,max) for individual frame models under SF = 0.2, 0.6, and 1.0, respectively.
Figure 18.
Statistical investigations of the maximum inter-story drift ratios (Δinter,max) for individual frame models under SF = 0.2, 0.6, and 1.0, respectively.
Figure 19.
Statistical investigations of the residual inter-story drift ratios (Δinter,res) for individual frame models under SF = 0.2, 0.6, and 1.0, respectively.
Figure 19.
Statistical investigations of the residual inter-story drift ratios (Δinter,res) for individual frame models under SF = 0.2, 0.6, and 1.0, respectively.
Table 6.
Comparison and summary of the statistical valises for maximum isolator displacements, residual isolator displacements, and dissipated energies.
Table 6.
Comparison and summary of the statistical valises for maximum isolator displacements, residual isolator displacements, and dissipated energies.
| Evaluation Item | Model ID | SF = 0.2 | SF = 0.4 | SF = 0.6 | SF = 0.8 | SF = 1.0 |
|---|
| 15.9% | 50.0% | 84.1% | Mean | SD | 15.9% | 50.0% | 84.1% | Mean | SD | 15.9% | 50.0% | 84.1% | Mean | SD | 15.9% | 50.0% | 84.1% | Mean | SD | 15.9% | 50.0% | 84.1% | Mean | SD |
|---|
| Δiso,max (mm) | LRB1 | 11.7 | 37.4 | 79.6 | 44.0 | 31.1 | 45.2 | 115.5 | 200.1 | 118.5 | 63.7 | 73.3 | 207.5 | 286.1 | 190.0 | 84.3 | 98.9 | 263.4 | 322.9 | 237.3 | 84.4 | 137.4 | 295.9 | 335.8 | 269.6 | 78.7 |
| LRB2 | 11.1 | 32.7 | 76.0 | 38.6 | 28.8 | 32.1 | 91.7 | 157.9 | 95.8 | 51.2 | 64.1 | 162.5 | 211.5 | 145.4 | 56.8 | 91.8 | 193.7 | 230.6 | 177.6 | 53.3 | 121.2 | 214.7 | 239.9 | 196.4 | 47.9 |
| Δiso,res (mm) | LRB1 | 1.6 | 7.1 | 20.8 | 10.1 | 9.7 | 2.0 | 12.5 | 26.9 | 14.2 | 13.1 | 2.9 | 10.0 | 32.6 | 14.9 | 12.9 | 3.3 | 20.4 | 55.5 | 23.4 | 19.8 | 8.3 | 19.7 | 43.5 | 24.6 | 20.3 |
| LRB2 | 0.7 | 3.9 | 23.8 | 9.3 | 10.3 | 5.8 | 13.6 | 23.5 | 15.5 | 11.2 | 2.5 | 12.9 | 28.6 | 16.5 | 14.9 | 6.8 | 15.4 | 41.2 | 25.1 | 22.2 | 3.8 | 27.5 | 60.5 | 29.0 | 24.6 |
| Eiso,max (MN-m) | LRB1 | 0.0 | 11.0 | 44.7 | 17.8 | 22.6 | 20.3 | 67.4 | 140.4 | 77.5 | 59.6 | 41.1 | 146.6 | 229.3 | 142.2 | 80.3 | 64.7 | 216.2 | 272.8 | 192.1 | 82.4 | 90.7 | 264.6 | 286.9 | 224.4 | 77.9 |
| LRB2 | 0.0 | 9.2 | 42.5 | 16.6 | 23.0 | 11.3 | 67.6 | 140.1 | 71.0 | 56.9 | 43.0 | 135.1 | 200.3 | 125.2 | 67.6 | 71.8 | 187.3 | 220.9 | 163.6 | 62.5 | 97.3 | 211.5 | 231.4 | 186.2 | 55.0 |
Table 7.
Comparison and summary of the statistical values for maximum and residual inter-story drift ratios.
Table 7.
Comparison and summary of the statistical values for maximum and residual inter-story drift ratios.
| SF | Evaluation Item | Model ID | 1st Story | 2nd Story | 3rd Story | 4th Story | 5th Story | 6th Story |
|---|
| 50% | Mean | SD | 50% | Mean | SD | 50% | Mean | SD | 50% | Mean | SD | 50% | Mean | SD | 50% | Mean | SD |
|---|
| 0.2 | Δinter,max (mm) | As-Built | 0.204 | 0.279 | 0.236 | 0.255 | 0.309 | 0.223 | 0.219 | 0.242 | 0.123 | 0.206 | 0.214 | 0.098 | 0.213 | 0.227 | 0.102 | 0.136 | 0.144 | 0.065 |
| LRB1 | 0.538 | 0.524 | 0.115 | 0.125 | 0.125 | 0.028 | 0.058 | 0.061 | 0.021 | 0.050 | 0.055 | 0.016 | 0.055 | 0.055 | 0.020 | 0.032 | 0.033 | 0.012 |
| LRB2 | 0.631 | 0.605 | 0.166 | 0.146 | 0.144 | 0.035 | 0.065 | 0.068 | 0.023 | 0.062 | 0.062 | 0.018 | 0.059 | 0.062 | 0.022 | 0.036 | 0.037 | 0.013 |
| Δinter,res (mm) | As-Built | 0.005 | 0.025 | 0.061 | 0.007 | 0.025 | 0.049 | 0.009 | 0.012 | 0.008 | 0.003 | 0.005 | 0.007 | 0.008 | 0.010 | 0.007 | 0.004 | 0.005 | 0.005 |
| LRB1 | 0.050 | 0.060 | 0.041 | 0.006 | 0.008 | 0.007 | 0.009 | 0.011 | 0.005 | 0.002 | 0.004 | 0.004 | 0.008 | 0.010 | 0.004 | 0.004 | 0.005 | 0.002 |
| LRB2 | 0.058 | 0.075 | 0.056 | 0.006 | 0.008 | 0.007 | 0.010 | 0.012 | 0.004 | 0.002 | 0.004 | 0.003 | 0.008 | 0.010 | 0.003 | 0.004 | 0.005 | 0.002 |
| 0.4 | Δinter,max (mm) | As-Built | 0.434 | 0.662 | 0.561 | 0.520 | 0.643 | 0.436 | 0.405 | 0.392 | 0.154 | 0.318 | 0.304 | 0.082 | 0.323 | 0.319 | 0.085 | 0.192 | 0.199 | 0.055 |
| LRB1 | 0.727 | 0.802 | 0.287 | 0.177 | 0.182 | 0.047 | 0.083 | 0.090 | 0.028 | 0.080 | 0.082 | 0.026 | 0.074 | 0.081 | 0.028 | 0.045 | 0.049 | 0.017 |
| LRB2 | 0.838 | 1.059 | 0.590 | 0.198 | 0.205 | 0.053 | 0.101 | 0.101 | 0.034 | 0.093 | 0.092 | 0.030 | 0.095 | 0.092 | 0.033 | 0.057 | 0.055 | 0.020 |
| Δinter,res (mm) | As-Built | 0.030 | 0.149 | 0.227 | 0.031 | 0.115 | 0.153 | 0.017 | 0.034 | 0.044 | 0.010 | 0.016 | 0.023 | 0.010 | 0.020 | 0.029 | 0.007 | 0.012 | 0.019 |
| LRB1 | 0.084 | 0.098 | 0.066 | 0.010 | 0.014 | 0.012 | 0.010 | 0.013 | 0.008 | 0.002 | 0.007 | 0.008 | 0.008 | 0.012 | 0.008 | 0.004 | 0.006 | 0.005 |
| LRB2 | 0.117 | 0.153 | 0.122 | 0.009 | 0.013 | 0.010 | 0.009 | 0.012 | 0.007 | 0.002 | 0.005 | 0.006 | 0.008 | 0.011 | 0.007 | 0.004 | 0.005 | 0.004 |
| 0.6 | Δinter,max (mm) | As-Built | 0.845 | 1.207 | 1.069 | 0.828 | 1.038 | 0.804 | 0.432 | 0.496 | 0.220 | 0.323 | 0.342 | 0.090 | 0.342 | 0.350 | 0.098 | 0.223 | 0.215 | 0.066 |
| LRB1 | 1.204 | 1.752 | 1.719 | 0.251 | 0.251 | 0.097 | 0.122 | 0.128 | 0.052 | 0.110 | 0.113 | 0.044 | 0.108 | 0.110 | 0.042 | 0.063 | 0.066 | 0.028 |
| LRB2 | 1.851 | 2.311 | 1.846 | 0.275 | 0.276 | 0.091 | 0.132 | 0.140 | 0.051 | 0.117 | 0.125 | 0.044 | 0.121 | 0.123 | 0.041 | 0.072 | 0.075 | 0.027 |
| Δinter,res (mm) | As-Built | 0.143 | 0.352 | 0.525 | 0.108 | 0.273 | 0.395 | 0.027 | 0.054 | 0.077 | 0.012 | 0.027 | 0.044 | 0.012 | 0.031 | 0.050 | 0.007 | 0.020 | 0.036 |
| LRB1 | 0.162 | 0.275 | 0.337 | 0.016 | 0.022 | 0.018 | 0.012 | 0.017 | 0.011 | 0.003 | 0.009 | 0.010 | 0.009 | 0.014 | 0.011 | 0.004 | 0.007 | 0.006 |
| LRB2 | 0.164 | 0.280 | 0.387 | 0.011 | 0.017 | 0.016 | 0.010 | 0.014 | 0.011 | 0.003 | 0.007 | 0.009 | 0.009 | 0.013 | 0.010 | 0.003 | 0.006 | 0.006 |
| 0.8 | Δinter,max (mm) | As-Built | 1.235 | 1.879 | 1.773 | 1.264 | 1.606 | 1.375 | 0.519 | 0.616 | 0.284 | 0.361 | 0.402 | 0.111 | 0.375 | 0.413 | 0.118 | 0.241 | 0.259 | 0.081 |
| LRB1 | 2.689 | 3.308 | 3.165 | 0.321 | 0.349 | 0.222 | 0.163 | 0.172 | 0.073 | 0.146 | 0.144 | 0.052 | 0.142 | 0.141 | 0.049 | 0.086 | 0.086 | 0.032 |
| LRB2 | 3.876 | 4.213 | 3.285 | 0.346 | 0.401 | 0.273 | 0.177 | 0.187 | 0.084 | 0.157 | 0.156 | 0.058 | 0.153 | 0.151 | 0.055 | 0.092 | 0.093 | 0.037 |
| Δinter,res (mm) | As-Built | 0.370 | 0.812 | 0.939 | 0.214 | 0.635 | 0.928 | 0.051 | 0.093 | 0.113 | 0.031 | 0.048 | 0.062 | 0.030 | 0.051 | 0.067 | 0.021 | 0.039 | 0.052 |
| LRB1 | 0.436 | 0.760 | 0.856 | 0.021 | 0.058 | 0.130 | 0.014 | 0.023 | 0.019 | 0.003 | 0.011 | 0.012 | 0.009 | 0.016 | 0.013 | 0.004 | 0.008 | 0.008 |
| LRB2 | 0.544 | 0.803 | 0.880 | 0.016 | 0.066 | 0.157 | 0.015 | 0.020 | 0.017 | 0.006 | 0.010 | 0.011 | 0.008 | 0.015 | 0.014 | 0.004 | 0.008 | 0.008 |
| 1.0 | Δinter,max (mm) | As-Built | 2.014 | 2.784 | 2.278 | 1.572 | 2.280 | 2.013 | 0.607 | 0.717 | 0.352 | 0.393 | 0.456 | 0.151 | 0.411 | 0.466 | 0.157 | 0.261 | 0.300 | 0.111 |
| LRB1 | 5.220 | 5.583 | 5.065 | 0.407 | 0.593 | 0.850 | 0.218 | 0.222 | 0.098 | 0.181 | 0.174 | 0.058 | 0.177 | 0.169 | 0.051 | 0.105 | 0.105 | 0.037 |
| LRB2 | 6.537 | 6.499 | 4.920 | 0.440 | 0.739 | 1.009 | 0.235 | 0.249 | 0.118 | 0.198 | 0.192 | 0.068 | 0.190 | 0.188 | 0.063 | 0.116 | 0.118 | 0.046 |
| Δinter,res (mm) | As-Built | 0.790 | 1.427 | 1.515 | 0.429 | 1.179 | 1.579 | 0.104 | 0.166 | 0.184 | 0.044 | 0.080 | 0.091 | 0.031 | 0.076 | 0.093 | 0.033 | 0.067 | 0.076 |
| LRB1 | 0.815 | 1.730 | 2.713 | 0.020 | 0.234 | 0.782 | 0.017 | 0.032 | 0.041 | 0.008 | 0.016 | 0.018 | 0.012 | 0.020 | 0.019 | 0.008 | 0.012 | 0.016 |
| LRB2 | 1.112 | 1.475 | 1.660 | 0.028 | 0.322 | 0.938 | 0.015 | 0.037 | 0.047 | 0.008 | 0.018 | 0.024 | 0.010 | 0.022 | 0.025 | 0.006 | 0.014 | 0.024 |
The statistical investigations of the maximum inter-story drift ratios (Δ
inter,max) for individual frame models under 0.2, 0.6, and 1.0 scale factors are additionally conducted as shown in
Figure 18. The as-built frame model is stable up to 0.2 scale factor, and thus has the almost same statistical percentile points distributed over the floors. In contrast, the LRB-isolated models possess the peak maximum inter-story drift ratios that occur at the first floor. The peak maximum inter-story drift ratios at the as-built frame model gradually move into the first floor after reaching 0.6 scale factor applied to the NF ground motions. The increased plastic deformations at the lower stories cause this shift. Although the LRB-isolated frame models possess larger statistical peak ratio points than the as-built frame model, the values of their other statistical ratio points (distributed over from second to top floor) rapidly decrease. A couple of data points shown at the second floor of the as-built frame model exceed 2% drift ratio limit even under 0.6 scale factored ground motions. More severe damages representing larger inter-story drift ratios are found at the first floor of the frame model under 1.0 scale factor. The LRB-isolated frame models have relatively larger maximum inter-story drift ratios distributed over the first floor due to movable base conditions. However, smaller base shear forces transferred from base isolation can cause a huge decrease in the maximum inter-story drift ratios occurring at over second floor. For instance, the median (50th percentile) peak maximum inter-story drift ratios for the LRB1 and LRB2 frame model are 0.41% and 0.44%, respectively, while that for the as-built frame model is 1.57% (see also
Table 7).
For another statistical investigation, the residual inter-story drift ratios (Δ
inter,res) for individual frame models under 0.2, 0.6, and 1.0 scale factors are shown in
Figure 19. The statistical values for maximum and residual inter-story drift ratios are also summarized in
Table 7. For the LRB-isolated frame models, the maximum residual inter-story drift ratios that indicate the most severe damage occurring at the column member are commonly distributed over the first floor. The 84.1 percentile line of the LRB1 frame model starts to exceed the limits for rehabilitation decision (0.5%) under the NF ground motions with 0.6 scale factor, and is slightly larger than that of the LRB2 frame model owing to the implementation of more flexible base isolation systems. In proportion to the rise in the scale factor, the extent of structural damage occurring at the first floor can be also extended with the residual inter-story drift ratio increasing. In spite, these LRB-isolated frame models exhibits excellent recentering properties characterized by the rapidly decreasing residual inter-story drifts that are distributed over upper floors, as compared to the as-built frame model. A couple of data points shown at the third floor of the as-built frame model exceed the rehabilitation decision limit after 1.0 scale factored ground motions (see
Figure 19c). Furthermore, the as-built frame model undergoes complete collapse even at the second floor. It can be finally shown that base isolation systems can generally mitigate structural damage generated by the residual inter-story drift.


