
Land Use/Land Cover Change Induced Impacts on Water Supply Service in the Upper Reach of Heihe River Basin

Abstract
:1. Introduction
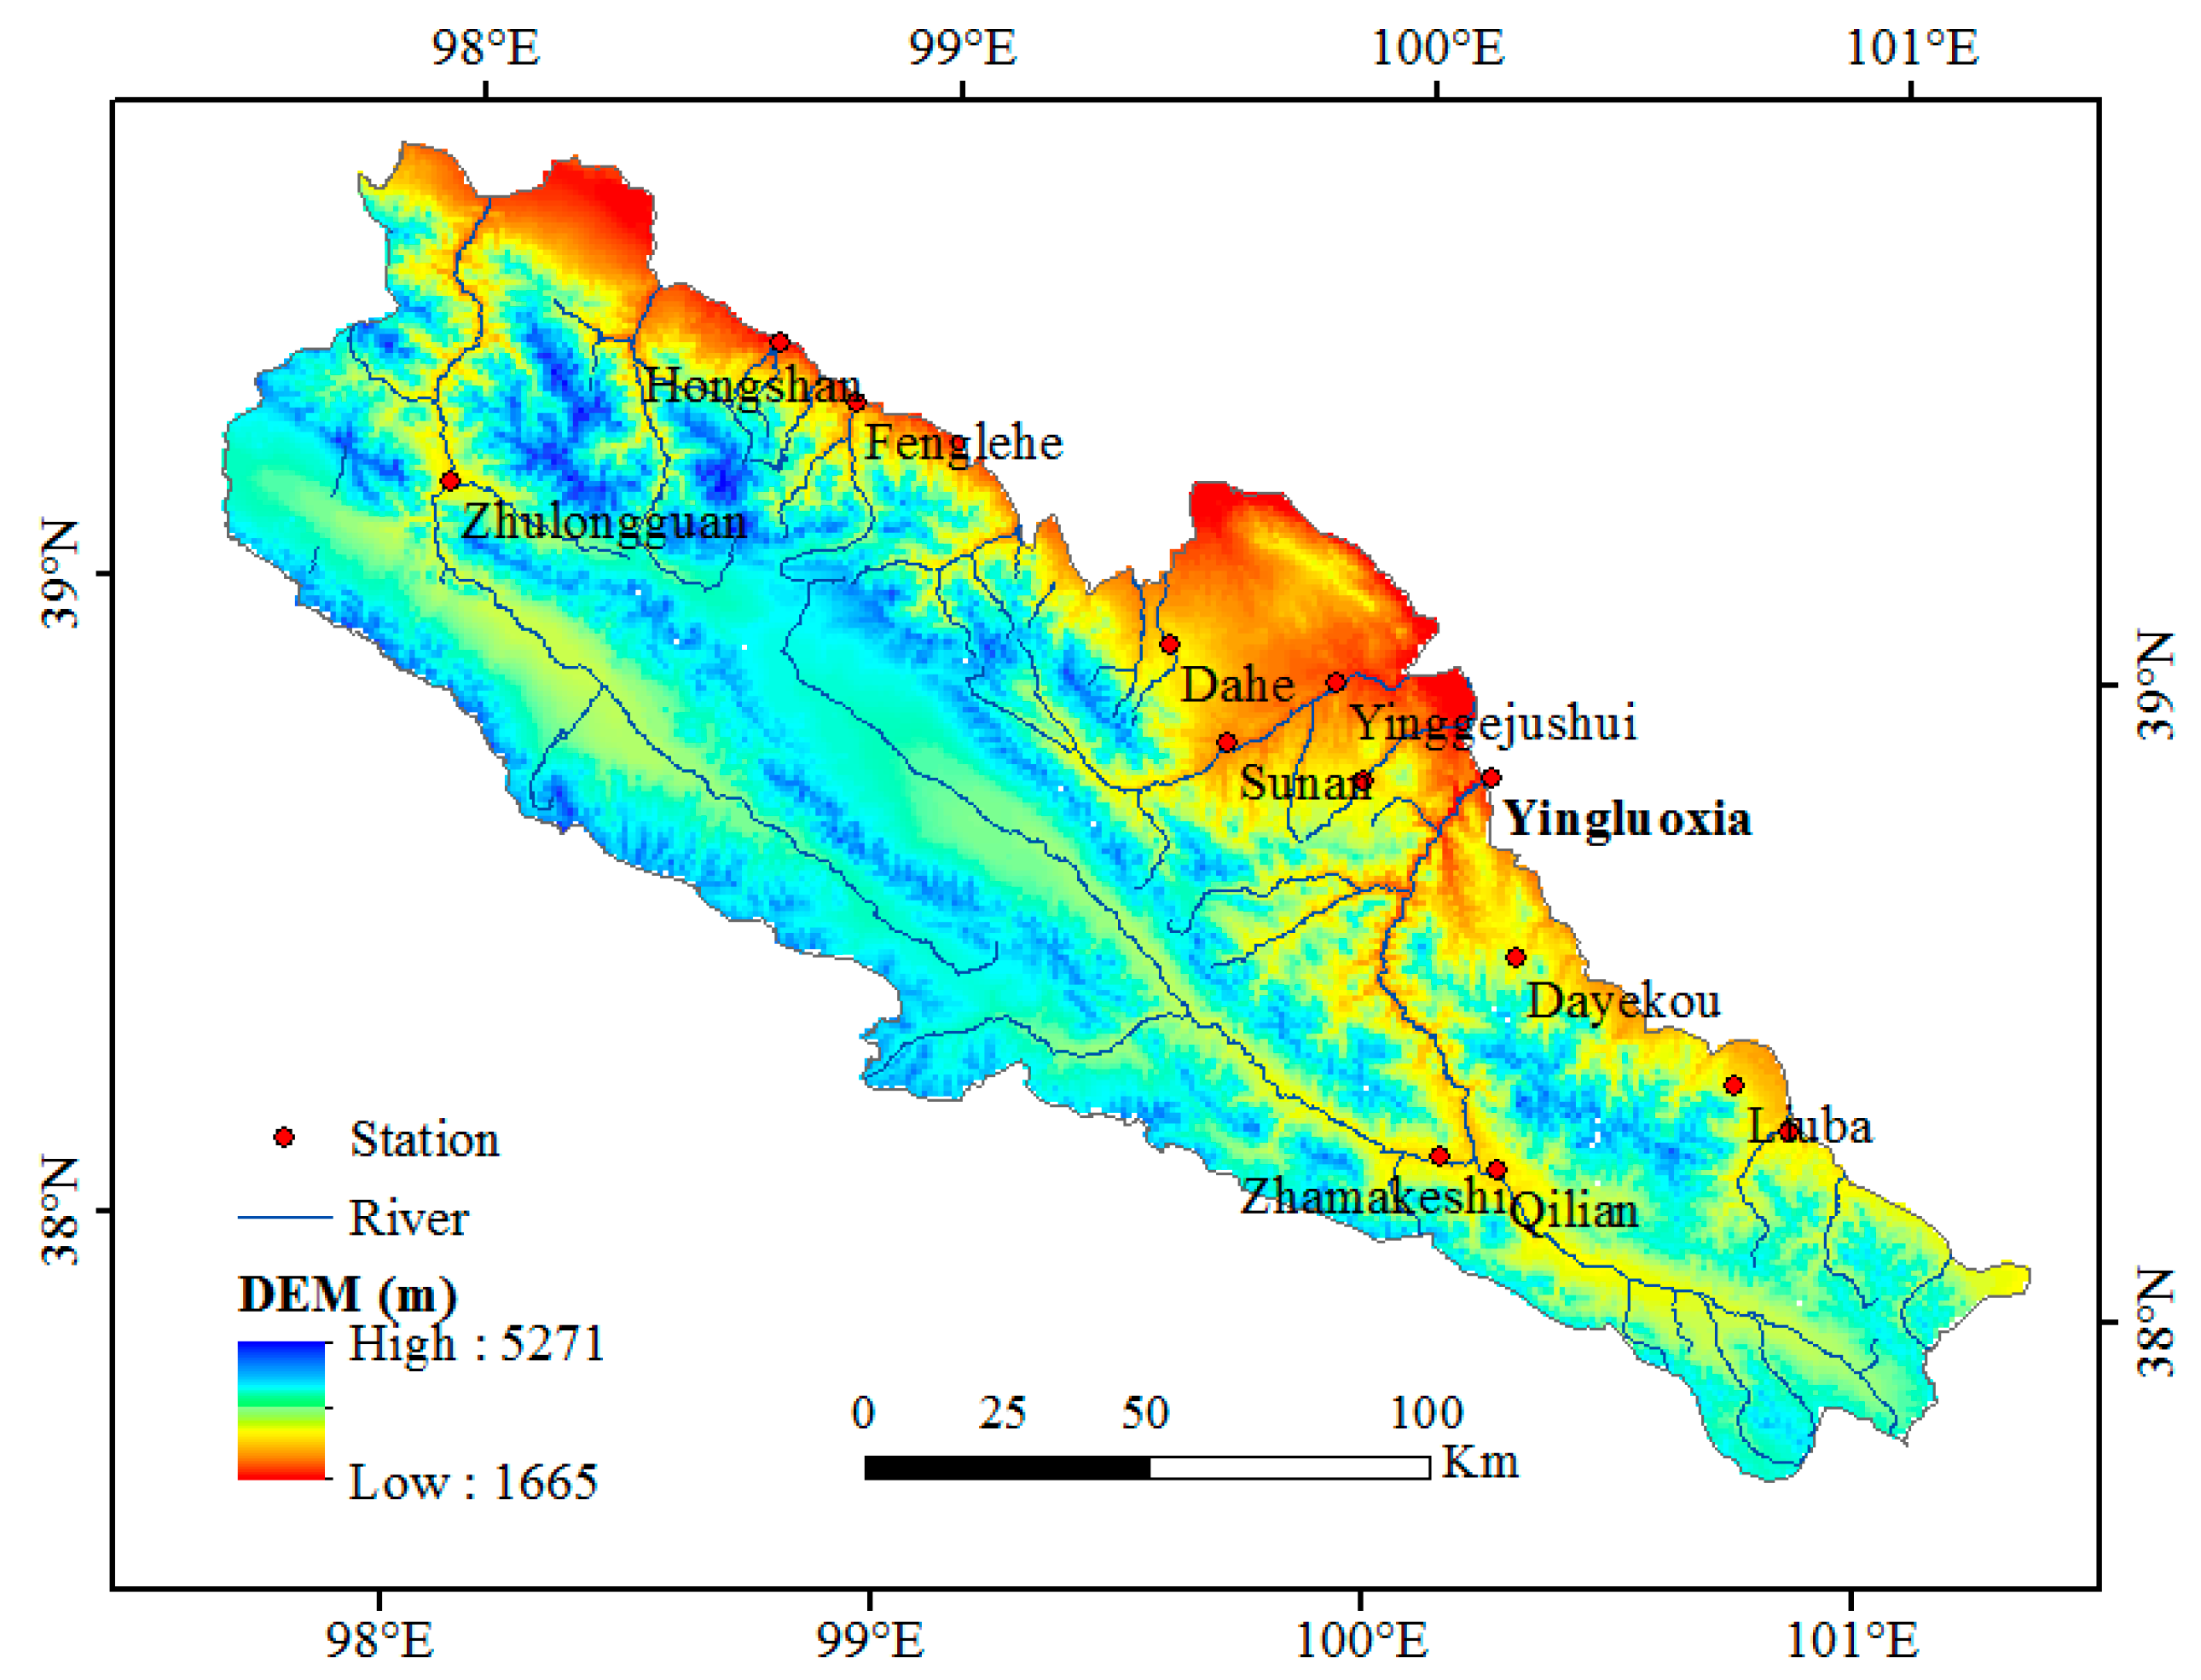
2. Study Area

3. Data and Methodology
3.1. Data Collection and Processing

3.2. InVEST Model
4. Results and Discussions
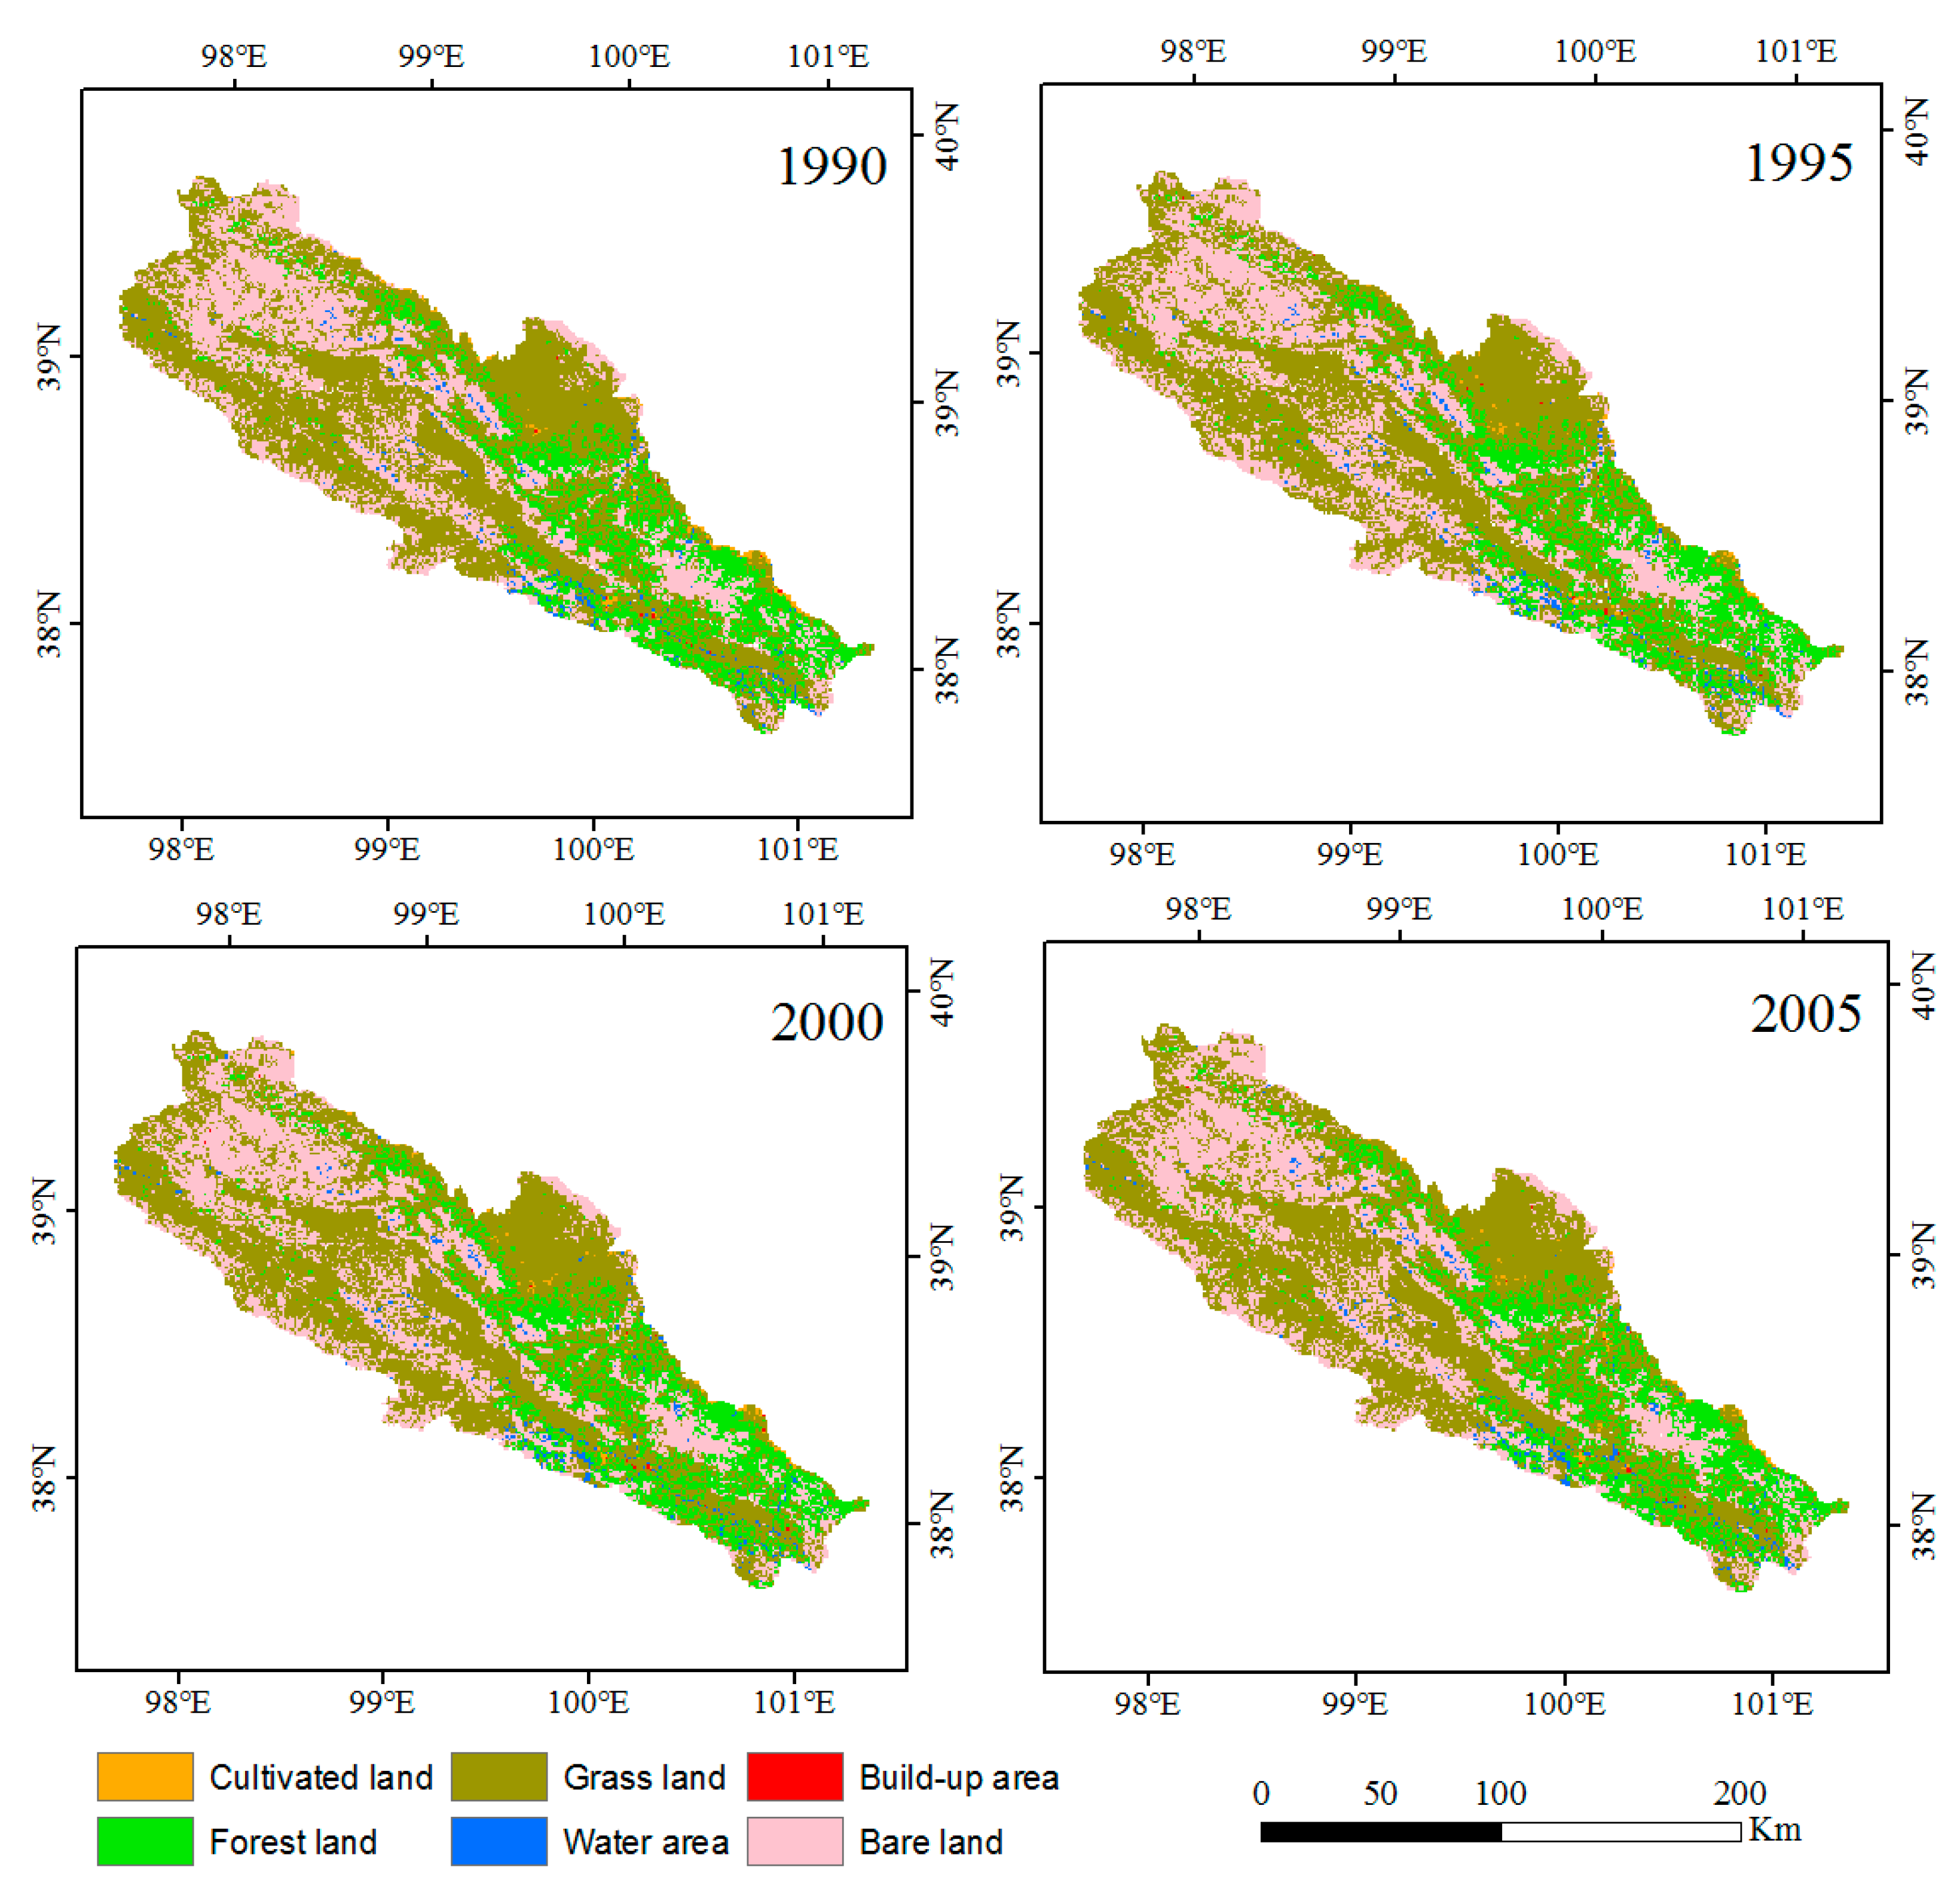
4.1. Analysis of Historical LUCC

| Year | 1990 | Δ1995–1990 | 1995 | Δ2000–1995 | 2000 | Δ2005–1990 | 2005 |
|---|---|---|---|---|---|---|---|
| Cultivated land | 174 | −18 | 156 | −13 | 143 | −44 | 99 |
| Forest land | 4392 | 42 | 4434 | 17 | 4451 | 9 | 4460 |
| Grassland | 14,007 | −16 | 13,991 | 156 | 14,147 | 65 | 14,212 |
| Water area | 385 | −48 | 337 | 35 | 372 | 4 | 376 |
| Built-up area | 15 | 4 | 19 | 1 | 20 | 3 | 23 |
| Bare land | 8294 | 36 | 8330 | −196 | 8134 | −37 | 8097 |

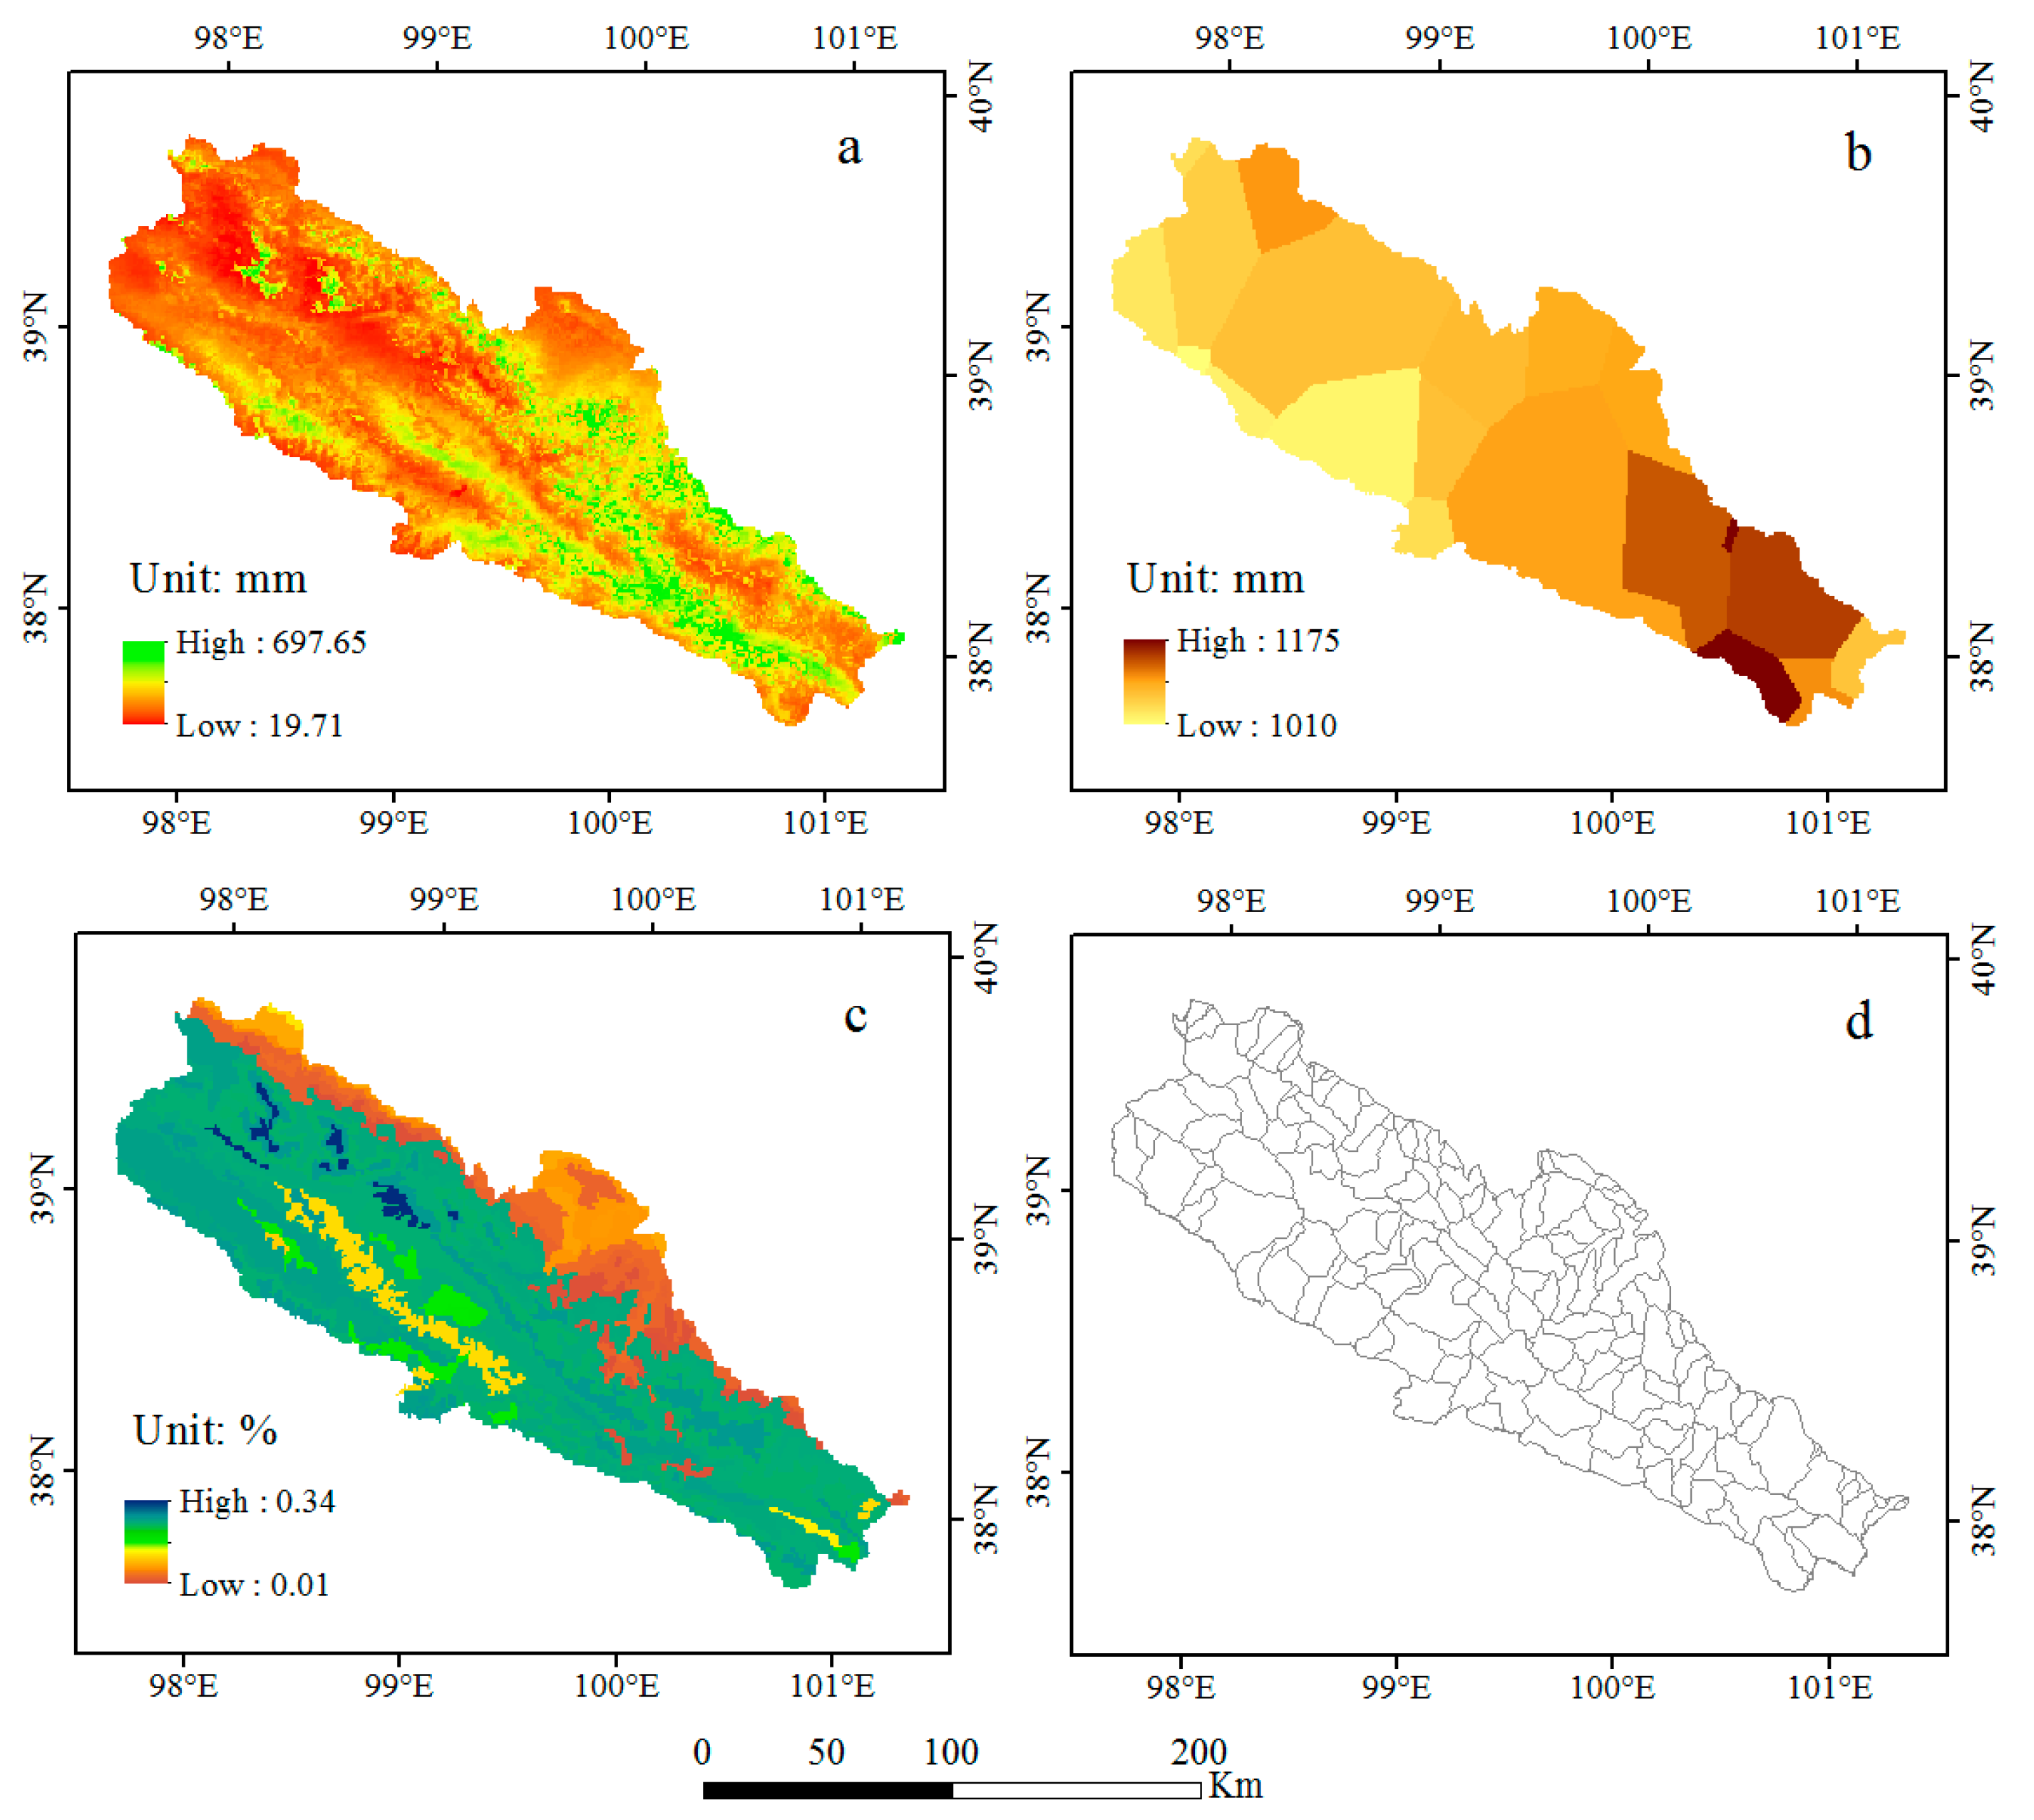
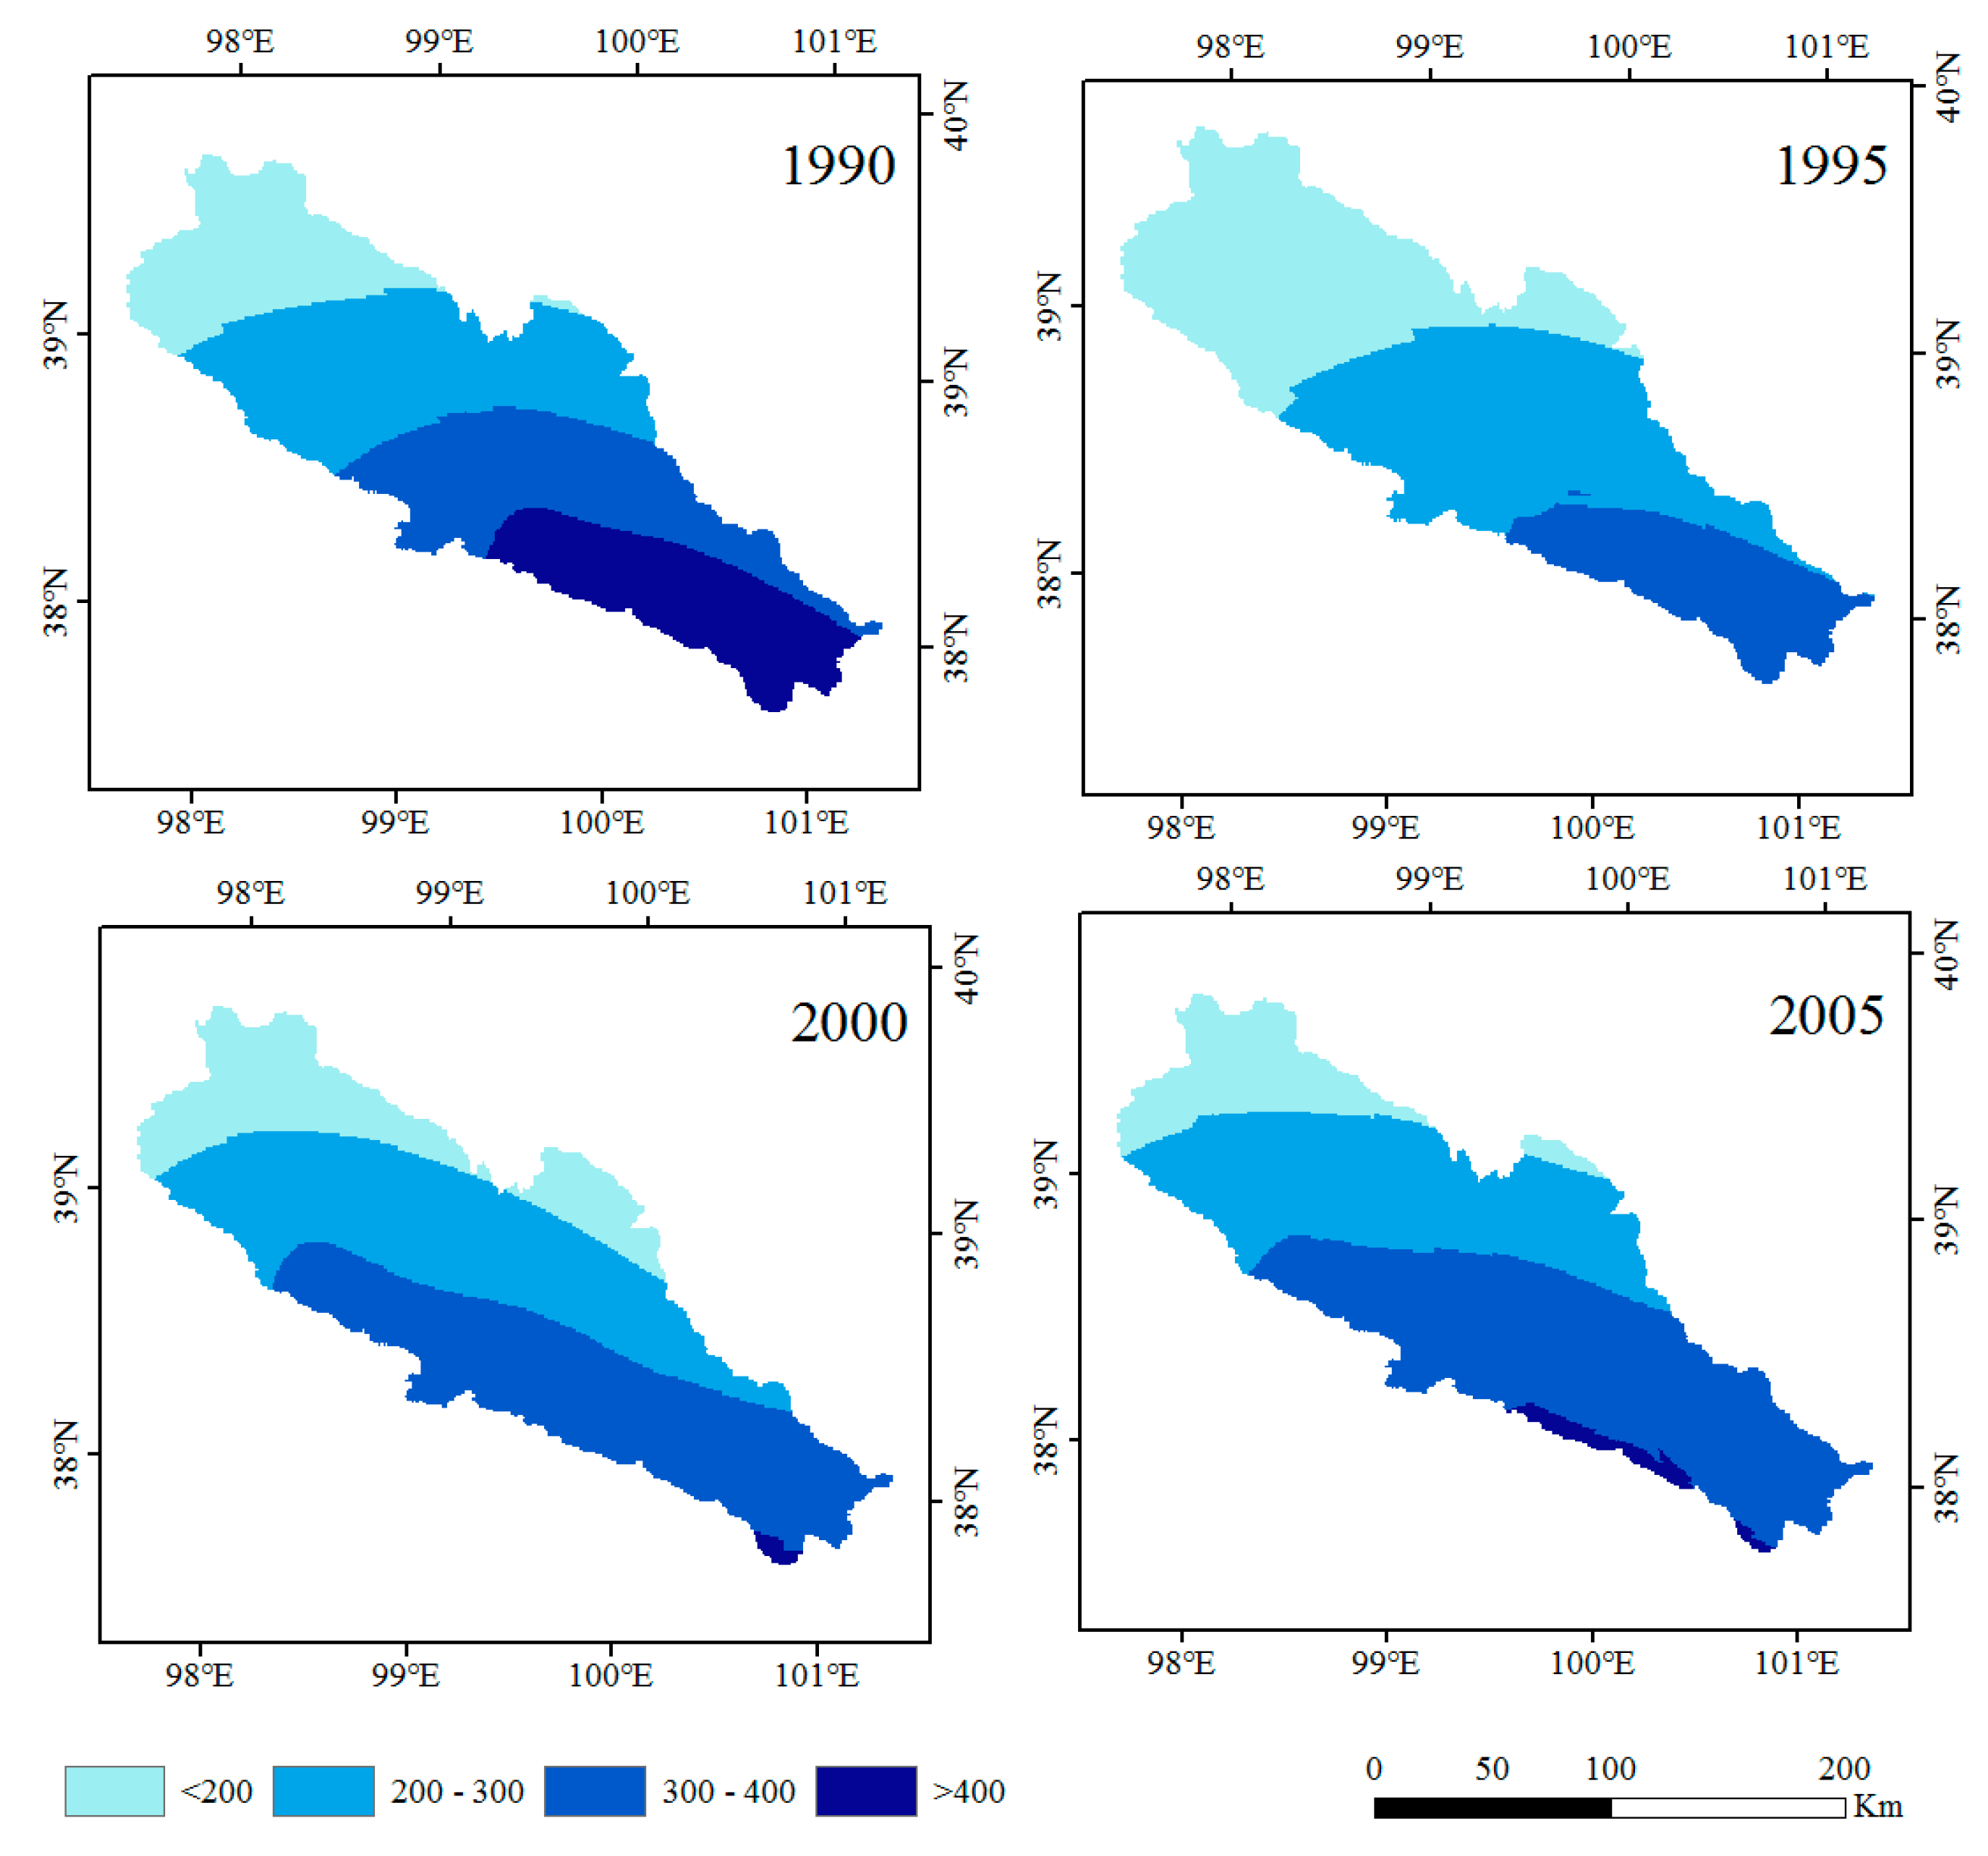
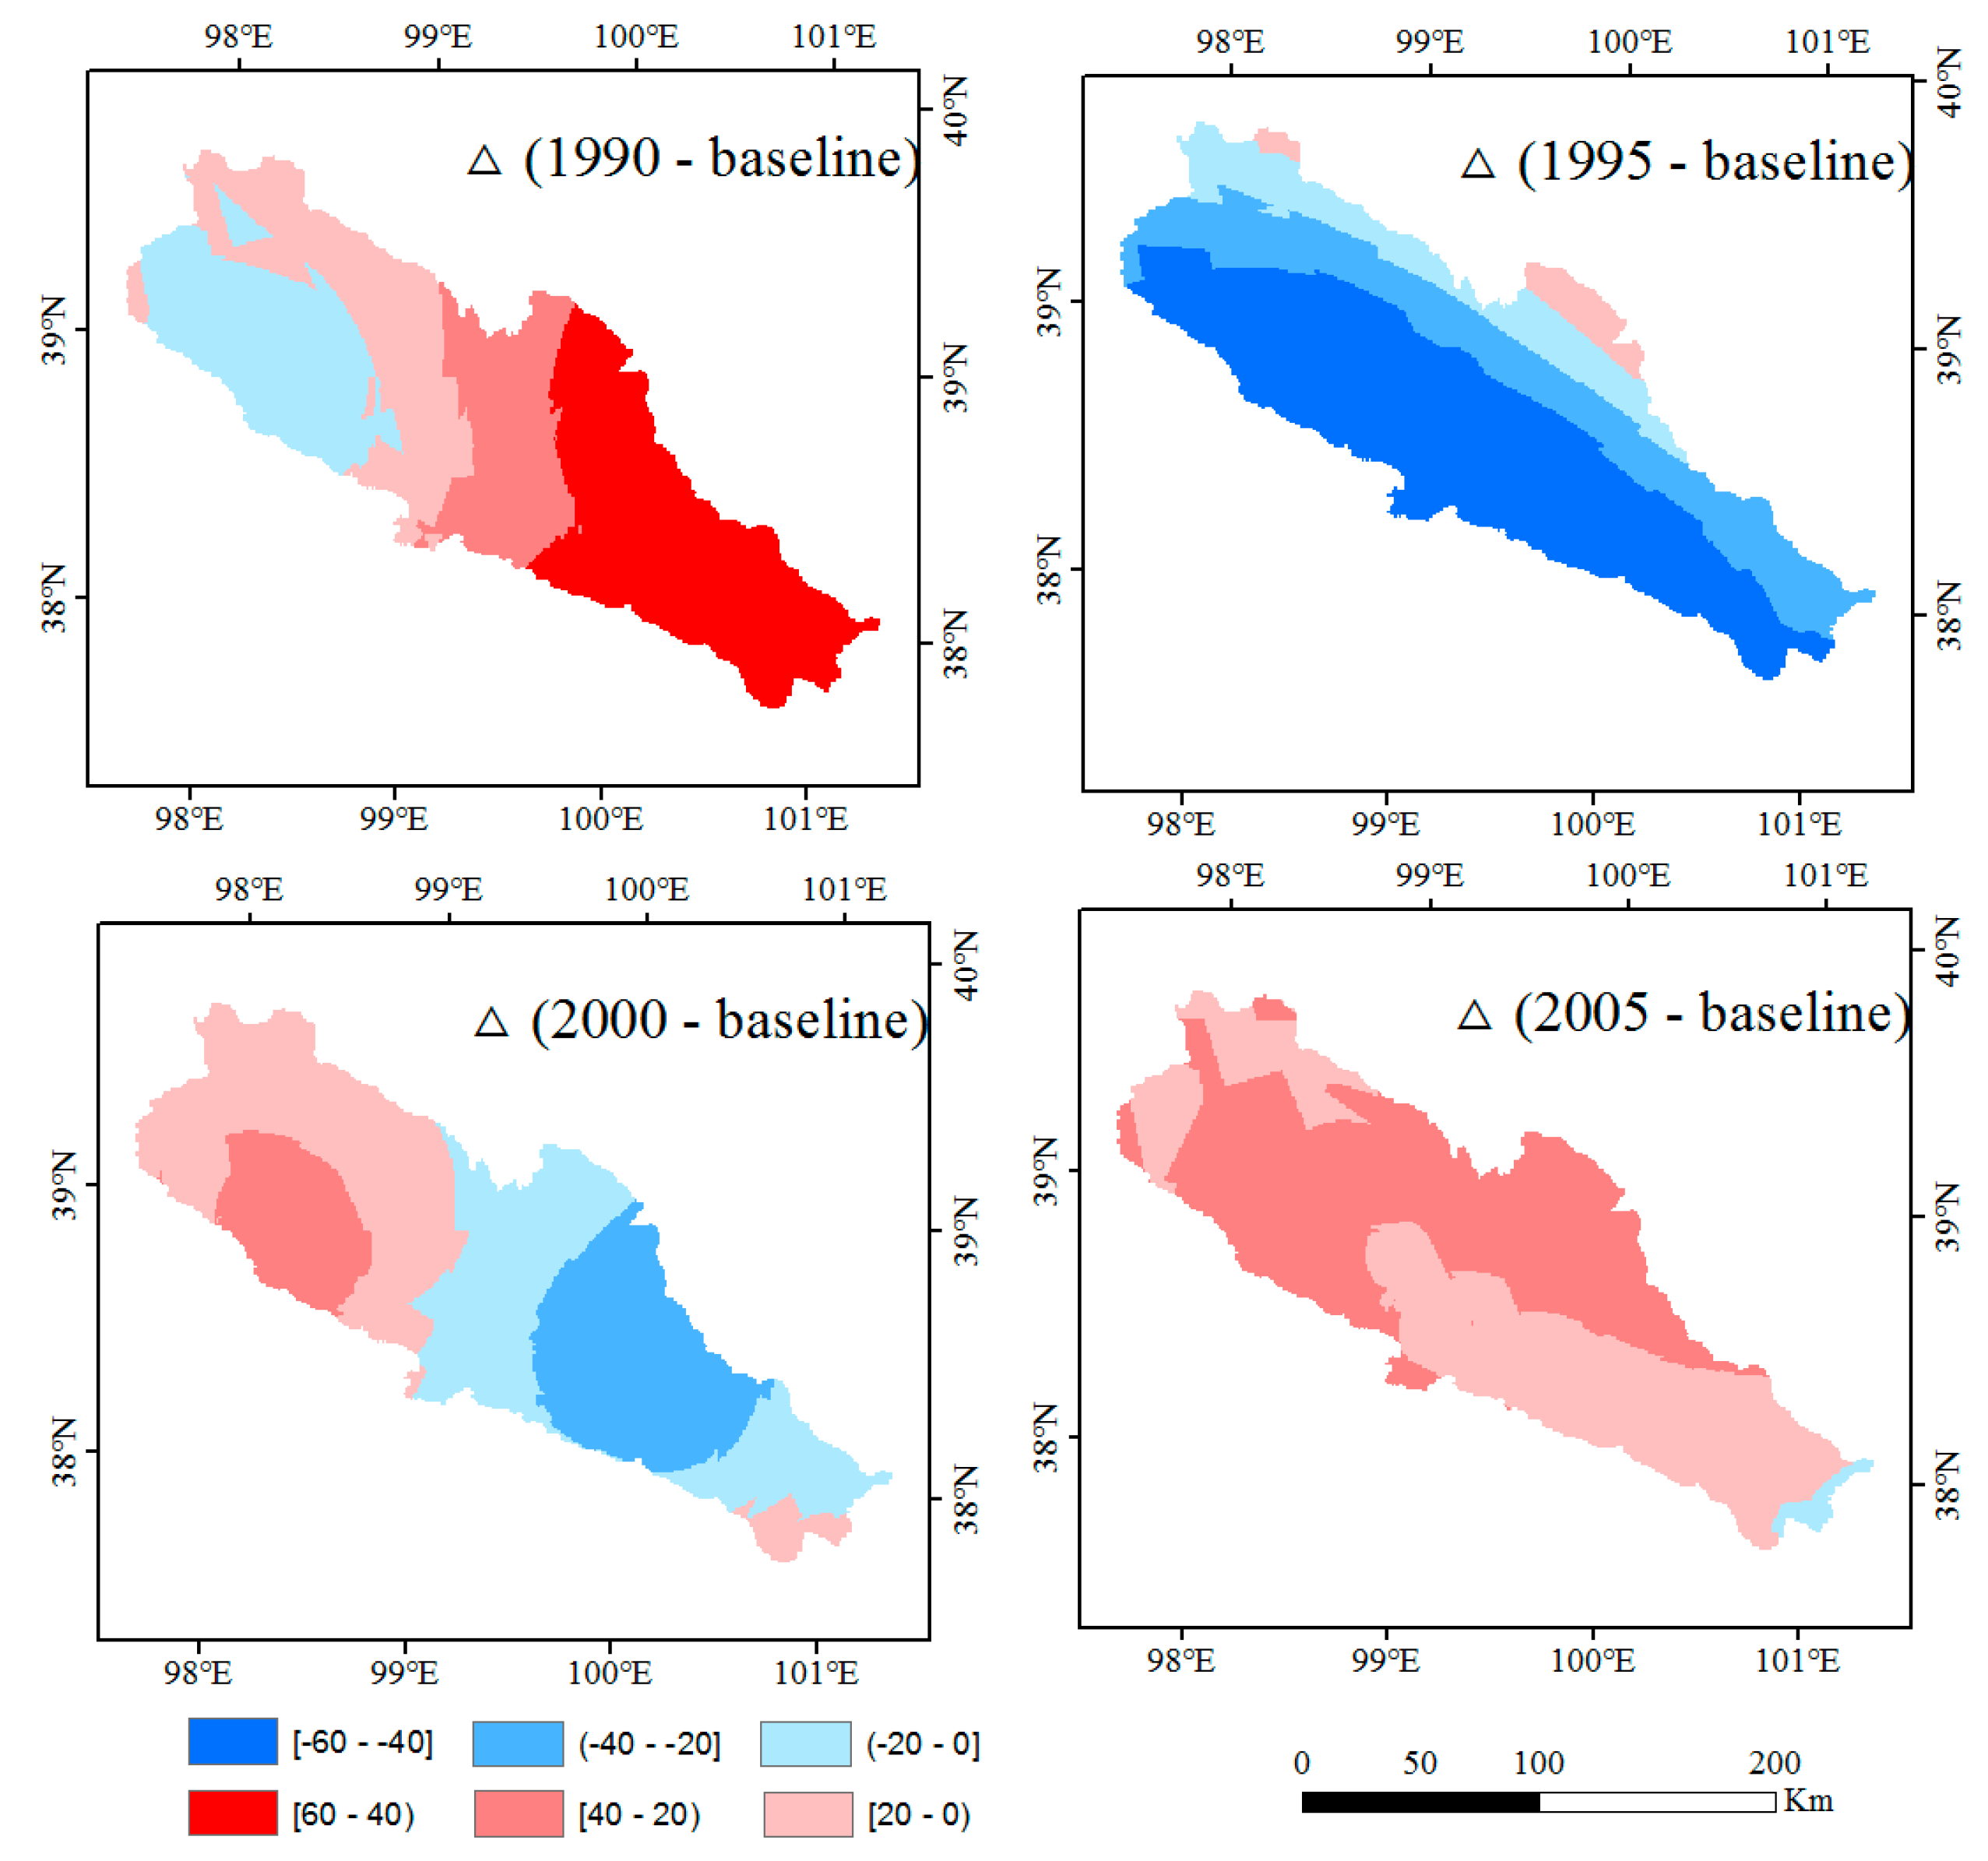
4.2. Analysis of Historical Precipitation


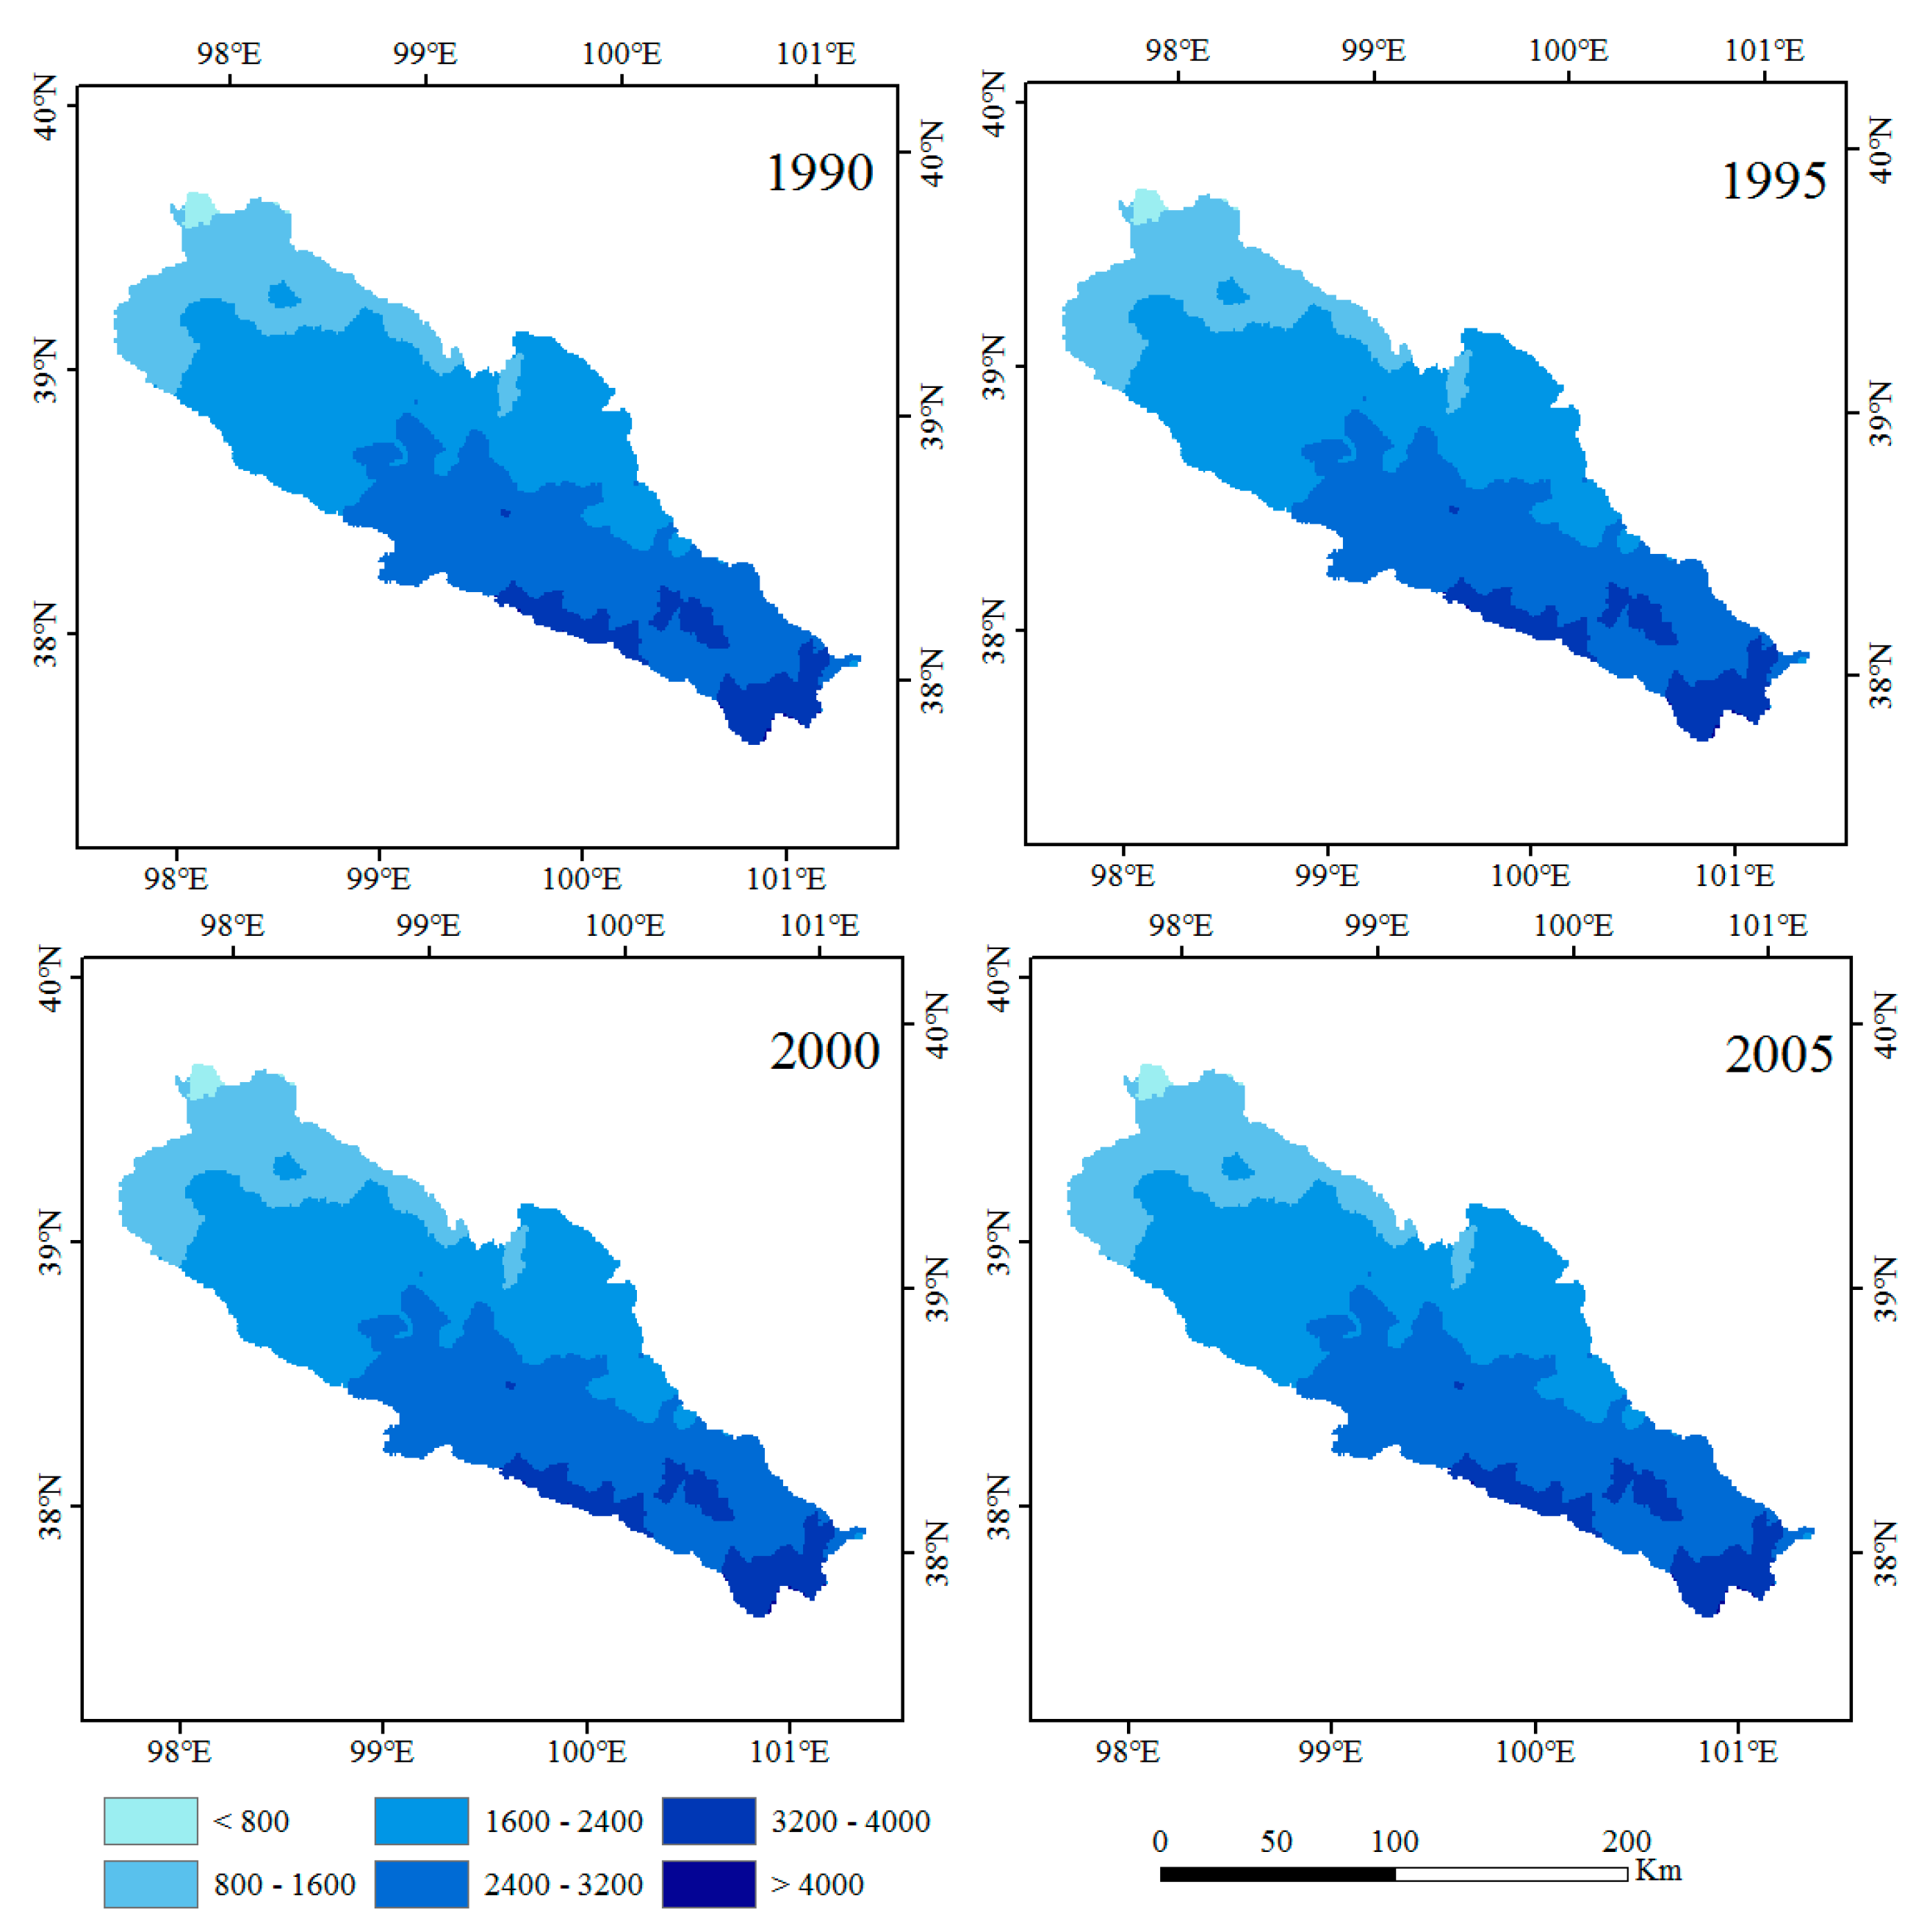
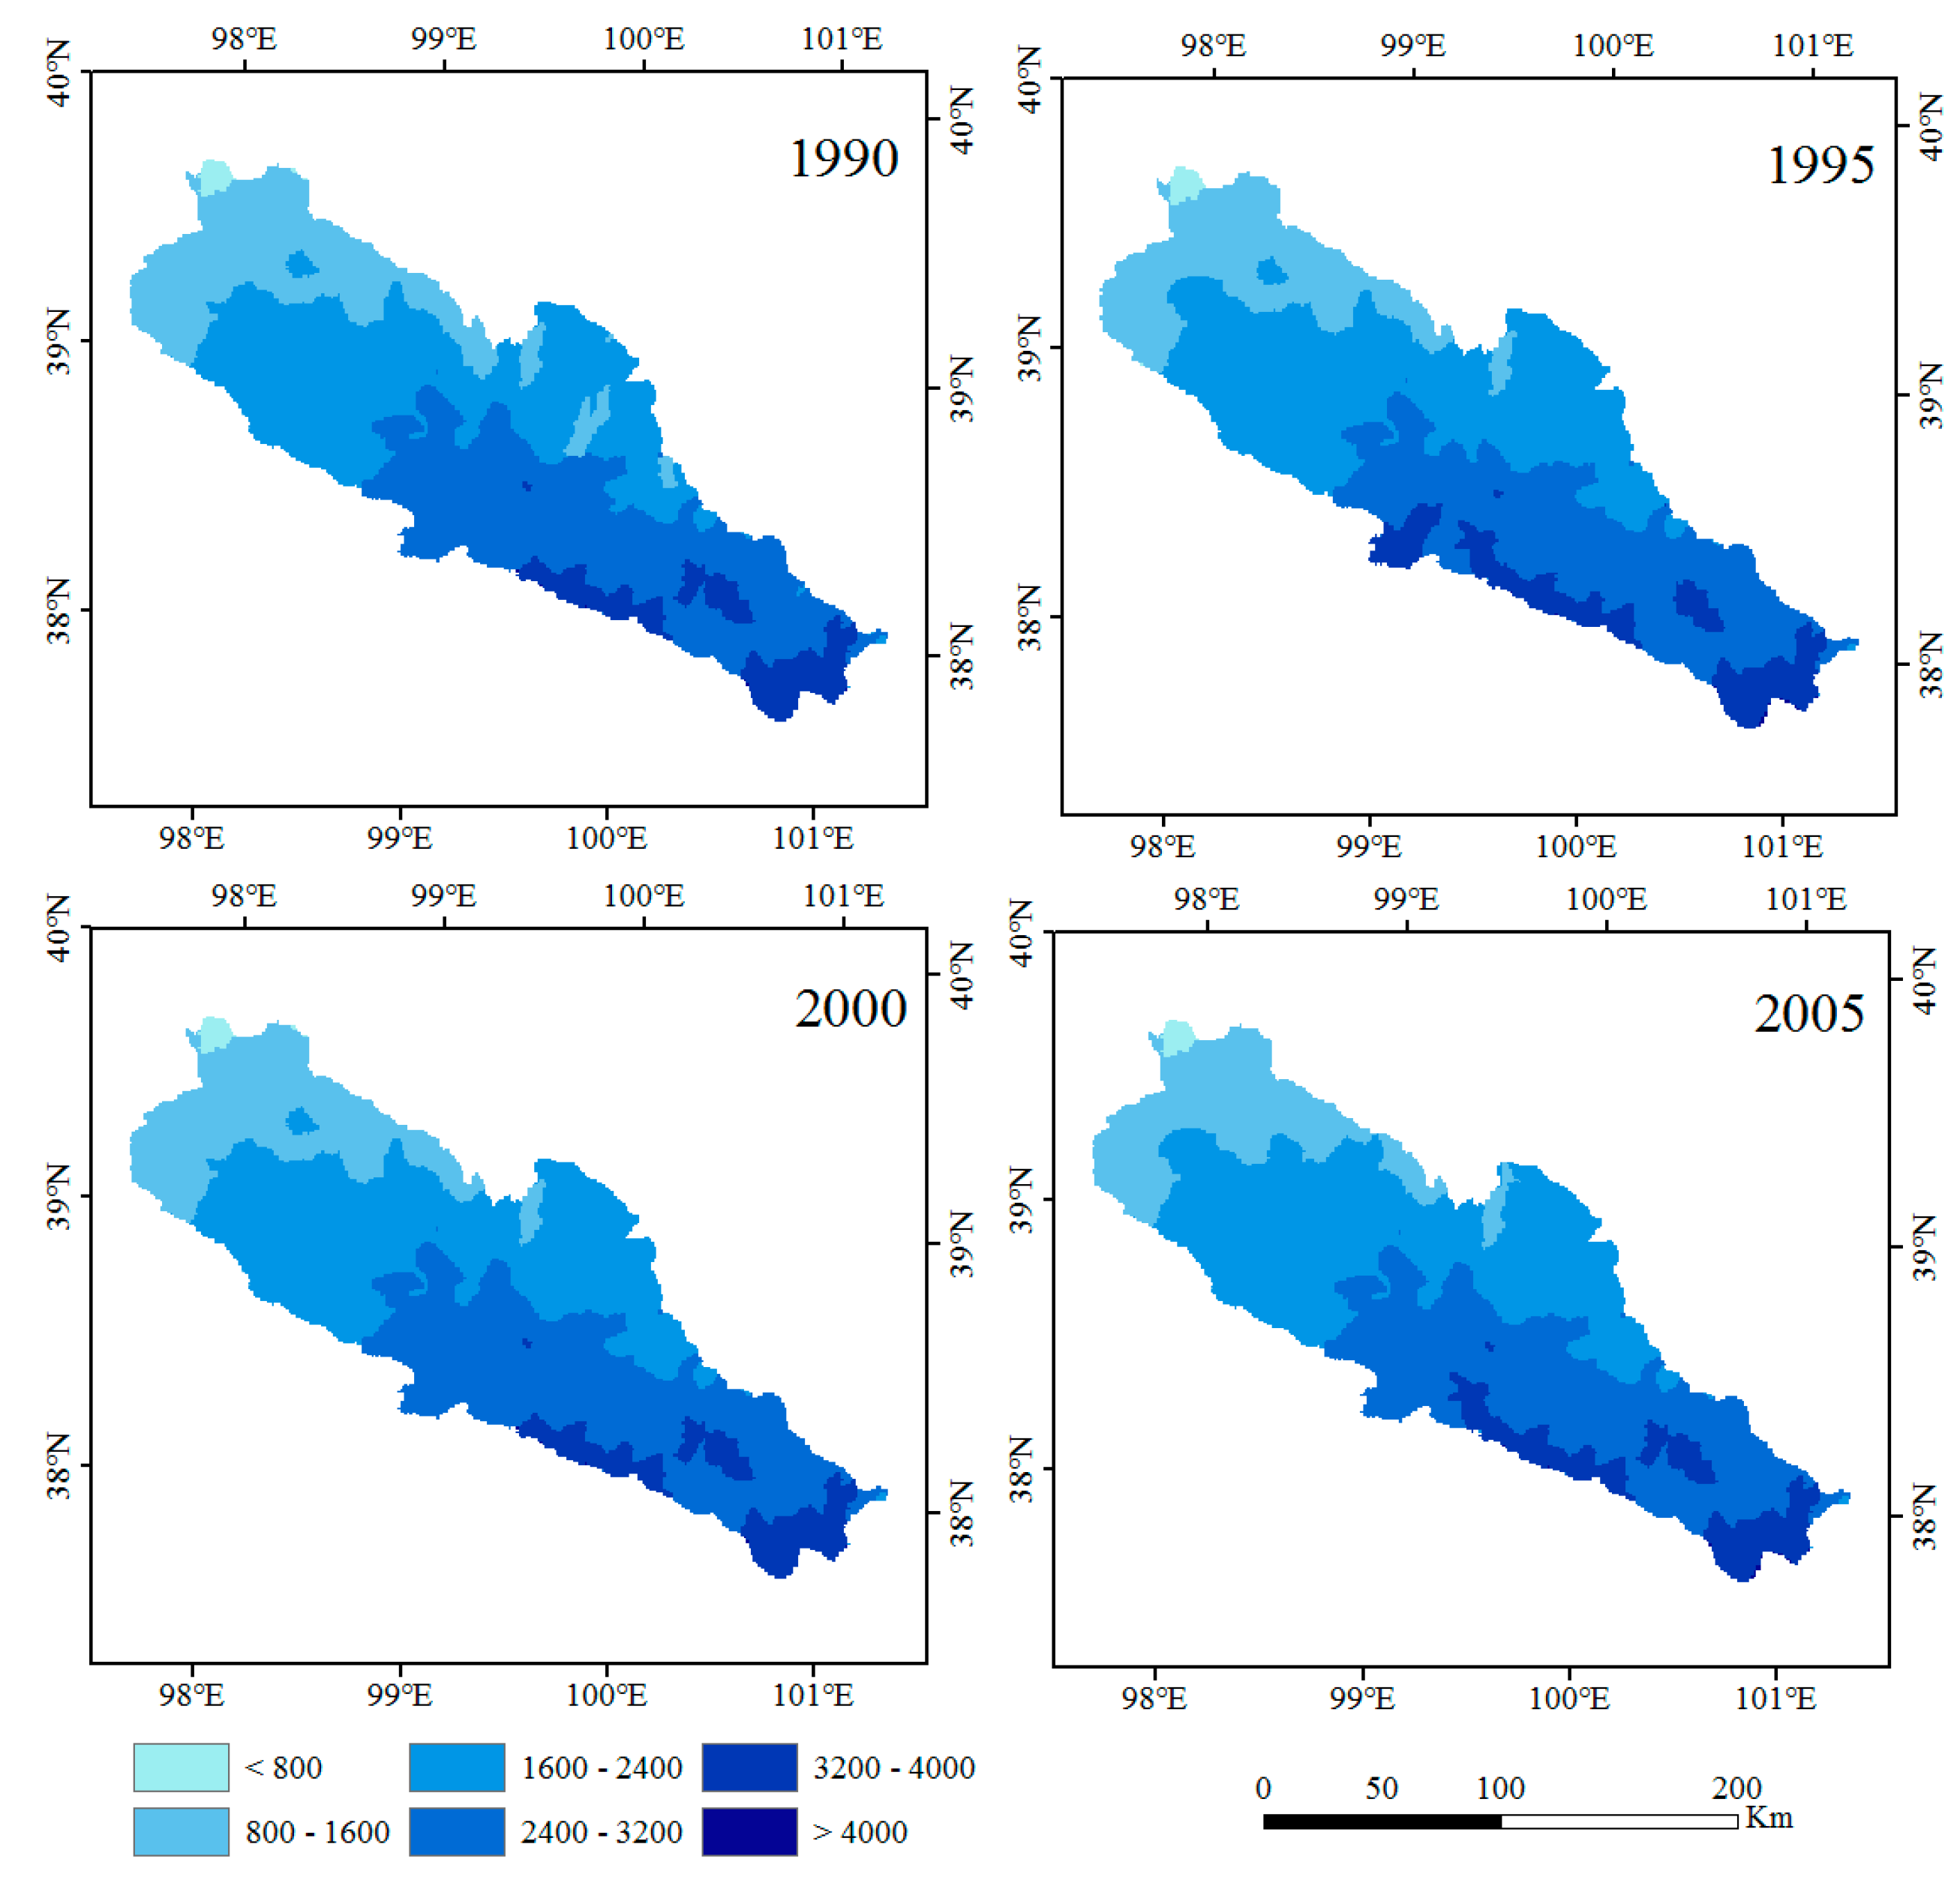
4.3. Impacts of LUCC and Precipitation Changes on Water Yield in Upper Reach of Heihe River Basin
| Scenarios | 1990 | 1995 | 2000 | 200 |
|---|---|---|---|---|
| Baseline | Precipitation 1990 LUCC 1990 | Precipitation 1995 LUCC 1995 | Precipitation 2000 LUCC 2000 | Precipitation 2005 LUCC 2005 |
| Scenario 1 | Precipitation 1990 | |||
| LUCC 1995 | LUCC 2000 | LUCC 2005 | ||
| Scenario 2 | Precipitation 1995 | Precipitation 2000 | Precipitation 2005 | |
| LUCC 1990 | ||||
4.3.1. Simulated Water Yield under Baseline Scenario: LUCC Change and Precipitation Change Combined

4.3.2. Simulated Water Yield under Scenario 2: Only Impact of LUCC Change
| p | r | |
|---|---|---|
| Cultivated land | 0.049 | −0.578 |
| Forest land | 0.990 | 0.004 |
| Grassland | 0.061 | 0.555 |
| Water area | 0.064 | −0.550 |
| Built-up area | N/A | N/A |
| Bare land | 0.994 | 0.003 |
| Year | 1990 | 1995 | 2000 | 2005 |
|---|---|---|---|---|
| Baseline | 202.81 | 139.10 | 180.62 | 199.63 |
| Scenario 2 | 202.81 | 204.38 | 205.32 | 204.40 |
| Scenario 3 | 202.81 | 142.71 | 180.49 | 200.53 |
4.3.3. Simulated Water Yield under Scenario 2: Only Impact of Precipitation Change


5. Conclusions
Acknowledgments
Author Contributions
Conflicts of Interest
References
- Marquès, M.; Bangash, R.F.; Kumar, V.; Sharp, R.; Schuhmacher, M. The impact of climate change on water provision under a low flow regime: A case study of the ecosystems services in the Francoli river basin. J. Hazard. Mater. 2013, 263, 224–232. [Google Scholar] [CrossRef] [PubMed]
- Polasky, S.; Nelson, E.; Pennington, D.; Johnson, K.A. The impact of land-use change on ecosystem services, biodiversity and returns to landowners: A case study in the State of Minnesota. Environ. Resour. Econ. 2011, 48, 219–242. [Google Scholar] [CrossRef]
- Deng, X.; Li, Z.; Huang, J.; Shi, Q.; Li, Y. A Revisit to the Impacts of Land Use Changes on the Human Wellbeing via Altering the Ecosystem Provisioning Services. Adv. Meteorol. 2013, 2013. [Google Scholar] [CrossRef]
- Wade, A.S.I.; Asase, A.; Hadley, P.; Mason, J.; Ofori-Frimpong, K.; Preece, D.; Spring, N.; Norris, K. Management strategies for maximizing carbon storage and tree species diversity in cocoa-growing landscapes. Agric. Ecosyst. Environ. 2010, 138, 324–334. [Google Scholar] [CrossRef]
- Egoh, B.; Rouget, M.; Reyers, B.; Knight, A.T.; Cowling, R.M.; van Jaarsveld, A.S.; Welz, A. Integrating ecosystem services into conservation assessments: A review. Ecol. Econ. 2007, 63, 714–721. [Google Scholar] [CrossRef]
- Chen, X.; Bai, J.; Li, X.; Luo, G.; Li, J.; Li, B.L. Changes in land use/land cover and ecosystem services in Central Asia during 1990–2009. Curr. Opin. Environ. Sustain. 2013, 5, 116–127. [Google Scholar] [CrossRef]
- Pielke, R.A.; Pitman, A.; Niyogi, D.; Mahmood, R.; McAlpine, C.; Hossain, F.; Goldewijk, K.K.; Nair, U.; Betts, R.; Fall, S. Land use/land cover changes and climate: Modeling analysis and observational evidence. Wiley Interdiscip. Rev. Clim. Chang. 2011, 2, 828–850. [Google Scholar] [CrossRef]
- Kishtawal, C.M.; Niyogi, D.; Tewari, M.; Pielke, R.A.; Shepherd, J.M. Urbanization signature in the observed heavy rainfall climatology over India. Int. J. Climatol. 2010, 30, 1908–1916. [Google Scholar] [CrossRef]
- Daily, G.C.; Polasky, S.; Goldstein, J.; Kareiva, P.M.; Mooney, H.A.; Pejchar, L.; Ricketts, T.H.; Salzman, J.; Shallenberger, R. Ecosystem services in decision making: Time to deliver. Front. Ecol. Environ. 2009, 7, 21–28. [Google Scholar] [CrossRef]
- Li, Z.; Deng, X.; Huang, J.; Zhang, R.; Huang, J. Critical Studies on Integrating Land-Use Induced Effects on Climate Regulation Services into Impact Assessment for Human Well-Being. Adv. Meteorol. 2013, 2013. [Google Scholar] [CrossRef]
- Arthington, A.H.; Bunn, S.E.; Poff, N.L.; Naiman, R.J. The challenge of providing environmental flow rules to sustain river ecosystems. Ecol. Appl. 2006, 16, 1311–1318. [Google Scholar] [CrossRef] [PubMed]
- Ji, X.B.; Kang, E.S.; Chen, R.S.; Zhao, W.Z.; Xiao, S.C.; Jin, B.W. Analysis of Water Resources Supply and Demand and Security of Water Resources Development in Irrigation Regions of the Middle Reaches of the Heihe River Basin, Northwest China. Agric. Sci. China 2006, 5, 130–140. [Google Scholar] [CrossRef]
- Boithias, L.; Acuña, V.; Vergoñós, L.; Ziv, G.; Marcé, R.; Sabater, S. Assessment of the water supply: Demand ratios in a Mediterranean basin under different global change scenarios and mitigation alternatives. Sci. Total Environ. 2014, 470–471, 567–577. [Google Scholar] [CrossRef] [PubMed]
- Leh, M.D.; Matlock, M.D.; Cummings, E.C.; Nalley, L.L. Quantifying and mapping multiple ecosystem services change in West Africa. Agric. Ecosyst. Environ. 2013, 165, 6–18. [Google Scholar] [CrossRef]
- Bagstad, K.J.; Semmens, D.J.; Winthrop, R. Comparing approaches to spatially explicit ecosystem service modeling: A case study from the San Pedro River, Arizona. Ecosyst. Serv. 2013, 5, 40–50. [Google Scholar] [CrossRef]
- Natural Capital Project. Available online: www.naturalcapitalproject.org (accessed on 29 December 2014).
- Zhang, W.; Ricketts, T.H.; Kremen, C.; Carney, K.; Swinton, S.M. Ecosystem services and dis-services to agriculture. Ecol. Econ. 2007, 64, 253–260. [Google Scholar] [CrossRef]
- Thompson, J.R.; Wiek, A.; Swanson, F.J.; Carpenter, S.R.; Fresco, N.; Hollingsworth, T.; Spies, T.A.; Foster, D.R. Scenario Studies as a Synthetic and Integrative Research Activity for Long-Term Ecological Research. BioScience 2012, 62, 367–376. [Google Scholar] [CrossRef]
- Bateman, I.J.; Harwood, A.R.; Mace, G.M.; Watson, R.T.; Abson, D.J.; Andrews, B.; Binner, A.; Crowe, A.; Day, B.H.; Dugdale, S.; et al. Bringing Ecosystem Services into Economic Decision-Making: Land Use in the United Kingdom. Science 2013, 341, 45–50. [Google Scholar] [CrossRef] [PubMed]
- Bennett, E.M.; Peterson, G.D.; Gordon, L.J. Understanding relationships among multiple ecosystem services. Ecol. Lett. 2009, 12, 1394–1404. [Google Scholar] [CrossRef] [PubMed]
- Dale, V.H.; Polasky, S. Measures of the effects of agricultural practices on ecosystem services. Ecol. Econ. 2007, 64, 286–296. [Google Scholar] [CrossRef]
- Mahmood, R.; Pielke, R.A.; Hubbard, K.G.; Niyogi, D.; Dirmeyer, P.A.; McAlpine, C.; Carleton, A.M.; Hale, R.; Gameda, S.; Beltrán-Przekurat, A. Land cover changes and their biogeophysical effects on climate. Int. J. Climatol. 2014, 34, 929–953. [Google Scholar] [CrossRef]
- Nair, U.S.; Wu, Y.; Kala, J.; Lyons, T.; Pielke, R.; Hacker, J. The role of land use change on the development and evolution of the west coast trough, convective clouds, and precipitation in southwest Australia. J. Geophys. Res. Atmos. (1984–2012) 2011. [Google Scholar] [CrossRef]
- Deng, X.; Zhao, C.; Lin, Y.; Zhang, T.; Qu, Y.; Zhang, F.; Wang, Z.; Wu, F. Downscaling the Impacts of Large-Scale LUCC on Surface Temperature along with IPCC RCPs: A Global Perspective. Energies 2014, 7, 2720–2739. [Google Scholar] [CrossRef]
- Hoyer, R.; Chang, H. Assessment of freshwater ecosystem services in the Tualatin and Yamhill basins under climate change and urbanization. Appl. Geogr. 2014, 53, 402–416. [Google Scholar] [CrossRef]
- Li, L.; Wang, Z.; Wang, Q. Inflence of Clmiatic Change on Flow over the Upper Reaches of Heihe River. Sci. Geogr. Sin. 2006, 26, 40–46. [Google Scholar]
- Liu, J.F.; Zhang, B. Impact of Climate Change on the Alpine Streamflow in the Northwest Inland Arid Region of China During the Past 50a-Case Study of Heihe River Valley. J. Arid Land Resour. Environ. 2007, 21, 58–63. [Google Scholar]
- Meng, J.; Wu, X.; Li, Z. Land Use and Land Cover Changes in Heihe River Basin during the Period of 1988–2000. Acta Sci. Nat. Univ. Pekin. 2004, 6, 922–929. [Google Scholar]
- Wu, J. The effect of ecological management in the upper reaches of Heihe River. Acta Ecol. Sin. 2011, 31, 1–7. [Google Scholar] [CrossRef]
- Zhang, K.; Wang, R.; Han, H.; Wang, X.; Si, J. Hydrologica land Water Resources Effects under Climate Change in Heihe River Basin. Resour. Sci. 2007, 1, 77–83. [Google Scholar]
- Liu, J.; Liu, M.; Zhuang, D.; Zhang, Z.; Deng, X. Study on spatial pattern of land-use change in China during 1995–2000. Sci. China Ser. D Earth Sci. 2003, 46, 373–384. [Google Scholar] [CrossRef]
- Zhang, Z.Q.; Xu, Z.; Wang, J.; Cheng, G. Value of the Ecosystem Services in the Heihe River Basin. J. Glaciol. Geocryol. 2001, 23, 360–366. [Google Scholar]
- Deng, X.; Liu, J.; Zhuang, D.; Zhan, J.; Zhao, T. Modeling the relationship of land use change and some geophysical indicators for the interlock area of farming and pasturing in China. J. Geogr. Sci. 2002, 12, 397–404. [Google Scholar] [CrossRef]
- Deng, X.; Su, H.; Zhan, J. Integration of multiple data sources to simulate the dynamics of land systems. Sensors 2008, 8, 620–634. [Google Scholar] [CrossRef]
- Liu, J.Y.; Buheaosier. Study on Spatial-temporal Feature of Modern Land Use Change in China: Using Remote Sensing Techniques. Quat. Sci. 2000, 3, 229–239. [Google Scholar]
- Allen, R.G.; Pereira, L.S.; Raes, D.; Smith, M. Crop evapotranspiration-Guidelines for computing crop water requirements-FAO Irrigation and drainage paper 56. FAO Rome 1998, 300, 6541. [Google Scholar]
- Wu, B.; Xiong, J.; Yan, N. ETWatch: Models and methods. J. Remote Sens. 2010, 15, 224–230. [Google Scholar]
- Wu, B.; Yan, N.; Xiong, J.; Bastiaanssen, W.G.M.; Zhu, W.; Stein, A. Validation of ETWatch using field measurements at diverse landscapes: A case study in Hai Basin of China. J. Hydrol. 2012, 436, 67–80. [Google Scholar] [CrossRef]
- Wu, B.; Xiong, J.; Yan, N.; Yang, L.; Du, X. ETWatch for monitoring regional evapotranspiration with remote sensing. Adv. Water Sci. 2008, 19, 671–678. [Google Scholar]
- Li, X.; Lu, L.; Yang, W.; Cheng, G. Estimation of evapotranspiration in an arid region by remote sensing—A case study in the middle reaches of the Heihe River Basin. Int. J. Appl. Earth Observ. Geoinf. 2012, 17, 85–93. [Google Scholar] [CrossRef]
- Zhou, W.; Liu, G.; Pan, J.; Feng, X. Distribution of available soil water capacity in China. J. Geogr. Sci. 2005, 15, 3–12. [Google Scholar] [CrossRef]
- Li, Z.; Xu, Z.; Shao, Q.; Yang, J. Parameter estimation and uncertainty analysis of SWAT model in upper reaches of the Heihe river basin. Hydrol. Process. 2009, 23, 2744–2753. [Google Scholar] [CrossRef]
- Budyko, M.I. Climate and Life; Information Systems Division, National Agricultural Library: Beltsville, MD, USA; Washington, DC, USA, 1971. [Google Scholar]
- Zhang, L.; Dawes, W.; Walker, G. Response of mean annual evapotranspiration to vegetation changes at catchment scale. Water Resour. Res. 2001, 37, 701–708. [Google Scholar] [CrossRef]
- Gao, Z.; Deng, X. Analysis on spatial features of LUCC based on remote sensing and GIS in China. Chin. Geogr. Sci. 2002, 12, 107–113. [Google Scholar] [CrossRef]
- Pielke, R.; Adegoke, J.; Beltran-Przekurat, A.; Hiemstra, C.; Lin, J.; Nair, U.; Niyogi, D.; Nobis, T. An overview of regional land-use and land-cover impacts on rainfall. Tellus B 2007, 59, 587–601. [Google Scholar] [CrossRef]
© 2014 by the authors; licensee MDPI, Basel, Switzerland. This article is an open access article distributed under the terms and conditions of the Creative Commons Attribution license (http://creativecommons.org/licenses/by/4.0/).
Share and Cite
Geng, X.; Wang, X.; Yan, H.; Zhang, Q.; Jin, G. Land Use/Land Cover Change Induced Impacts on Water Supply Service in the Upper Reach of Heihe River Basin. Sustainability 2015, 7, 366-383. https://doi.org/10.3390/su7010366
Geng X, Wang X, Yan H, Zhang Q, Jin G. Land Use/Land Cover Change Induced Impacts on Water Supply Service in the Upper Reach of Heihe River Basin. Sustainability. 2015; 7(1):366-383. https://doi.org/10.3390/su7010366
Chicago/Turabian StyleGeng, Xiaoli, Xinsheng Wang, Haiming Yan, Qian Zhang, and Gui Jin. 2015. "Land Use/Land Cover Change Induced Impacts on Water Supply Service in the Upper Reach of Heihe River Basin" Sustainability 7, no. 1: 366-383. https://doi.org/10.3390/su7010366