Article

The Impact of Industrial Transformation on Water Use Efficiency in Northwest Region of China

1
China Center for Economic Studies, School of Economics, Fudan University, Shanghai 200433, China
2
State Key Laboratory of Water Environment Simulation, School of Environment, Beijing Normal University, Beijing 100875, China
3
Institute of Geographic and Natural Resources Research, Chinese Academy of Sciences, Beijing 100101, China
4
Center for Chinese Agricultural Policy, Chinese Academy of Sciences, Beijing 100101, China
*
Author to whom correspondence should be addressed.
These authors contributed equally to this work.
Sustainability 2015, 7(1), 56-74; https://doi.org/10.3390/su7010056
Submission received: 8 October 2014 / Accepted: 8 December 2014 / Published: 23 December 2014

Abstract

:
China has been stressing the needs of promoting regional sustainable development through industrial transformation. In the northwest region of China, which is faced with both urgent socioeconomic development and fragile ecological conditions, with water scarcity being one of the major characters, the relationship between industrial transformation and water use efficiency ought to be investigated. This paper conducted an empirical analysis of industry transformation’s impact on water use efficiency by using the Input-output analysis. First, we compiled an extended Input-output table with water use account; Second, the input-output analysis model was built based on the extended Input-output table; Then, a counterfactual experiment was performed to document the water use efficiency caused by industrial transformation; Finally, water use efficiency of different sectors in both northwest region of China as a whole and its five provinces were calculated. The results show that water use efficiency of northwest region of China is improved by optimizing industrial structure. Also, sectors with low water use efficiency but huge improvement potential were found out. Then policy implications for regional sustainable development and water resources management are provided at the end of the article.

1. Introduction

The optimization of the industrial structure and the transformation process directly influence the stability of national economic development [1,2,3,4]. Industrial transformation is the essential demand for economic prosperity, especially for less developed countries [5]. Here the term industrial transformation in this paper refers to the industrial structure adjustment. At the end of the twentieth century, western developed countries actively altered their national industrial structure, vigorously developed high technology industry to boost sustainable economic development [6]. Now under the background of economic globalization, the optimization and upgrading of the industrial structure of developed countries would lead irresistibly to worldwide industrial structure changes. Therefore, China should seize the opportunity to promote regional socioeconomic development via industrial transformation, especially in the Northwest region, which is characterized by scarcity of natural resources, fragility of ecological environment and lagged socioeconomic condition [7].
However, problems occur with this rapid economic growth, the industrial structure gradually shifts to high energy consuming industries, widening the gap between resources supply and demand [8,9]. Among them, the resources supply of land, water, energy, minerals and labor is in sharp conflict with the demand of economic development [10,11]. The resources supply cannot satisfy the current economic development [12,13]. Thus, in order to achieve sustainable development, ecological concerns, especially, for water use, must be taken into account during the industrial transformation process.
Researchers believed that socioeconomic development might affect water resources and water use [14,15]. The issue of water scarcity under conflicting demands for water and potential solutions to sustain both ecological and economic development under future climate and global changes is an important issue in river basin management [12,16,17,18]. Therefore, in this study we aim to analyze water use efficiency change brought by industrial transformation to provide reference for river basin water resources management. And in this research we use the marginal gross output value (thousand CNY/m3) produced by one more cubic meter’s water consumption in each sector to represent the water use efficiency.
In order to build the connection between the production of goods and exchange of materials between economic sectors, many researchers introduce Input-output (I-O) tables into their studies. The I-O table method was first developed by Leontief in the 1930s, which is a top-down economic technique based on sectoral monetary transaction data to account for the complex interdependencies burdens associated with the consumption of products [19]. After that, the I-O table method was extended and applied in various kinds of research areas to analyze and solve social economic problems of utilization of resources and environment for sustainable development [20,21,22]. Different with other efficiency assessment models, such as DEA (Data Envelopment Analysis) model [23,24,25], the I-O table method could clearly describe the energy flow among different sectors, especially for water consumption.
To evaluate the water use efficiency changes, we adopt the I-O table of the year 2002 and 2007 to generate the water consumption index inventory. In this way the water account is added to the I-O table to quantitatively analyze the relationship between industrial transformation and water use efficiency. Then we aimed to seek out the low efficiency and come up with the countermeasure to increase the water use efficiency. In this study, we pay more attention to the secondary industry sector by refining the secondary industry sector because of the different characteristics of the three sectors.
The rationale behind the choice of the study area lies in that the northwest region of China, which has long been characterized by water shortage, faces severe conflicts between water supply decrease and the demand increases under the increasing economic construction for urbanization. The economic development in arid regions is circumscribed by water resources [26]. In this status quo, it is necessary to understand the water resources allocation in each industry during the regional economic development and industrial transformation. And in order to facilitate the socioeconomic analysis, we defined the region with the administrative boundaries and selected the five provinces, including Shanxi, Gansu, Qinghai, Ningxia and Xinjiang, as the study area.
In the following part of this paper, we first introduce materials and methods, which cover the study area with the focus on the industrial structure, data used in this study, the application of I-O analysis, and the counterfactual experiment for probing the relationship between industrial transformation and water use efficiency. Then the results are presented to give the main research findings of the I-O analysis. Subsequently, discussions were made based on the results. The conclusion and recommendations are reached to conclude this study and provide potential policy references.

2. Materials and Methods

2.1. Study Area

The northwest region is the arid and semi-arid region in the inland China, which accounts for 32.2% of the gross area of China. This region is scarcely populated, has a lack of water, and fragile in ecological environment. However, the abundance of land, energy and mineral resources make this region one of China’s most important reserve bases to guarantee sustained and stable development of the national economy. The structure of the three major industries is quite similar in the five provinces in the northwest region. Because of China’s western development program, the economic structure of the five provinces present a similar trend that agricultural labor occupies the majority of the work force, industry accounts for a larger proportion of output value and service industry is gradually expanding.
In recent years, the growth rate of the gross domestic product (GDP) in this region is higher than the average level of the whole country, while the gap with the eastern coastal area is still enlarging. The economic development should not solely rely on government input and preferential policies, instead the economy efficiency and competitive advantage of industry sector should be utilized. Therefore, the optimization and upgrading of industrial structure are crucial for this region.

2.2. Data

In our study two kinds of I-O tables are used, the regional ones and the provincial ones. We use the regional IO table of 2002 and 2007 to analyze the effect of water use efficiency change caused by industrial structural transformation in the whole northwest region of China, which are compiled by State Information Center [27]. The regional tables include 29 sectors, 1 is in agriculture, 24 of these are in industry, 1 in construction, 2 in transport and communication and warehousing industry, and 1 in other services. China is divided into eight regions based on geographic, agro-climate, and demographic characteristic and economic development levels, while the regionalization is consolidated with provincial-level administrative boundaries. Thus, published regional input-output tables are based on administrative regionalization. In order to analyze the water use efficiency among different provinces in the northeast region of China, we use provincial input-output tables of the five provinces of 2007 as well, which are compiled by the State Statistical Bureau of China [28]. Forty-two sectors are included in the provincial tables, and among these sectors, 1 is in agriculture, 24 are in industry, 1 in construction, 2 in transport and communication and warehousing industry, and 15 in other services.
Industrial water consumption in different sectors of the economy for the northwest region of China is needed in our study, we obtain the data from the China Economic Census Yearbook 2008 [29], which are categorized by provinces and compiled into 41 industries sectors. As to the industrial water consumption in agriculture and service sectors, they are not recorded in the China Economic Census Yearbook 2008, so we collected them from the Statistical Yearbook 2008 of the five provinces. As a result, we have the industrial water consumption of 43 sectors. We combine the 29-sector regional I-O tables with the 43-sector industrial water consumption, coming out with a 16-sector reclassified I-O table coupled with industrial water consumption for the sake of data availability and consistency, which includes 1 agriculture sector, 14 industrial sectors and 1 service sector considering that we focus more on the secondary industry (Table 1 Code). Similarly, we combine the 42-sector provincial I-O tables with the 43-sector industrial water consumption into a 26-sector reclassified I-O table coupled with industrial water consumption on the basis of the 16-sector reclassified I-O tables we previously made (Table 1 Subcode). The water price of the northwest region of China is also needed in order to analyze the water use efficiency, it is collected from the China Water Net [30], which includes monthly water price in each city of the five provinces in 2007. Given the data structure of I-O tables and industrial water consumption, we calculate the annual mean water price of the five provinces as the water price in the study (Table 2).
Table 1. Industrial water consumption in different sectors of the economy for the northwest region of China in 2007 (in million cubic meters (106 m3)).
NameAbbreviationShaanxiGansuQinghaiNingxiaXinjiangNorthwest
Primary IndustryPrimIndu555198532050648047,84471,778
Coal extraction & washingCoalExtWash24.122.281.1526.9216.1590.6
Petroleum and gas extractionPetrGasExt69.7213.2719.490.27333.93436.68
Metal extractionMetaExt17.058.476.520.0311.9243.99
Non-metal extractionNonmExt0.590.461.5504.667.26
Food, beverages & tobaccoFoodBeveToba33.339.384.048.5939.49124.8
TextileTexti13.841.890.240.699.1925.85
Leather products & apparelLeatProAppa0.20.970.030.091.022.31
Wood products & furnitureWoodProFurn0.130.200.040.530.9
Paper, paper products & printingPapeProPrin32.5210.20.1560.4816.62119.97
Petroleum, coking & nuclear fuel productsPetCokNucPro26.5357.382.38.5160.19154.91
Industrial chemicalsInduChem105.4976.4640.8346.9119.48389.16
Non-metallic mineral productsNonmMinePro17.0421.022.454.5316.5361.57
Metal smelting & rolling productsMetaSmeRolPro48.64162.0433.2321.5258.41323.84
Metal productsMetaPro1.730.810.252.061.065.91
Machinery and equipmentMachEqui21.037.442.554.30.8836.2
Transport equipmentTranEqui22.823.910.010.010.2727.02
Electric Equipment and MachineryEleEquMac6.31.730.041.190.559.81
Communication equipment, computers & other electronic equipmentCommEquComEqu16.162.09002.5420.79
Instrumentation & cultural office machinery manufacturingInstCultManu1.280.070.040.390.011.79
Handicrafts and other manufacturingHandOthManu1.1438.790.2600.0140.2
Waste recyclingWastRec0.160.130000.29
Electricity and heat production and supply industryEleHeaProSup136.65207.638.9481.94555.93991.09
Water and gas production and supply industryWatGasProSup0.20.8600.070.21.33
ConstructionConstru0.8367.34472.9983.76170.55795.47
Tertiary industryTertIndu14341057.46341267.91623262.36
Notes: (a) Data source is China Economic Census Yearbook 2008 [29] with some calculation; (b) We only illustrate the industry water consumption of 2007 in accordance with the counterfactual experiment introduced in the Section 2.4. A counterfactual experiment part below.
Table 2. Water price of northwest region of China in 2007 (CNY/m3) (in 2007 CNY).
Primary IndustrySecondary IndustryTertiary Industry
Shaanxi0.12.62.6
Gansu0.11.751.75
Qinghai0.11.381.38
Ningxia0.12.12.1
Xinjiang0.11.571.57
Mean for Northwest of China0.11.881.88
Notes: (a) Data source 1, the water price of primary industry, come from Xiangzheng Deng et al. [31]; (b) Data source 2, the water price of secondary industry and tertiary industry, come from the China Water Net [30] with certain calculation; (c) We only illustrate the water price in 2007 here as there is little variation of water price from 2002 to 2007.

2.3. I-O Table Analysis

I-O analysis is a kind economic quantitative analysis method, which synthetically and systematically analyzes the quantitative dependence relationship among each national economy sector and each process of reproduction, by compiling I-O table and establishing relevant I-O table analysis model under the guidance of economic theory [32]. It is an important analysis tool for complex associations, which combines economics and mathematics on the basis of Computable General Equilibrium (CGE) theory, absorbing the economic activities’ correlation idea of CGE and the idea of mathematics to describe the correlation by algebraic simultaneous equations.
There are two kinds of important equilibrium relationship in an I-O table (Table 3). Firstly, the sum of each row is equal to the sum of each column, which means that the amount of the production produced by each sectors and allocated into other sectors of national economy are equivalent (the import and export is irrespective), in other words, the value and use value of the production produced by each sector are equal. Meanwhile, the sum of the first quadrant and the second quadrant are equal to the sum of the first quadrant and the third quadrant, which means the amount of production and the amount of allocation are equivalent in the whole society. Secondly, the sum of the second quadrant is equal to the sum of the third quadrant, which means that the national income that society created is equal to the one that the society final used in a period.
Table 3. Fundamental forms of I-O table.
Intermediate useFinal demandGross output
12n
Intermediate input1
2XijYiXi
The first quadrantThe second quadrant
n
Value addedNjThe fourth quadrant
The third quadrant
Total inputXj
In order to combine the economic value and the resource data within a consistent methodological framework, we extend the I-O tables by a set of water accounting scheme that represents industrial water consumption for each sector (Table 4). The row of the enlarged I-O tables is the same as the traditional one consists of intermediate product, final use, and gross output. While the line of the enlarged I-O table, which is also the input part, includes the industrial water consumption account and the traditional part that consists of the consumption of the intermediate product and the input of initial production factors. As, is mentioned before, the industrial water consumption account is embedded into tables with the categories of industrial sectors. In addition, the industrial water consumption account is in physical unit and monetary unit, respectively, for the sake of different analysis.
Among the enlarged I-O table, Xij represents the consumption value of i industry sector, which is consumed by j industry sector; Kj represents the industrial water consumption of j industry sector; Nj means the newly-increased value, including labor payment and social net income produced during the producing of j product by i industry sector; Yi means the final product value of i industry sector; Xj represents the gross output value of j industry sector; Zj means the total input value during the producing of j industry sector; Ri represents the gross industrial water consumption of the final demand field; Qi represents the gross industrial water consumption of the gross output of each industry sector.
Table 4. A schematic presentation of the extended I-O table.
Sectors of the economyFinal demandGross output
Sectors of the economyXijYiXj
Added valueNj
Total inputZj
Industrial water consumptionKjRiQi
On the basis of enlarged I-O tables, we need to calculate four kinds of coefficient to build our I-O analysis to analyze the water use efficiency, the direct consumption coefficient, the full demand coefficient, the influence coefficient and the response coefficient.
The direct consumption coefficient is calculated by the following formula:
a i j = x i j X j ( i , j = 1 , 2 , n )
While the direct consumption coefficient matrix is expressed as:
A = [ a 11 a 12 a 1 n a 21 a 22 a 2 n a n 1 a n 2 a n n ]
Equation (3) establishes the connection between production and gross output:
j = 1 n a i j X j + y i = X i ( i = 1 , 2 , , n )
Then we fit direct consumption coefficient in Equation (3), and express (3) in matrix form, we get:
A X + Y = X
Therefore, Equation (4) can be written as:
Y = ( I A ) X
where I is the unit matrix, and (I A) is the so-called Leontief multiplier matrix.
Further deformation of Equation (5), we get the fowling equation:
X = ( I A ) 1 Y
where (I − A)−1 is the full demand coefficient matrix (B matrix), which means the gross demand value of gross output from the unit of final production, it can be expressed as:
B = [ b 11 b 12 b 1 n b 21 b 22 b 2 n b n 1 b n 2 b n n ]
The influence coefficient is defined as follow:
r j = i = 1 n b ¯ i j 1 n j = 1 n i = 1 n b ¯ i j   ( j = 1 , 2 , , n )
where i = 1 n b ¯ i j (j = 1, 2, …, n) represents the influence of j sector, which means the demand for the gross output of the national economic sectors from j industry sector per increase of the unit of final output. And 1 n j = 1 n i = 1 n b ¯ i j   (j = 1, 2, …, n) means the social average influence. The greater the value of rj, the stronger influence of j industry sector holds. If rj = 1, then the influence of j industry sector is equal to the social average influence, which means the influence of j industry sector is neutral; If rj ˃ 1, then the influence of j industry sector is greater than the social average influence, which means the influence of j industry sector is promotion; If rj ˂ 1, then the influence of j industry sector is less than the social average influence, which means the influence of j industry sector is slack up.
Similarly, response coefficient is defined as follow:
s i = j = 1 n b ¯ i j 1 n i = 1 n j = 1 n b ¯ i j ( j = 1 , 2 , , n )
where, j = 1 n b ¯ i j ( i = 1 , 2 n )   represents the response of i industry sector, which means the increase output of i industry sector when the gross final output of the national economic sectors increase an unit. And 1 n i = 1 n j = 1 n b ¯ i j (j=1,2, …n) means the social average response. The more intermediate consumption value an industry sector can supply to other sectors, the greater value of the response it holds. If s i = 1, then the response of i industry sector is equal to the social average response, which means the response of i industry sector is neutral; If si ˃ 1, then the response of i industry sector is greater than the social average response, which means the response of i industry sector is a strong restriction; If si ˂ 1, then the response of i industry sector is less than the social average response, which means the response of i industry sector is weak restriction.
According to Table 4 and from the respective of production balance and industrial water consumption balance, we can get the balance equations of each industry sectors following:
j = 1 n X i j + Y i = X i , ( i = 1 , 2 , n )
j = 1 n X i j + N j = Z j , ( j = 1 , 2 , n )
X j = Z j
where, n is the number of sectors.
Here we fit direct consumption coefficient to the balance equations, we get the following equations:
j = 1 n a i j X i + Y i = X i , ( i = 1 , 2 , n )
i = 1 n a i j Z j + N j = Z j , ( j = 1 , 2 , , n )
Here we specify kj as the industrial water consumption coefficient of j industry sector, wj as the adjustment range of the value of j industry sector, which reflects the readjustment of the industrial structure. Assume that direct consumption coefficient is constant, if the value of j industry sector increase or decrease, it will inevitably lead to an increase or decrease of intermediate inputs, therefore cause an increase or decrease of gross output of the sector itself and other sectors. If Xj increase or decrease wj, then the change of gross output of the sectors caused will be:
Δ P j = i b i j X j w j
Here we assume that the industrial water consumption coefficient is constant, and we specify ΔEj as the increase or decrease of the industrial water consumption caused by the increase or decrease of the gross output of j industry sector (wj), then ΔEj can be calculated by the following equation:
Δ E j = i b i j X j k j w j
where, kj is the industrial water consumption coefficient of j industry sector, which means the industrial water consumption consumed per unit gross output of j industry sector, it can be calculated by:
k j = K j X j
where, kj is the water consumption of j sector.
Here we define the industrial water use efficiency of j industry sector caused by industrial transformation as the marginal gross output value produced by one more cubic meter’s water consumption of j industry sector. Therefore, the water use efficiency of j industry sector can be written as the following under the circumstance that the direct consumption coefficient and the industrial water consumption coefficient are constant:
E j = Δ E j Δ P j = i b i j X j w j i = 1 b i j X j k j w j
Meanwhile, we define the indirect promote coefficient of water resource in j industry sector as Mj, which represents the indirect promote capacity of water use to other sectors by j industry sector, it can written as following:
M j = k j   1 E j
where 1/Ej is the reciprocal of water use efficiency, called the total water use coefficient, which means the total water use value per gross output of j industry sector.
Above is the I-O analysis model of northwest region of China we built through I-O table with water consumption account, which we can use it to analyze the mutual influence between national economy increase and the water use efficiency of industry sectors, and to research the input-output relationship between the gross output and gross demand of the macro economy and the water use efficiency of industry sectors.

2.4. A Counterfactual Experiment

In particular, it is true that water use efficiency is also correlated with climate and other unobservable factors. Yes, factors like the climate will affect the water consumption amount in primary industry greatly. And it is obvious that water use efficiency of primary industry is quite large compared to other sectors. So what we really want to probe in this research is the relationship between industrial transformation and water use efficiency, especially on the industrial sectors. To make this point clear, we perform a simple counterfactual experiment to document the role of industrial transformation in accounting for water use efficiency. We ask what would have happened before industrial transformation (that is in 2002) if the climate factors were eliminated.
For before the industrial transformation in 2002, we replace the industrial water consumption in different sectors of the economy of the northwest region of China with the counterpart water use consumption after the industrial transformation in 2007. In this way, we got the counterfactual experiment before industrial transformation in 2002, and we regard the situation in 2007 as the actual experiment. To simplify the analysis and to make it more understandable, we use the situation in 2002 and 2007 instead of the counterfactual experiment and the actual experiment in the following analysis.

3. Results and Discussion

After building the I-O analysis model, we get the water use efficiency by industry sectors of the northwest region of China in 2002 and 2007 for analyzing the impact of water use efficiency caused by industrial structure transformation. Furthermore, in order to carry on the comparative analysis among the five provinces of northwest region of China, we also obtain the counterpart of results and analysis of the five provinces in 2007.

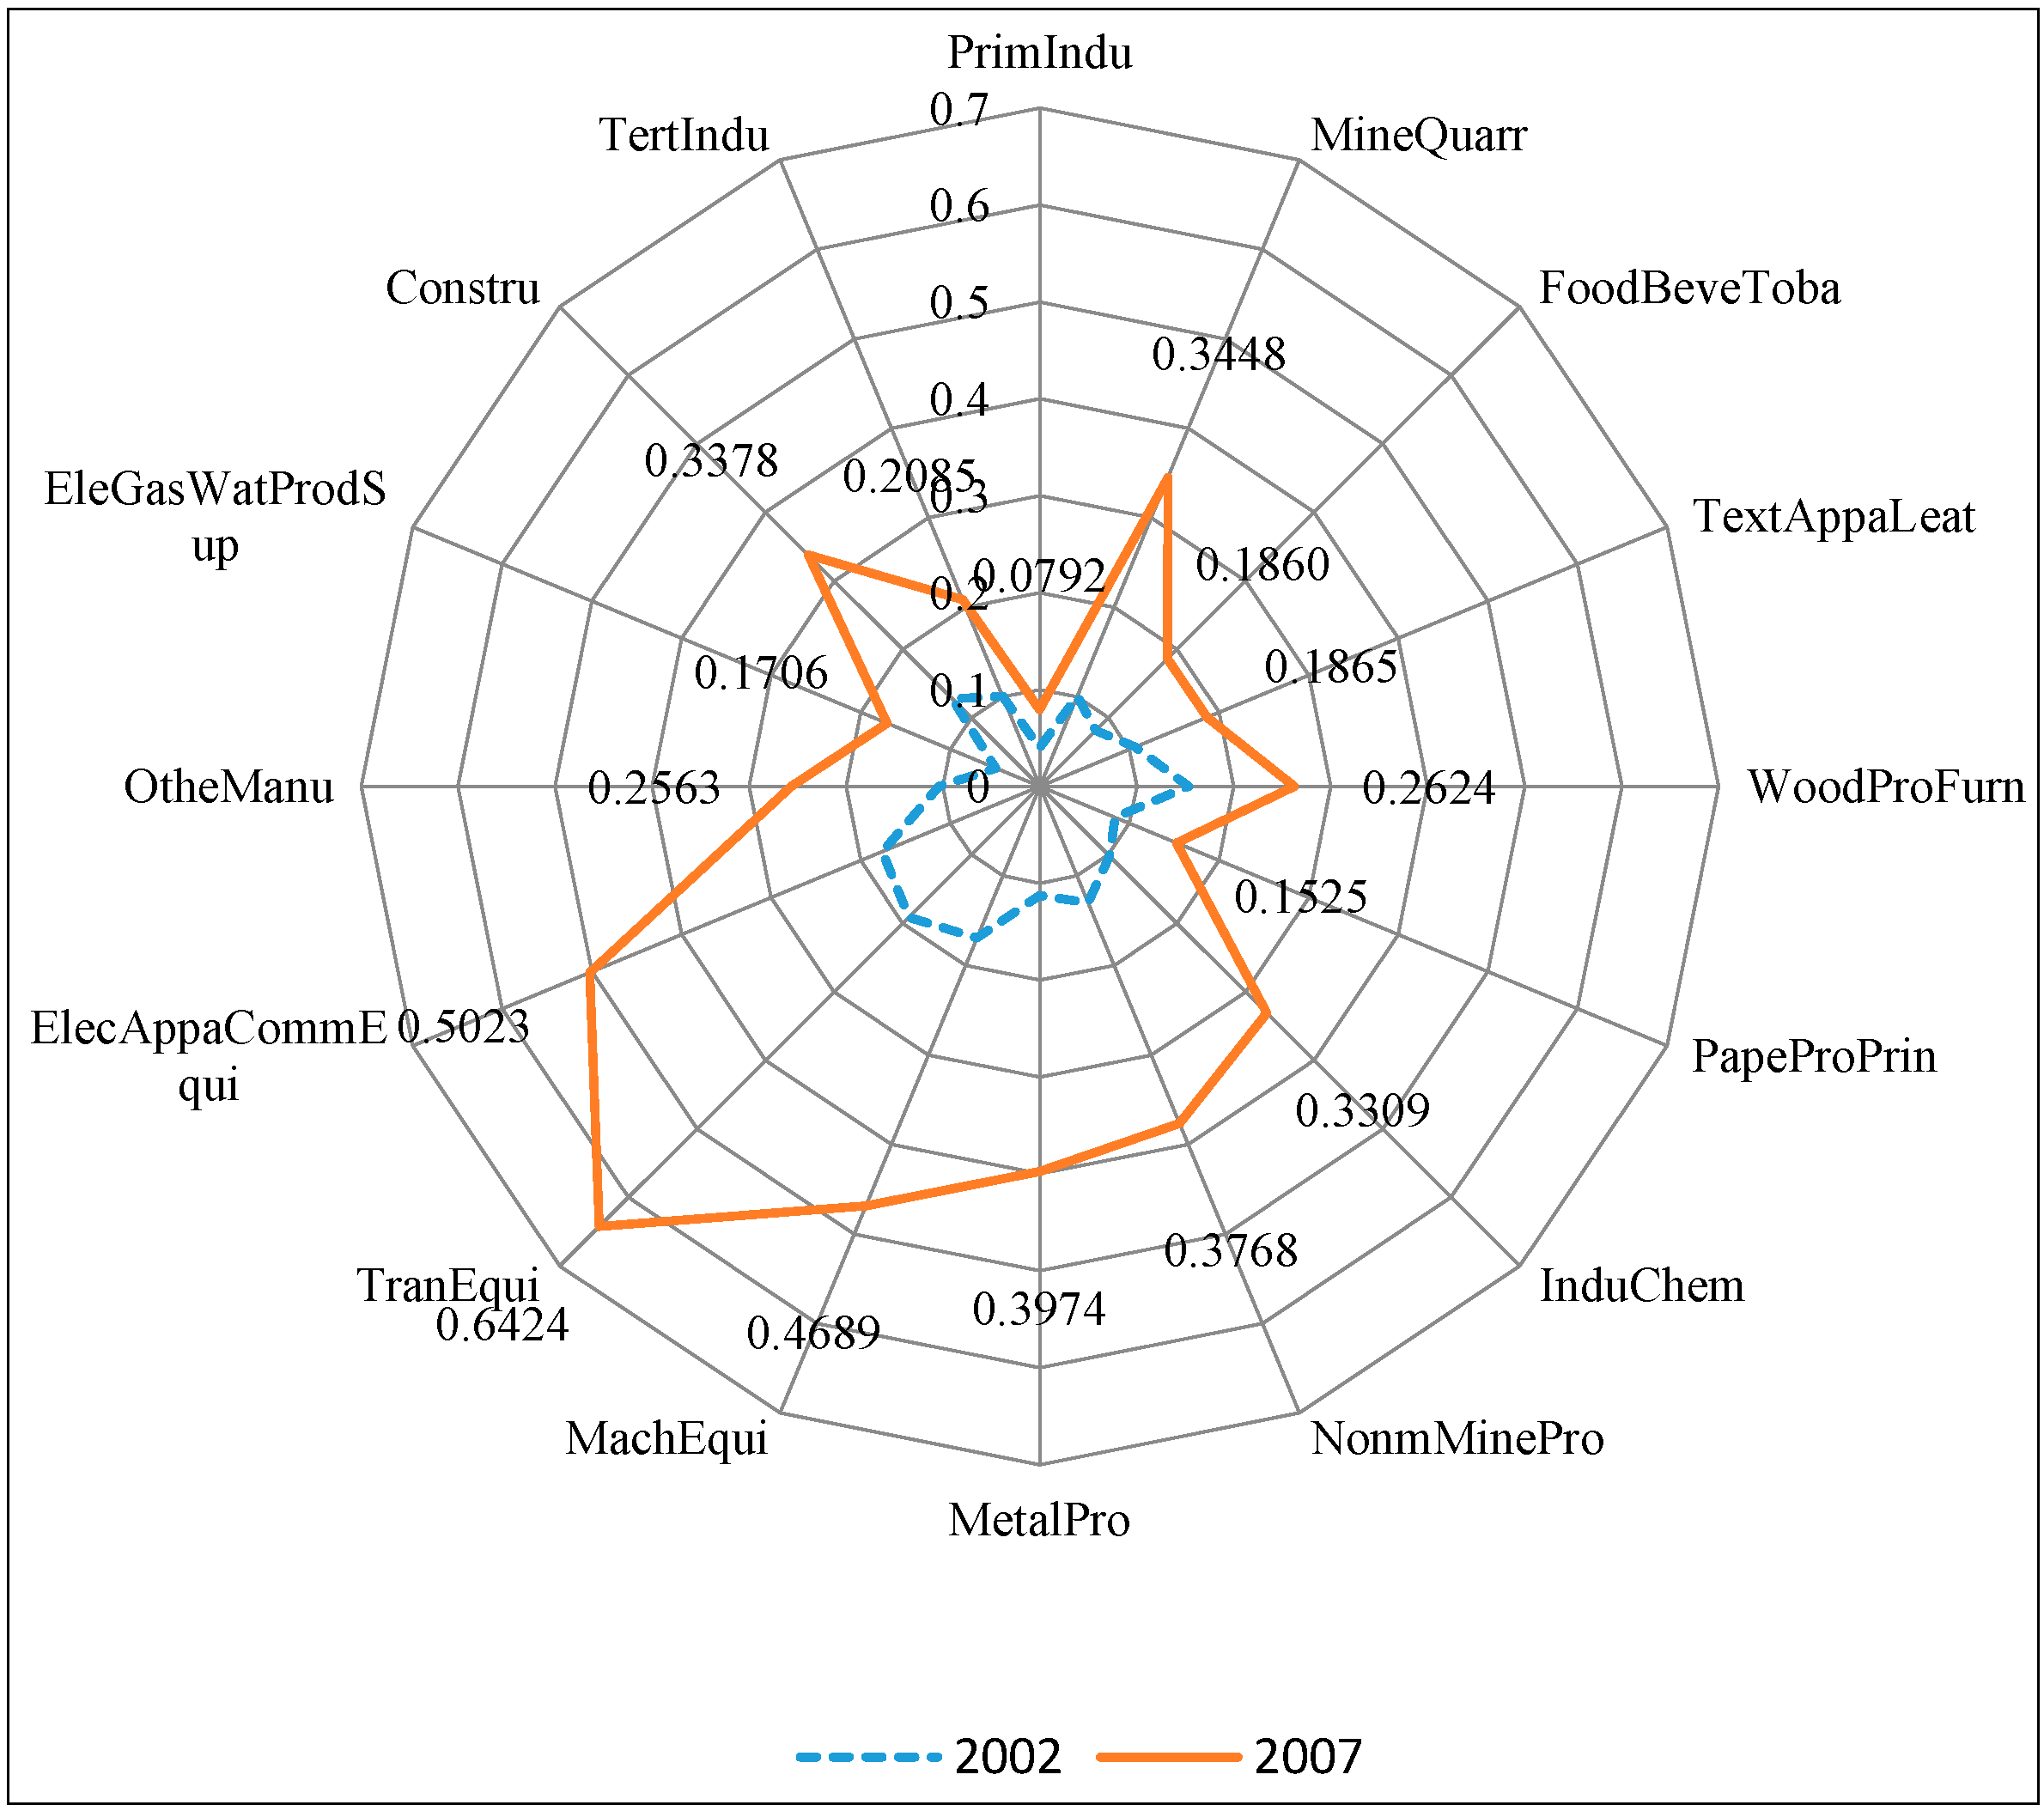
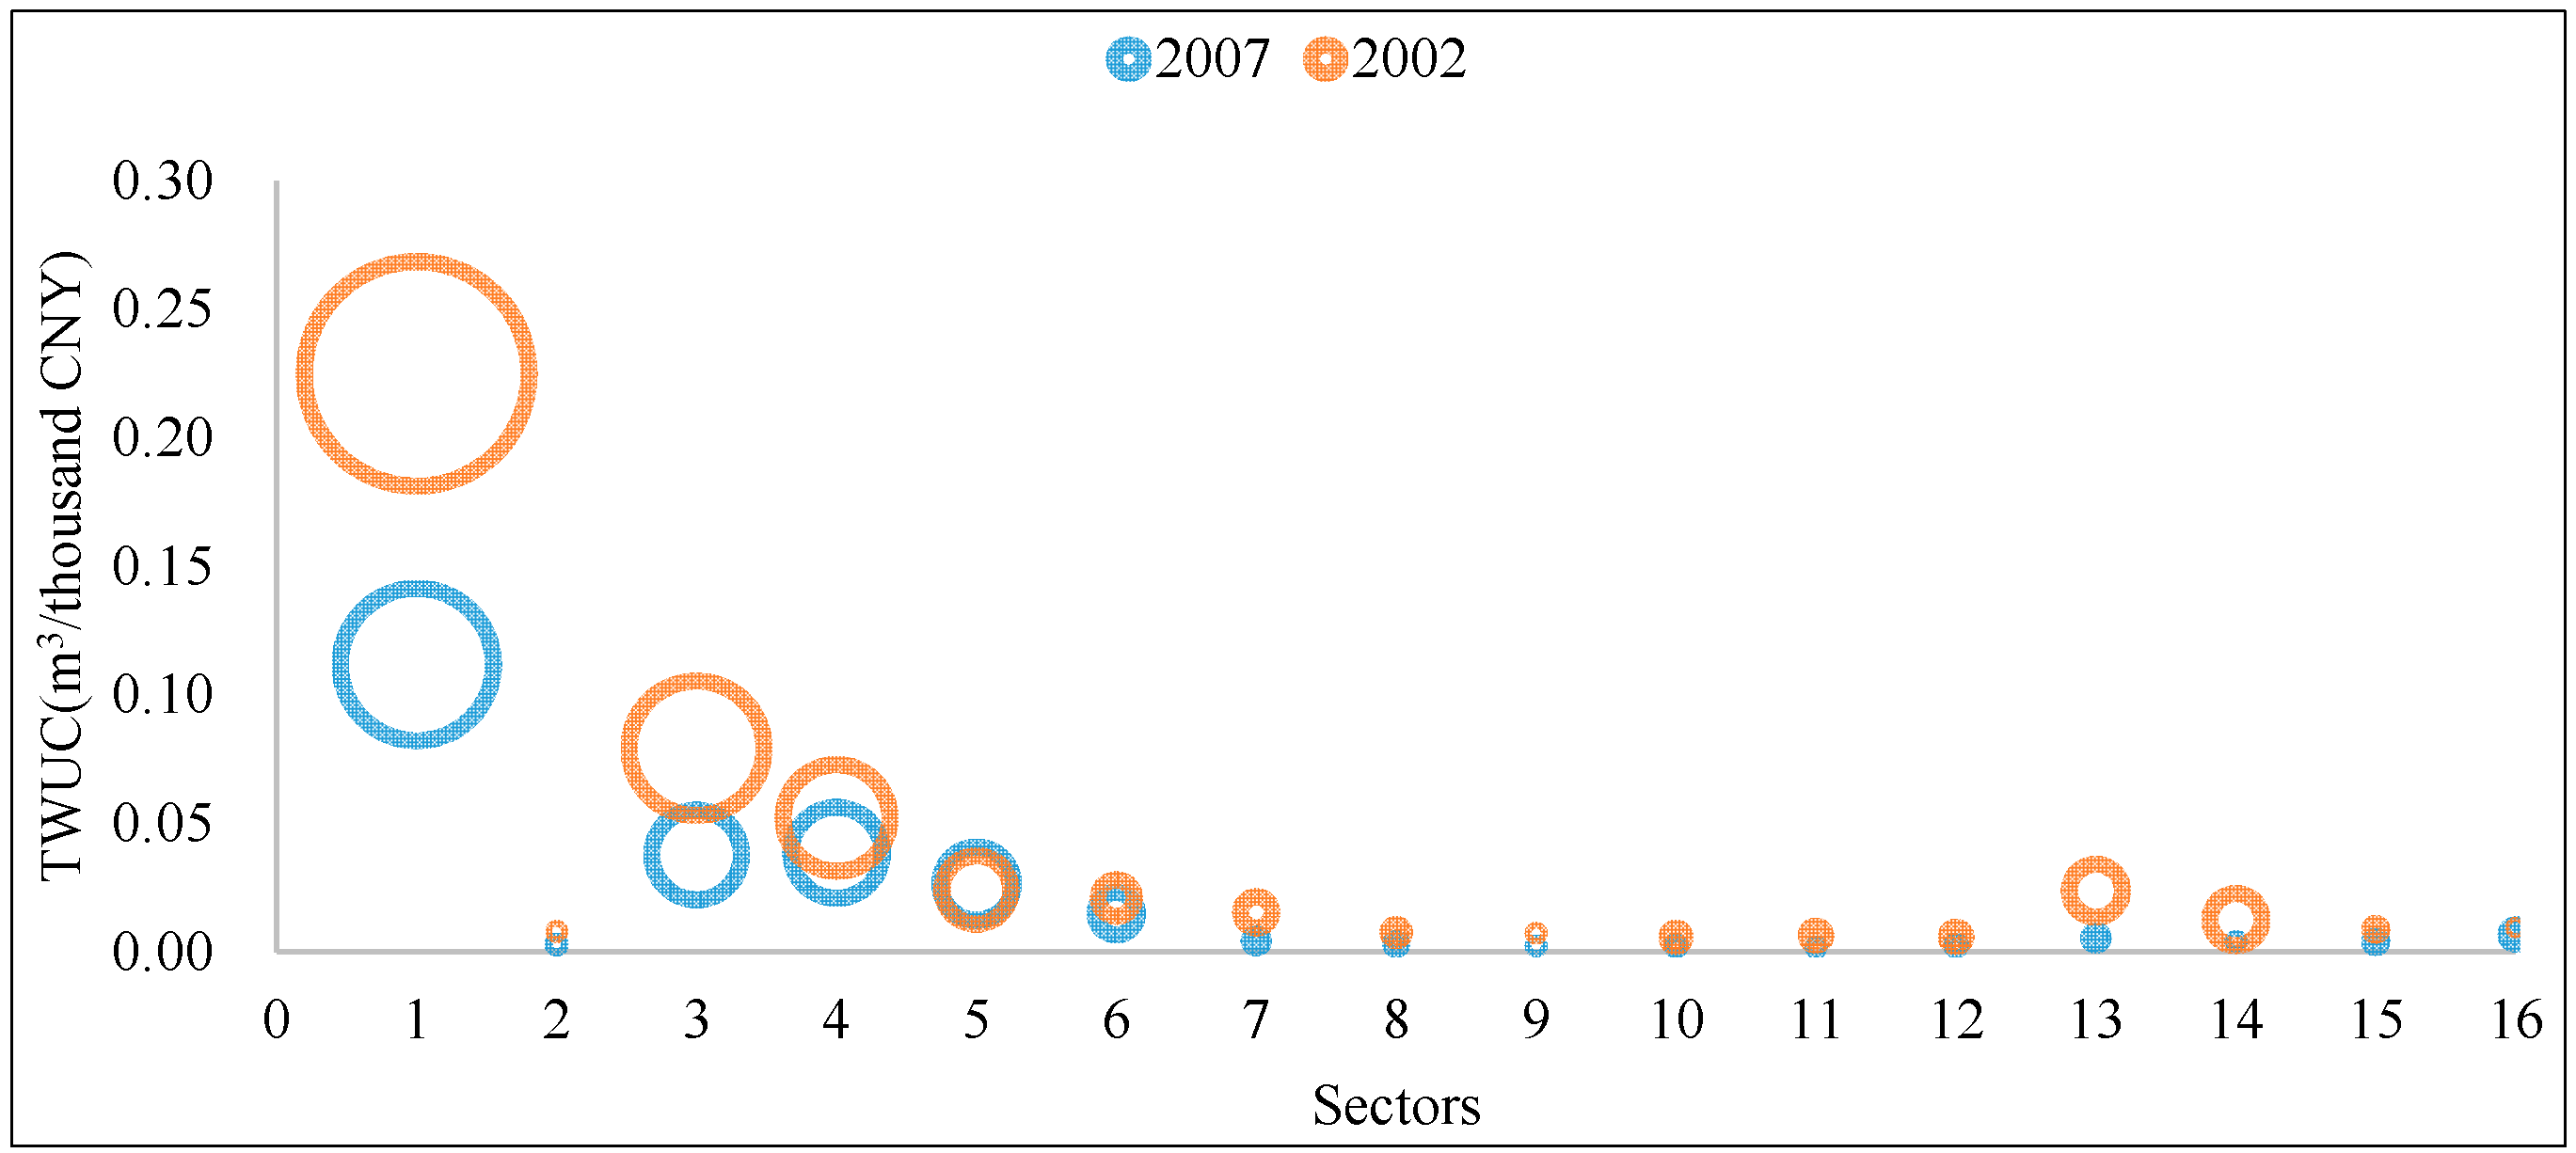
3.1. The Water Use Efficiency of the Northwest Region of China

Figure 1 presents the water use efficiency of 16 industry sectors of northwest region of China in 2002 and 2007. By water use efficiency here we mean the marginal gross output value (thousand CNY) produced by one more cubic meter's water consumption in each sector. From the picture, we can see that water use efficiency of the northwest region of China in 2007 is higher than the water efficiency in 2002 in every industry sector, which means the industrial structure transformation in the northwest region of China has got a positive impact on improving their industrial water use efficiency. However, the degree of impact is different in different industry sectors. Basically, the water use efficiency of primary industry is the lowest among the three industries, both in 2002 and 2007, and its improvement caused by industrial structure transformation is as apparent as the improvement in the secondary and tertiary industry. To some extent, this result is reasonable. It is well known that the primary industry costs plenty of water in irrigation and other procedures of product production, while its gross output value is much lower compared with the other two industries. Nonetheless, in order to maintain the industrial structure balance among the three industries, we could neither reduce the proportion of the primary industry simply arbitrarily, nor count on the same water use efficiency as the other two industries. Consequently, in this study, we focus more on the analysis of the impact on water use efficiency of the secondary industry and the tertiary industry caused by industrial structure transformation. This is also one of the reasons we classified the industry sectors in that way.
Figure 1. Water use efficiency of northwest region of China in 2002 and 2007 (in 2007 thousand CNY/m3).
Sustainability 07 00056 g001
Figure 1 also shows that the rank of water use efficiency of industry sectors does not have a remarkable difference between 2002 and 2007. As is shown in the input-output tables of 2002 and 2007, the percentage of the primary industry and the tertiary industry of the northwest region of China is decreased while the counterpart of the secondary industry is increased from 2002 to 2007. The consequence of this kind of industrial structure transformation is the overall improvement of the water use efficiency, which is shown in Figure 1. For further analysis of the specific effect of different sectors in the secondary industry on water use efficiency, we make a rank of water use efficiency by industrial sectors both in 2002 and in 2007, which is also represented in Figure 1. The transport equipment, electric apparatus and communication equipment, and the machinery and equipment sectors are the top three sectors among the 16 sectors in water use efficiency rank both in 2002 and 2007, which means that these three sectors have relatively higher water use efficiency in the northwest region of China. On the contrary, the bottom three sectors for water use efficiency are electricity; gas and water production; and supply industry, food, beverages and tobacco and electricity, gas and water production and supply industry both in 2002 and 2007 but with a little variation, if we do not consider the lowest water use efficiency industry sector—the primary industry. The water use efficiency of the tertiary industry of the northwest region of China is a little bit low both in 2002 and 2007, which ranks the fourth from bottom and the fifth from bottom among the 16 sectors in 2002 and 2007, respectively. The proportion of some sectors with high water use efficiency increased among the five years, which brought the promotion of the water use efficiency of the whole industry. For example, compared with 2002, the percentage of metal products sector rises 3.85% in 2007, and the sector is in the fourth place among the water use efficiency rank, which contributes to the improvement of the whole sectors’ water use efficiency to some extent.
In the actual process of production, the water resource consumption of a sector should consist of the direct water use amount and the indirect water use amount. The direct water use amount is the direct consumption of water resource in the production process, while the indirect water use amount means the consumption of water resource provided by other sectors for the need of the sector’s production. For example, the direct water use amount of the primary industry is the consumption of water resource in the process of agricultural products production, mainly including farmland irrigation and the water consumption of freshwater agriculture, etc. While the indirect water use amount of the primary industry is highly correlated to other sectors, such as industrial chemicals, for example, agriculture production needs fertilizer, pesticide and other chemistry products produced, which are produced by industrial chemicals, so the consumption of water resource consumed for the products used by primary industry by industrial chemicals belongs to the indirect water use amount of the primary industry. Consequently, the indirect water use amount of an industry sector means the indirect promotion of water resource by the sector, which could be quantified by the indirect promote coefficient of water resource.
By calculating the indirect promote coefficient of water resource in each sector, we found some sectors had high indirect promote coefficients of water resource, even though their direct water use amount are little. Through the analysis of the indirect promote coefficient of water resource and the water use efficiency coefficient we could identify the most noteworthy sectors, which promote the consumption of water resource. Figure 2 shows the total industrial water use coefficient and the indirect promote coefficient of water resource by sectors of the northwest of China in 2002 and 2007. The cross axle represents the 16 sectors, the vertical axis represents the total industrial water use coefficient, while the size of the bubble represent the indirect promote coefficient. Data in Figure 2 show that the primary industry not only has the most amount of direct water consumption, but also has the most promote in water resource to other sectors. Among the secondary industry, food, beverages and tobacco, textiles, apparel and leather and wood products and furniture are the top three sectors both in direct water use and the indirect promote of water resource to other sectors. Besides, other manufacturing and electricity and gas and water production and supply industry has less water consumption than other sectors, but with large indirect promote in water resource to other sectors, which should also be paid attention.
Figure 2. The total industrial water use coefficient and the indirect promote coefficient of water resource by sectors of northwest of China in 2002 and 2007 (m3/ in 2007 thousand CNY). TWUC stands for the total industrial water use coefficient.
Sustainability 07 00056 g002

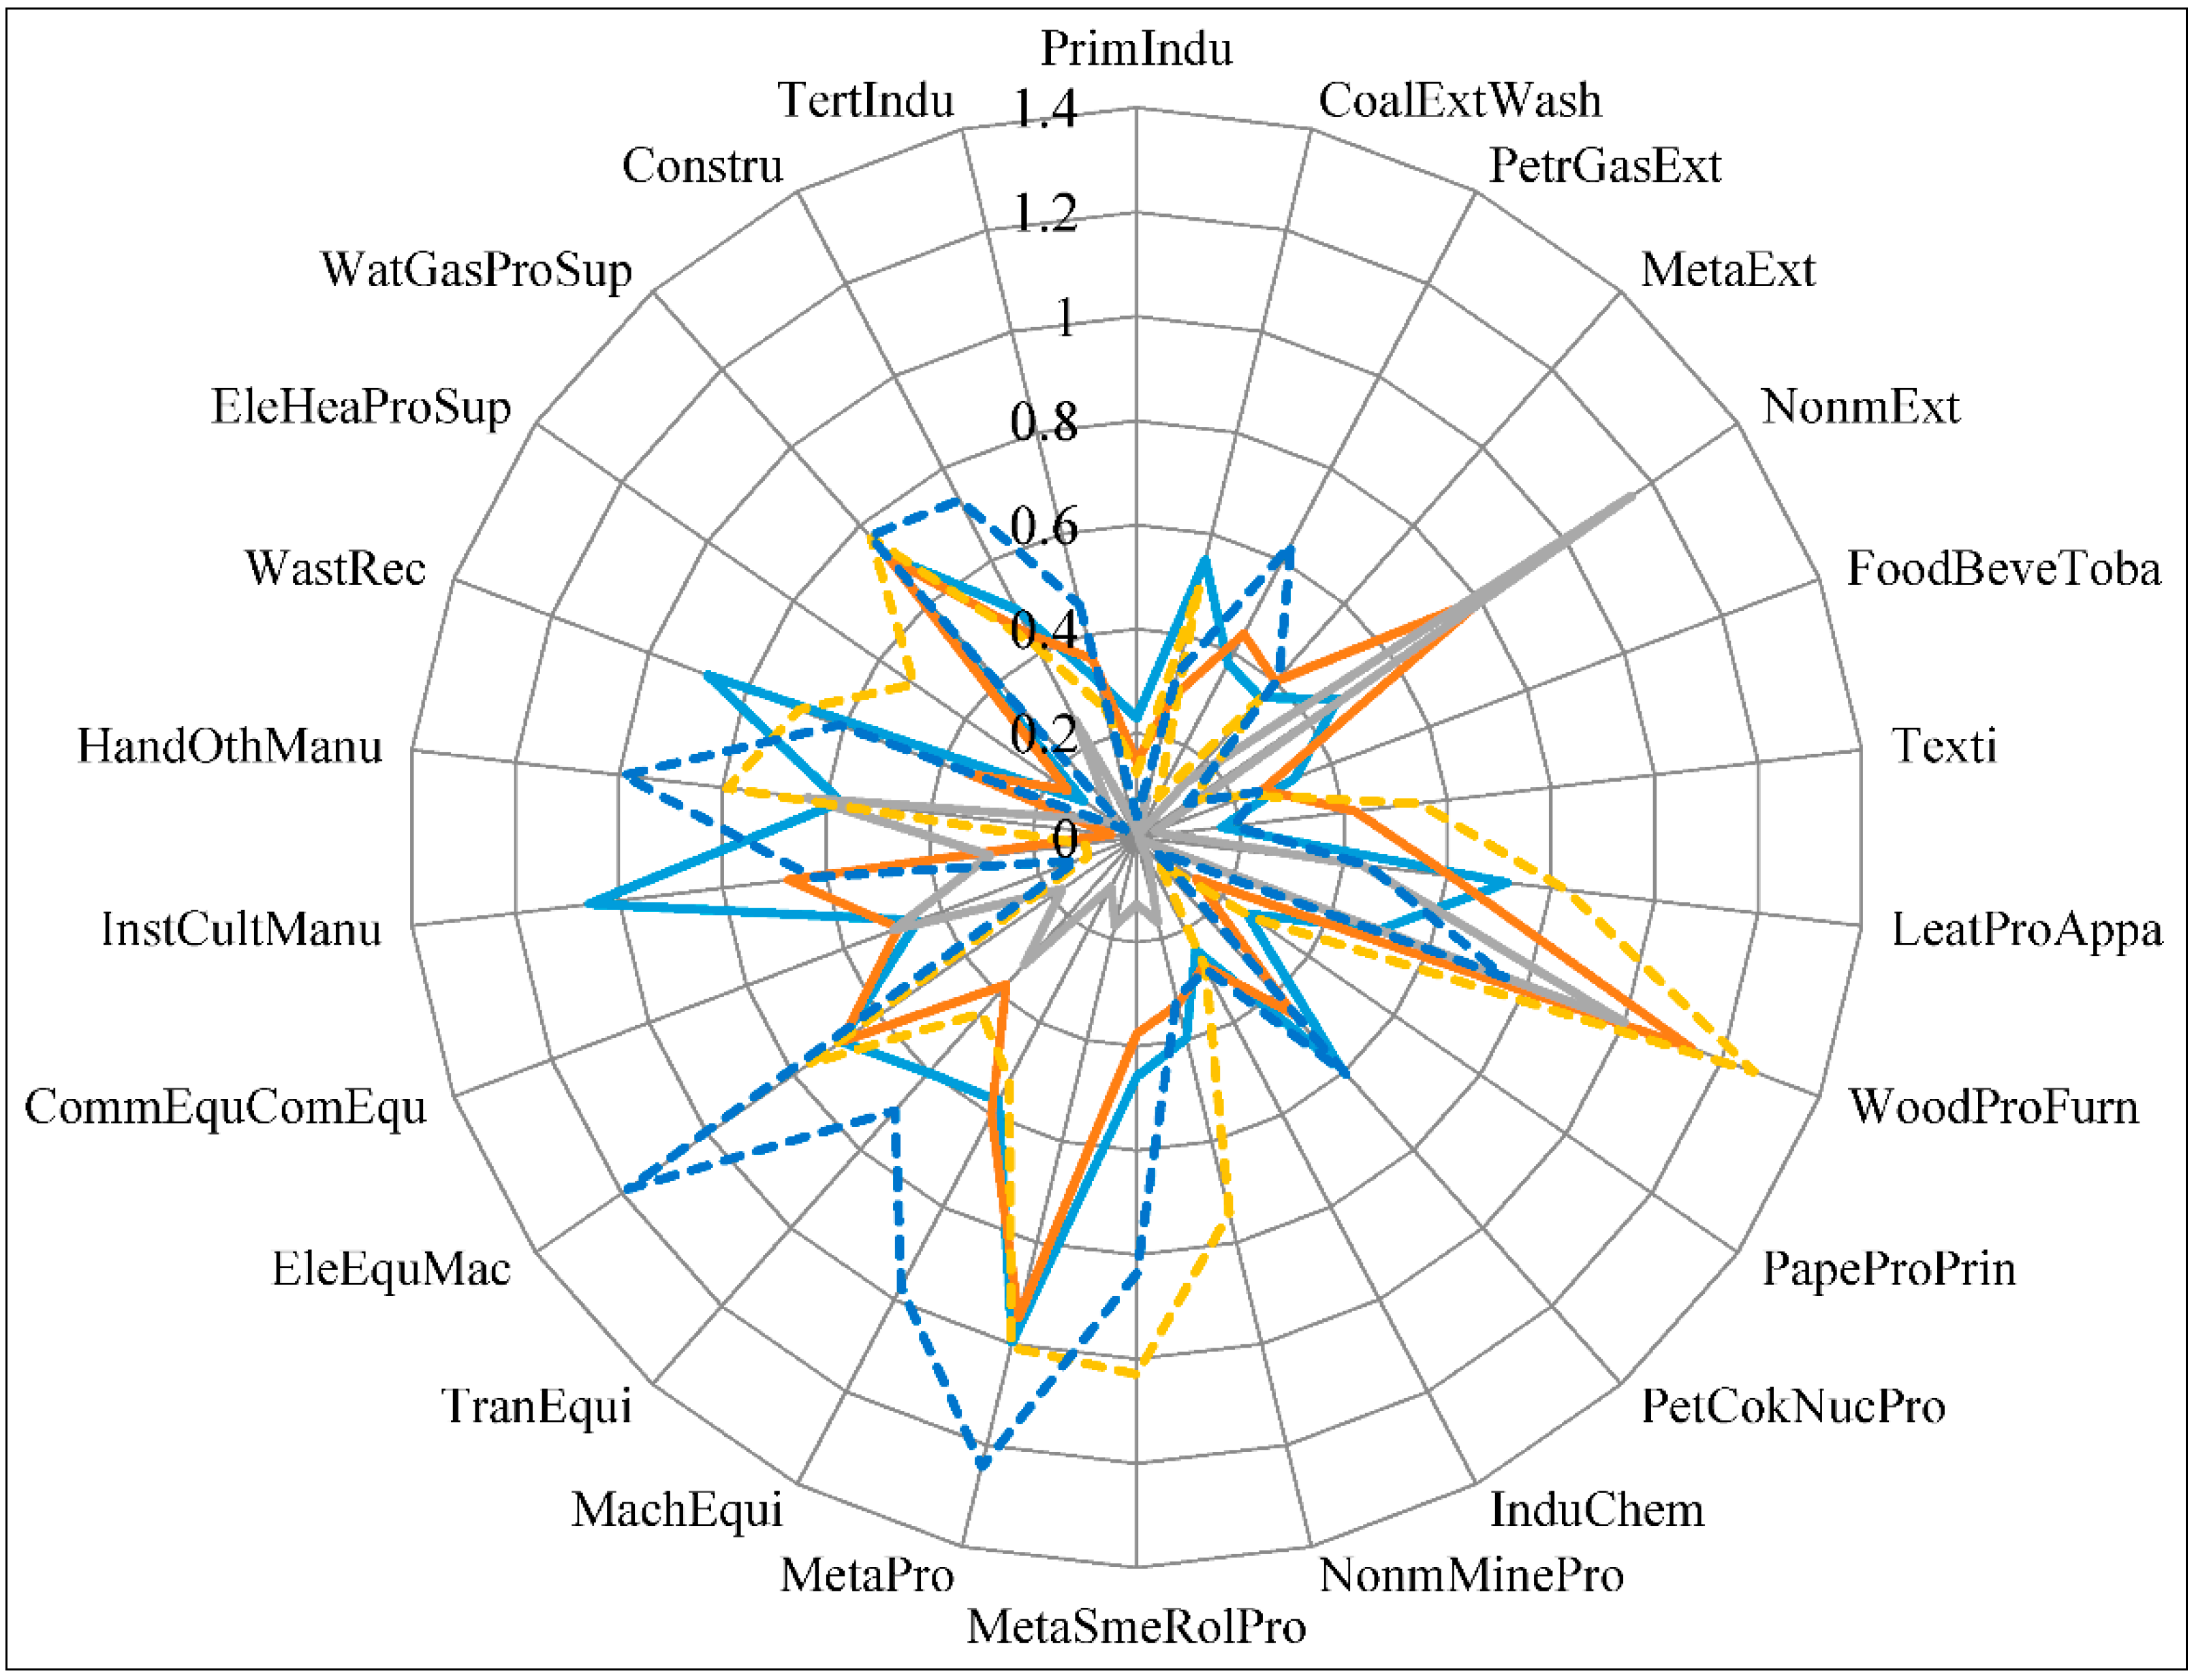
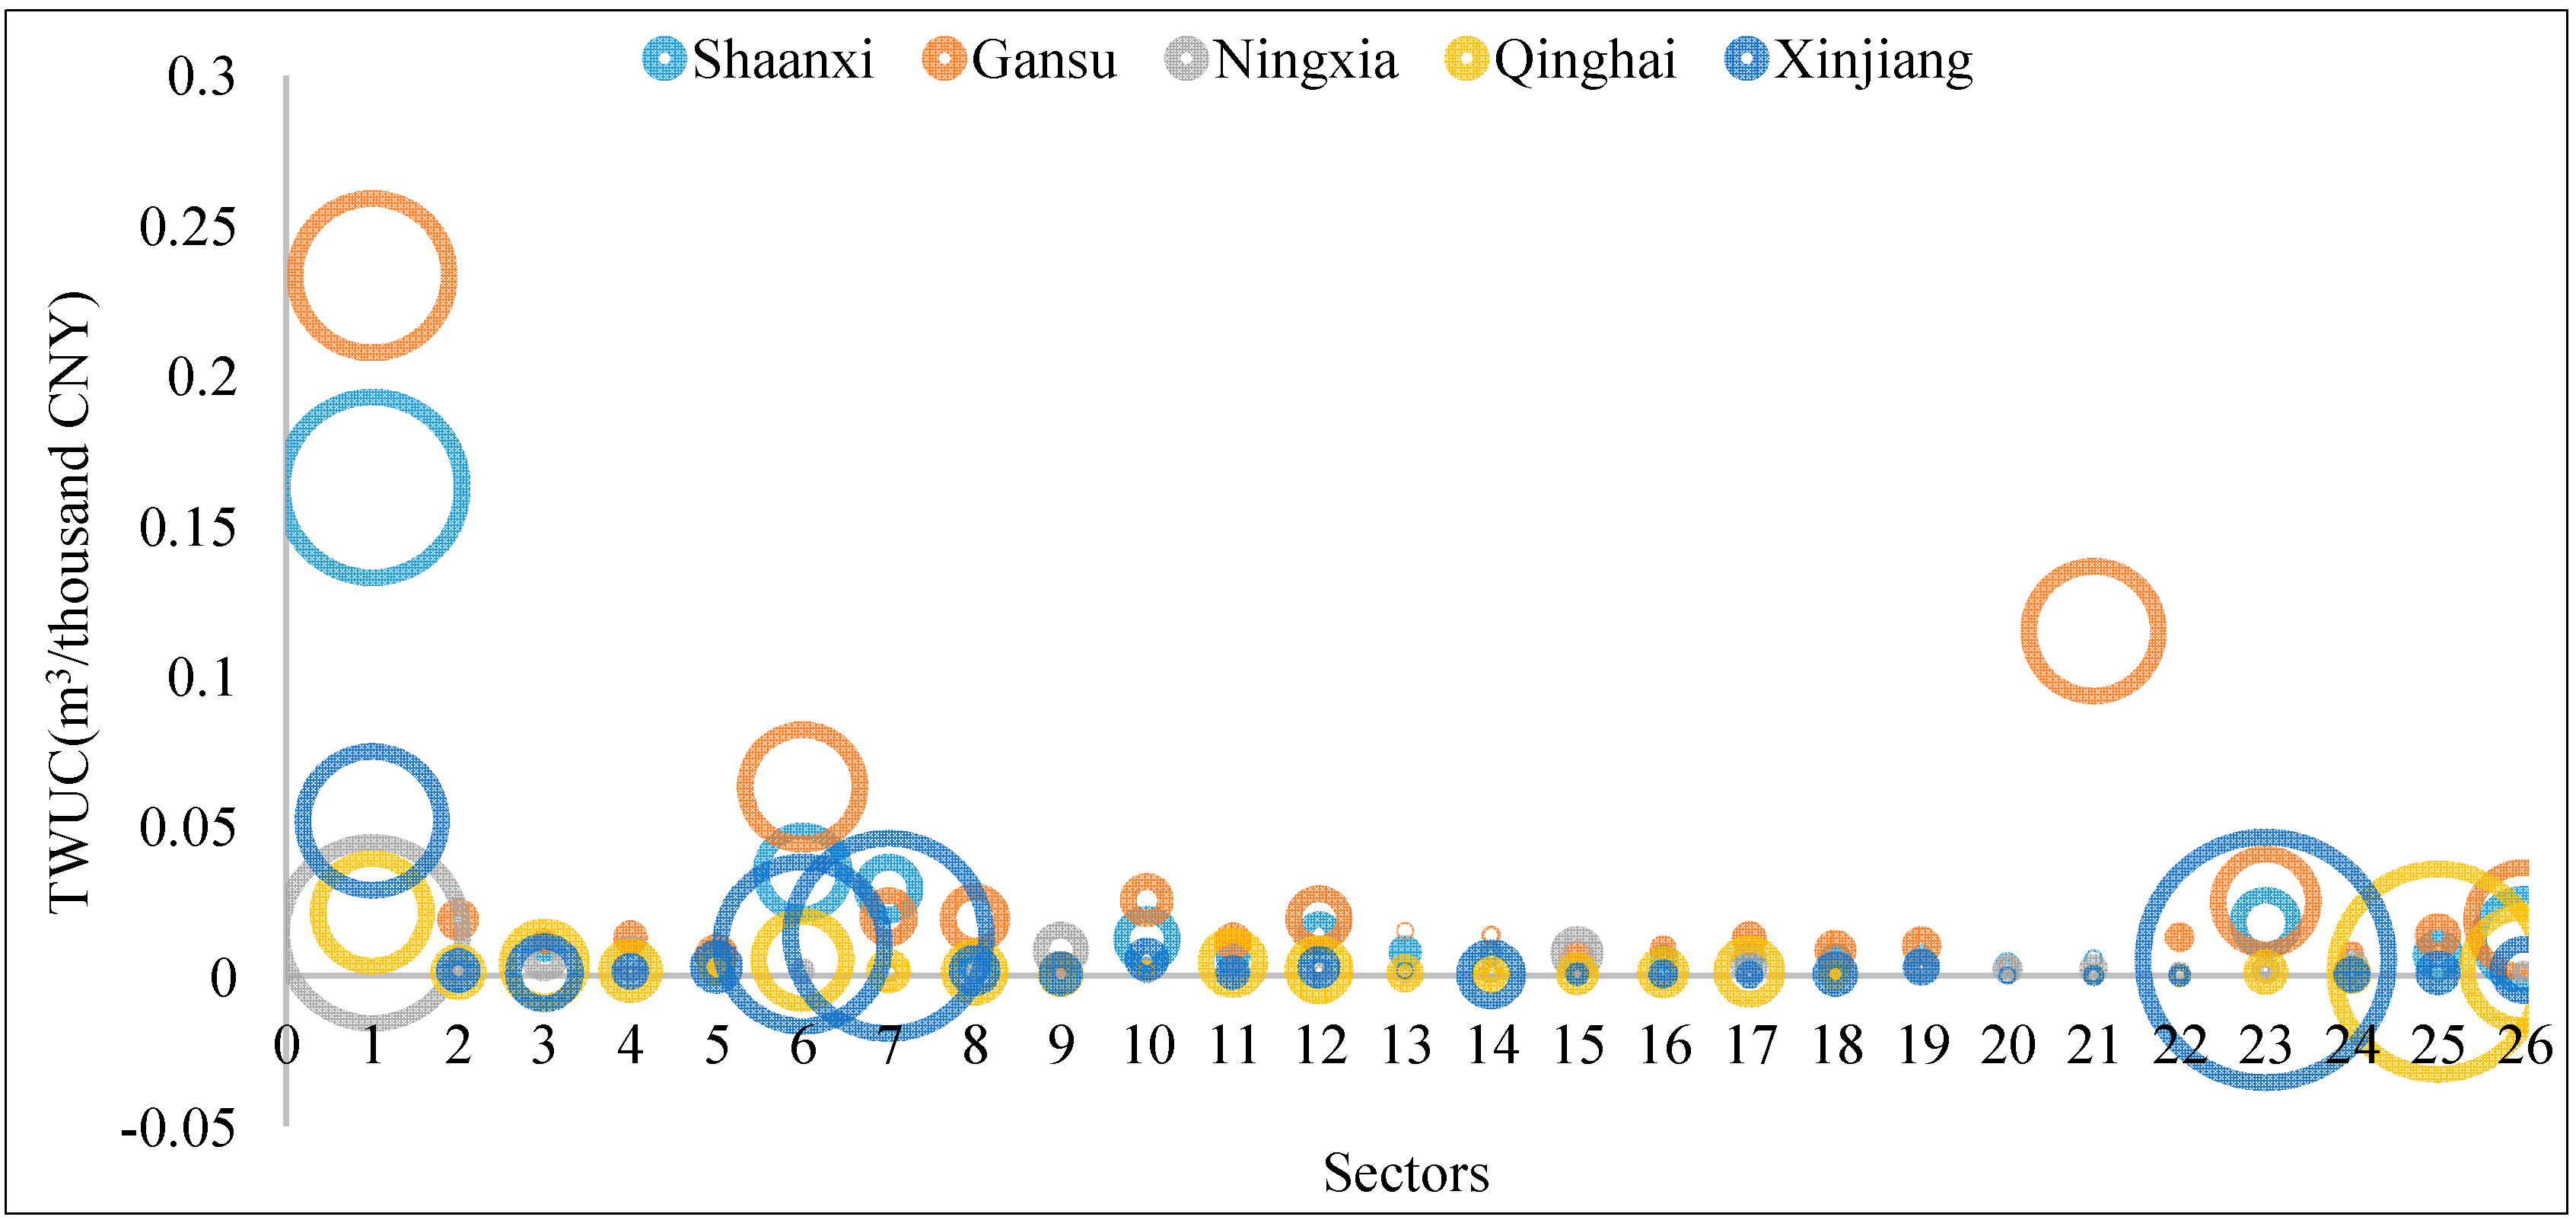
3.2. The Water Use Efficiency of the Five Provinces

The results above reflect the water use efficiency in the whole northwest region of China, in order to compare the water use efficiency among the five provinces of the northwest region of China, we refine the sectors into 26 sectors based on the 16 sectors, and carry out the analogous calculation of the five provinces in 2007. The results indicate that water use efficiency shows up significant difference in sectors among the five provinces (Figure 3). What the common point of the results in the five provinces is that their water use efficiency of primary industry is almost the lowest among the 26 sectors. This is reasonable because of the characteristics of primary industry. Besides, the water use efficiency of primary industry in the whole northwest region of China is also the lowest among the 16 sectors. Among the five provinces, the highest water use efficiency, of which is in Shaanxi Province, while the lowest of which is in Ningxia province. What is more, the results also show that the water use efficiency of the tertiary industry is not high in all of the five provinces, the water use efficiency of which in Xinjiang province is the highest, while the lowest of which appears in Ningxia province. From Figure 3, we can see that the real distinction of water use efficiency is performed in the secondary industry.
In Shaanxi province, the top five water use efficiency sectors are instrumentation and cultural office machinery manufacturing, metal products, water recycling, electric equipment and machinery, and transport equipment, which mainly belong to the manufacturing industry. These high water use efficiency sectors are mainly because Shaanxi province is mainly focusing on the development of chemistry engineering, energy, and manufacturing. While the five lowest sectors in water use efficiency are paper, paper products and printing, industrial chemicals, primary industry, textile, electricity and heat production, and supply industries. The water use efficiency of the last two sectors is even lower than the primary industry. In Gansu province, the top three water use efficiency sectors are wood products and furniture, metal products, and non-metal extraction. This kind of water use efficiency structure is decided by the industrial structure of Gansu province. Because Gansu province is rich in natural resources, its key sectors are raw materials processing industry, mining, and quarrying industries. While the three lowest water use efficiency industrial sectors are primary industry, paper, paper products and printing, handicrafts, and other manufacturing. This is decided by the industrial natural endowment; in other words, these low water use efficiency sectors have huge potential for improving water use efficiency. In Ningxia province, the top three water use efficiency sectors are non-metal extraction, wood products and furniture, handicrafts, and other manufacturing. While the lowest three water use efficiency sectors are petroleum, coking and nuclear fuel products; petroleum and gas extraction; paper, paper products and printing; since the proportion of resources processing industries are higher while the service industries are lower.
In Qinghai province, the water use efficiency is also highly correlated with industrial structure. Among the 26 sectors, wood products and furniture, metal smelting and rolling products, and metal products industries keep the highest water use efficiency, while the lowest ones are petroleum and gas extraction, and petroleum, coking and nuclear fuel products. Like other provinces, the water use efficiency of primary industry is relatively low. Since its tertiary industry does not account for too much among the whole sectors, the water use efficiency of it is also low, which is just 0.13 in 2007 thousand CNY/m3 higher than that in primary industry. As to Xinjiang province, since with certain resources advantages and industry foundation, the water use efficiency of tertiary industry and some secondary industrial sectors are relatively high, some of which are the highest among the five provinces. Tertiary industry, for instance, keeps the highest water use efficiency in the southwest region of China, which is 0.46 2007 thousand CNY/m3. The top three water use efficiency of sectors are metal products; electric equipment and machinery; handicrafts, and other manufacturing sectors. The water use efficiency of primary industry is really low, which is only 0.04 2007 thousand CNY/m3 and it is nearly the lowest one among the five provinces. The lowest three industries with water use efficiency are paper, paper products and printing; primary industry; and electricity and heat production and supply industry; among the 26 sectors.
Figure 3. Water use efficiency of the five provinces of northwest region of China (in 2007 thousand CNY/m3).
Sustainability 07 00056 g003
Similarly, we analyzed the indirect promote coefficients of water resource by sectors of the five provinces in 2007 for better research (Figure 4). Figure 4 indicates that all five provinces not only have high direct promote coefficients, but also high indirect promote coefficient of primary industry, which is determined by the product features of primary industry. While the situation is a little bit different in tertiary industry, which has low direct promote coefficients but high indirect coefficients in all five provinces, which is also caused by the characters of tertiary industry. In this study, we focus more on the indirect promote coefficient of water resource of secondary industries. In Shaanxi province, the direct and indirect promote coefficient of food, beverages and tobacco sectors are both the highest among the secondary industry sectors. While textile and construction sectors have low direct promote coefficients but high indirect promote coefficients. In Gansu province, both the direct and indirect promote coefficient of handicrafts and other manufacturing and food, beverages and tobacco sectors are the highest among the secondary industry sectors. While construction and electric equipment and machinery sectors have low direct promote coefficients but high indirect promote coefficients. In Ningxia province, the value of direct promote coefficient and the indirect promote coefficients of secondary industry sectors are nearly homologous. In Qinghai province, both direct and indirect promote coefficients of food, beverages and tobacco and petroleum and gas extraction sectors are relatively high. While construction and Transport equipment sectors have low direct promote coefficients but high indirect promote coefficients. In Xinjiang province, both the direct and indirect promote coefficients of textile and food, beverages and tobacco sectors are relatively high among the secondary industry sectors. While electricity and heat production and supply industry and petroleum and gas extraction sectors have low direct promote coefficients but high indirect promote coefficients.
Figure 4. The indirect promote coefficient of water resource by sectors of the five provinces in 2007 (m3/thousand CNY) (in 2007 CNY). TWUC stands for the total industrial water use coefficient.
Sustainability 07 00056 g004

4. Conclusions

4.1. Summary

With the help of input-output tables of 2002 and 2007 and the basis of previous researches, this study gave a new method to calculate and analyze water use efficiency by adding the water account to the traditional input-output table. This kind of method has been used in many researches in the past, but most of them just classify the whole industry into three big sectors, which is not convincing enough, and makes it hard to find out the real problems. The different with other researches is that we refine the secondary industry into 24 sectors in this study, which is highly requested for data collection. Further studies could be done to better understand the relationship between industrial structure and water use efficiency, and eventually to improve water use efficiency on the whole. Also, the method should be further improved by considering the practical situation of study areas under the basis of previous studies and attention ought to be paid to the connection between input-output analysis and water resource economics.
From the results of water use efficiency of different sectors and the analysis of the direct and indirect promote coefficients of water resources, some conclusions could be drawn. Firstly, the water use efficiency of primary industry are the lowest among the three industry sectors not only in the northwest region of China but also in its five provinces, which is similar to other regions in China compared with other researches with different methods [33,34,35]. Secondly, the water use efficiency of secondary industry sectors is quite different, which is determined by its industrial structure and the natural resource allocation. Thirdly, sectors with low direct promote coefficients could have high indirect promote coefficient, such as textile and construction sectors. These kinds of sectors should also be paid more attention; except for sectors with both high direct and indirect promote coefficients. Finally, because of the exit of the indirect promote of water resources by other sectors, the industry transformation do have certain impacts on water use efficiency of sectors, which are also proved by the results of 2002 and 2007.
Still, our research is not perfect; some further researches could be done. Though we have taken the water consumption occurring among various sectors into consideration by calculating the indirect water use coefficient, we did not include the counterpart occurred between the whole region of China and of the five provinces of the northwest region of China due to the limitation of trade data. Besides, it is rational that some other factors would also account for water use efficiency. Though we have eliminated those factors when performing the counterfactual experiment, we can still take into account those factors to take responding measures to improve water use efficiency in real situations.

4.2. Policy Implications

Given that the northwest region of China is faced with both urgent socioeconomic development and fragile ecological condition, and water scarcity is one of the major characters there, to improve water use efficiency is a necessity. According to the results and analysis above, some policy implications for regional sustainable development and water resources management are provided.
Firstly, industrial structure optimization should still be taken until the industrial structure is beneficial for both social economic development and the sustainable development of environment. Though the proportion of secondary industry keep rising recently—it even occupies the greatest proportion in some provinces—the proportion of the tertiary industry still need to be improved.
Secondly, improving the water use efficiency of low-efficiency industry sectors with by popularizing water saving technology, especially for primary industry. As is indicated form the results, water use efficiency of primary industry is quite low, and the indirect promote coefficients is really high, there are more potential in improving the water use efficiency. Therefore, we could improve water use efficiency of the whole industry starting from improving water use efficiency of the primary industry.
Finally, more attention should be paid to the industry sectors with low direct promote coefficient but high indirect promote coefficient. Because this kind of industry sectors may need more water than we can actually calculated in the process of producing. Meanwhile, some corresponding laws and regulations should also be made to assist and enhance the improvement of water use efficiency of economic sectors. There is still huge potential to improve water use efficiency of northwest region of China, which requested for concerted effects.

Acknowledgments

This research was financially supported by the major research plan of the National Natural Science Foundation of China (Grant No. 91325302) and the National Natural Science Funds of China for Distinguished Young Scholar (Grant No. 71225005). Also, the authors would like to thank Dongdong Chen and Gui Jin for their advice and assistant in the materials and data collection.

Author Contributions

Qingling Shi performed research, analyzed the data, and wrote paper with results checking; Shiyi Chen gave review suggestions of manuscript on the whole writing process; Chenchen Shi collected original data, analyzed the data, compiled reference list and collected background materials; Zhan Wang polished the expression of the final version. Xiangzheng Deng gave final review suggestions. All authors read and approved the final manuscript.

Conflicts of Interest

The authors declare no conflict of interest.

References

  1. Kofi Adom, P.; Bekoe, W.; Amuakwa-Mensah, F.; Mensah, J.T.; Botchway, E. Carbon dioxide emissions, economic growth, industrial structure, and technical efficiency: Empirical evidence from Ghana, Senegal, and Morocco on the causal dynamics. Energy 2012, 47, 314–325. [Google Scholar]
  2. Brachert, M. Identifying industrial clusters from a multidimensional perspective: Methodical aspects with an application to Germany. Pap. Reg. Sci. 2011, 90, 419–439. [Google Scholar] [CrossRef]
  3. Ham, H.; Kleiner, M.M. Do Industrial Relations Institutions Influence Foreign Direct Investment? Evidence from OECD Nations. Ind. Relat. J. Econ. Soc. 2007, 46, 305–328. [Google Scholar] [CrossRef]
  4. Lin, J.Y. New structural economics: the third wave of development thinking. In Proceedings of the 12th Heinz W. Arndt Memorial Lecture, Canberra, Austrilia, 6 June 2012.
  5. Chenery, H.B.; Robinson, S.; Syrquin, M. Industrialization and Growth; World Bank: Washington, DC, USA, 1986. [Google Scholar]
  6. Rosenberg, N.; Birdzell, L.E., Jr. How the West Grew Rich: The Economic Transformation of the Industrial World; Basic Books: New York, NY, USA, 2008. [Google Scholar]
  7. Kang, Y.; Wang, R.; Wan, S.; Hu, W.; Jiang, S.; Liu, S. Effects of different water levels on cotton growth and water use through drip irrigation in an arid region with saline ground water of Northwest China. Agric. Water Manag. 2012, 109, 117–126. [Google Scholar] [CrossRef]
  8. Simonen, J.; Svento, R.; Juutinen, A. Specialization and diversity as drivers of economic growth: Evidence from High-Tech industries. Pap. Reg. Sci. 2014. [Google Scholar] [CrossRef]
  9. Sakamoto, H. Provincial economic growth and industrial structure in China: An index approach. Reg. Sci. Policy Prac. 2011. [Google Scholar] [CrossRef]
  10. Figuières, C.; Guyomard, H.; Rotillon, G. Sustainable Development: Between Moral Injunctions and Natural Constraints. Sustainability 2010, 2, 3608–3622. [Google Scholar] [CrossRef]
  11. Richardson, R.B. Ecosystem Services and Food Security: Economic Perspectives on Environmental Sustainability. Sustainability 2010, 2, 3520–3548. [Google Scholar] [CrossRef]
  12. Rosenzweig, C. Responding to Climate Change in New York State: The ClimAID Integrated Assessment for Effective Climate Change Adaptation in New York State. Ann. N. Y. Acad. Sci. 2011. [Google Scholar] [CrossRef]
  13. Karl, H. Regional policy and the environment—The case of Germany. Eur. Environ. 2001, 11, 103–111. [Google Scholar] [CrossRef]
  14. Bindra, S.; Muntasser, M.; El Khweldi, M.; El Khweldi, A. Water use efficiency for industrial development in Libya. Desalination 2003, 158, 167–178. [Google Scholar] [CrossRef]
  15. Hubacek, K.; Sun, L. Economic and Societal Changes in China and their Effects on Water Use a Scenario Analysis. J. Ind. Ecol. 2005, 9, 187–200. [Google Scholar] [CrossRef]
  16. Ji, Y. Temporal and Spatial Variability of Water Supply Stress in the Haihe River Basin, Northern China. JAWRA J. Am. Water Resour. Assoc. 2012. [Google Scholar] [CrossRef]
  17. Venot, J.-P. Beyond water, beyond boundaries: Spaces of water management in the Krishna river basin, South India. Geogr. J. 2011, 177, 160–170. [Google Scholar] [CrossRef] [PubMed]
  18. Zeitoun, M.; Goulden, M.; Tickner, D. Current and future challenges facing transboundary river basin management. Wiley Interdiscip. Rev. Clim. Change 2013, 4, 331–349. [Google Scholar] [CrossRef]
  19. Leontief, W. Environmental repercussions and the economic structure: An input-output approach. Rev. Econ. Stat. 1970, 52, 262–271. [Google Scholar] [CrossRef]
  20. Thirlwall, A.P. Growth Development; Palgrave Macmillan: Basingstoke, UK, 2006. [Google Scholar]
  21. Machado, G.; Schaeffer, R.; Worrell, E. Energy and carbon embodied in the international trade of Brazil: An input-output approach. Ecol. Econ. 2001, 39, 409–424. [Google Scholar] [CrossRef]
  22. Dean, J.M.; Lovely, M.E. Trade growth, production fragmentation, and China’s environment. In China’s Growing Role in World Trade; University of Chicago Press: Chicago, IL, USA, 2010; pp. 429–469. [Google Scholar]
  23. Goto, M.; Otsuka, A.; Sueyoshi, T. DEA (Data Envelopment Analysis) assessment of operational and environmental efficiencies on Japanese regional industries. Energy 2014, 66, 535–549. [Google Scholar] [CrossRef]
  24. Ren, J.; Tan, S.; Dong, L.; Mazzi, A.; Scipioni, A.; Sovacool, B.K. Determining the life cycle energy efficiency of six biofuel systems in China: A Data Envelopment Analysis. Bioresour. Technol. 2014, 162, 1–7. [Google Scholar] [CrossRef] [PubMed]
  25. Gong, Z.; Zhao, Y.; Ge, X. Efficiency assessment of the energy consumption and economic indicators in Beijing under the influence of short-term climatic factors: Based on data envelopment analysis methodology. Nat. Hazards 2014, 71, 1145–1157. [Google Scholar] [CrossRef]
  26. Seager, R.; Ting, M.; Held, I.; Kushnir, Y.; Lu, J.; Vecchi, G.; Huang, H.-P.; Harnik, N.; Leetmaa, A.; Lau, N.-C. Model projections of an imminent transition to a more arid climate in southwestern North America. Science 2007, 316, 1181–1184. [Google Scholar] [CrossRef] [PubMed]
  27. Zhang, Y.; Qi, S. Regional Input-Output Tables of China; China Statistical Press: Beijing, China, 2012. [Google Scholar]
  28. State Statistical Bureau of China. China Economic Census Yearbook; China Statistic Press: Beijing, China, 2007. [Google Scholar]
  29. State Statistical Bureau of China. China Economic Census Yearbook; China Statistic Press: Beijing, China, 2008. [Google Scholar]
  30. China water net. Water price. Avaliable online: http://chinawater.net/profile.html (accessed on 2 December 2014). (In Chinese)
  31. Deng, X.; Zhang, F.; Wang, Z.; Li, X.; Zhang, T. An Extended Input Output Table Compiled for Analyzing Water Demand and Consumption at County Level in China. Sustainability 2014, 6, 3301–3320. [Google Scholar] [CrossRef]
  32. Peters, G.P.; Andrew, R.; Lennox, J. Constructing an environmentally-extended multi-regional input-output table using the GTAP database. Econ. Syst. Res. 2011, 23, 131–152. [Google Scholar] [CrossRef]
  33. Mo, X.; Liu, S.; Lin, Z.; Xu, Y.; Xiang, Y.; McVicar, T. Prediction of crop yield, water consumption and water use efficiency with a SVAT-crop growth model using remotely sensed data on the North China Plain. Ecol. Model. 2005, 183, 301–322. [Google Scholar] [CrossRef]
  34. Deng, X.-P.; Shan, L.; Zhang, H.; Turner, N.C. Improving agricultural water use efficiency in arid and semiarid areas of China. Agric. Water Manag. 2006, 80, 23–40. [Google Scholar] [CrossRef]
  35. Wang, W.; Gao, L.; Liu, P.; Hailu, A. Relationships between regional economic sectors and water use in a water-scarce area in China: A quantitative analysis. J. Hydrol. 2014, 515, 180–190. [Google Scholar] [CrossRef]

