Article

Impact Analysis of Air Pollutant Emission Policies on Thermal Coal Supply Chain Enterprises in China

School of Economics and Management, North China Electric Power University, Hui Long Guan, Chang Ping District, Beijing 102206, China
*
Author to whom correspondence should be addressed.
Sustainability 2015, 7(1), 75-95; https://doi.org/10.3390/su7010075
Submission received: 21 August 2014 / Accepted: 8 December 2014 / Published: 23 December 2014
(This article belongs to the Special Issue Sustainability in China: Bridging Global Knowledge with Local Action)

Abstract

:
Spurred by the increasingly serious air pollution problem, the Chinese government has launched a series of policies to put forward specific measures of power structure adjustment and the control objectives of air pollution and coal consumption. Other policies pointed out that the coal resources regional blockades will be broken by improving transportation networks and constructing new logistics nodes. Thermal power takes the largest part of China’s total installed power generation capacity, so these policies will undoubtedly impact thermal coal supply chain member enterprises. Based on the actual situation in China, this paper figures out how the member enterprises adjust their business decisions to satisfy the requirements of air pollution prevention and control policies by establishing system dynamic models of policy impact transfer. These dynamic analyses can help coal enterprises and thermal power enterprises do strategic environmental assessments and find directions of sustainable development. Furthermore, the policy simulated results of this paper provide the Chinese government with suggestions for policy-making to make sure that the energy conservation and emission reduction policies and sustainable energy policies can work more efficiently.

1. Introduction

According to the Air Quality Report issued by the Chinese Environmental Protection Ministry, in 2013 China’s annual haze days reached the highest level on record (19.5 days) owing to unsustainable development and an unreasonable energy structure. In addition, the national annual concentration of PM2.5 has reached 72 micrograms per cubic meter. Only three cities reached the standard, which accounts for 4.1 percent of all 74 cities. The Intergovernmental Panel on Climate Change (IPCC) found that coal combustion is the main source of air pollutants. In addition, the research done by the Chinese Academy of Sciences (CAS) showed that: the sources of Beijing’s particulate matter (PM10) emission are secondary inorganic aerosols (26%), industrial pollution (25%), coal consumption (18%), soil dust (15%), biomass burning (12%), and automobile exhaust gas and waste incineration (4%). The secondary inorganic aerosols, industrial pollution, and coal consumption are all caused by the burning of fossil fuels. Therefore, China’s worsening air quality is probably caused by extensive coal consumption and a high energy consumption development pattern.
Coal consumption is considered to be the second most important anthropogenic contributor to global air pollution [1,2]. From the perspective of coal consumption structure, the electric power industry is the biggest contributor to the coal resources consumption. The power generation industry produces more than 40 percent of total air pollution emissions in China [3]. China’s past electricity development policies have led the power industry to make excessive investment in thermal power installed capacity and low operational efficiency [4]. If a long-term transition towards a low carbon economy is not carried out, China’s CO2 emissions could rise by 160%–250% from 2010 to 2050 [5]. By the year 2020, China’s thermal power generation may reach over 7 trillion kilowatt-hours, and air-pollution intensity will be nearly twice the 2005 level [6].
To accelerate the control of air pollution, the Chinese government has introduced many policies managing the air quality and adjusting the energy structure since 2009. These air pollution emission policies will surely change the operating environment of coal supply chain enterprises. So it is urgent to analyze the policy impact and optimize the development patterns for coal and power industries under new policy restraints [7]. From the perspective of the power industry, coal-fired power will translate into clean and efficient energy power after the implementation of sustainable development policies [5,8]. China’s hydropower, wind power, and nuclear power industry will meet a tremendous need in the following decades under the encouragement of energy structure adjustment and an emission reduction policy [9,10]. Nuclear and hydropower may play a dominant role in contributing to China’s air pollution reduction in the long term [11]. Also, the promotion of renewable energy utilization will surely have a great effect on China’s coal and power industry [12]. Further, the air pollution emission reduction policies can also accelerate the technological advancement and clean coal utilization of thermal coal supply chain enterprises [13,14].
The thermal coal supply chain system is the whole system of coal enterprises, power enterprises, and coal transportation enterprises, which guide the process from coal production to coal consumption. In addition, air pollutant emission reduction policies’ impact on the thermal coal supply chain is a complex, dynamic evolution process concerning many fields such as policies related to energy conservation and emission reduction, economic development, power production and consumption, resource exploitation and utilization, and energy price. So it is obvious that the power structure adjustment has nonlinear characteristics. The system dynamics (SD) method not only models the market’s real behavior but also properly explains the relationship between the main variables of the system [15]. Considering the advantages of integrity and dynamics that system dynamics has in analyzing complex dynamic problems, this paper set up a complete system dynamics model by analyzing: the air pollution emitted during coal combustion, coal washing technology, installed capacity, unit transform, and new energy power generation, under the constraint of the new atmospheric pollutant emission policy, to seek a development pattern for the thermal coal supply chain.
The SD approach has been applied in investigating the sustainable management of electric power systems. Some scholars have set up an SD-based model to investigate the distributed energy resource expansion planning [15,16,17] and energy efficiency improvement [18], considering both energy states and production constraints. Other scholars use SD methodology to simulate the behavior of the renewable energy sectors such as nuclear [19] and photovoltaic energy [20]. SD models are also widely built to explore the effects of energy consumption and CO2 emission reduction policies [21,22,23,24]. Previous models have structured the investment, dispatch, pricing heuristics, and electricity generation resource factors with common emission reduction policies such as feed-in-tariffs, investment subsidies, and carbon taxes. In order to deeply investigate the new development pattern of the power and energy industry, some scholars have qualitative explored the link between transportation systems and air pollution reduction policies using the SD approach [25,26]. However, the dynamic behavior of the thermal power system and the complicated feedback of a coal system under pollution reduction policies were not taken into account in previous studies.
As policy refinement increases, China’s air pollutant emission reduction policies select the specific goals of pollution emission, coal cleaning proportion, and desulfurated capacity proportion. Under the new policy situation, the former system dynamic model is not suitable to measure the effect on China’s thermal coal supply chain member enterprises.
The objectives of this paper are as follows:
(1)
To analyze China’s recent air pollution reduction policies systematically.
(2)
To apply some descriptive and effective methodologies to simulate the fundamental and dynamic development process of thermal coal supply chain member enterprises driven by emission reduction policies.
(3)
Taking China as a case study, to develop a system dynamics model based on Vensim PLE for Windows Version 5.10a software (Ventana Systems, Inc., Cambridge, MA, USA), which offers a realistic platform for predicting the development trends of China’s thermal coal supply chain enterprises from 2012 to 2022.
The simulated results are significant in predicting energy proportion, power proportion, and development routes of thermal coal supply chain member enterprises. In addition, the simulations of China’s air pollution emission reductions have meaning for policy-making institutions.

2. China’s Air Pollution Emission Reduction Policies

China is the world’s biggest energy consumer [27,28]. According to the information distributing platform of National Statistics, China’s coal consumption accounts for about 70% of the total energy consumption in 2013. The thermal coal consumption of China’s electric industry is 1967 million tons, accounting for 64.29% of the total coal consumption. China’s growing atmospheric pollution problem is caused by the long-term accumulation of multiple factors such as unsustainable development patterns and unreasonable energy electric power industry structures. In order to better reduce air pollution, the Chinese government has introduced many laws involving concrete measures since 2009.
In 2009, after realizing the importance of sustainable development the Chinese government first proposed to reduce carbon dioxide emissions per unit of GDP by 40%–45% in 2020, as of the 2005 level. This restrictive goal has also been included in the medium and long term planning of China’s national economic and social development.
In 2010, the fifth plenary session of the 17th CPC Central Committee emphasized that China should make the construction of a resource-saving and environment-friendly society an important focus despite the acceleration of economic growth and the readjustment of the economic structure. Prime Minister Wen Jiabao promised that China would energetically promote energy conservation and raise the efficiency of energy consumption, especially in industry and transportation. Wen also said that China would add 80 million tons of standard coal energy saving ability annually, and that all additional and reconstructive coal-fired units must build and run flue gas desulfurization facilities synchronously.
Since 2012, hazy weather in the Beijing-Tianjin-Hebei and Yangtze River Delta areas is becoming more and more frequent, so the importance of air pollutant prevention is becoming more and more noticeable. In October 2012, the Chinese National Development and Reform Commission, the Ministry of Environmental Protection, and the Ministry of Finance jointly issued The 12th Five-Year Plan for the prevention and control of atmospheric pollution in key areas. The 12th Five-Year Plan pointed out that we should focus on the optimization of industrial layout and energy structure and the enhancement of clean energy under the current serious situation of air pollution. China should adhere to a diversified energy development strategy, strive to improve the proportion of clean low-carbon fossil energy and non-fossil energy, promote the efficient utilization of clean coal, implement the alternatives of traditional energy, and speed up the optimization of energy production and consumption structure. By the end of the 12th period, the proportion of non-fossil energy consumption should increase to 11.4% and the proportion of coal consumption should decrease to 65%. The proportion of non-fossil energy generation installed capacity should reach 30%.
In June 2013, the premier, Li Keqiang, introduced ten measures for the control of air pollution in the state council executive meeting. The main content of these measures is the reduction of air pollutant emission, the control of high energy-consuming enterprises, the adjustment of energy structures, and the new energy conservation and emissions reduction mechanisms of incentive and constraint. We should speed up the adjustment of energy structure by implementing the interregional transmission project, controlling coal consumption reasonably, and promoting the use of clean coal. By the end of 2014, China should complete the elimination of backward installed capacity ahead of time. The Chinese government should follow the guiding and incentive rule of taxes and subsidies, in order to push for sustainable development.
In September 2013, The Action Plan for the Control of Air Pollution, issued by the state council, clearly pointed out that in 2017 the inspirable particle concentrations of China’s prefecture-level cities should be reduced by 10% from 2012 levels and the inspirable particle concentrations of Beijing-Tianjin-Hebei, the Yangtze River Delta area, and the Pearl River Delta area should be reduced by about 25%, 20%, and 15%, and the PM10 concentrations of Beijing especially should be reduced to under 60 micrograms per cubic meter. The Action Plan for the Control of Air Pollution also mentioned the adjustment of energy structure, the optimization of industrial layout, the improvement of environmental economic policies, and some other measures. Measures optimizing the industrial layout covered the capacity limitation of energy-intensive and highly polluting industries, the acceleration of backward capacity elimination, and the compression of excessive capacity. China should take a sustainable development pattern by controlling coal consumption, increasing the proportion of washed coal, accelerating the use of clean energy, and raising the energy usage effectiveness. An energy conservation and emissions reduction mechanism of incentive and constraint should be promoted actively in order to improve sustainable environmental economic policies
In addition, some local governments introduced policies to cooperate with the implementation of The Action Plan for the Control of Air Pollution, such as an action plan implementing rules for the control of air pollution in Beijing-Tianjin-Hebei and surrounding areas. These rules made more detailed targets for the provinces and cities of the Beijing-Tianjin-Hebei region. The plan pointed out that by the end of 2017 the proportion of Beijing’s coal consumption will drop below 10% and high-quality energy such as electricity and natural gas will account for more than 90%. Beijing will cut 13 million tons of raw coal by using many comprehensive measures such as eliminating backward production capacity, clear violations capacity, strengthening energy conservation and emissions reduction, implementing clean energy replacement, safe development of nuclear power, and strengthening the new energy-efficient utilization.
Overall, these air-pollution reduction policies focused on optimizing the industrial structure and energy structure, and giving impetus to industrial transformation and upgrading. Along with the restriction of coal consumption and the development of clean energy generation, the business environment and development modes of coal enterprises and power generation enterprises must change significantly. It is a big challenge for thermal coal supply chain member enterprises, including coal enterprises, power generation enterprises, and thermal coal transportation enterprises, to make the right decisions in response to the policy influence [29]. Completing the analysis of policy implications will be of great significance in researching the policy mechanism and predicting the developing direction for thermal coal supply chain node enterprises under the policy background. The policy implications are complex and dynamic, so it is difficult for a general model to simulate the changing process of each factor in the thermal coal supply chain under the influence of air pollutant emission reduction policies. Considering the advantages of the SD model on integrity and dynamics during complex analysis, this paper plans to establish a system dynamics model of thermal coal supply chain member enterprises’ development processes under the impact of air pollutant emission reduction policies to figure out the policy mechanism and assist decision-making in node enterprises.

3. A System Dynamics Model of Policy Impact on Thermal Coal Supply Chain Member Enterprises

3.1. System Dynamics Methodology

SD is a systems modeling and dynamic simulation methodology for analysis of dynamic complexity in socioeconomic and biophysical systems [30]. Based on the principles of system thinking and feedback control theory, system dynamics helps in understanding the time-varying behavior of complex systems [31]. Our SD model is divided into two parts: qualitative analysis and quantitative analysis. The causality diagram is mainly used for the qualitative analysis of the model and the system dynamics flow diagram is used to realize the quantitative analysis. We used a causality diagram to qualitatively analyze the transfer process of impact of air pollution reduction policies on the thermal coal supply chain. The causality diagram achieves a qualitative analysis of complex correlations and influences within various factors of the thermal coal supply-chain system by drawing system factors and the positive or negative causal chains connecting factors. Furthermore, we used a flow diagram to analyze the quantitative relationship between the three variables of the coal subsystem, the power subsystem, and the transportation subsystem. The dynamic flow diagram builds up the quantitative analysis model to simulate and analyze the system’s behavior by drawing the visual state variable, the rate variable, and the auxiliary variable, and setting function relationships and initial values among variables through the Vensim_PLE software. The SD model simulated the changing trend of various internal variables under the influence of relevant policies. In addition, we predicted the power structure adjustment and the developing route of coal enterprises by summarizing the simulated results.
The thermal coal supply chain is a system with obvious boundaries, and policy impact on it will be both dynamic and complex. Although other types of dynamic, quantitative modeling can do the impact analysis, an SD model has an advantage in solving dynamic problems because it is the only method that can better reflect forward and reverse policy impact processes along the thermal coal supply chain, and reveal the extent of the influence air pollution reduction policy has on factors in the supply chain system [32]. So this study uses system dynamics to analyze air pollutant emission policies’ impact on the development of thermal coal supply chain member enterprises in China, simulating the dynamic transfer process of policy influence. We believe that this SD model can properly analyze the impact of air pollution reduction policies on the development of thermal coal supply chain member enterprises, and simulate the dynamic transfer process of relevant policy influence.

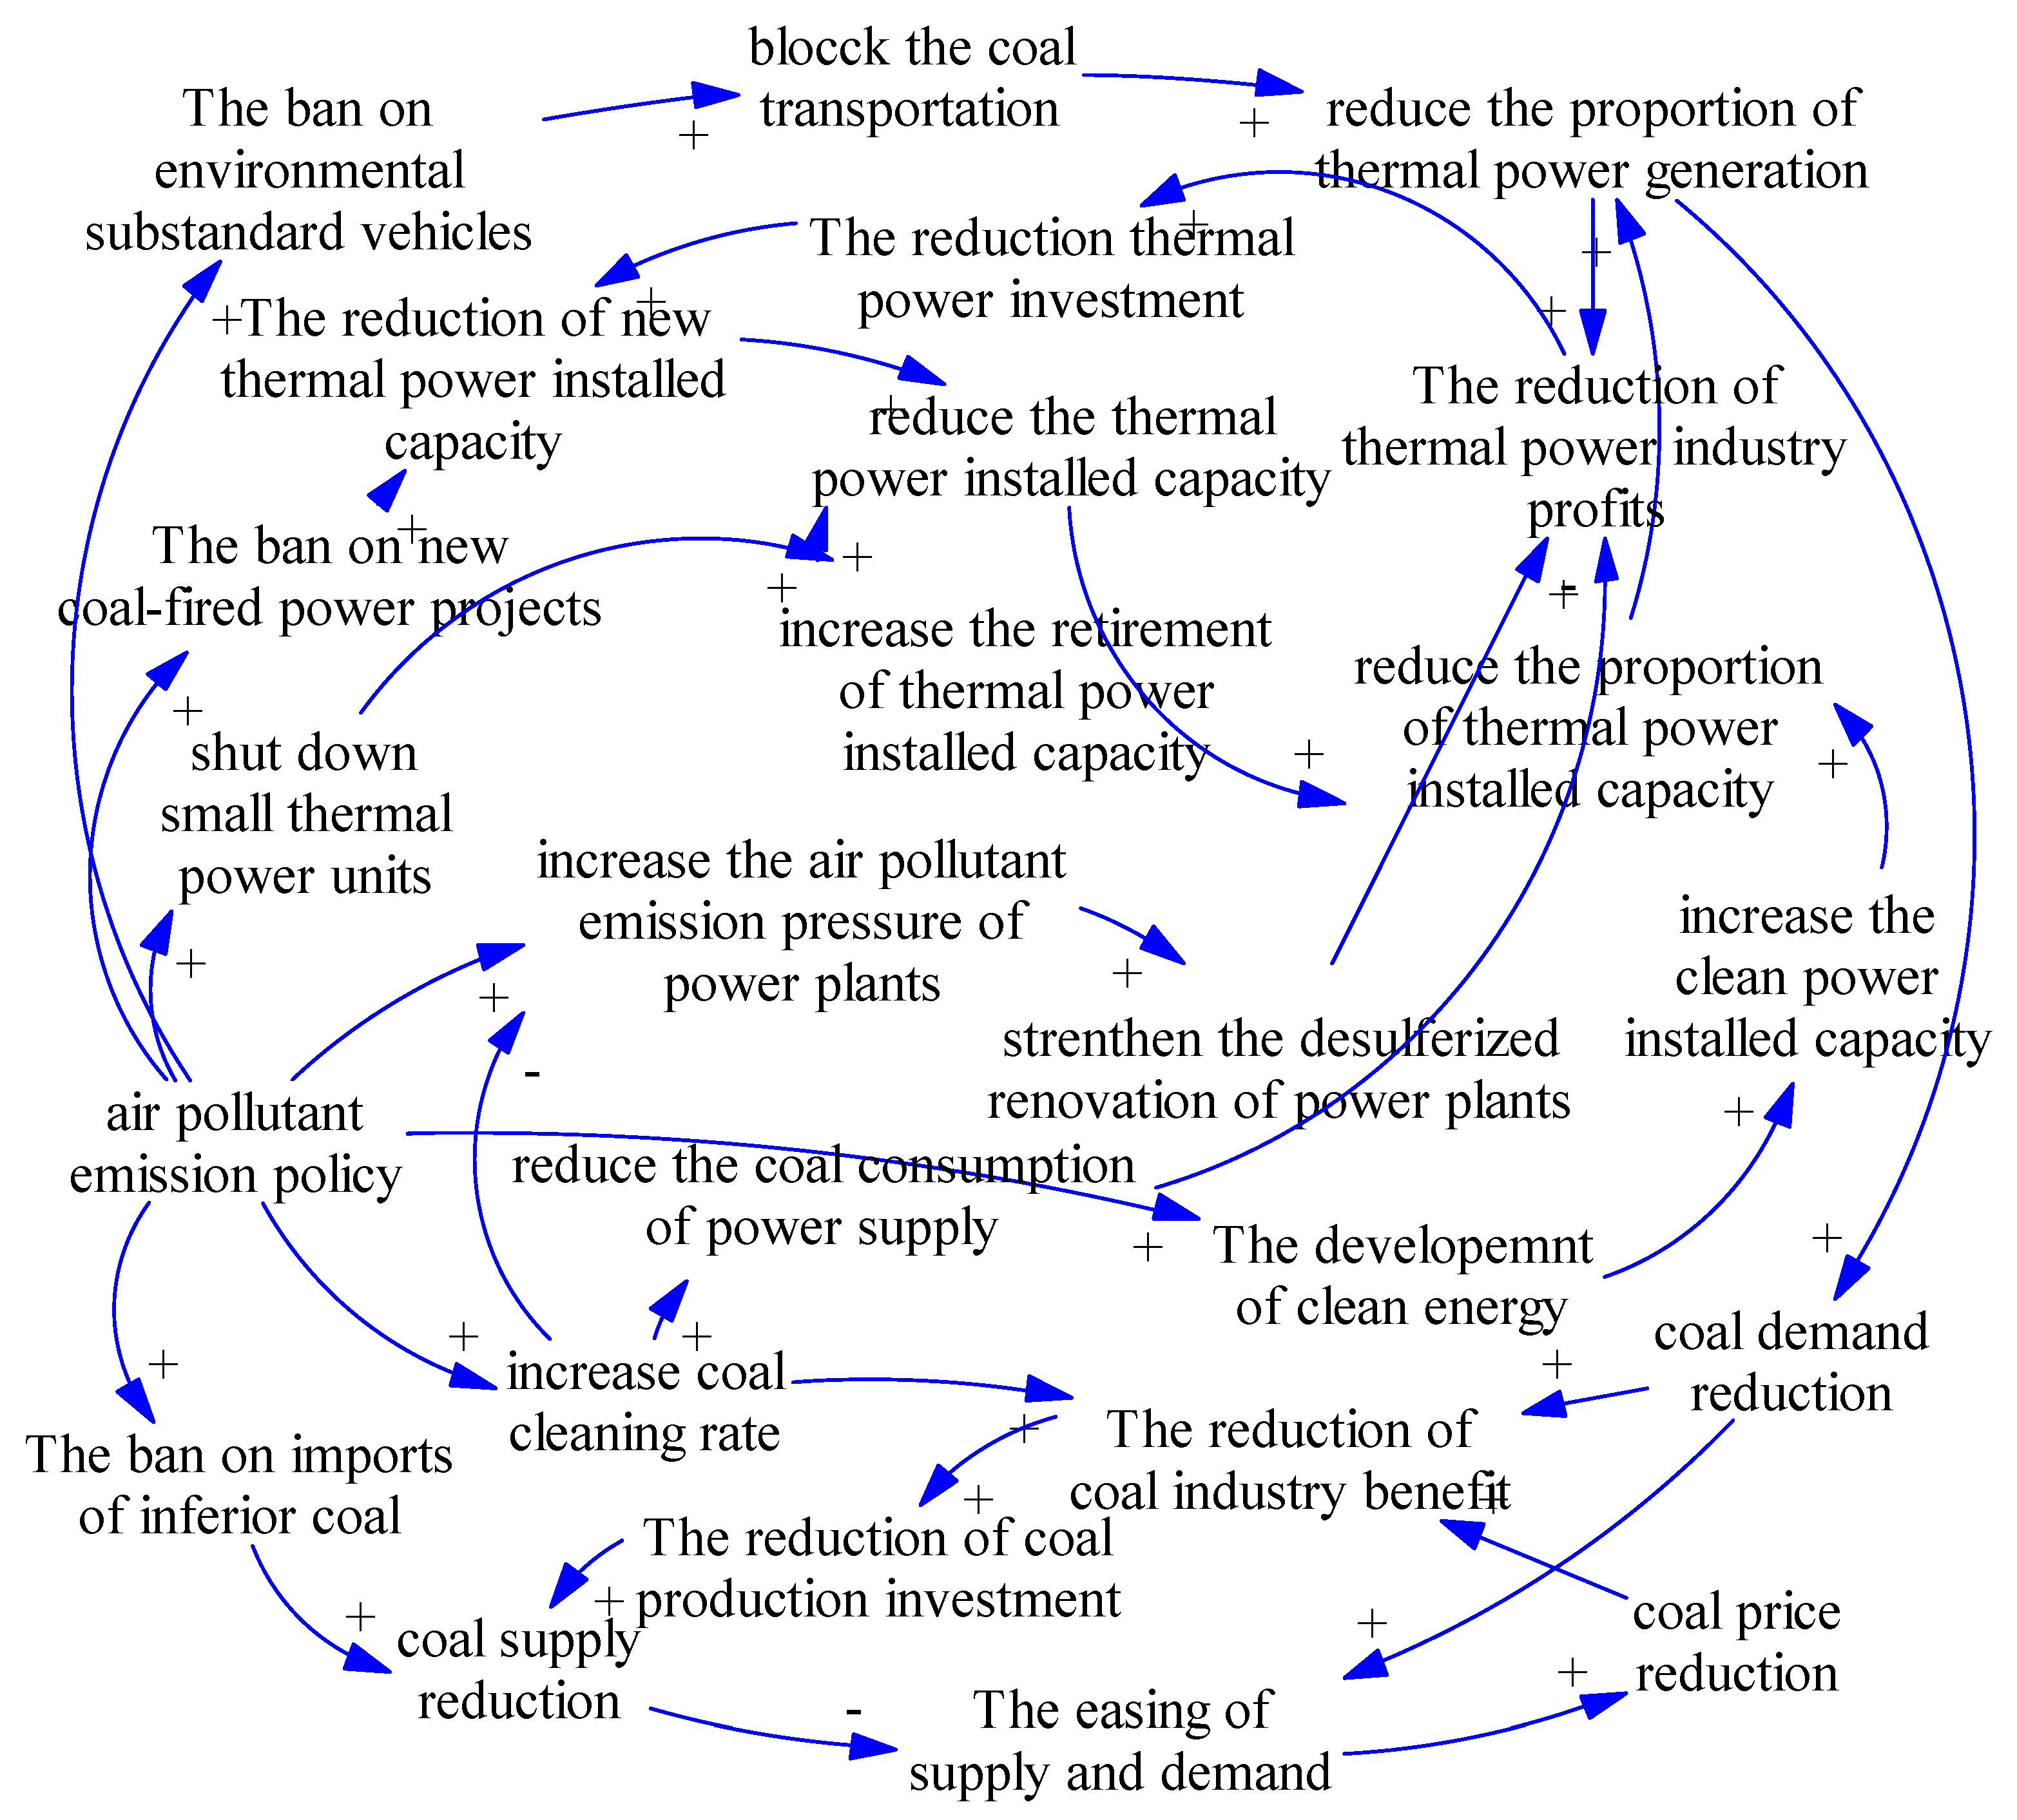
3.2. Model Structure Analysis

In order to analyze the transfer process of policy impact within the supply chain system, this paper firstly sorted out possible policy impact types by combining specific action plans and reduction targets mentioned in the above air pollutant emission reduction policies. The air pollutant emission reduction policies are aimed at strengthening the management of air pollution and reducing the concentration of PM10. Coal, as the primary source of atmospheric pollutants, is a key regulatory object of these policies. Policies such as The Action Plan for the Control of Air Pollution will impact the scale, costs, and benefits of coal enterprises, power generation enterprises, and transport enterprises through a variety of means. At present, air pollutant emissions policies such as The Action Plan for the Control of Air Pollution and the action plan implementing rules for the control of air pollution in the Beijing-Tianjin-Hebei area will impact the following aspects of thermal coal supply chain node enterprises:

3.2.1. Industrial Structure Adjustment

The Action Plan for the Control of Air Pollution (or The Action Plan, for short) required the full or partial elimination of small coal-fired boilers in central heating, to be replaced by the use of electricity or natural gas, and forbade new coal boilers in key areas such as Beijing and Tianjin. New projects in Beijing-Tianjin-Hebei, the Yangtze River Delta, and the Pearl River Delta are banned from having supporting self-provided coal-fired power stations. In addition to cogenerations, new thermal-power generation projects are banned. We must speed up the development of hydropower, wind power, solar power, and nuclear power on the basis of safety and efficiency. Nuclear power installed capacity will reach 50 million kilowatts by 2017. Such policies will reduce the capacity of new thermal power generating units and increase the coal enterprise’s strategic and operational risk. The Action Plan highlighted how to govern small coal-fired boilers comprehensively, and encouraged the accelerated construction of “coal to gas” and “coal to electricity” projects. Small coal-fired boilers under 10 tons will be eliminated by 2017.

3.2.2. Energy Structure Adjustment

The Action Plan clearly pointed out that the proportion of China’s coal consumption will decrease to less than 65% by 2017. China should focus on the orderly development of hydropower, the efficient utilization of geothermal energy, wind energy, solar energy, biomass energy, and the safe development of nuclear power. It must increase the proportion of new power generation and the consumption of renewable energy power by developing projects of wind power and nuclear power generation. Coal should gradually be replaced by increasing both the proportion of outside transmission in the gas supply and the non-fossil energy intensity. The Chinese government recommends the use of electricity and other clean energy instead of coal. Such policies are intended to reduce the proportion of coal consumption in the total energy consumption and limit the relative demand for coal resources.
In addition, The Action Plan stopped imports of inferior foreign coal and restricted sales of bulk coal with high ash and sulfur. These policies would affect the demand-supply condition of coal and the market price of thermal coal, and would bring demand-supply risks to coal enterprises and fuel price risks to power generation companies. The Action Plan also pointed out that by 2017 the proportion of washed coal should rise to 70%, in order to reduce air pollutant emissions in the process of coal combustion. This policy will increase the washing equipment investment and running cost of coal enterprises, thus raising its investment risk.

3.2.3. Technical Renovation

The Action Plan pointed out that coal-fired power generation enterprises should reduce harmful gas emissions by speeding up the desulfuration renovation of thermal power units and formulating strict desulfuration capacity targets. In 2012, the proportion of desulfuration capacity is 56%. This proportion will increase to 70% by 2017. Key areas such as Beijing and Tianjin have to complete the pollution control work of coal-fired power plants before the end of 2015. Meanwhile power generation enterprises should strengthen the development of desulfurization and denitration technology and intensify the exchange of air-pollution control management experience. These policies force coal enterprises to put a lot of money into the desulfurization reform and the development of related emissions reduction technology. These measures will occupy much of the working capital and greatly increase the operational risk, the cash flow risk, and the cost risk for power generation companies.

3.2.4. Market Mechanism Adjustment

The market mechanism adjustment policy includes two aspects of incentives and punishment. In terms of incentives, The Action Plan pointed out that the government will adjust the sales price and perfect the denitration electricity price policy considering the cost of denitration and the local characteristics. Existing thermal power units that adopt new dedusting facilities’ renovation technology should be given price supports. In terms of punishment, The Action Plan pointed out that the government should increase the intensity of atmospheric pollutant emission levies and improve atmospheric pollution standards. This kind of market adjustment policy will increase the price risk and cost risk of thermal coal supply chain enterprises.

3.2.5. Vehicle Environmental Management
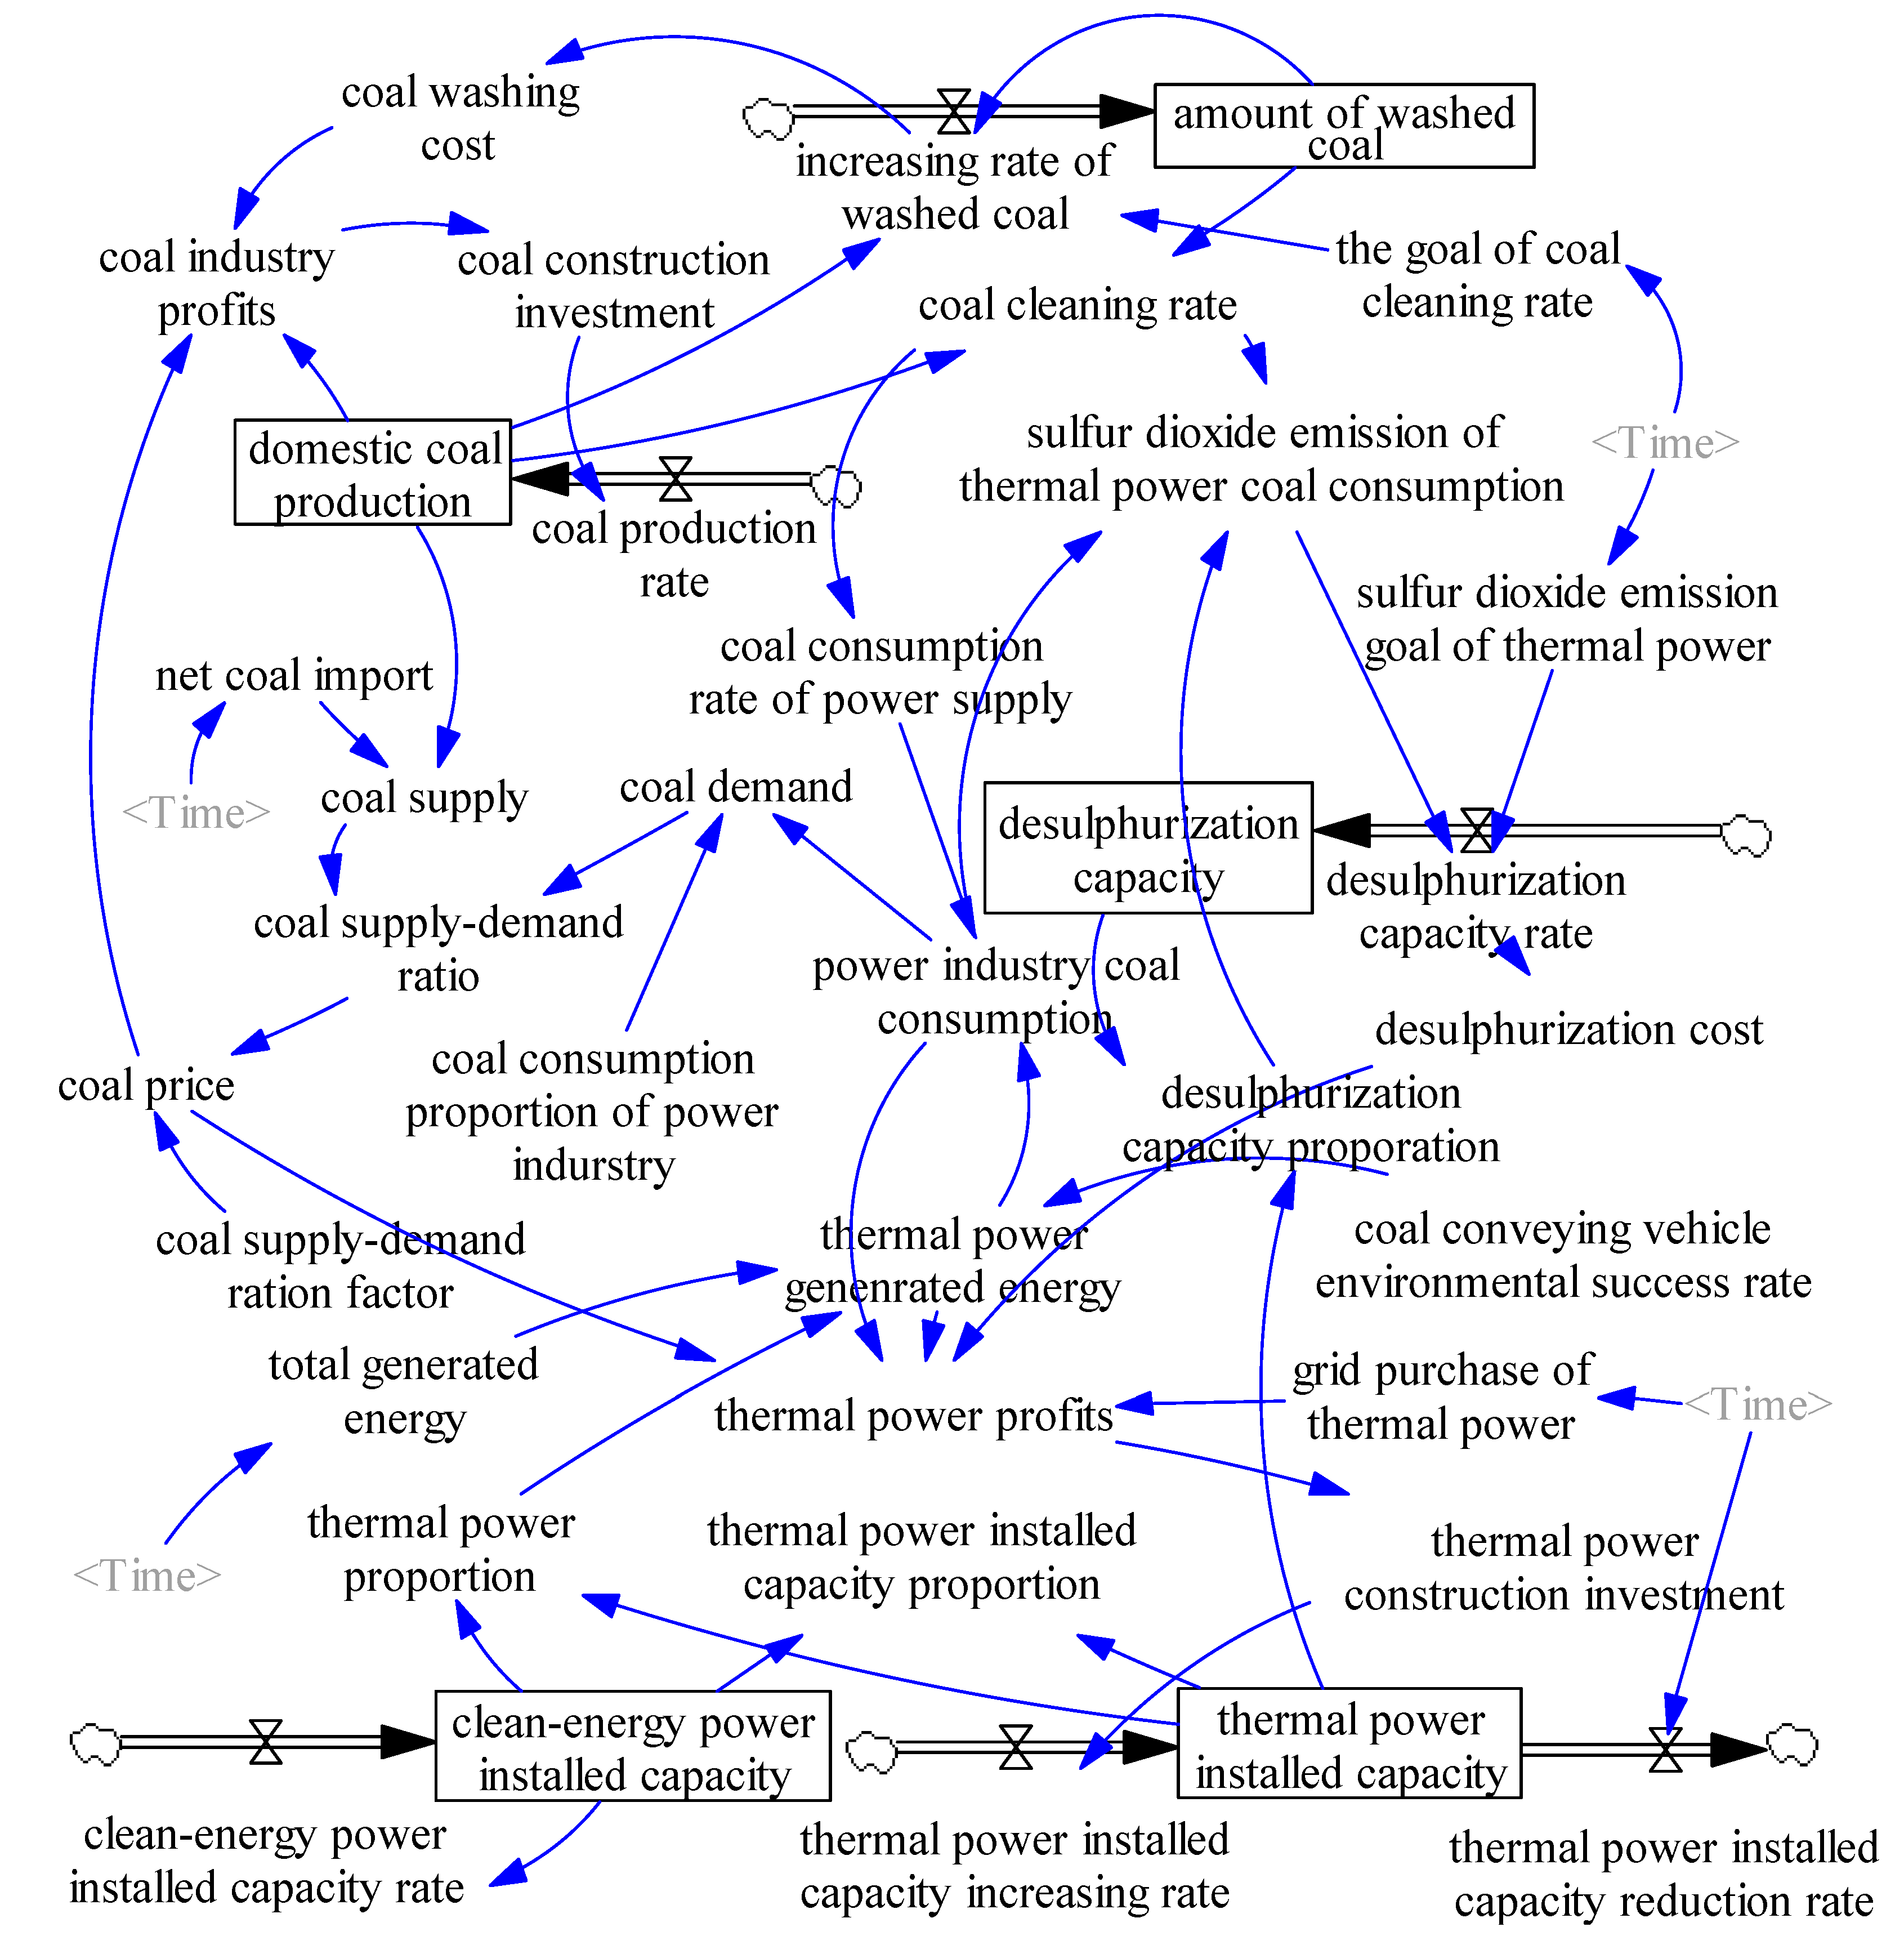
The Action Plan made it clear that in the future China will strengthen the environmental protection management of vehicles and forbid sales of environmental substandard vehicles. This policy had a limit on coal transportation vehicles. It may affect coal supplies, and even cut down the thermal coal supply chain.
The above policies will impact node enterprises of the thermal coal supply chain, and further impact upstream and downstream enterprises driven by principal–agent relationships, benefit distributions, and decision implementations of member enterprises. In the thermal coal supply chain, coal enterprises, power generation enterprises, and coal transportation enterprises are adjoined to one another and jointly realize the processes of thermal coal production, transportation, and consumption. So when one of these three parties is affected by air pollutant emission reduction policies, the other parties will be affected as well.
For thermal power generation enterprises, the policy of shutting down small thermal power plants and the prohibition on new coal-fired power projects will shrink the scale of the thermal power industry, thus reducing coal demand and influencing the income of the coal industry. The reduction in the coal supply will limit power generation enterprises’ coal selection. The deviation between the actual burning coal and the design coal can reduce power plant boiler efficiency and improve fuel costs of power generation enterprises. The increasing air pollutant emission pressure will encourage power generation enterprises to conduct the desulfurization and denitration renovation of units. These investments will reduce power generation enterprises’ profits. In addition, the rapid rise of clean energy power generation inevitably leads to a decrease in the thermal power installed capacity proportion. This shrinkage will surely decrease the proportion of thermal power generation and the profitability of the thermal power industry. If the thermal power industry pays a fixed proportion of its income towards investment in new construction, with no obvious changes in the unit installed costs of thermal power, the new thermal power installed capacity will be further reduced.
For coal enterprises, there are two kinds of air pollution reduction methods: one is coal-production reduction, and the second is coal washing [33]. The increase of coal washing equipment investment will enhance the coal enterprise investment risk, but it can also lower atmospheric pollutant emissions, such as sulfur dioxide and nitrogen oxides, in the process of coal combustion, and cut down the cost risk to thermal power generation enterprises by reducing atmospheric pollutant discharge. Meanwhile, the increase in washed coal will reduce the power supply coal consumption rate, thus reducing the fuel costs of the thermal power industry. Coal washing technology can remove about 50%–80% of the coal ash content. Every 1% reduction in the ash content in thermal coal brings 2–5 grams’ reduction in the standard power supply coal consumption rate. With respect to coal supply and demand, the reduction of thermal power generation will cut the coal demand, and thus affect the income and construction investment of the coal industry. The reduction of the coal production growth rate and the import limitation on inferior foreign coal will reduce the growth rate of the coal supply. The coal supply/demand situation tends to loosen, under air pollutant emission reduction policies. The falling coal price will further affect the benefits of coal enterprises.
For coal transportation enterprises, coal-conveying vehicles as important mobile pollution sources will probably be restricted by environmental protection indexes. Vehicles under environmental protection standard could not travel on the road. The policy will block coal transportations and influence the fuel supply of thermal power plants.
After analyzing policies, this study uses a causality loop to do the qualitative analysis of air pollution policies’ impact on the development of thermal coal supply chain member enterprises in China. The causality loop can be seen in Figure 1.
Figure 1. Causality loop of air pollutant emission policies’ impact.
Sustainability 07 00075 g001
A causality loop is a directed graph applied to analyze the interaction relationships between internal variables of a dynamic system [34]. It consists of several single causality chains. The causality chain representing positive effects is called the positive chain, with “+” next to the arrows. The causality chain representing negative effects is called the negative chain, with “−”next to the arrows. A causality loop is composed of multiple causal chains.
On the basis of the model structure analysis and causality loop, this study divided the system dynamics model of air pollution reduction policies’ impact on the development of thermal coal supply chain member enterprises into three modules according to the composition of the thermal coal supply chain. The main factors of the coal module are: amount of washed coal, increasing rate of washed coal, the coal washing cost, proportion of washed coal, proportion goal for washed coal, coal industry profits, coal construction investment, domestic coal production, the coal production rate, net coal import, coal supply, coal demand, coal supply/demand ratio, coal supply/demand ration factor, coal prices, coal consumption proportion of the power industry, and coal consumption of the power supply. The main factors of the power generation module are: thermal-power installed capacity, increase or decrease in the thermal power installed capacity, clean-energy power installed capacity, changing rate of clean-energy power installed capacity, total generated energy, thermal-power generation, proportion of thermal power generation, thermal power profits, thermal power construction investment, grid purchase of thermal power, coal consumption of the power industry, SO2 emission of thermal power coal consumption, SO2 emission goal of thermal power coal consumption, desulfuration capacity, desulfuration capacity changing rate, and desulfuration cost. The main factor in the coal transportation module is coal-conveying vehicles’ environmental success rate.
The confirmation of model factors and the qualitative analysis using causality loop lays a foundation for further quantitative analysis.

3.3. Model Design

After determining the causality loop and the main factors involved in it, this study begins the quantitative analysis of air pollution reduction policies’ impact on the node enterprises of the thermal coal supply chain in China by drawing a dynamic flow diagram. A dynamic flow diagram is used to depict the logical relationship between system factors with symbols [35]. This study uses a dynamic flow diagram to clear the feedback form and control the law of the system. Firstly, this paper classified the main factors determined by the causality loop according to their characteristics. Variables representing cumulative results are set as state variables. Variables representing the changing speed rate of state variables are set as rate variables. The rest of the relevant variables are set as auxiliary variables. This study uses Vensim_PLE software to establish the flow graph of air pollutant emission policies’ impact on the development of thermal coal supply chain member enterprises. The flow graph is shown in Figure 2.
The above system dynamics model of air pollutant emission policies’ impact on the development of thermal coal supply chain member enterprises contains five state variables, six rate variables, and 28 auxiliary variables including time. The upper part of Figure 2 is the coal module of this system dynamics model, and the lower part is the power generation module and the transport module. In Figure 2, the arrow direction indicates the transfer process of air pollutant emission policies’ impact between thermal coal supply chain member enterprises. The impact of policies is transmitted through the proportion goal of washed coal, the sulfur dioxide emission of coal-fired power plants, the shutting down capacity of small coal-fired boilers, and the desulfurization grid purchase price influencing the thermal power installed capacity and the coal supply/ demand situation. The Action Plan and other policies have clear plans relative to some key factors such as the goal of air pollutant emission and the installed capacity. So these four factors are expressed as time functions in the quantitative analysis of the system dynamics model. This study used the already built dynamics model of air pollutant emission policies’ impact on the development of thermal coal supply chain member enterprises to simulate the transfer process of air pollutant emission policy impact within the thermal coal supply chain during the period 2013–2022 and analyzed changing trends of various factors under the influence of policies during these decades.
Figure 2. Flow graph of air pollutant emission policies’ impact.
Sustainability 07 00075 g002
In order to perform quantitative analysis on the transmission of atmospheric pollutant emission policies’ impact in the thermal coal supply chain and simulate the changing trends of various internal factors under this influence, this study needed to further determine the function of variables on both ends of the arrow in the flow graph. Before determining the functional relationships, the initial value and unit of each factor have to be settled according to statistical data and actual situations. The variable category, variable name, initial value, and unit of variables in this system dynamics model are all shown in Table 1.
Table 1. Variable settings of system dynamics model.
Variable CategoryVariable NameInitial ValueUnit
state variableamount of washed coal205,000104 Ton
auxiliary variablecoal washing cost-108 Yuan
rate variableincreasing rate of washed coal-104 Ton
auxiliary variableproportion of washed coal--
auxiliary variableproportion goal of washed coal--
auxiliary variablecoal industry profits--
auxiliary variablecoal construction investment-108 Yuan
state variabledomestic coal productions357,357104 Ton
rate variablecoal production change rate-104 Ton
auxiliary variablenet coal import volume-104 Ton
auxiliary variablecoal supply-104 Ton
auxiliary variablecoal demand-104 Ton
auxiliary variablecoal supply/demand ratio--
auxiliary variablecoal supply/demand ration factor--
auxiliary variablecoal price-Yuan/Ton
auxiliary variablecoal consumption proportion of power industry--
auxiliary variablecoal consumption of power supply-g/KWH
state variablethermal power installed capacity819,000MW
rate variablethermal power installed capacity increasing rate-MW
rate variablethermal power installed capacity reduction rate-MW
state variableclean-energy power installed capacity323,940MW
rate variableclean-energy power installed capacity change rate-MW
auxiliary variabletotal generated energy-108 KWh
auxiliary variablethermal power generated energy-108 KWh
auxiliary variableproportion of thermal power generation--
auxiliary variableproportion of thermal power installed capacity--
auxiliary variablethermal power generation profits-108 Yuan
auxiliary variablethermal power construction investment-108 Yuan
auxiliary variablegrid purchase of thermal power-Yuan/KWH
auxiliary variablepower industry coal consumption-104 Ton
auxiliary variablesulfur dioxide emissions of thermal power coal consumption-104 Ton
auxiliary variablesulfur dioxide emission goal of thermal power coal consumption-104 Ton
state variabledesulfurization capacity753,480MW
rate variabledesulfurization capacity changing rate-MW
auxiliary variableproportion of desulfurization capacity --
auxiliary variabledesulfurization cost-108 Yuan
auxiliary variablecoal-conveying vehicle environmental success rate--
In Table 1, the initial value of the amount of washed coal, the dominant coal productions, the thermal power installed capacity, the clean-energy power installed capacity, and the desulfurization capacity are from China’s current situation as of 2012. The value of the proportion of washed coal, the sulfur dioxide emission goal of thermal power coal consumption, and the thermal power installed capacity reduction rate are controlled by time according to the relevant requirement of China’s air pollutant emission reduction policies. For example, the proportion of washed coal in 2012 is 56%, and The Action Plan pointed out that this proportion will reach 70% by 2017. This model assumes that the proportion of washed coal rises at a constant speed during the period 2012–2017, and by maintaining this rate continues to rise. In the simulation period of 2013–2022, the proportions of washed coal range respectively from 59%, 62%, 65%... 71%... 83% to 86%. For thermal power sulfur dioxide emissions targets, The Action Plan pointed out that the PM10 concentration will drop by more than 10% in 2017 compared to 2012. According to the relevant data, in 2012, China’s total carbon dioxide emission was 502 tons, and thermal power’s contribution to sulfur dioxide emission accounted for about 50%. This study also assumes that sulfur dioxide emission declines at a constant speed during these five years, and by maintaining this speed continues to decline. So, during the simulation period of 2013–2022, the sulfur dioxide emission goal of thermal power (10,000 tons) ranges from 250, 245, 240... 205 to 200. The Action Plan pointed out that China plans to weed out 50 MW of small thermal power units in 2012–2017. So the rate of thermal power unit elimination for these five years is 10 MW per year. The eliminating speed is expected to accelerate from 2018. So the eliminating capacity of thermal power unit during the period 2018–2022 is 12 MW per year. The total generating capacity and the coal imports during the simulation period are estimated from the regression analysis according to the historical data of 2000–2012. The prediction equations are:
G t = 3218.8 × ( Y e a r 1999 ) + 7613.9
I t = 2.8 + 0.4 × ( Y e a r 2012 )
where G t is the total generating capacity in year t and I t is the coal imports in year t .
The grid purchase of thermal power is estimated according to the desulfurization thermal power electricity price in 2012. So the grid purchase of thermal power is 0.45 yuan per kilowatt-hour in the first five year of simulation, and it decreases to 0.435 yuan per kilowatt-hour after 2017.
The system dynamics model of air pollutant emission reduction policies’ impact on the development of thermal coal supply chain member enterprises contains more than 30 functions among relevant variables. Due to the length limitation of this article, we only enumerate those functions with obvious characteristics and great significance to this study. Important functions of impact transfer are introduced as follows:
I R = C P × W G W C
where I R is the increasing rate of washed coal, C P is the domestic coal productions, W G is the proportion goal of washed coal, and W C is the amount of washed coal. Equation (3) shows that the increasing rate of washed coal is the difference between the proportion goal of washed coal and the actual amount of China’s washed coal.
T S = ( 1.6 × T C × 1.5 % ) × ( 1 P W × 0.3 ) × ( 1 D S × 0.9 )
where T S is the sulfur dioxide emissions of thermal power coal consumption, T C is the thermal power industry coal consumption, P W is the proportion of washed coal, and D S is the desulfurization capacity proportion.
S E = 1.6 × C C × C S × ( 1 D S × D E )
where S E is the SO2 emission during the coal combustion of thermal-power industry, C C is the power industry coal consumption, C S is the coal sulfur content (the sulfur content of China’s coal is about 1.5%), D S is the desulfuration capacity proportion, and D E is the desulfuration efficiency (China’s desulfuration efficiency is about 90%).
T P = G P × T G C P × T C / 10000 / 0.7 D C
where T P is the thermal power profits, G P is the grid purchase of thermal power, T G is the thermal power generated energy, C P is the coal price, T C is the thermal power industry coal consumption, and D C is the desulfuration cost. Fuel costs account for 70% of the total costs of thermal power plants.

4. Results and Discussion

This study analyzes the air pollution reduction policies’ impact on the node enterprises of the thermal coal supply chain by comparing trends of key model factors with and without policy influence. The Vensim_PLE software is used to set up the above system dynamics model and simulate tendencies of the variables during the period 2013–2022. The trend graph of Vensim_PLE software can reflect changing trends more intuitively. This article selects several important factors such as SO2 emissions of thermal power coal consumption, desulfurization capacity proportion, and the changing rate of thermal power installed capacity to measure the impacts of two typical kinds of air pollution reduction policies, and analyzes the changing developing modes brought by these two policies from multiple perspectives.

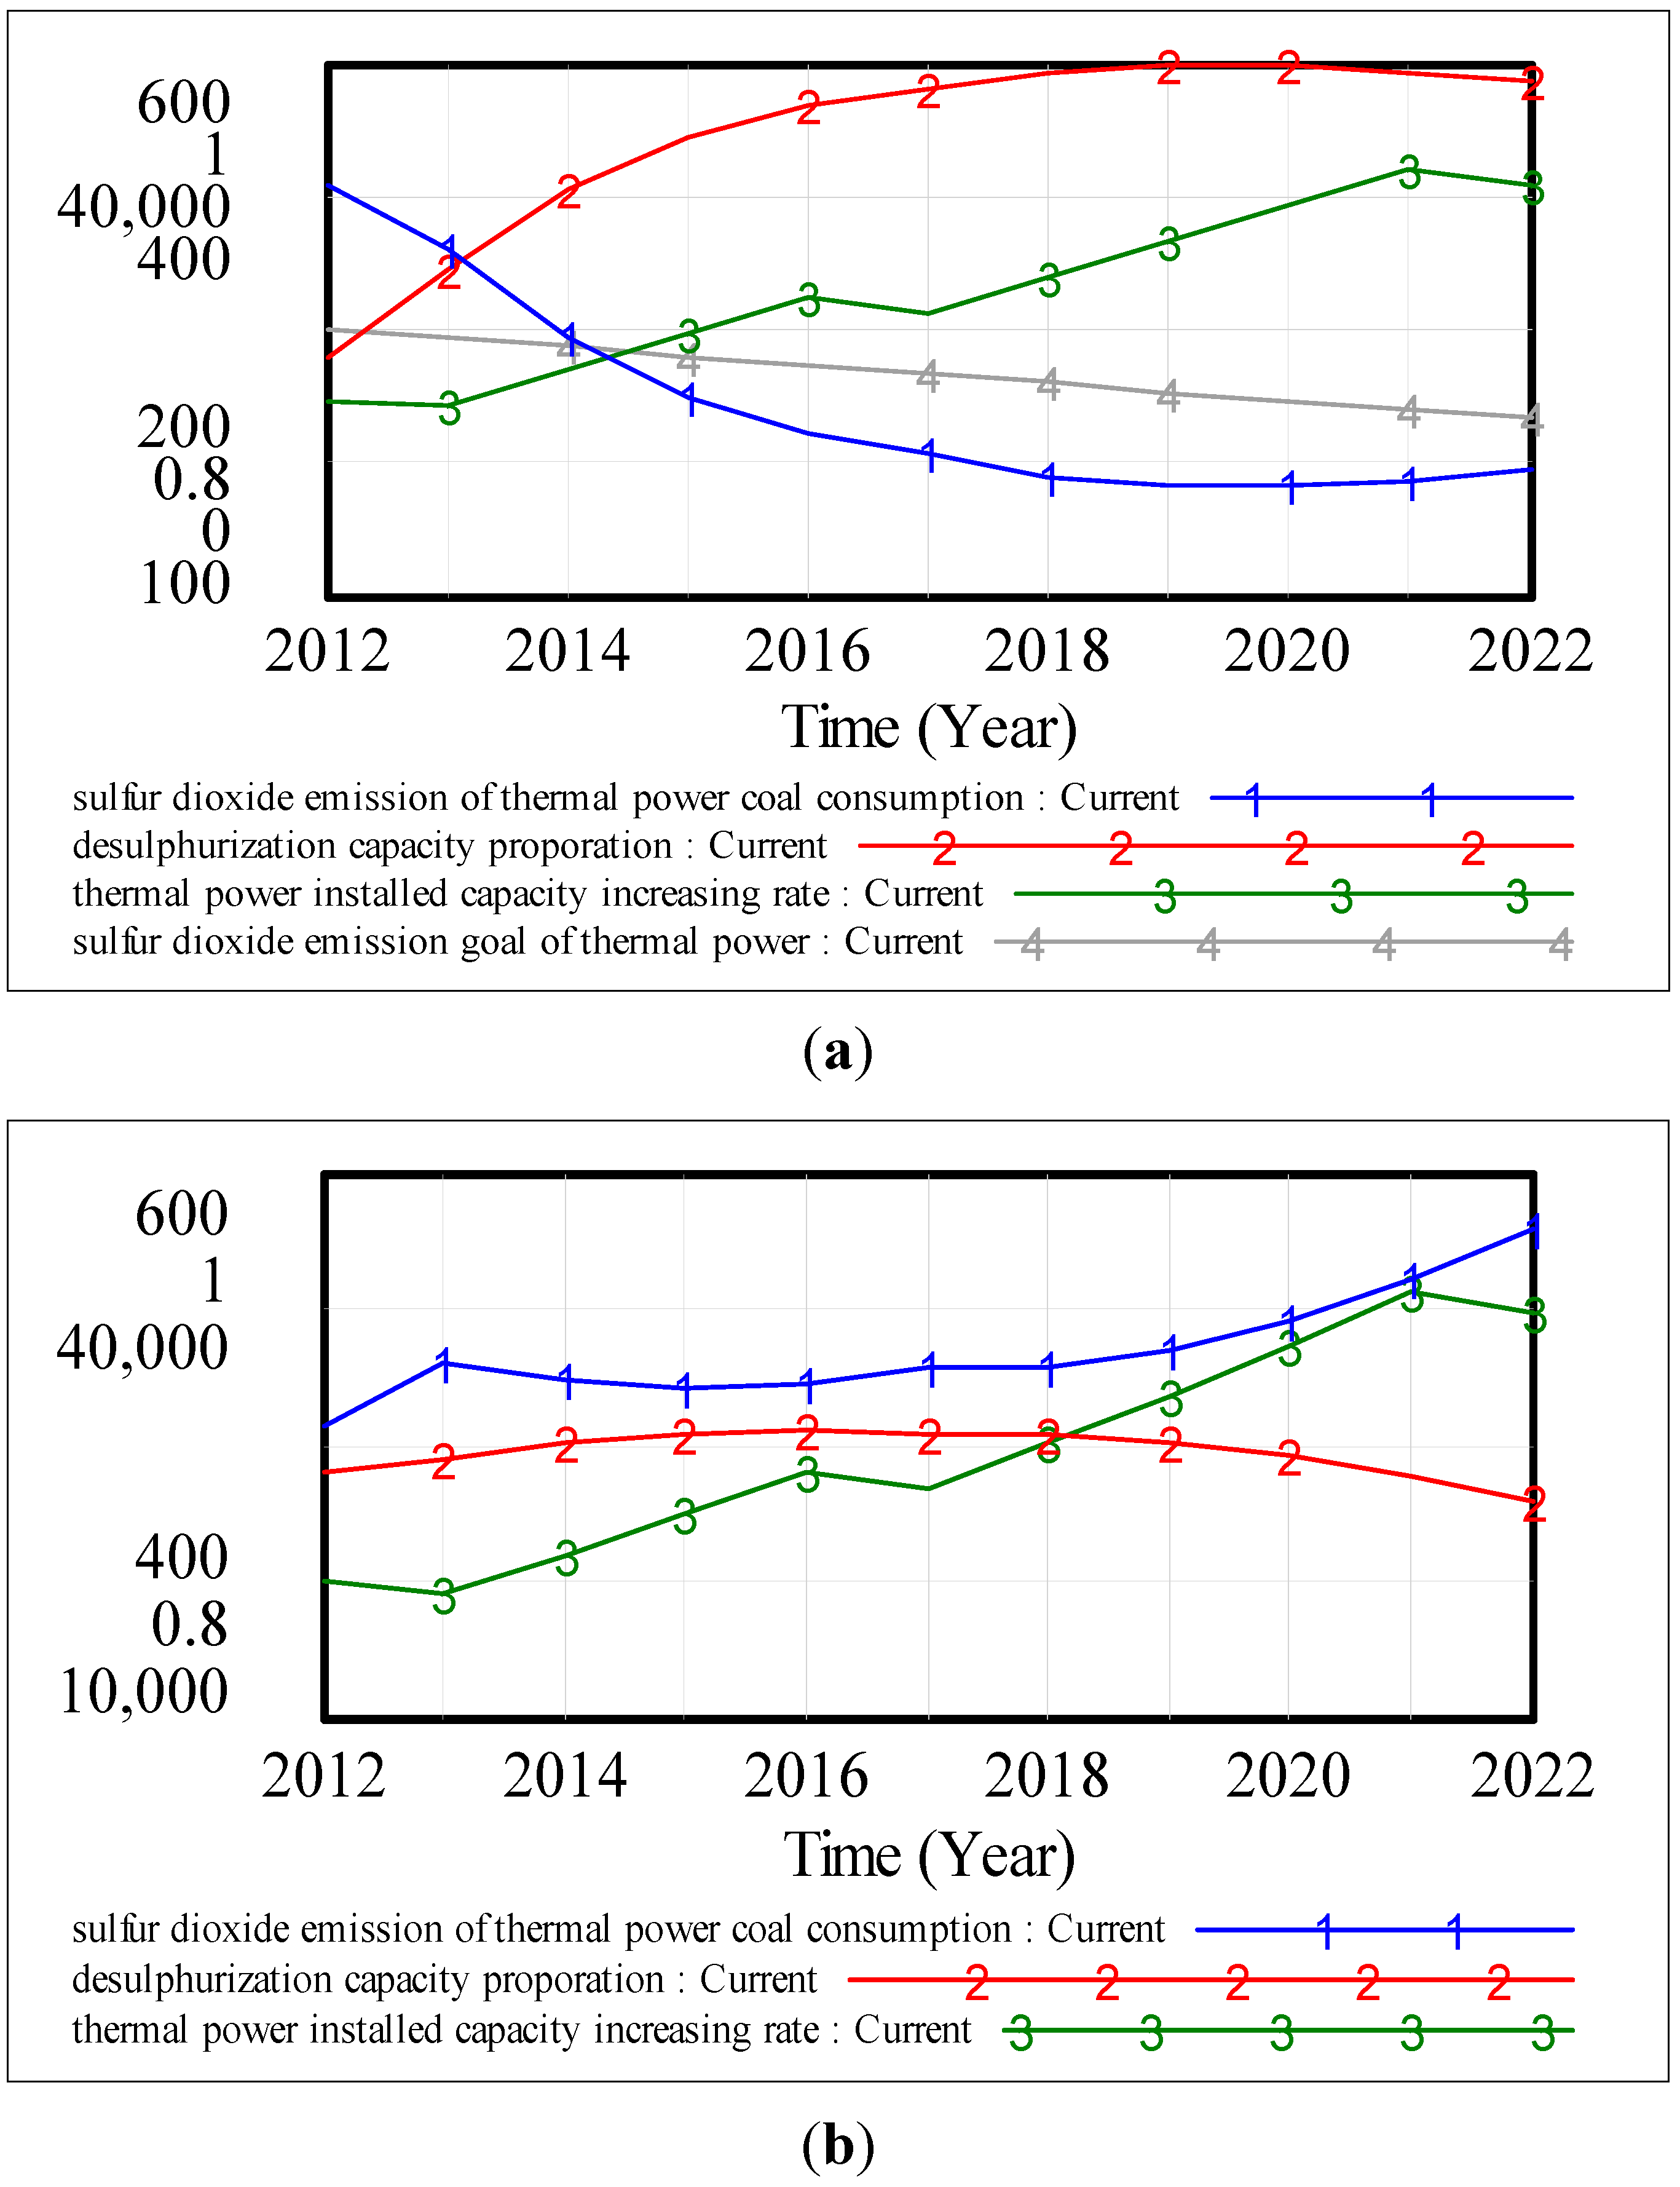
4.1. The Impact of Sulfur Dioxide Emission Target Policy

The Action Plan pointed out that the PM10 concentration will drop by more than 10% in 2017 compared to 2012. In the preceding part of this study, the SO2 emission goals of thermal power during the simulation period 2013–2022 have been settled according to the relevant data. The new desulfurization installed capacity of the thermal power industry is fixed to 20,000 MW per year without the influence of this policy. When affected by this emission target policy, the new desulfurization installed capacity of the thermal power industry equals 20,000 (MW per year) multiplied by the ratio of the actual SO2 emission and the emission goal of the thermal power industry. This paper analyzes the impact of emissions targets policy by comparing the changes of various factors with and without the constraints of this policy. The screenshots of simulation results using Vensim_PLE software are shown in Figure 3. Figure 3 displays the comparison results of SO2 emissions of thermal power coal consumption (curve 1), the desulfurization capacity proportion (curve 2), and the increasing rate of desulfuration capacity (curve 3). Part (a) shows the simulated results under the impact of SO2 emissions target policy and the annual SO2 emission target (curve 4) during the decade simulation period. Part (b) shows the simulated results without policy impact.
Without policy constraints on the thermal power industry, SO2 emission during coal combustion increases to the highest point of 5.7854 million tons in 2022. The desulfurization capacity proportion remains at around 89% with no obvious changes. The new desulfurization capacity increases from 17,566 in 2012 to 32,227 MW in 2022. Under the constraint of pollution emission targets, the SO2 emission reduced greatly in 2013–2017 and then started to level off. It decreased to the lowest point of 2.8284 million tons in 2019. The desulfurization capacity proportion was greatly increased in 2013–2017. This proportion will reach 99% since 2017. There is no obvious difference between the two simulation results of thermal power installed capacity increasing rate with and without the constraint of pollution emission policies.
Figure 3. (a) Simulated results under the influence of SO2 emissions target policy; (b) Simulated results without the influence of SO2 emissions target policy.
Sustainability 07 00075 g003
We can tell from the compared results that SO2 emission target policies will play an important role in reducing air pollutant emissions. SO2 emission during coal combustion of the thermal power industry will be reduced by about 3 million tons per year. This emission target policy also can lead to a significant increase in the desulfurization capacity proportion. It is estimated that China will nearly complete the desulfurized renovation of the thermal power industry in 2017 under the influence of SO2 emission target policy. As the result of space limitations, this paper only contrasts the changes in key factors. The SO2 emission target policy can also decrease the proportion of thermal power installed capacity by reducing coal industry profits and thermal power construction investment. In 2012, China’s thermal power installed capacity proportion is 71.6%. According to the simulated result, this proportion will decline steadily during the period 2013–2022. It will decrease to the lowest point of 62% in 2022. These structural changes are driven by the need for air pollution mitigation, not only in China but also in Europe and many developed countries [36]. After adjusting the parameters and variables based on the actual situation, this SD model can be used to simulate the policy impacts in all these countries. With the increasing of energy conservation and emission reduction policy’s intensity, countries like China will implement sustainable development strategies and accelerate the transformation of the power industry.

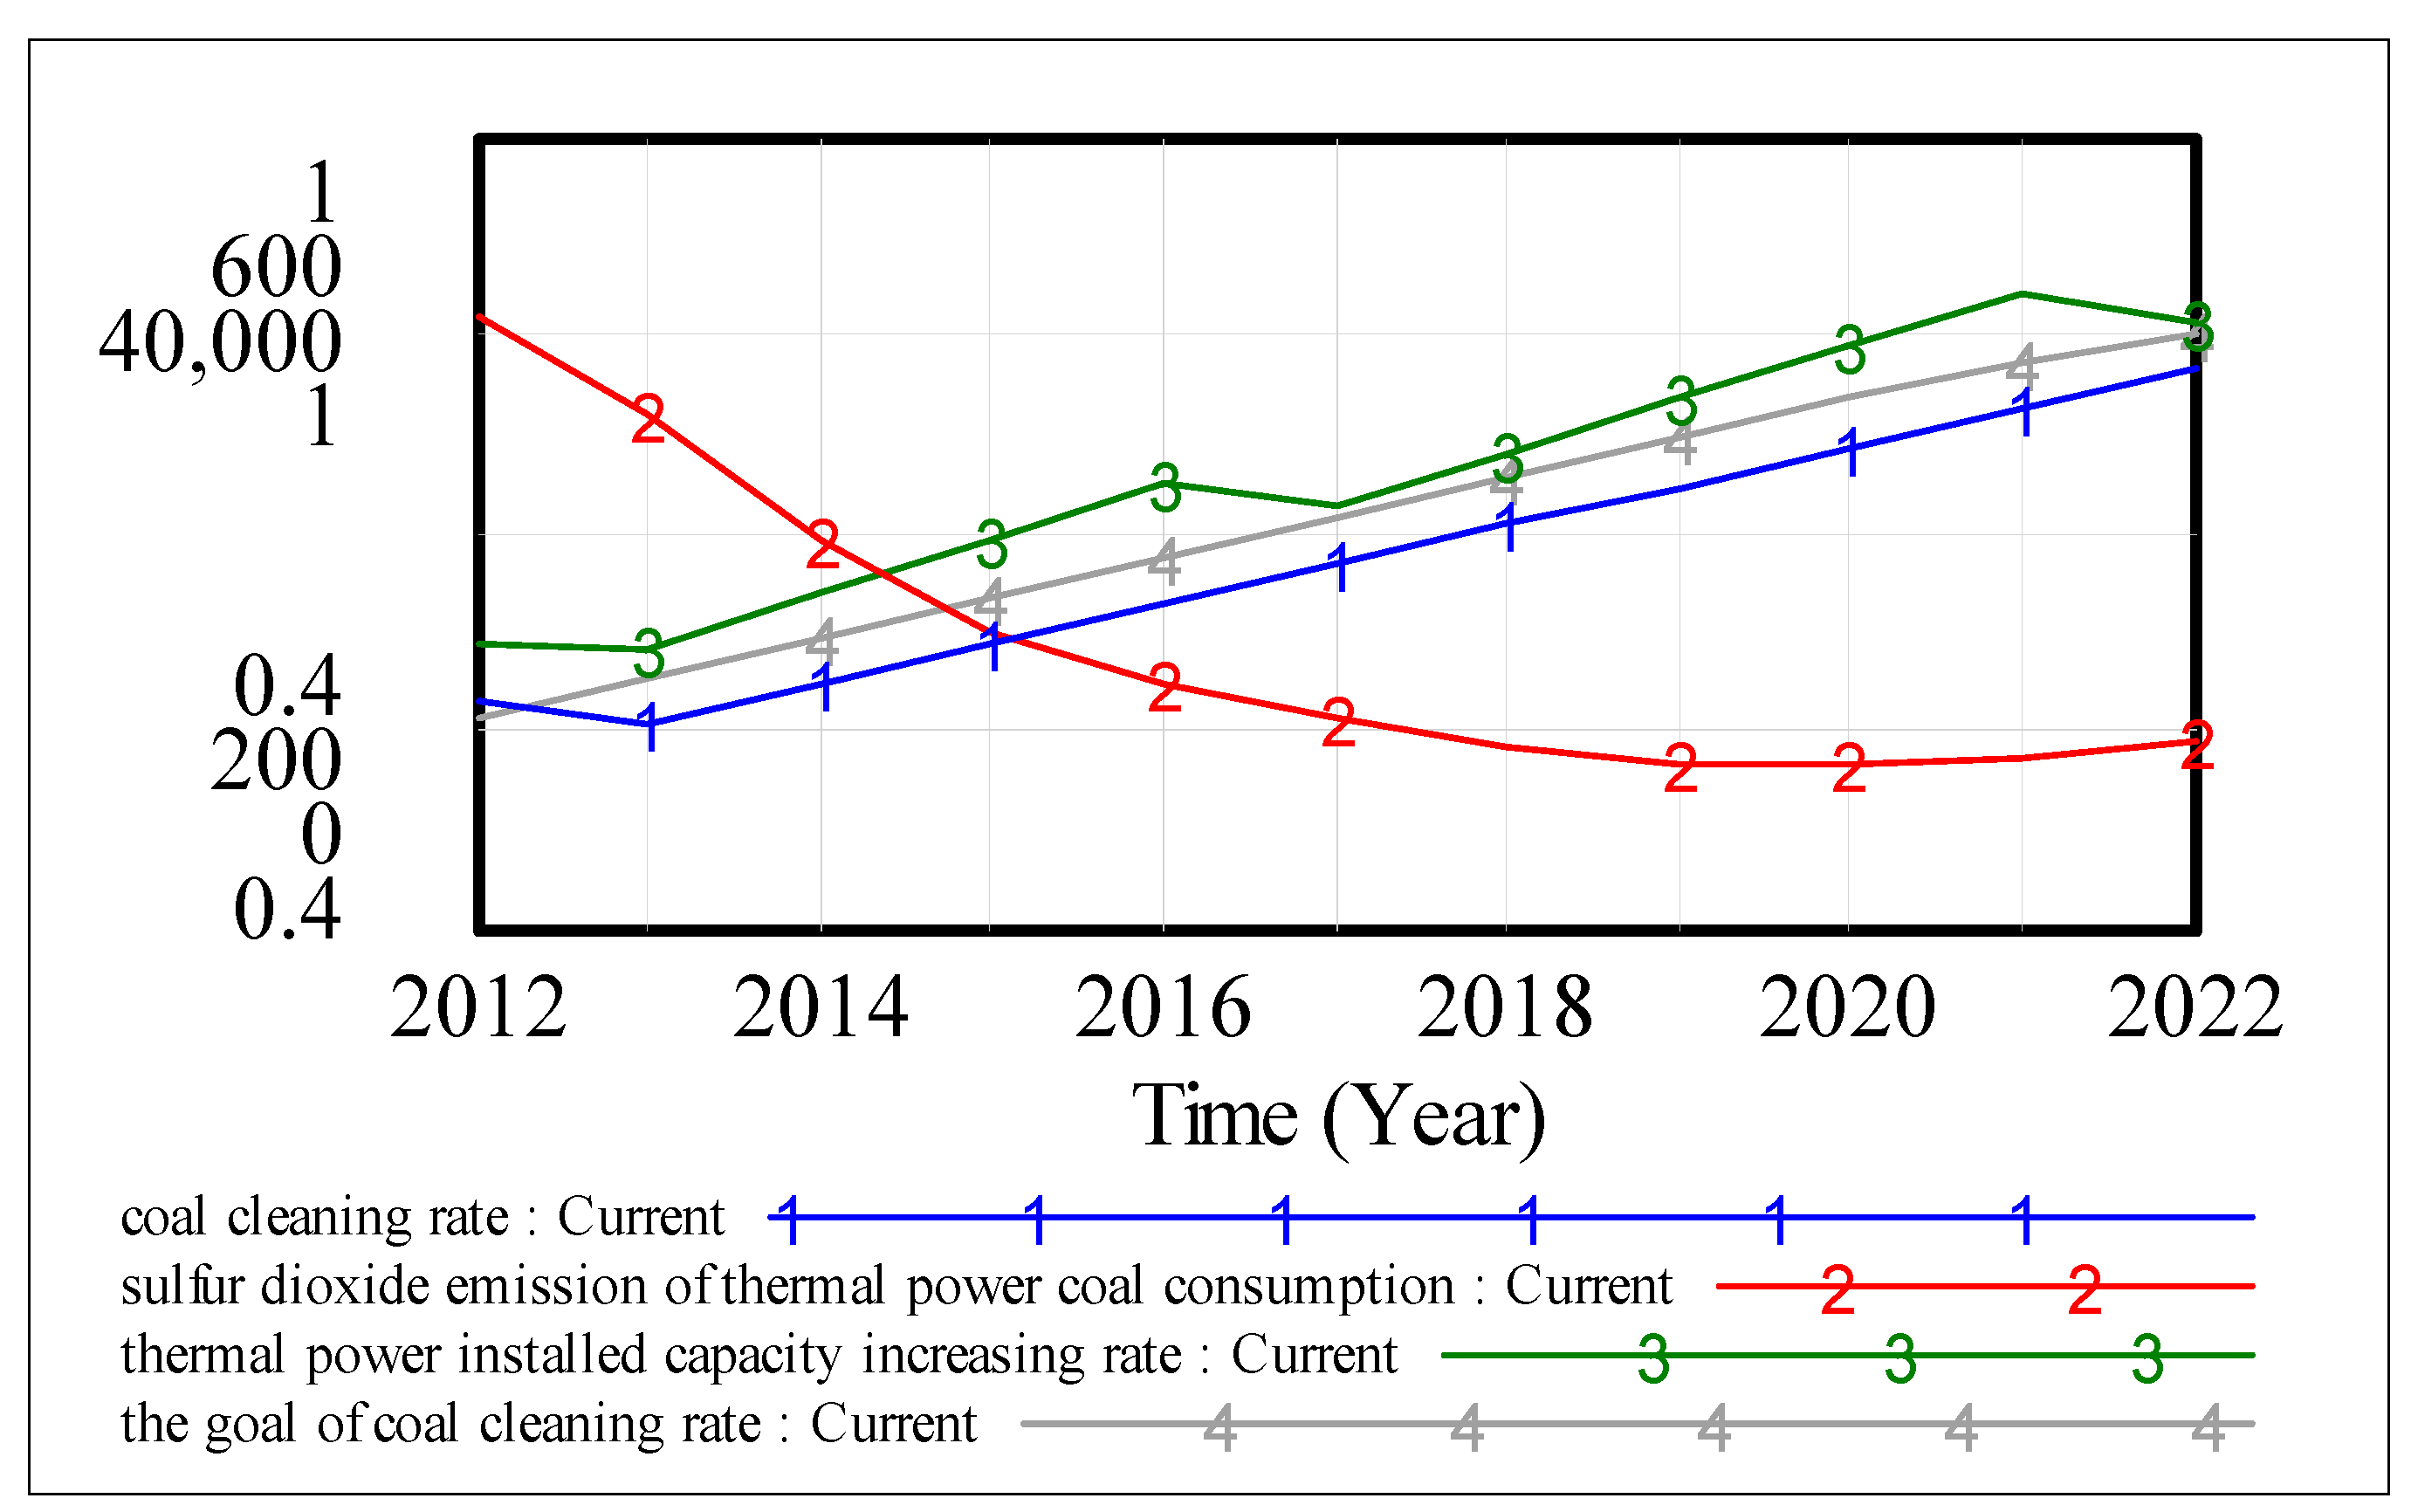
4.2. The Impact of Coal Washing Proportion Target Policy

The Action Plan clearly set up the target that washed coal should account for more than 70% of total coal production in 2017. In the preceding part of this study, the coal washing proportion goals of thermal power during the simulation period of 2013–2022 have been settled according to the relevant data. This paper assumes that the coal washing proportion target will increase at a constant speed from 56% in 2012 to 71% in 2017 and keep increasing at the same speed during the rest of the simulated period under the impaction of the coal washing proportion target policy. Without the policy’s influence, the coal washing proportion target will be fixed at 56% during the whole simulated period. The coal washing proportion goal influences the actual amount of washed coal by determining the increasing rate of washed coal. The increasing rate of washed coal equals the domestic coal production multiplied by the coal washing proportion goal. The amount of washed coal is the integral of washed coal’s increasing rate. This paper analyzes the impact of proportion targets policy by comparing the changes of various factors with and without the constraints of this policy. The screenshots of simulation results using Vensim_PLE software are shown in Figure 4. Figure 4 displays the comparison results of actual coal washing proportion (curve 1), SO2 emission during the coal combustion of the thermal power industry (curve 2) and the increasing rate of thermal power installed capacity (curve 3). Part (a) shows the simulated results under the impact of coal washing target policy and the annual goal of coal washing proportion (curve 4) during the simulation period. Part (b) shows the simulated results without the policy’s impact.
Figure 4. (a) Simulated results under the impact of washing coal proportion target policy; (b) Simulated results without the impact of washing coal proportion target policy.
Sustainability 07 00075 g004aSustainability 07 00075 g004b
Without the constraints of coal washing proportion target policy, the actual coal washing proportion is almost running at 56% during the simulated period. SO2 emission from the coal combustion of the thermal power industry has a slow decline of about 2 million tons. In addition, the new thermal power installed capacity is fluctuating around 14,500 MW for the simulated period. Under the constraint of the coal washing proportion target, the actual proportion of washed coal increases at a constant speed from 56% in 2012 to 82% in 2022. SO2 emission from the coal combustion of the thermal power industry has a sharp decline of more than 2 million tons and eventually stabilizes at about 2.9 million tons during the period 2013–2022. The new thermal power installed capacity will increase from 14,479 MW in 2012 to 30,720 MW in 2022.
We can tell from the simulated results shown in Figure 4 that the proportion target of washed coal established by air pollution reduction policies plays an important part in reducing SO2 emissions. SO2 emissions from the coal combustion of the thermal power industry will be reduced by about 2 million tons per year, which is less than the emission reduction driven by the emission target policy mentioned above. The formulation of a coal washing proportion goal makes the actual amount of washed coal increase by nearly 30%. In addition, the increase in washed coal can reduce the coal consumption rate in the power supply and improve the profits of the thermal power industry, and eventually lead to a slight rise in new thermal power installed capacity. At the same time, the sharp rise in clean energy power capacity will ensure that the power structure can shift in the sustainable development direction. The coal washing proportion goal policy can reduce the thermal power enterprise’s fuel costs and improve its profits so that the thermal power industry can put more money into the desulfurization and denitration reform of coal-fired units. In general, a coal washing proportion goal policy can promote energy conservation and the emissions reduction technologies of the coal and thermal power industries by economic means. More applications of energy conservation and emission reduction technology can reduce the energy intensity of the industry and reduce air pollutant emissions fundamentally.

5. Conclusions

This paper simulated the air pollution reduction policies’ impact on the thermal coal supply chain members in China by establishing SD models. These policies will greatly impact the development patterns of coal enterprises, power enterprises, and coal transportation enterprises. Moreover, the influence will transmit to the upstream and downstream enterprises along the thermal coal supply chain driven by business transactions and decision implementation. Besides China, many other countries (such as Japan and EU-27) have also made air pollution control policies, just like The Action Plan, to set emission targets and restrict coal consumption [37]. According to the simulated results, air pollution reduction policies can significantly improve air quality by promoting power structure adjustment and improving energy efficiency. As the main way of developing and utilizing non-fossil energy, the power industry will take the clean development route to coordinate sustainable development strategy. Under the pressure of air pollution reduction, the thermal power industry will implement the transformation of energy-saving and emission reduction ahead of time. These policies also provide coal washing technology and new energy power generation with good development opportunities. Renewable energy and nuclear electricity generation will have to a develop quickly to accelerate the structure adjustment of the electric power industry and realize the transformation of energy from fossil fuels towards clean energy. Therefore our simulation analysis of different policy interventions has meaning for countries that have not yet established their own air pollution control policies (such as India). In the future, in the promotion of long-distance transmission of electricity and coal, the distribution of coal in the power industry will be further optimized and the development of thermal coal supply chain members will be affected constantly. We can continue to analyze their development path under the new policy environment by adjusting the parameters and variables of the existing SD model.

Acknowledgments

Project supported by the Fundamental Research Funds for the Central Universities of China (No. MS201439).

Author Contributions

Xiaopeng Guo designed the study and revised the manuscript. Xiaodan Guo participated in designing the study, interpreted the data, wrote the manuscript and revised it until its final version. Jiahai Yuan provided good advices for conclusions and revised the manuscript.

Conflicts of Interest

The authors declare no conflict of interest.

References

  1. Xue, B.; Geng, Y.; Katrin, M.; Lu, C.; Ren, W. Understanding the Causality between Carbon Dioxide Emission, Fossil Energy Consumption and Economic Growth in Developed Countries: An Empirical Study. Sustainability 2014, 6, 1037–1045. [Google Scholar] [CrossRef]
  2. Frances, C.M. Climate Change and Air Pollution: Exploring the Synergies and Potential for Mitigation in Industrializing Countries. Sustainability 2009, 1, 43–54. [Google Scholar] [CrossRef]
  3. Zhao, X.; Ma, Q.; Yang, R. Factors influencing CO2 emissions in China’s power industry: Co-integration analysis. Energy Policy 2013, 57, 89–98. [Google Scholar] [CrossRef]
  4. Zhao, X.; Thomas, P.L.; Cui, S. Lurching towards markets for power: China’s electricity policy 1985–2007. Appl. Energy 2012, 94, 148–155. [Google Scholar] [CrossRef]
  5. Peggy, M.; Kenneth, B.K. Modelling tools to evaluate China’s future energy system—A review of the Chinese perspective. Energy 2014, 69, 132–143. [Google Scholar] [CrossRef]
  6. Liu, L.; Zong, H.; Zhao, E.; Chen, C.; Wang, J. Can China realize its carbon emission reduction goal in 2020: From the perspective of thermal power development. Appl. Energy 2014, 124, 199–212. [Google Scholar] [CrossRef]
  7. Tan, Z.; Zhang, H.; Shi, Q.; Xu, J. Joint optimization model of generation side and user side based on energy-saving policy. Electr. Power Energy Syst. 2014, 57, 135–140. [Google Scholar] [CrossRef]
  8. Cai, L.; Guo, J.; Zhu, L. China’s Future Power Structure Analysis Based on LEAP. Energy Sources Part A Recovery Util. Environ. Eff. 2013, 35, 2113–2122. [Google Scholar] [CrossRef]
  9. Zheng, M.; Zhang, K.; Dong, J. Overall review of China’s wind power industry: Status quo, existing problems and perspective for future development. Renew. Sustain. Energy Rev. 2013, 24, 379–386. [Google Scholar] [CrossRef]
  10. Hirota, K. Comparative Studies on Vehicle Related Policies for Air Pollution Reduction in Ten Asian Countries. Sustainability 2010, 2, 145–162. [Google Scholar] [CrossRef]
  11. Cai, W.; Wang, C.; Zhang, Y.; Chen, J. Scenario analysis on CO2 emissions reduction potential in China’s electricity sector. Energy Policy 2007, 35, 6356–6445. [Google Scholar] [CrossRef]
  12. Mathews, A.J.; Tan, H. The transformation of the electric power sector in China. Energy Policy 2013, 52, 170–180. [Google Scholar] [CrossRef]
  13. Wen, Z.; Li, H. Analysis of potential energy conservation and CO2 emissionsreductionin China’s non-ferrous metals industry from a technology perspective. Int. J. Greenh. Gas Control 2014, 28, 45–56. [Google Scholar] [CrossRef]
  14. Wang, K.; Wang, C.; Lu, X.; Chen, J. Scenario analysis on CO2 emissions reduction potential in China’s iron and steel industry. Energy Policy 2007, 35, 2320–2335. [Google Scholar] [CrossRef]
  15. SheikhiFini, A.; Parsa Moghaddam, M.; Sheikh-El-Eslami, M.K. A dynamic model for distributed energy resource expansion planning considering multi-resource support schemes. Electr. Power Energy Syst. 2014, 60, 357–366. [Google Scholar] [CrossRef]
  16. Zhu, H.; Huang, G. Dynamic stochastic fractional programming for sustainable management of electric power systems. Electr. Power Energy Syst. 2013, 53, 553–563. [Google Scholar] [CrossRef]
  17. Salman, A.; bin Razman, M.T. Using system dynamics to evaluate renewable electricity development in Malaysia. Renew. Electr. Dev. 2013, 43, 24–39. [Google Scholar]
  18. Li, L.; Sun, Z. Dynamic Energy Control for Energy Efficiency Improvement of Sustainable Manufacturing Systems Using Markov Decision Process. Cybern. Syst. 2013, 43, 1195–1205. [Google Scholar]
  19. Garcia, E.; Mohanty, A.; Lin, W.; Cherry, S. Dynamic analysis of hybrid energy systems under flexible operation and variable renewable generation-Part II: Dynamic cost analysis. Energy 2013, 52, 17–26. [Google Scholar] [CrossRef]
  20. Santiago, M.; Luis, J.M.; Felipe, B. A system dynamics approach for the photovoltaic energy market in Spain. Energy Policy 2013, 60, 142–154. [Google Scholar] [CrossRef]
  21. Ali, K.; Mustafa, H. Exploring the options for carbon dioxide mitigation in Turkish electricpower industry: System dynamics approach. Energy Policy 2013, 60, 675–686. [Google Scholar] [CrossRef]
  22. Feng, Y.; Chen, S.; Zhang, L. System dynamics modeling for urban energy consumption and CO2 emissions: A case study of Beijing, China. Ecol. Modell. 2013, 252, 44–52. [Google Scholar] [CrossRef]
  23. Li, F.; Dong, S.; Li, Z.; Li, Y.; Wan, Y. The improvement of CO2 emission reduction policies based on system dynamics method in traditional industrial region with large CO2 emission. Energy Policy 2012, 51, 683–695. [Google Scholar] [CrossRef]
  24. Nastaran, A.; Abbas, S. A system dynamics model for analyzing energy consumption and CO2 emission in Iranian cement industry under various production and export scenarios. Energy Policy 2013, 58, 75–89. [Google Scholar] [CrossRef]
  25. Özer, B.; Görgün, E.; Incecik, S. The scenario analysis on CO2 emission mitigation potential in the Turkish electricity sector: 2006–2030. Energy 2013, 49, 395–403. [Google Scholar] [CrossRef]
  26. Frederick, A.A.; David, O.Y.; Alex, A.P. A Systems Dynamics Approach to Explore Traffic Congestion and Air Pollution Link in the City of Accra, Ghana. Sustainability 2010, 2, 252–265. [Google Scholar] [CrossRef]
  27. Lin, B.Q.; Moubarak, M. Renewable energy consumption—Economic growth nexus for China. Renew. Sustain. Energy Rev. 2014, 40, 111–117. [Google Scholar] [CrossRef]
  28. Bloch, H.; Rafiq, S.; Salim, R. Economic growth with coal, oil and renewable energy consumption in China: Prospects for fuel substitution. Econ. Modell. 2015, 44, 104–115. [Google Scholar] [CrossRef]
  29. Shen, J.F.; Xue, S.; Zeng, M.; Wang, Y.; Wang, Y.J.; Liu, X.L.; Wang, Z.J. Low-carbon development strategies for the top five power generation groups during China’s 12th Five-Year Plan period. Renew. Sustain. Energy Rev. 2014, 34, 350–360. [Google Scholar] [CrossRef]
  30. Weller, F.; Cecchini, L.A.; Shannon, L.; Sherley, R.B.; Robert, J.M.; Altwegg, R.; Scott, L.; Stewart, T.; Jarre, A. A system dynamics approach to modelling multiple drivers of the African penguin population on Robben Island, South Africa. Ecol. Modell. 2014, 277, 38–56. [Google Scholar]
  31. Jose, B.C.; Tan, R.R.; Culaba, A.B.; Ballacillo, J.A. A dynamic input–output model for nascent bioenergy supply chains. Appl. Energy 2009, (Suppl. 1), S86–S94. [Google Scholar]
  32. Haghshenas, H.; Vaziri, M.; Gholamialam, A. Evaluation of sustainable policy in urban transportation using system dynamics and world cities data: A case study in Isfahan. Cities 2014, in press. [Google Scholar]
  33. Mao, X.Q.; Zeng, A.; Hu, T.; Xing, Y.K.; Zhou, J.; Liu, Z.Y. Co-control of local air pollutants and CO2 from the Chinese coal-fired power industry. J. Clean. Prod. 2014, 67, 220–227. [Google Scholar] [CrossRef]
  34. Wang, S.; Xu, L.; Yang, F.L.; Wang, H. Assessment of water ecological carrying capacity under the two policies in Tieling City on the basis of the integrated system dynamics model. Sci. Total Environ. 2014, 472, 1070–1081. [Google Scholar] [CrossRef] [PubMed]
  35. Rehan, R.; Knight, M.A.; Unger, A.J.A.; Haas, C.T. Financially sustainable management strategies for urban wastewater collection infrastructure–development of a system dynamics model. Tunnell. Undergr. Space Technol. 2014, 39, 116–129. [Google Scholar] [CrossRef]
  36. Bollen, J.; Brink, C. Air pollution policy in Europe: Quantifying the interaction with greenhouse gases and climate change policies. Energy Econ. 2014, 46, 202–215. [Google Scholar] [CrossRef]
  37. Kanada, M.; Fujita, T.; Fujii, M.; Ohnishi, S. The long-term impacts of air pollution control policy: Historical links between municipal actions and industrial energy efficiency in Kawasaki City, Japan. J. Clean. Prod. 2013, 58, 92–101. [Google Scholar] [CrossRef]

