1. Introduction
Ever since the Industrial Revolution took off in the 18th century, humanity’s infinite material and spiritual needs have been satisfied through continuous expansion of traditional economic scale, characterized by “mass production, mass consumption and mass abandonment” [
1]. Under such circumstances, a lot of problems have appeared to exert negative feedback on the normal functioning of social and economic activities [
2]. Therefore, how to achieve sustainable development has become a common life aspiration of all human beings [
3]. In China, environmental problems have become increasingly prominent, and the worsening conditions of the environment haven’t been well controlled [
4]. Therefore, sustainable development has become the basic guiding philosophy and national development strategy in China for coordinated development in social, economic and environmental aspects [
5].
Studies of sustainable development in other countries can be divided into two phases: phase I (1962–1992) represents the phase when the concept of sustainable development was proposed and its associated theories explored. United Nations Conference on Environment and Development was held in Rio de Janeiro in 1992, after which the implementation phase of sustainable development strategy was officially initiated. Since the concept of sustainable development has been put forward, how to define this concept and how to link this abstract concept with cognitive and practical methods become two major challenges [
6]. Meanwhile, the word sustainability with quantitative value, together with its related theoretical and practical studies, have become key components of study on sustainable development [
7]. Therefore, the assessment of sustainable development has become a hot and central research topic in the field of sustainable development [
8], and a series of theoretical and practical studies related to sustainability assessment have been done. In general, two types of assessment methods have been developed. The first type uses a single or composite index, whereas the second type applies multi-index system. Also, both types are still in the exploratory stage. Overall, the specific relationship between indexes and sustainable development goals, the determination of index weight and threshold, and the development of an integrated assessment method remains the core and challenge of any assessment system [
9]. In particular, how to establish a reasonable sustainability assessment system with an integrated assessment model, and how to study the contributions of human activities to the realization of the goal of sustainable development represent key and hot topics of current sustainable development research [
10].
In China, studies on sustainable development have started to track the trajectory of research on global sustainable development since the mid-1980s [
11,
12], which could be further divided into two parts, namely, theoretical studies and practical applications. Theoretical studies mostly focus on aspects such as the establishment of sustainability assessment system [
13,
14,
15], the analysis of coordination development in PRED (population, resources, environment and development) system [
16,
17,
18], and the assessment and determination of sustainability [
19,
20,
21]. By contrast, practical studies mostly focus on aspects such as regional coordination development in PRED system [
22,
23,
24], and the evolution of regional sustainability over time [
25,
26,
27]. Although the work of some scholars involves the spatial distribution aspect of sustainability [
28,
29], most work is simply static description with the lack of time content. Currently, research on China’s sustainable development is developing rapidly with a consistent deepening trend. As to regional practice, accompanying with the construction advance of national main functional zones, particularly with increasing environmental constraints that guide China’s future development, many counties and districts have put an emphasis on promoting the process of sustainable development, and quantitative characterization of sustainable development level and its development process is urgently needed [
30]. In order to promote the process of sustainable development towards a new height and to better draw lessons from experience, research on sustainable development field has displayed a gradual shift, namely, from a qualitative approach towards a quantitative approach, with an emphasis on the combination of such shift when factors of regional geography and environment are explicitly considered [
31]. Therefore, such process reflects a shift from traditional conceptual models towards specific regional models [
32], and a shift from static pattern study towards dynamic process study [
33].
Overall, relevant studies have achieved a lot, although some problems and deficiencies still exist. First, studies that focus on the integration of spatial and temporal aspects of sustainable development are still lacking. Also, among existing research results, studies that have taken spatial and temporal dimensions into account simultaneously in order to conduct an integrated study on the evolution of sustainable development are extremely rare. By contrast, most current studies are testing the evolution patterns of sustainable development at temporal scale, although research on sustainable development should ultimately focus on specific geographic regions, or, in other words, research on the evolution of sustainable development at spatial scale is equally important. Second, many problems have been found regarding the assessment system of sustainable development, including mismatches between theory and practice, huge number of index systems, overemphasis on economic assessment, overlook of resource and environment assessment, and the failure of index selection process to truly implement the concept of sustainable development. To a certain extent, the present paper attempts to solve some of these problems by providing some complementary work.
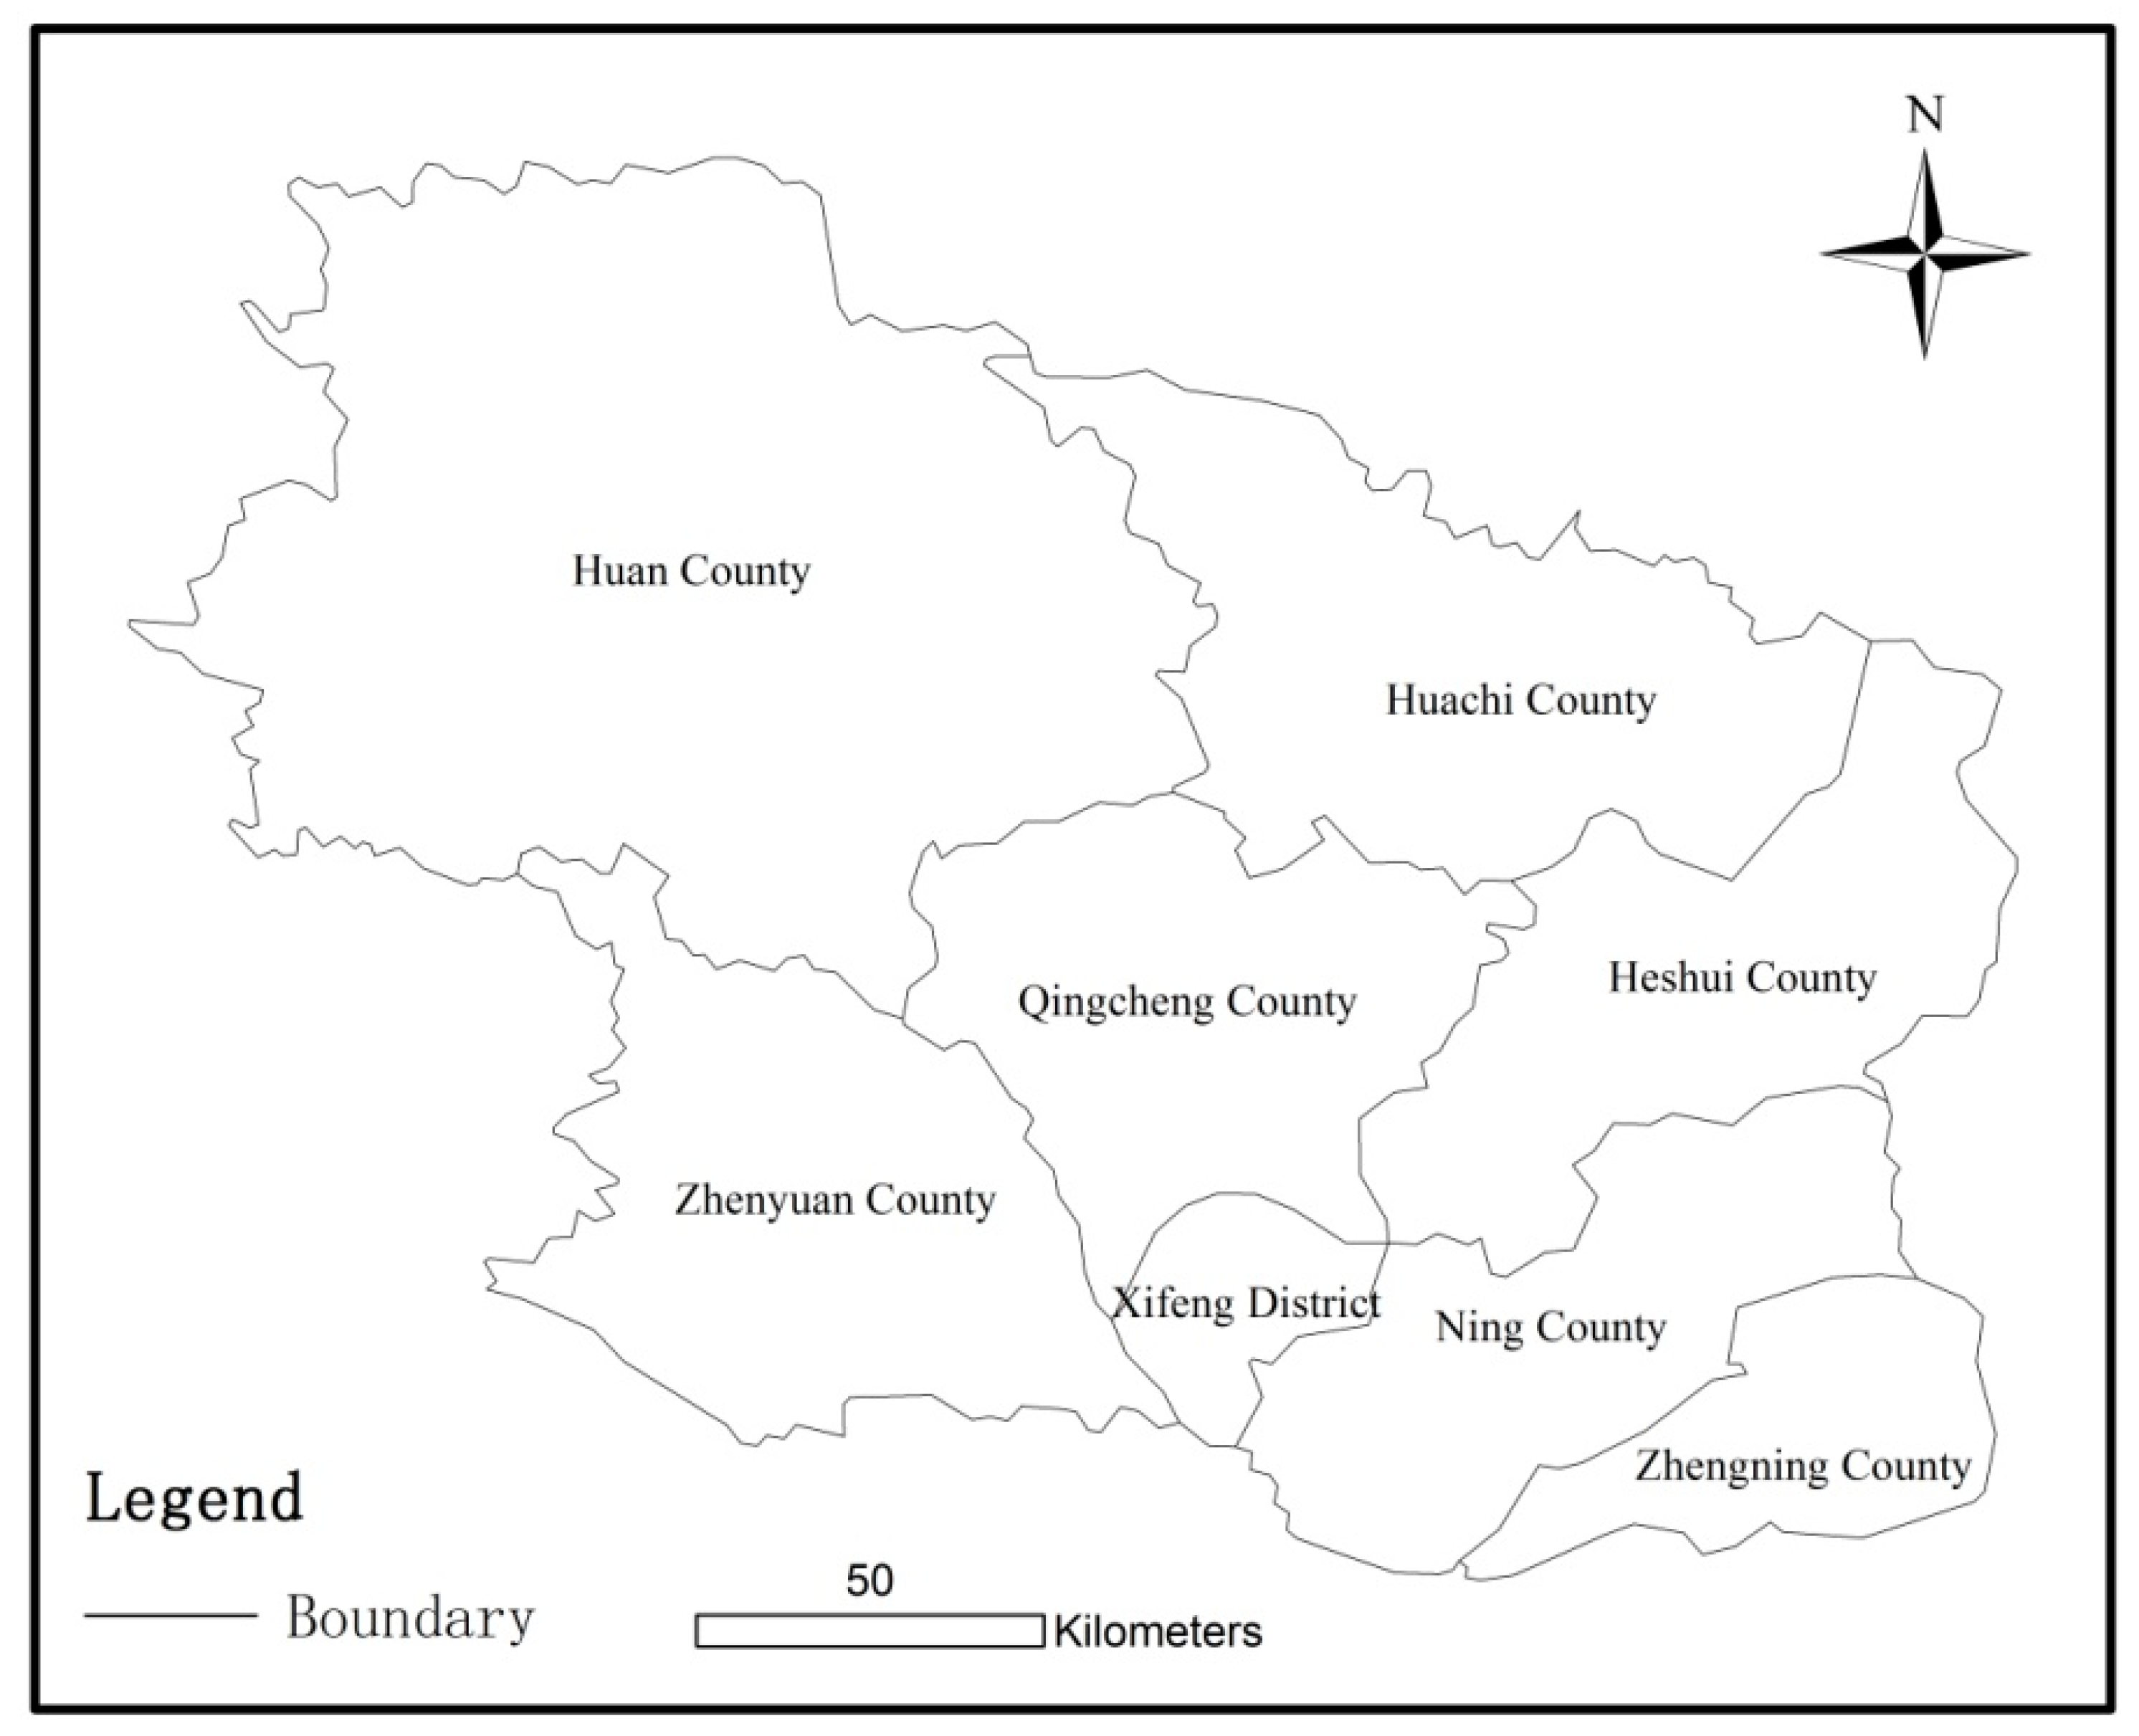
In the present paper, Qingyang City is used as the case study region. Qingyang is located in Loess Plateau zone of eastern Gansu Province, and represents a typical gully region of China’s Loess Plateau. The administrative division in Qingyang City includes eight sub-regions, seven counties and one district (
Figure 1). It belongs to semiarid region due to the lack of surface water. Thanks to natural conditions and human economic activities, the ecological environment is fragile in this region [
34]. In terms of economic structure, agriculture has played a dominant role in Qingyang. In recent years, as Qingyang becomes an important component of Ordos-based national energy industrial base and the energy and chemical industry base of eastern Gansu Province, the contribution of industry to national economy has exceeded that of agriculture. Meanwhile, traditional agriculture-based industrial structure has been broken, leading to the transition between agriculture and industry, as well as the rapid development of local economic structure [
35]. However, with the deepening of the transition between the agriculture and industry, contradictions among aspects such as regional population, economy, society, resources and environment become increasingly acute, and man-land relationship has deteriorated rapidly in Qingyang. Also, accompanied with the emergence of a series of ecological and environmental problems, many issues begin to arise from both natural and anthropogenic disturbance. It is not surprising that both the complexity of the integrated system and regional sustainable development have met severe challenges [
36]. Worse still, constraints imposed by resources and environment on economic and social development become more and more severe, and contradictions between local resource development and environmental pressure become more and more acute. Equally, the capacity for sustainable development is worrisome. In particular, the lack of water resources and quality in Qingyang has been worsened by a groundwater pollution problem due to oil extraction, which has caused increasingly grim situation of water resource, and seriously restricted economic, social and sustainable development. In fact, a series of core issues related to sustainable development, such as the transition of industry structure, the deterioration of ecological environment, and the transformation of social structure, has been commonly found in the ecologically fragile area of China’s Loess Plateau [
37]. Therefore, we must stand on the height of sustainable development, and wisely handle the coordinated and balanced development in terms of regional population, economy, society, resources and environment.
Figure 1.
The administrative map in Qingyang City.
Figure 1.
The administrative map in Qingyang City.
In this paper, the assessment index system and the integrated assessment models with temporal and spatial scale explicitly considered are established, with existing research results and regional characteristics as the basis. Also, the application of GIS technology allows a successful integration of both spatial and temporal dimensions so that a study on synthetic measurement of sustainable development evolution in ecologically fragile area of China’s Loess Plateau could be facilitated, the process of two-dimensional analysis and integration could be carried out, and deficiencies in the existing research could be compensated. Overall, the present paper has strong theoretical and practical significance, and could contribute to the understanding, revealing and solving of a series of problems that exist during the process of sustainable development, just as what Qingyang is experiencing now. In this sense, this paper could provide theoretical support and decision-making basis for achieving sustainable development strategies.
2. Methodology
2.1. The Establishment of the Index System
The assessment index system of sustainable development is the basis for an integrated assessment of regional sustainable development. As it concerns the division of regional sustainable development, it is generally considered an improvement based on PRED system. According to the conception of PRED, the system is divided into two subsystems (
i.e., the economy and the society) in the present study so that the characteristic of regional sustainable development could be reflected more clearly. In a word, based on geographical features as well as actual situations, draw on existing achievements, and followed the integrated, systematic, representative, concise, accessible and practical principles [
38,
39], the present paper chooses corresponding indexes from five aspects, namely, the population, economy, society, environment and resources, and then establishes the four-category index system that reflects the sustainability level of ecological fragile area in China’s Loess Plateau.
According to the criterion layers of scale, structure and health level of the population, 5 indexes are selected for the population system. In addition to these criterion layers, the quality of the population is always counted as the criterion layer, which could reflect the educational status of local people. Since the educational status of local people is reflected in a social system, it is not selected for the population system. Since all the selected indexes are reasonable, the criterion layers could be embodied by index layers, and the characteristics of the population system could be reflected accurately by these criterion layers and index layers.
According to the criterion layers of scale, structure, efficiency and openness of economy, 9 indexes are selected for the economic system. Since 4 criterion layers and 9 index layers are commonly selected for the economic system in the literature, they are both representative and reasonable. The criterion layers can be embodied by index layers relatively. Overall, the characteristics of the economic system could be reflected accurately by these criterion layers and index layers.
According to the criterion layers of quality of people’s lives, social development level, and social activity, 9 indexes are selected for the social system. Since 3 criterion layers are commonly selected for the social system in the literature, they are both representative and reasonable. Also, the 9 selected index layers are reasonable. Due to the lack of sufficient data, several indexes are not selected as the criterion layers of social development level (e.g., the percentage of social insurance coverage). Overall, the characteristics of society system can be reflected clearly by these criterion layers and index layers.
According to the criterion layers of natural resources and social resources, 7 indexes are selected for the resource system. Two criterion layers are selected based on the basis of resource classification, and they are both representative and reasonable. However, the index layers are not ideal for the resource system. Due to the lack of sufficient data, several significant indexes are not selected (e.g., the indexes of water resource and energy consumption). Overall, the characteristics of the resource system could be reflected accurately by these criterion layers and index layers.
According to the criterion layers of environmental pollution and protection, 8 indexes are selected for the environmental system. Since 2 criterion layers are commonly used in the literature, they are representative and reasonable. Also, the selected 8 index layers are reasonable. Due to the lack of sufficient data, several indexes are not selected as the criterion layers of environmental protection (e.g., the harnessing percentage of soil and water loss). Overall, the characteristics of the environmental system could be reflected accurately by these criterion layers and index layers.
Meanwhile, index attributes are categorized. If the larger an index value is, regional sustainable development is more likely, such index is then named a positive index, notated as “+”. By contrast, if the larger an index value is, regional sustainable development is more unlikely, such index is then named a negative index, notated as “−” (
Table 1).
Table 1.
The assessment index system of sustainable development.
Table 1.
The assessment index system of sustainable development.
| System Layer | Criterion Layer | Index Layer | Attributes (+ or −) |
|---|
| Population system | Population scale | Population size (A1) | − |
| Population density (A2) | − |
| Natural population growth rate (A3) | − |
| Population structure | The percentage of non-agricultural populations (A4) | + |
| Health level | The average life expectancy (A5) | + |
| Economy system | Economic scale | GDP per capita (B1) | + |
| Economic density (B2) | + |
| Per capita investment in fixed assets (B3) | + |
| Per capita financial income (B4) | + |
| GDP growth rate (B5) | + |
| Economic structure | The share of primary industries in GDP (B6) | − |
| The share of third industries in GDP (B7) | + |
| Economic efficiency | Input-output ratio (B8) | + |
| Economic openness | Total imports and exports (B9) | + |
| Society system | The quality of people’s lives | Per capita net income of farmers (C1) | + |
| Per capita living expenditure of farmers (C2) | + |
| Per capita disposable income of urban residents (C3) | + |
| Per capita consumption expenditure of urban residents (C4) | + |
| Social development level | The number of people engaged in scientific research every 10,000 people (C5) | + |
| The number of students enrolled every 10,000 people (C6) | + |
| Per capita dwelling area (C7) | + |
| Per capita telecommunications services (C8) | + |
| Social activity | Total retail sales of social consumer goods (C9) | + |
| Resource system | Natural resources | Per capita arable land area (D1) | + |
| Per capita garden land area (D2) | + |
| Per capita forest land area (D3) | + |
| Per capita grassland area (D4) | + |
| Per capita food production (D5) | + |
| Social resources | Available health technical personnel every 10,000 people (D6) | + |
| Available hospital beds every 10,000 people (D7) | + |
| Environment system | Environmental pollution | Total amount of wastewater discharge (E1) | − |
| Total amount of industrial solid waste emissions (E2) | − |
| Total amount of industrial waste gas emissions (E3) | − |
| The fertilizing intensity of chemical fertilizer (E4) | − |
| Environmental protection | Industrial wastewater discharge-related compliance rate (E5) | + |
| Integrated utilization rate of industrial solid waste (E6) | + |
| Smoke and dust emissions related compliance rate (E7) | + |
| Capacities of waste gas treatment facilities (E8) | + |
In order to ensure that the data could reflect actual situations of the studied area as much as possible, and to eliminate possible effects of different index dimensions on assessment results, extreme values are standardized so that assessment indexes are dimensionless [
40]. The calculation formula is:
Positive index: the larger the index value is, the better it is.
Negative index: the smaller the index value is, the better it is.
In this formula, is the standardized value of ; is the actual value of the administrative unit i and indexical stage j; and represent the maximum and minimum value, respectively, of the same index at different administrative unit and stage.
2.2. Integrated Assessment Model
There are lots of models for the assessment of regional sustainable development, and they could be generally divided into 2 types. The first type puts an emphasis on sustainability measurement, which is commonly used to evaluate the level or the capacity of regional sustainable development. The second type puts an emphasis on coordination measurement, which is used to evaluate the coordination development status among different indexes or different systems. Generally speaking, both types tend to put an emphasis on certain aspects of regional sustainable development, and thus are unilateral or non-comprehensive. In this study, an integrated assessment model based on these 2 types is used for a comprehensive evaluation of regional sustainable development. One obvious advantage of this model is that it can be used for a comprehensive assessment of regional sustainable development based on the aspects of sustainability and coordination measurement, and the results of comprehensive measurement could be quantified. Theoretically and empirically, this model is more reasonable than other alternatives. Therefore, this integrated assessment model with 4 components is selected for the present study.
2.2.1. Index of Sustainable Development
Principal component analysis is applied to eliminate possible redundant information among various indexes, to extract important factors, and to calculate the contribution of each index. Then, by using a weighted linear model, the composite score, namely, the index of sustainable development level in each subsystem is calculated [
41].
In this formula, Fm represents the index of sustainable development level in each subsystem, m represents the number of subsystems; n represents the number of principal components in each subsystem; Wj represents the contribution level of each principal component in each subsystem; Xj represents the score of all principal components in each subsystem.
The integrated index value of sustainable development level could reflect the integrated level of regional sustainable development. Based on obtained index values of sustainable development in various subsystems, weighted linear models are used for measurement purpose [
41]:
In this formula, SDI represents the integrated index of regional sustainable development; Fm represents sustainable development level of each subsystem αj represents the weighted value of each subsystem. In the present study, the coordination degree needs to be measured. Since the conception of coordination degree is based on the equal importance of each subsystem, here it is assumed that all five subsystems are equally important, and each subsystem is assigned the value 0.2.
2.2.2. Sustainability Degree
Sustainability degree is the criterion used to measure regional sustainable development and the sustainability of each subsystem. Usually, the developmental rate of each subsystem is used as the calculation criterion [
42]:
In this formula, SI represents the sustainability of regional sustainable development; S(t-i) represents the developmental rate of the system during the time span of t-i~; ; T represents the reference period.
2.2.3. Coordination Degree
Since the developmental process of a system is dynamic, the coordination degree is used to quantify the coordinated development degree of interactive factors within or among systems. Therefore, the coordinated development degree among regional systems could be quantified and determined through the calculation of coordination degree. In the present paper, principal component analysis, simulate regression model and the membership function of fuzzy mathematics are used to assess the coordination degree among subsystems. Based on the development index of each subsystem, regression curve fitting process could provide the predictive value of sustainable development index of each subsystem, namely, the coordination value, and the coordination degree between subsystems could be calculated then using both the coordination value and the membership function of fuzzy mathematics [
43].
In this formula, is the state coordination degree of system relative to system ; is the development index of system (the actual value); is the predictive value of best development degree of system relative to system (the coordinated value); is the variance of system .
The coordination degree between two systems,
U(i,
j), could be calculated via coordination degree, with the specific formula shown as following [
43]:
In this formula, represents the coordination degree between system i and system j; represents the state coordination degree of system i relative to system j; represents the state coordination degree of system j relative to system i. , and the more it is close to 1, it is more coordinated between system i and system j. Otherwise, it is more non-coordinated.
The coordination degree among more than three systems could be calculated as shown below [
43]:
In this formula, is the number of subsystem; is the set of any k−1 subsystem except for system i; is the state coordination degree imposed by subsystem i on any k−1 subsystem; is the coordination degree of any k−1 subsystem except for system i.
According to the obtained formula used for calculating the coordination degree, when the actual value is more close to the coordinated value, the larger the coordination degree is, and the entire system is with higher coordination degree. Otherwise, the system is with lower coordination degree. Also, with reference to relevant literature [
40], the coordination degree of a system could be categorized as four levels, namely, extremely uncoordinated, uncoordinated, barely coordinated and coordinated (
Table 2).
Table 2.
Metrics for the coordination degree.
Table 2.
Metrics for the coordination degree.
| 0~0.50 | 0.50~0.85 | 0.85~0.95 | 0.95~1 |
|---|
| Extremely uncoordinated | Uncoordinated | Barely coordinated | Coordinated |
2.2.4. Tendency Degree
Tendency degree refers to the maintaining or sustainable ability of a regional system, and is commonly used to measure and determine whether a regional system is developed towards a healthy direction or not. Therefore, it is an integrated indicator and an inherent union of system development, continuity and coordination [
42]:
In this formula, S is the tendency degree of sustainable development; SDI, SI and U represent the integrated index of sustainable development degree, sustainability degree and coordination degree. Since the present paper assumes that all three are equally important, α1, α2 and α3 is with same weighted value, and the weighted average method is used to calculate the weighted average with α1 = α2 = α3 = 1/3.
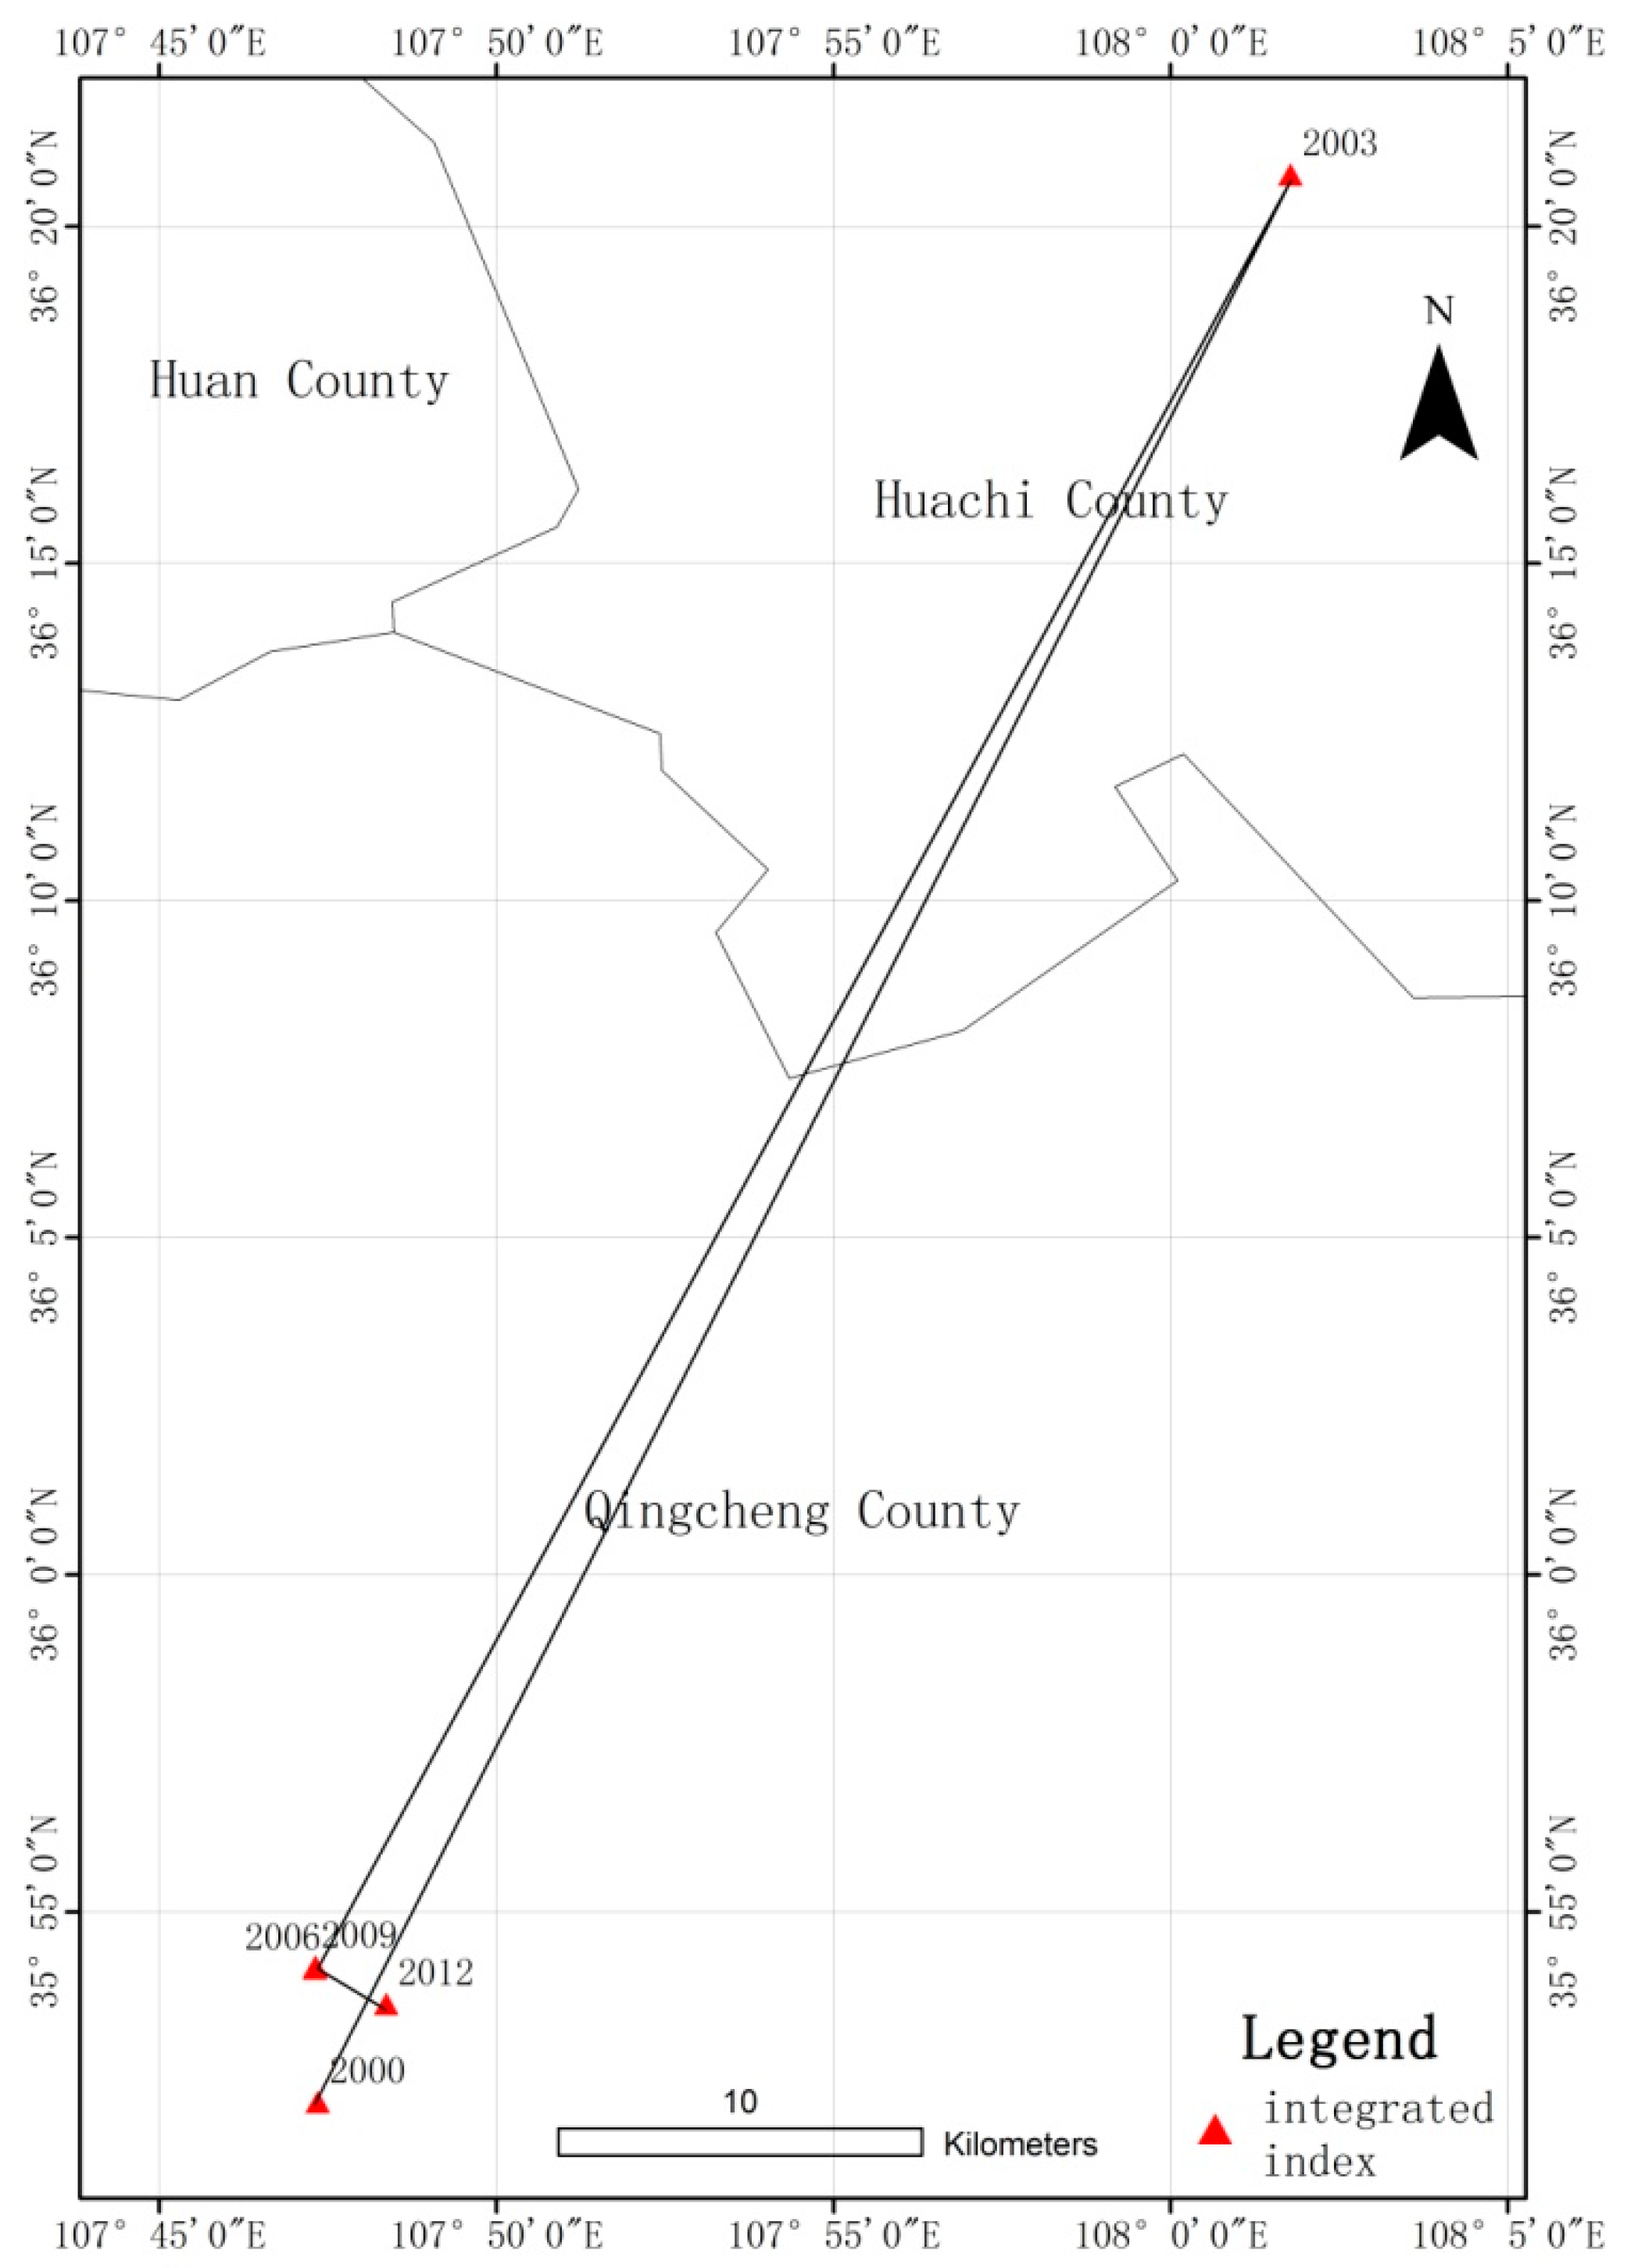
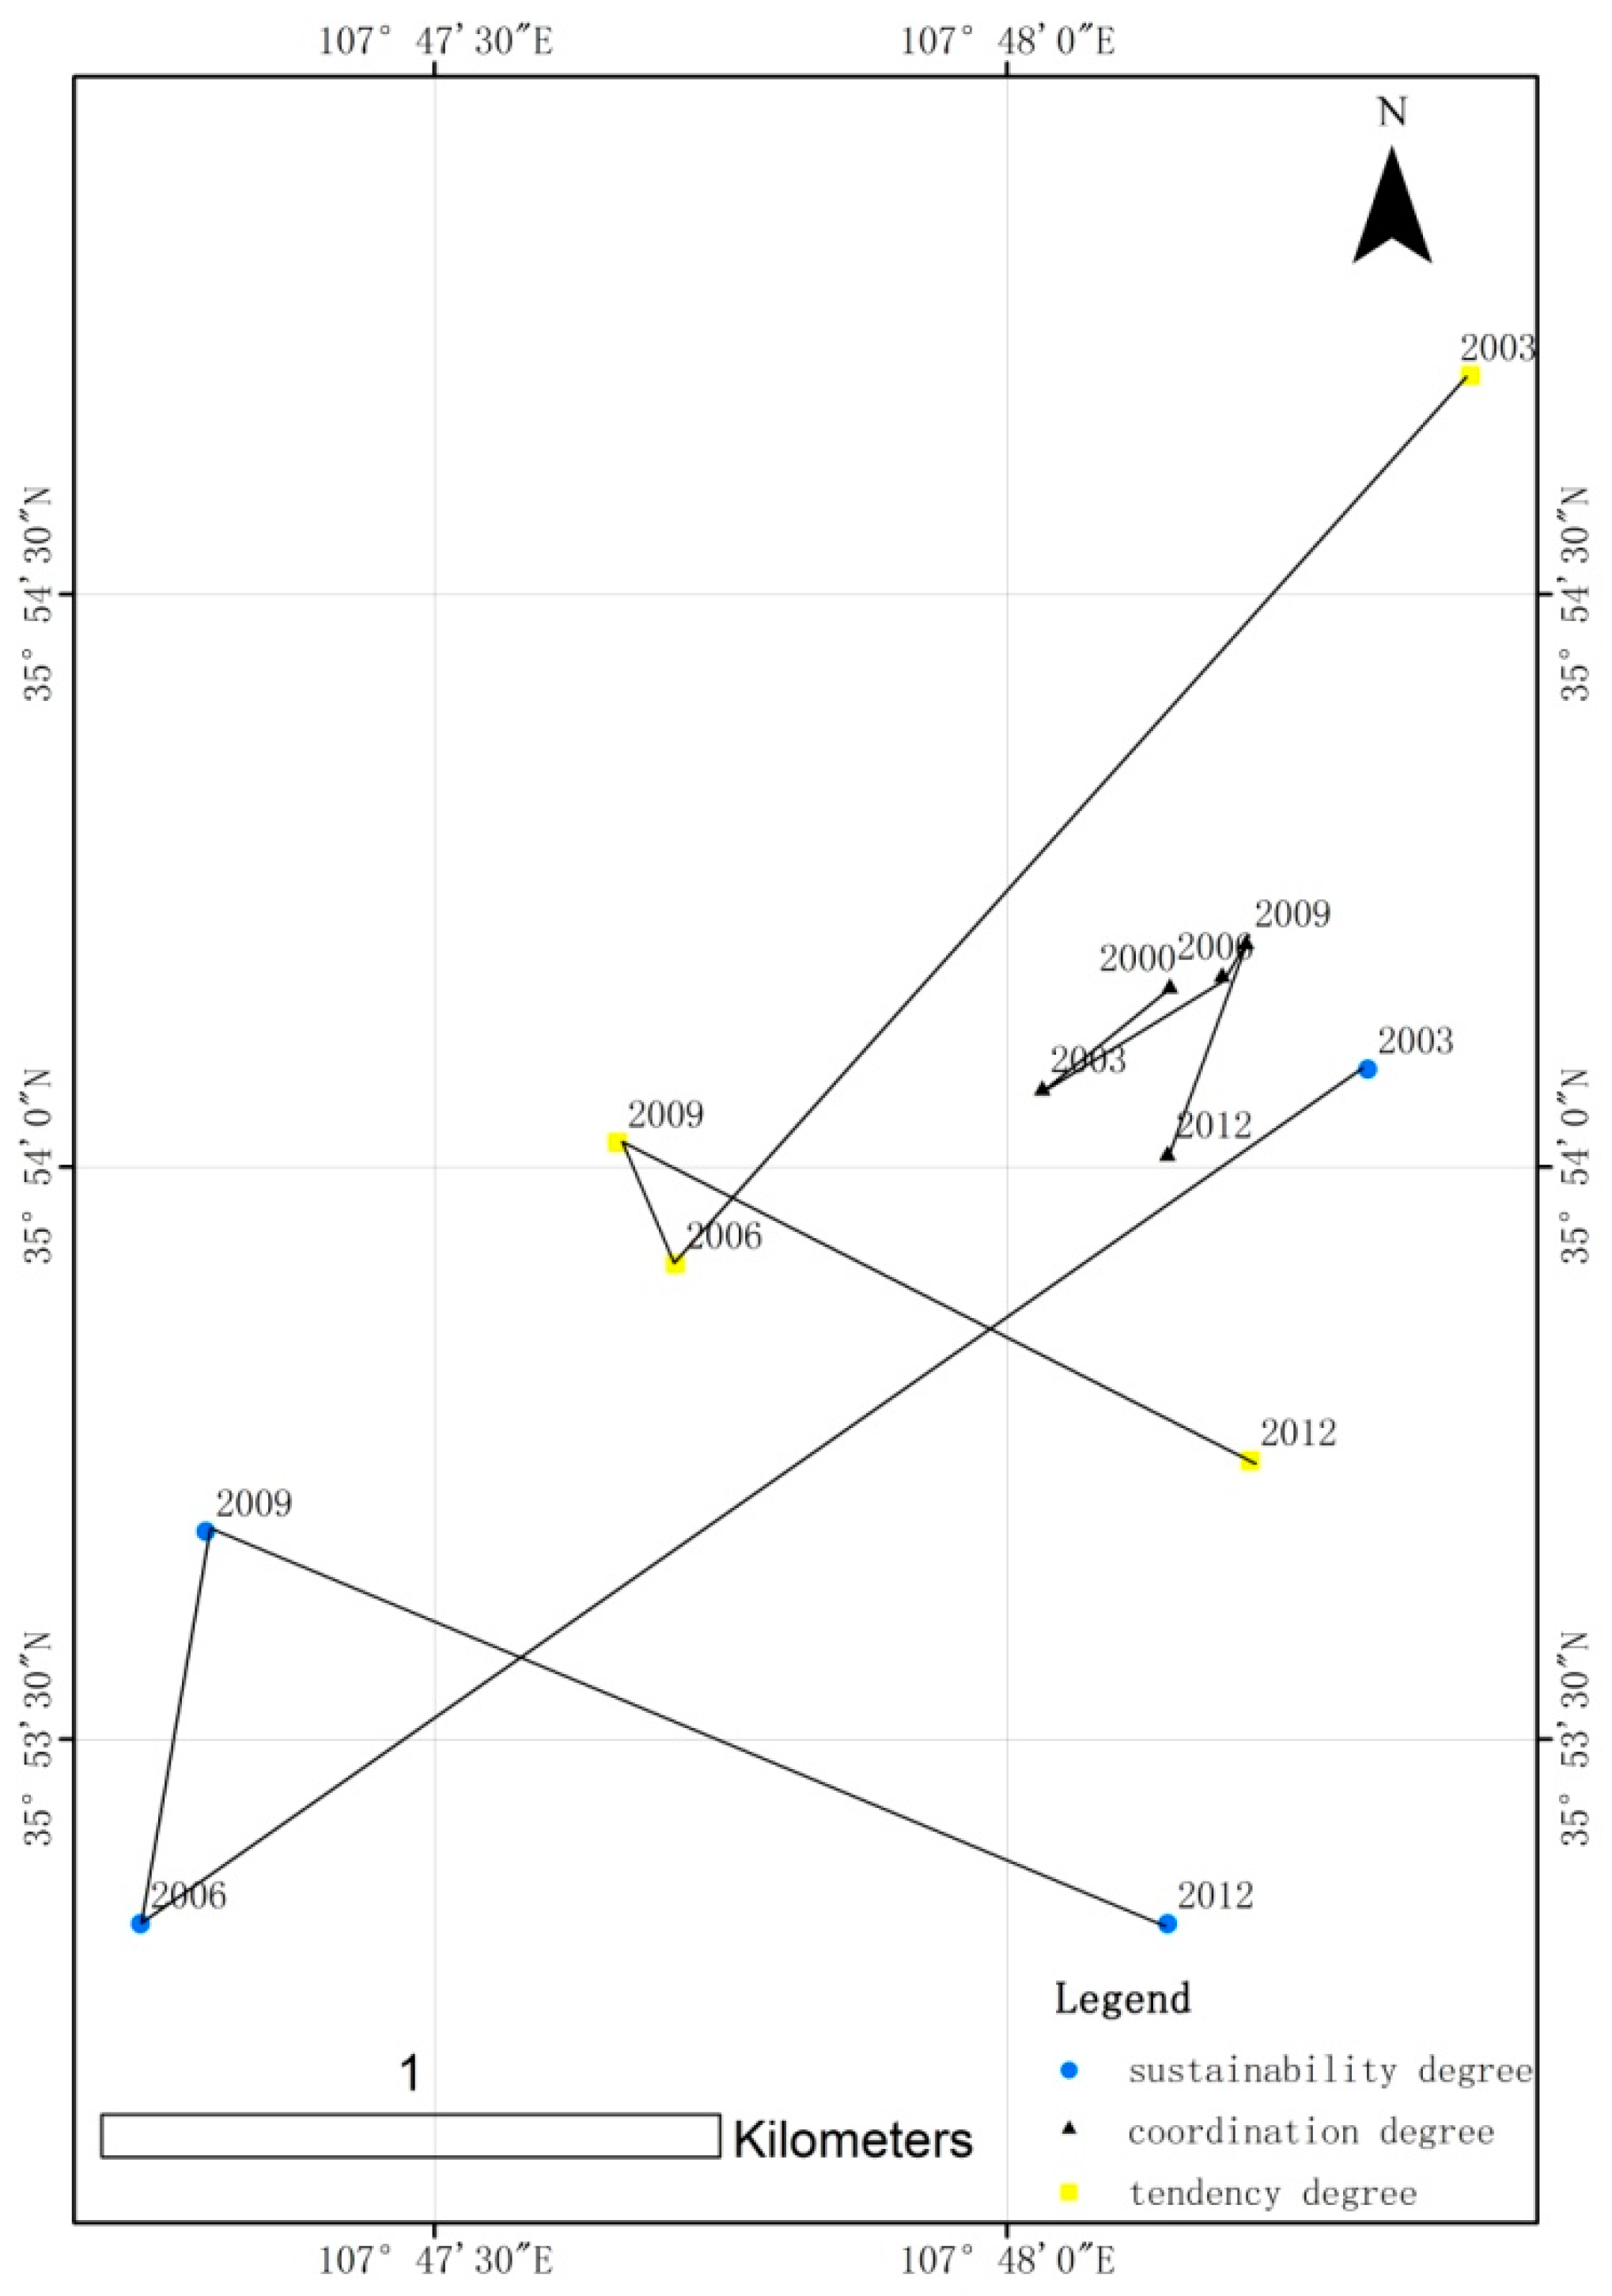
2.3. A Model Based Approach for Analysis of Spatial Structure
The regional centroid refers to the equilibrium point of an element’s torque on its space plane. In practice, with the assumption that a specific region consists of
n space units, the centroid coordinate of space unit
i is (
xi,
yi),
is the element value of space unit
i, and
x,
y represent the spatial coordinate of such element within the entire region. The calculation method is as shown following:
In this study,
represents element attributes of county
i,
xi and
yi represents the spatial coordinate of the administrative centroid of county; and
i,
x and
y represents the centroid coordinate with relevant attributes. When the centroid attributes of an element are moving through time, the moving direction will point at high-density area, and the deviation distance will indicate the degree of un-equilibrium [
44,
45]. Also, it can be seen from centroid formula that if the geological locations of every site remain unchanged (
i.e., such consistence is assumed unchanged throughout the research period), then factors that directly affect the centroid would be the speed and degree of the centroid attributes. Since the development and change of such attributes would affect regional change of centroid, the latter could clearly reflect the developmental trajectories and spatial differences of such attributes.
4. Conclusions
Since 2000, the development pattern of Qingyang has fitted the mode of unsustainable development in the presence of certain levels of spatial differences. Under current development scenarios with rapid economic and social development, the natural resources and environment are gradually degrading. Because such development is at the expense of natural resources and environment, the coordination degree among population, economy, society, resources and environment is damaged, and the current state of development is basically uncoordinated. Currently, although the level of regional sustainable development and associated tendency degree remains arising, such a trend is solely temporary with severe hidden crises, and the tendency degree begins to show a declining trend. In the long run, such pattern would lead to the overall decrease of all indexes related to regional sustainable development, and Qingyang would not be able to achieve its healthy, long-term sustainable development. In terms of spatial structure, the spatial differences of integrated indexes in terms of regional sustainable development represent the largest ones, followed by the sustainability and tendency degree, and the spatial differences of the coordination degree represent the smallest ones. Also, the spatial differences along the northeast-southwest direction are predominant.
The challenges that Qingyang faces during the critical period of its development are typically found in ecologically fragile area of China’s Loess Plateau, known for its non-optimistic sustainable development reality. In such area, water scarcity is a big problem, the ecological environment is fragile, and the poorest or most backward districts could be easily found. To get rid of poverty, local government often emphasizes the rapid growth rate of economy, and is desperate to promote extensive economic growth at the expense of natural resources and environment, causing uncoordinated status among subsystems of regional sustainable development, which would further restrict the extent of regional sustainable development. Meanwhile, with the accelerated pace of industrialization process, the economy has been spurred in such area, which might counterbalance the restraining effect imposed by environmental degradation on regional sustainable development, and enable the level of regional sustainable development to keep increasing. However, such enhancement is abnormal. With the rapid deterioration of the environment and natural resources, their inhibitory effect on economy and society would be expanded, eventually leading to the slow development rate, or the recession, of the entire system.
For the ecologically fragile area of China’s Loess Plateau, the only solution is to change the traditional mode of economic development, to follow the guide of ecological economic conception for regional development, to walk the road of circular economy in order to make the population, economy, society, resources and environment systems perfectly integrated, to realize the optimal allocation of regional sustainable development, and, ultimately, to achieve regional sustainable development strategies. Meanwhile, spatial differences deserve more attention, and the characteristics of different regions should be taken into account in order to achieve optimal spatial structure.


