1. Introduction
The fashion industry, which includes textiles and apparel, is one of the most prominent industries in the world. It is also a big industry in developing countries, such as India. In fact, from the report of the India Brand Equity Foundation [
1], the textile and clothing business sector in India currently contributes to 14% of industrial growth, and 35 million job opportunities. It occupies 17% of export earnings and has the potential to achieve a US$80 billion global trade volume by 2020. According to a report by the United Nation Environment Programme [
2] and the European Commission [
3], the textile and clothing industry is the world second biggest economic sector and it occupies 7% of the total world exports. Although the textile and fashion clothing sector has sustainable economic development, it is a threat to the environment and to social welfare owing to problems like pollution, wastes, human rights issues,
etc. [
4]. Therefore, achieving sustainability in textile and fashion business operations has to consider more than just economic development.
In fact, sustainable development can be defined in many different ways. For example, the World Commission on Environment and Development [
5] defined sustainable development as the “
development that meets the needs of the present without compromising the ability of future generations to meet their own needs”. Moreover, sustainable development is balanced on three pillars, namely the social, the environmental and the economic aspects which are commonly known as the Triple Bottom Line (TBL) [
6]. From the above definition and the TBL concept, the goal of sustainability in the textile and fashion clothing business operations may be interpreted as fulfilling the challenges in TBL, but the process of achieving the sustainability is not clear. Generally, the textile and fashion clothing business operation is based on its four levels of operations such as production of raw materials, production of fashion goods from raw materials, retail sales, and advertising and promotions; undoubtedly, these four levels are linked together. To achieve a complete sustainable development in textile and fashion clothing business operations, operations of all these four levels have to address the concerns in TBL.
In the literature, many former studies critically analyzed the textile and fashion industry impacts on social welfare and the environment [
7]. To be specific, Diabat
et al. [
8] described that industries, especially in the textile sectors, are under pressure to implement sustainable practices in their operations to amend the environmental performances. They analyzed and revealed that adoption of safety standards, adoption of green practices, community economic welfare, health and safety issues, and employment stability are the five influential enablers to adopt sustainable supply chain management in Indian textile industries. Gardetti and Torres [
9] mentioned that the cheap labor issue in textile and clothing industry relates to politics and the international trading agreements. In addition, they emphasized that abuses of working conditions, violation of human rights by low wages, and long working hours are typically seen in these industries. Baskaran
et al. [
10] examined the garment manufacturers and their suppliers (suppliers to manufacturers) in the Indian textile and clothing industry sector based on social and environmental criteria such as discrimination, abuse of human right, child labor, long working hours, unfair competition and pollution. Their study indicated that long working hours and child labor are serious issues on the suppliers’ side and, pollution and unfair competition are the major concerns on the manufacturer side. Lo
et al. [
11] revealed that environmental management system is a significant liability for today’s textile and fashion industries. They proved this by providing empirical evidence that the adaptation of an environmental management system has positive impacts on a firm’s financial performance. Seuring and Goldbach [
12] explained in their research that the textile and fashion supply chains are frequently blamable for environmental and social problems during the production process. Their case study report showed the ways to enhance the sustainability performance in textile and fashion supply chain during the production of environmentally competitive products at an admissible price. Blackburn [
13] described that water, chemicals, asset stripping of non-renewable resources, waste, and transport are five main environmental issues that make the textile and clothing production operations unsustainable. Gardetti and Torres [
9] found that the textile and fashion industry make a remarkable contribution to the economy but it hurts the environment and society from the perspective of sustainability. Aakko and Koskennurmi-Sivonen [
4] indicated that until recent years sustainable development and fashion could not go hand-in-hand, but there are changes nowadays [
14]. Choi [
15] analytically examined the optimal apparel supplier selection problem in the presence of carbon footprint taxation scheme via a dynamic programming formulation. Most recently, Wang
et al. [
16] explored the role played by the government in affecting the fashion supply chain gaming structure with sustainability concerns.
Observe that fast fashion is an industrial trend and more and more fashion companies are faster now than before in terms of the shortened lead time of product offering. Interestingly, fast fashion relates highly to sustainability. In the literature, Fulton and Lee [
17] emphasized that fashion industries and consumers are both influenced by “fast fashion”. They argued that technological advances can enhance sustainability in the fashion industry. Turber and Altuntas [
18] examined the current sustainability situation of fast fashion companies by examining their corporate reports. They found that fast fashion companies are now putting a lot of emphasis on supplier compliance with ethical codes of conduct and imposing tighter control and auditing to improve the overall supply chain sustainability performance. In addition, they revealed that fast fashion companies also set important sustainability criteria for their suppliers. Li
et al. [
19] investigated the impacts of corporate social responsibility on fast fashion companies and the respective supply chains. They determined seven attributes based on the sustainable development theory. They further proposed seven factors that are critically important for developing the sustainability governance framework. Based on a real case analysis, they discussed the application of their proposed governance mechanism in practice. Most recently, Shen [
20] conducted a case study on H&M to reveal insights on sustainability programs in fast fashion business operations. From the above studies, there is no doubt that fast fashion relates highly to sustainability and this fact affects the selection of suppliers in the industry. For more related studies on fast fashion, please refer to Choi [
21]; for the importance of sustainability to fashion, since the area is huge, interested readers can refer to Choi and Cheng [
22] for the latest development on the topic.
The sustainability in fashion clothing production operations, with the emphasis on supplier selection, is the focus of this study. To be specific, the first part of this study is devoted to the development of criteria framework for evaluating suppliers. This criteria framework consists of 12 criteria based on TBL aspects such as cost, quality, on-time delivery, and rejection rate (the economic aspect); toxic chemical usage control, water consumption control, energy usage control and pollution control (the environmental aspect); and, restriction on under age labor, restriction on long working hours, human rights, care and safe guard mechanism for workers (the social aspect). The second part of this study focuses on ranking the sustainable suppliers based on their performance on the criteria framework using the multi-criteria decision making (MCDM) methodology called Technique for Order of Preference by Similarity to Ideal Solution (TOPSIS). The proposed model for sustainable business operation in fashion clothing industry has been successfully applied in the real case company which is situated in India. Several managerial implications are discussed.
The rest of the paper is structured as follows: The solution methodology for sustainable supplier selection is introduced in
Section 2. The proposed application in the case company is illustrated in
Section 3.
Section 4 presents the findings and
Section 5 discusses the managerial implications, conclusion, and future research.
3. Application of the Proposed Model
This section presents a real case for the application of the above proposed TOPSIS method for selecting the sustainable supplier based on TBL related criteria in the textile and clothing industry. The case study company is situated in India. The main function of this company is to design and fabricate fashion garments on a customized basis and export the products to countries worldwide. Though the case study company has had progressive growth in economic aspects, this study wants to explore further its performance including environmental and social aspects. Notice that the case company is sourcing materials for its fabrication process from various suppliers all over India. As an initial setup of the sustainable business operation in the case company, this study focuses on the selection of sustainable suppliers for the sourcing of sustainable materials for the fabrication process because sourcing is a core function of the case company. Hence, the objective of this study is to propose a TOPSIS model for sustainable supplier selection and evaluation. The proposed model consists of two phases: (i) The criteria framework development based on the economic, environmental and social aspects (i.e., the TBL); and (ii) the evaluation and selection scheme for sustainable supply based on the criteria with the proposed TOPSIS technique.
Observe that in the literature, studies which also employ TOPSIS for supplier evaluation with green considerations include [
31,
32,
33,
34,
35,
36,
37]. This paper is similar to them in that TOPSIS is the major model for the analysis and the evaluation criteria relate to environmental sustainability. However, differently, the industry considered in this paper is the fashion industry whereas they consider other industries such as automobile, electronics, cement,
etc. Furthermore, the criteria being evaluated are not the same, and the exact analytical model is also different. Last but not least, the model discussed in this paper is relatively easy to implement and can hence be conveniently applied in practice.
3.1. Criteria Framework Development
The first phase involves criteria framework development for sustainable supplier selection. An in-depth literature search on TBL related topics and extensive discussions with academic and industrial experts in the textile and fashion clothing field are utilized to develop the criteria framework in this paper. The preferred criteria in the framework are presented in
Table 1. The developed criteria framework includes several criteria related to the economic, environmental and social sustainability. In the economic aspect, cost, quality, on-time delivery and control of rejection rate are selected as the criteria and they are also generally applied as the “traditional criteria” in the supplier selection process. The pre- and post-production processes of fibers and fabrics in textile operations have high impacts on the environment (such as toxic chemical usage, water usage, energy usage and pollution from hazardous materials) and hence they are considered as the environmental criteria in the criteria framework. Underage labor, long working hours, human rights issue, and safe guard mechanism are selected as the social criteria in the criteria framework development. Thus, in the criteria framework, C1 includes the cost-based criteria (
i.e., the lowest value has the highest preference), and the other criteria are benefit-based criteria (
i.e., the highest value the highest preference).
Table 1.
Criteria for evaluating and selecting sustainable suppliers [
10,
41].
Table 1.
Criteria for evaluating and selecting sustainable suppliers [10,41].
| Criteria | Name | Definition |
|---|
| C1 | Cost | Lowest product price without compromising the quality |
| C2 | Quality | Ensure high quality control on the products |
| C3 | On-time delivery | Level of delivery on-time as per the agreement with the customer |
| C4 | Rejection rate control | Control on rejection rate of material |
| C5 | Toxic chemical usage control | Control or avoid the usage of toxic chemicals in cultivation process and production process of textile. |
| C6 | Water consumption control | Control the unwanted use of water in business operation. |
| C7 | Energy usage control | Control the unwanted use of energy in business operation. |
| C8 | Pollution control | Control the improper waste disposal, use of hazardous material in operation. |
| C9 | Restriction on under age labor | Control the underage employment in business operation. |
| C10 | Restriction on long working hours | Control the forcing of workers to work more than determined hours (apart from overtime) |
| C11 | Human rights care | Basic facilities to labor, respect, etc. |
| C12 | Safe guard mechanism for workers | Monitor the workers’ health and safety |
3.2. Sustainable Supplier Selection Using TOPSIS
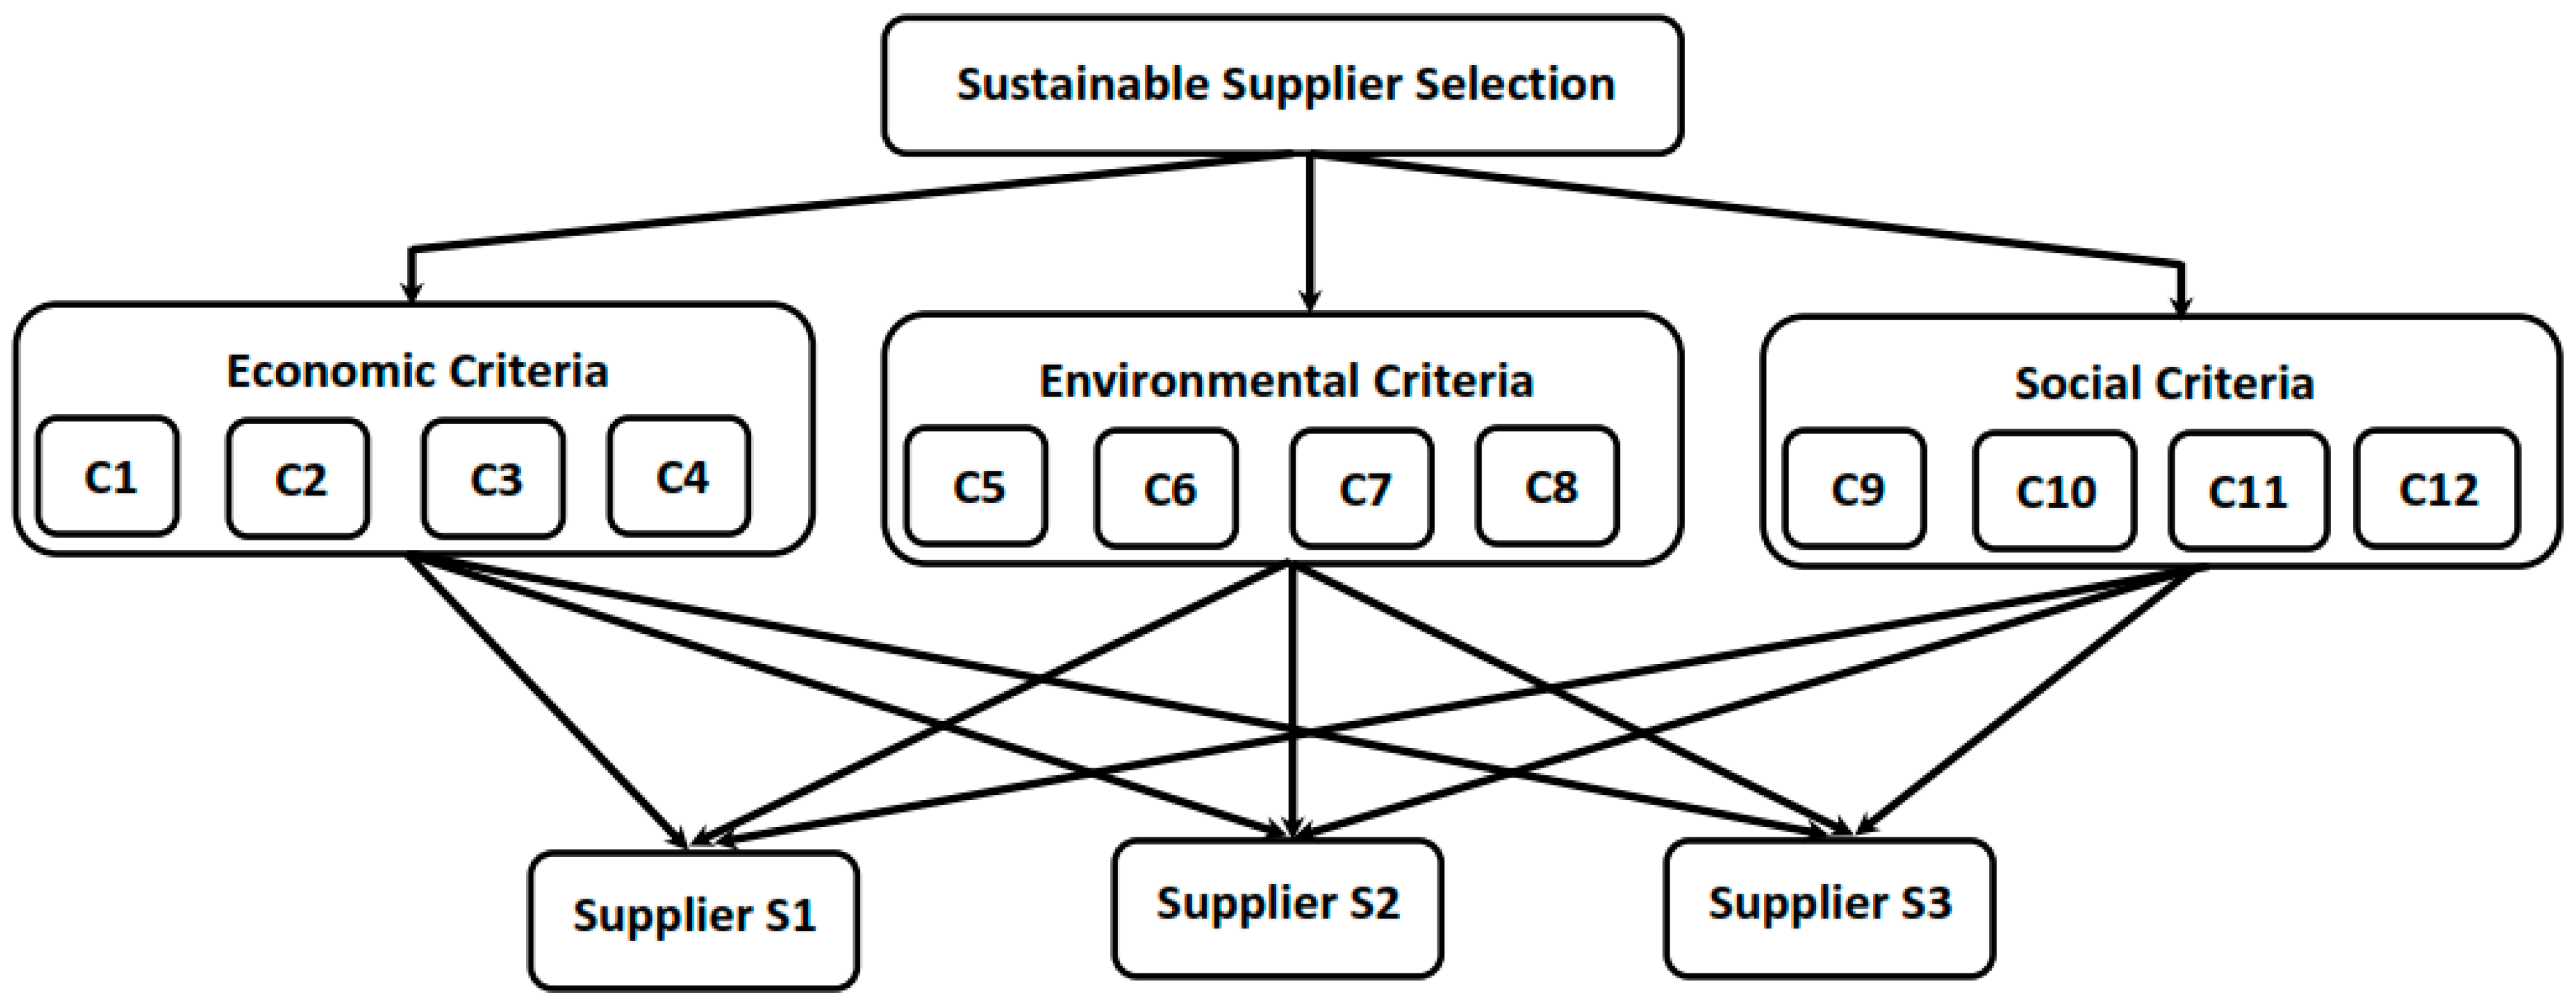
In this proposed study, three possible “qualified” suppliers (S1, S2, S3) are thought to have the potential to support sustainable business operations and engaged for evaluation. The decision making team for evaluating the criteria’s intensity of importance and supplier performance is composed of three experts from the material sourcing department (E1), the production department (E2) and the health and safety department (E3). The hierarchical structure of the decision model is presented in
Figure 2. The questionnaire is prepared and distributed among the experts team for evaluation of criteria and suppliers. The expert members are asked to evaluate each criterion using the linguistic scale provided in the questionnaire to determine its intensity and evaluate the supplier’s performance based on the selected criteria. A seven-point Likert scale is provided in the questionnaire to represent the experts perception. The linguistic scale for criteria evaluation and alternative evaluation is presented in
Table 2 and
Table 3. The TOPSIS methodology is applied to solve the decision making problem.
Table 4 and
Table 5 display the original assessment of the expert’s opinions on criteria importance and suppliers performance.
Figure 2.
Hierarchical structure of sustainable supplier selection.
Figure 2.
Hierarchical structure of sustainable supplier selection.
Table 2.
Linguistic scale for rating the relative importance of criteria.
Table 2.
Linguistic scale for rating the relative importance of criteria.
| Linguistic Variable | Triangular Fuzzy Numbers |
|---|
| Very low importance (VL) | (0, 0, 0.1) |
| Low importance (L) | (0, 0.1, 0.3) |
| Medium low importance (ML) | (0.1, 0.3, 0.5) |
| Medium importance (M) | (0.3, 0.5, 0.7) |
| Medium high importance (MH) | (0.5, 0.7, 0.9) |
| High importance (H) | (0.7, 0.9, 1) |
| Very high importance (VH) | (0.9, 1, 1) |
Table 3.
Linguistic scale for rating the performance of the suppliers.
Table 3.
Linguistic scale for rating the performance of the suppliers.
| Linguistic Variable | Triangular Fuzzy Numbers |
|---|
| Very poor (VP) or very very low (VVL) | (0, 0, 1) |
| Poor (P) or very low (VL) | (0, 1, 3) |
| Medium poor (MP) or low (L) | (1, 3, 5) |
| Medium (M) or average (AVG) | (3, 5, 7) |
| Medium good (MG) or high (H) | (5, 7, 9) |
| Good (G) or very high (VH) | (7, 9, 10) |
| Very good (VG) or very very high (VVH) | (9, 10, 10) |
Table 4.
Experts Assessment on importance of criteria and aggregated fuzzy weights of criteria.
Table 4.
Experts Assessment on importance of criteria and aggregated fuzzy weights of criteria.
| Criteria | Linguistic Assessment of Decision Makers | Fuzzy Criteria Weight | Aggregated Fuzzy Weight |
|---|
| E1 | E2 | E3 | E1 | E2 | E3 |
|---|
| C1 | MH | H | MH | (0.5, 0.7, 0.9) | (0.7, 0.9, 1) | (0.5, 0.7, 0.9) | (0.5, 0.77, 1) |
| C2 | H | H | H | (0.7, 0.9, 1) | (0.7, 0.9, 1) | (0.7, 0.9, 1) | (0.7, 0.90, 1) |
| C3 | H | MH | MH | (0.7, 0.9, 1) | (0.5, 0.7, 0.9) | (0.5, 0.7, 0.9) | (0.5, 0.77, 1) |
| C4 | M | MH | M | (0.3, 0.5, 0.7) | (0.5, 0.7, 0.9) | (0.3, 0.5, 0.7) | (0.3, 0.57, 0.9) |
| C5 | H | MH | MH | (0.7, 0.9, 1) | (0.5, 0.7, 0.9) | (0.5, 0.7, 0.9) | (0.5, 0.77, 1) |
| C6 | MH | H | H | (0.5, 0.7, 0.9) | (0.7, 0.9, 1) | (0.7, 0.9, 1) | (0.5, 0.83, 1) |
| C7 | H | H | MH | (0.7, 0.9, 1) | (0.7, 0.9, 1) | (0.5, 0.7, 0.9) | (0.5, 0.83, 1) |
| C8 | H | MH | H | (0.7, 0.9, 1) | (0.5, 0.7, 0.9) | (0.7, 0.9, 1) | (0.5, 0.83, 1) |
| C9 | M | MH | M | (0.3, 0.5, 0.7) | (0.5, 0.7, 0.9) | (0.3, 0.5, 0.7) | (0.3, 0.57, 0.9) |
| C10 | M | ML | ML | (0.3, 0.5, 0.7) | (0.1, 0.3, 0.5) | (0.1, 0.3, 0.5) | (0.1, 0.37, 0.7) |
| C11 | H | M | MH | (0.7, 0.9, 1) | (0.3, 0.5, 0.7) | (0.5, 0.7, 0.9) | (0.3, 0.70, 1) |
| C12 | H | M | M | (0.7, 0.9, 1) | (0.3, 0.5, 0.7) | (0.3, 0.5, 0.7) | (0.3, 0.63, 1) |
Table 5.
Experts Assessment on performance of suppliers and aggregated fuzzy weights.
Table 5.
Experts Assessment on performance of suppliers and aggregated fuzzy weights.
| Criteria | Supplier S1 | Supplier S2 | Supplier S3 |
|---|
| E1 | E2 | E3 | Aggregate | E1 | E2 | E3 | Aggregate | E1 | E2 | E3 | Aggregate |
|---|
| C1 | H | VH | VH | (5, 8.33, 10) | AVG | H | H | (3, 6.33, 9) | AVG | AVG | H | (3, 5.67, 9) |
| C2 | VH | G | VH | (7, 9.00, 10) | MG | MG | G | (5, 7.67, 10) | M | M | G | (3, 6.33, 10) |
| C3 | G | H | H | (5, 7.67, 10) | MG | VH | G | (5, 8.33, 10) | M | H | G | (3, 7.00, 10) |
| C4 | L | L | AVG | (1, 3.67, 7) | VL | VL | AVG | (0, 2.33, 7) | L | AVG | H | (1, 5.00, 9) |
| C5 | G | MG | VH | (5, 8.33, 10) | M | MG | MP | (1, 5.00, 9) | P | L | AVG | (0, 3.00, 7) |
| C6 | MG | H | AVG | (3, 6.33, 9) | MP | L | M | (1, 3.67, 7) | MP | MP | L | (1, 3.00, 5) |
| C7 | M | MP | AVG | (1, 4.33, 7) | MG | H | AVG | (3, 6.33, 9) | M | L | AVG | (1, 4.33, 7) |
| C8 | MG | G | H | (5, 7.67, 10) | MP | AVG | VL | (0, 3.00, 7) | M | AVG | M | (3, 5.00, 7) |
| C9 | G | VH | H | (5, 8.33, 10) | M | M | H | (3, 5.67, 9) | H | VH | AVG | (3, 7.00, 10) |
| C10 | M | MP | L | (1, 3.67, 7) | MP | L | AVG | (1, 3.67, 7) | AVG | AVG | H | (3, 5.67, 9) |
| C11 | H | G | G | (5, 8.33, 10) | MG | H | VH | (5, 7.67, 10) | G | G | MG | (5, 8.33, 10) |
| C12 | G | G | M | (3, 7.67, 10) | H | VH | H | (5, 7.67, 10) | G | H | MG | (5, 7.67, 10) |
3.3. Sensitivity Analysis
Sensitivity analysis is used to understand how the variation of inputs may influence the output of the analytical model. Generally, the sensitivity analysis is applied by slightly varying the weights of the input and noting the effects of output in the decision model. In this study, sensitivity analysis has been conducted through 24 experiments by varying the criteria weights in the proposed model and observing the ranking of the potential suppliers.
4. Results and Findings
From the technical analysis conducted in
Section 3, the following research results and findings are obtained. First, upon the application of the proposed methodology, the results from each step as described in the earlier solution methodology section are tabulated in
Table 6,
Table 7 and
Table 8. To be specific, the normalized and weighted decision matrix, the distance of each supplier from PIS and NIS with respect to each criterion and the closeness coefficient of each supplier are shown respectively in the tables. Note that the final result of the application of TOPSIS methodology is summarized in
Table 8. The ranking of suppliers is sorted in a descending order based on the closeness coefficient value, and the final ranking of suppliers is: S1 > S2 > S3.
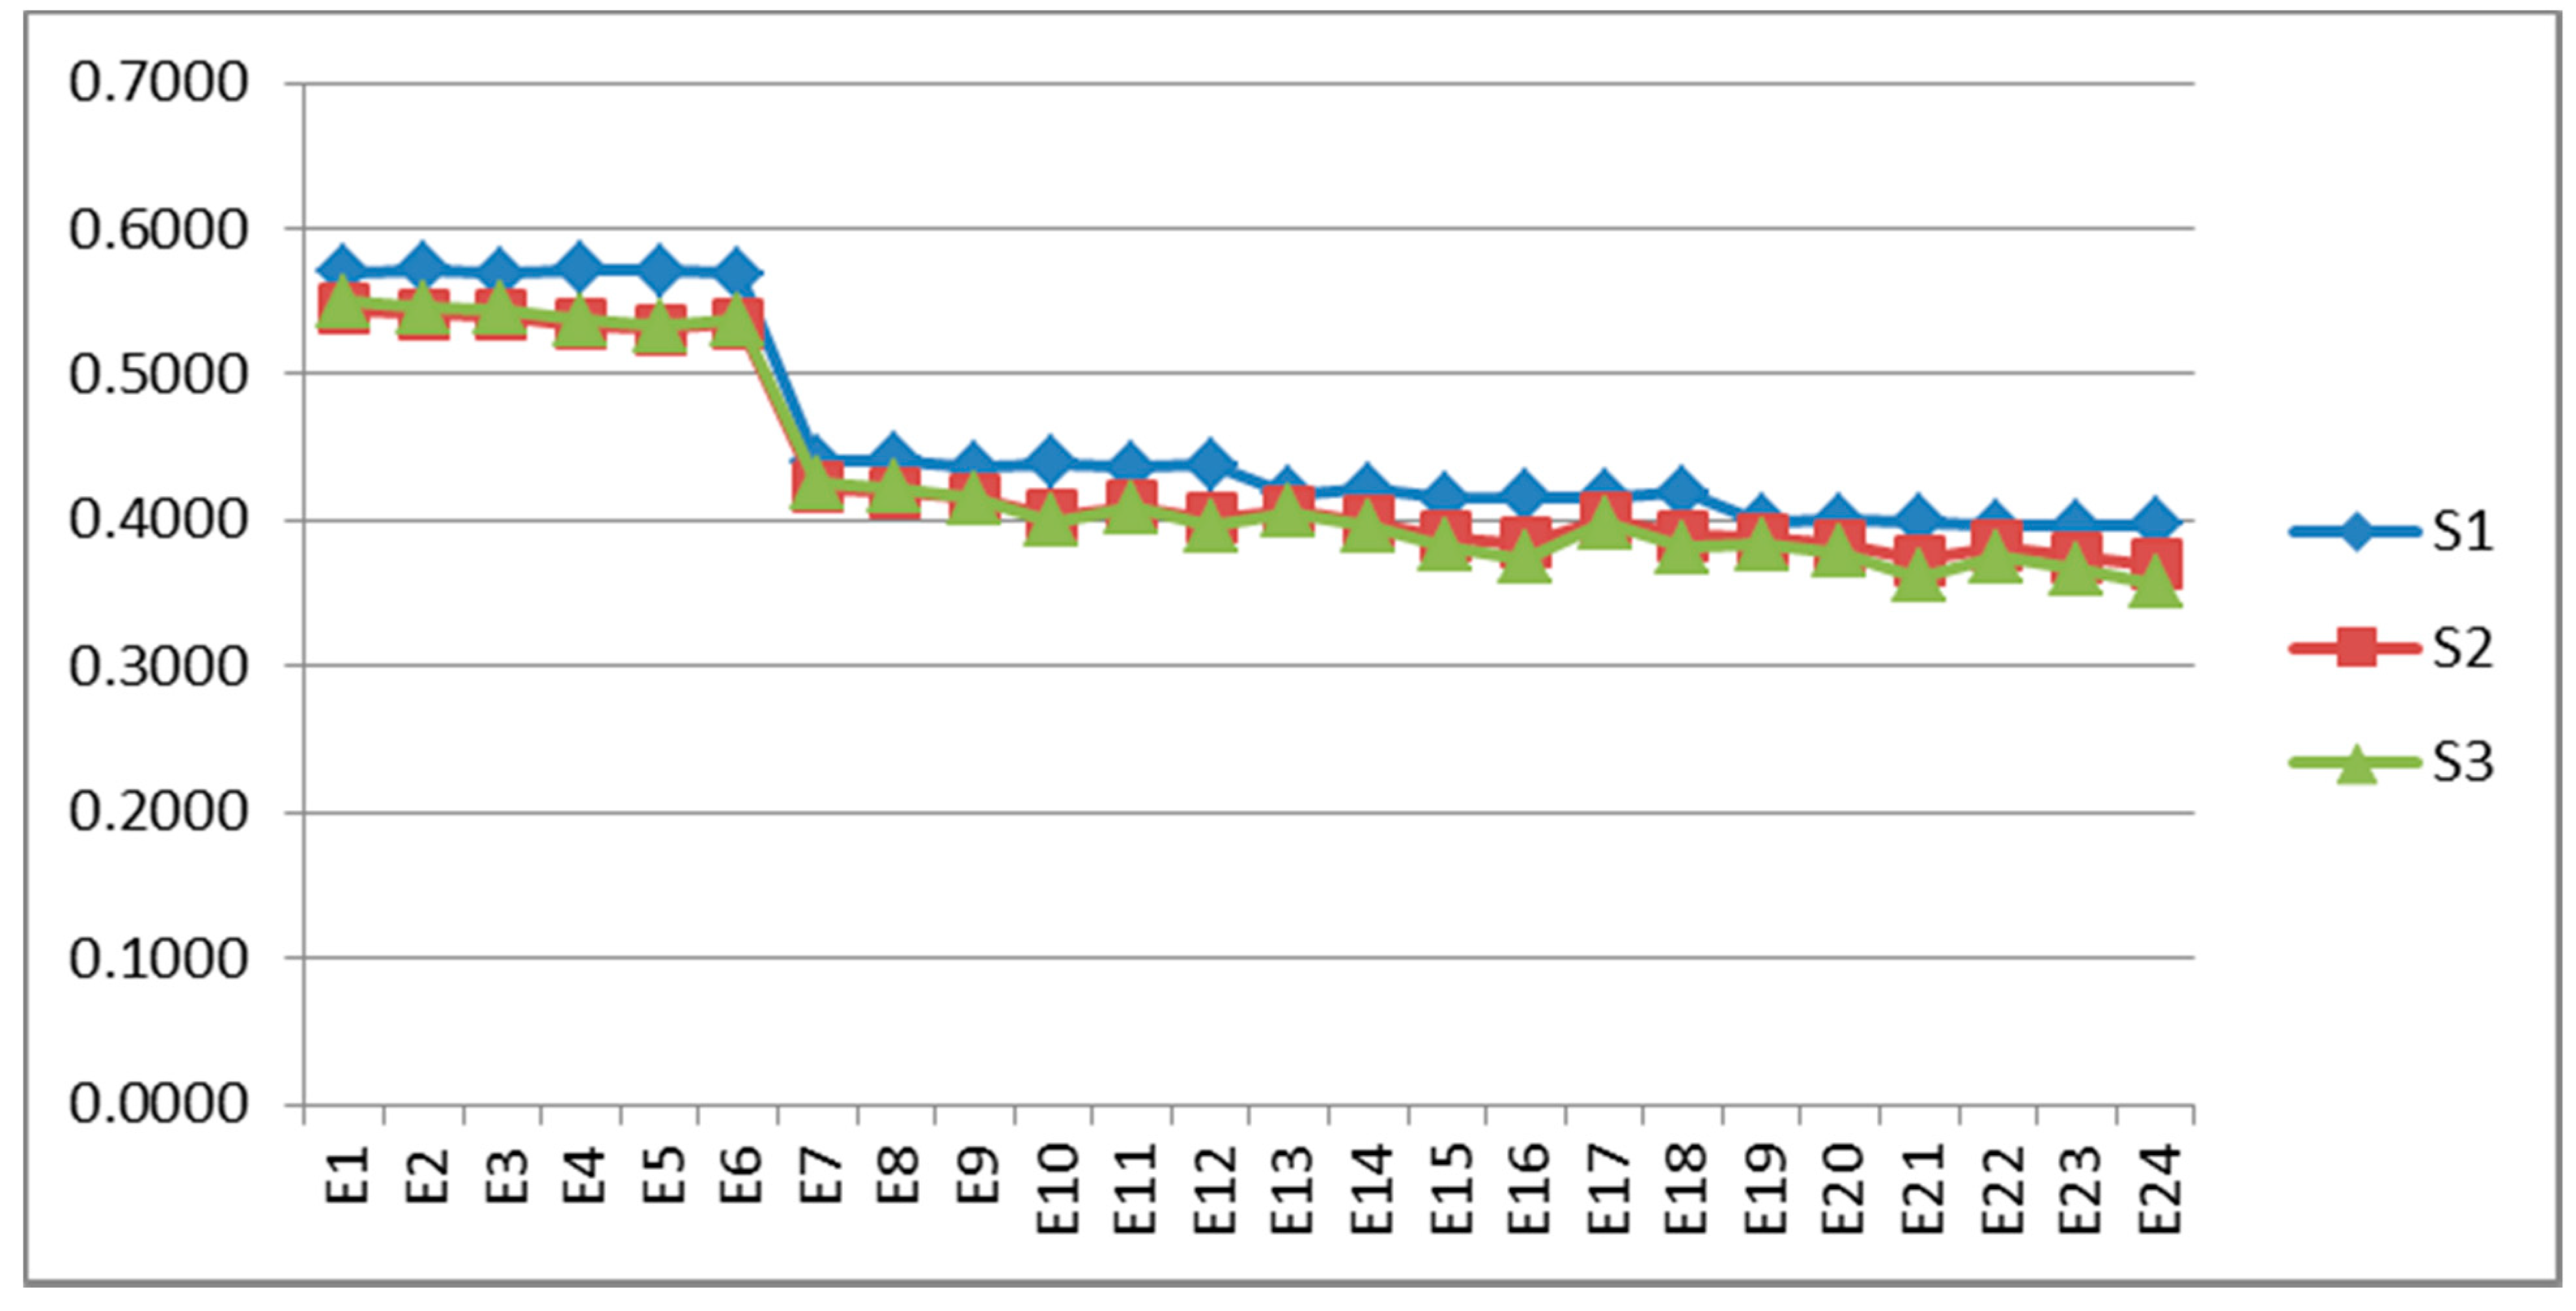
Second, in the sensitivity analysis,
Table 9 summarizes the experimental weights of criteria and the numerical solutions.
Figure 3 further presents the graphical view of the results. the computational results show that the ranking order S1 > S2 > S3 has not been changed in 15 experiments, and in 9 experiments it has been changed to S1 > S3 > S2. The analysis hence proves that the decision making process is rather insensitive to changes in the criteria weights and supplier S3 is always ranked first in all experiments.
Figure 3.
Results of sensitivity analysis.
Figure 3.
Results of sensitivity analysis.
Table 6.
Normalized and weighed fuzzy decision matrix.
Table 6.
Normalized and weighed fuzzy decision matrix.
| Criteria | Normalized Fuzzy-Decision Matrix | Weighted Normalized Fuzzy Decision Matrix |
|---|
| S1 | S2 | S3 | S1 | S2 | S3 |
|---|
| C1 | (0.30, 0.36, 0.60) | (0.33, 0.47, 1.00) | (0.33, 0.53, 1.00) | (0.15, 0.28, 0.60) | (0.17, 0.36, 1.00) | (0.17, 0.41, 1.00) |
| C2 | (0.70, 0.90, 1.00) | (0.50, 0.77, 1.00) | (0.30, 0.63, 1.00) | (0.49, 0.81, 1.00) | (0.35, 0.69, 1.00) | (0.21, 0.57, 1.00) |
| C3 | (0.50, 0.77, 1.00) | (0.50, 0.83, 1.00) | (0.30, 0.70, 1.00) | (0.25, 0.59, 1.00) | (0.25, 0.64, 1.00) | (0.15, 0.54, 1.00) |
| C4 | (0.10, 0.37, 0.70) | (0.00, 0.23, 0.70) | (0.10, 0.50, 0.90) | (0.03, 0.21, 0.63) | (0.00, 0.13, 0.63) | (0.03, 0.29, 0.81) |
| C5 | (0.50, 0.83, 1.00) | (0.10, 0.50, 0.90) | (0.00, 0.30, 0.70) | (0.25, 0.64, 1.00) | (0.05, 0.39, 0.90) | (0.00, 0.23, 0.70) |
| C6 | (0.30, 0.63, 0.90) | (0.10, 0.37, 0.70) | (0.10, 0.30, 0.50) | (0.15, 0.53, 0.90) | (0.05, 0.30, 0.70) | (0.05, 0.25, 0.50) |
| C7 | (0.10, 0.43, 0.70) | (0.30, 0.63, 0.90) | (0.10, 0.43, 0.70) | (0.05, 0.36, 0.70) | (0.15, 0.53, 0.90) | (0.05, 0.36, 0.70) |
| C8 | (0.50, 0.77, 1.00) | (0.00, 0.30, 0.70) | (0.30, 0.50, 0.70) | (0.25, 0.64, 1.00) | (0.00, 0.25, 0.70) | (0.15, 0.42, 0.70) |
| C9 | (0.50, 0.83, 1.00) | (0.30, 0.57, 0.90) | (0.30, 0.70, 1.00) | (0.15, 0.47, 0.90) | (0.09, 0.32, 0.81) | (0.09, 0.40, 0.90) |
| C10 | (0.10, 0.37, 0.70) | (0.10, 0.37, 0.70) | (0.30, 0.57, 0.90) | (0.01, 0.14, 0.49) | (0.01, 0.14, 0.49) | (0.03, 0.21, 0.63) |
| C11 | (0.50, 0.83, 1.00) | (0.50, 0.77, 1.00) | (0.50, 0.83, 1.00) | (0.15, 0.58, 1.00) | (0.15, 0.54, 1.00) | (0.15, 0.58, 1.00) |
| C12 | (0.30, 0.77, 1.00) | (0.50, 0.77, 1.00) | (0.50, 0.77, 1.00) | (0.09, 0.48, 1.00) | (0.15, 0.48, 1.00) | (0.15, 0.48, 1.00) |
Table 7.
Distance between suppliers and S+, S− with respect to each criterion.
Table 7.
Distance between suppliers and S+, S− with respect to each criterion.
| | C1 | C2 | C3 | C4 | C5 | C6 | C7 | C8 | C9 | C10 | C11 | C12 |
|---|
| d(S1,S+) | 0.68 | 0.31 | 0.49 | 0.75 | 0.48 | 0.57 | 0.68 | 0.48 | 0.58 | 0.81 | 0.55 | 0.60 |
| d(S2,S+) | 0.60 | 0.42 | 0.48 | 0.79 | 0.66 | 0.70 | 0.57 | 0.74 | 0.66 | 0.81 | 0.56 | 0.57 |
| d(S3,S+) | 0.59 | 0.52 | 0.56 | 0.70 | 0.75 | 0.76 | 0.68 | 0.62 | 0.63 | 0.75 | 0.55 | 0.57 |
| | C1 | C2 | C3 | C4 | C5 | C6 | C7 | C8 | C9 | C10 | C11 | C12 |
| d(S1,S−) | 0.27 | 0.65 | 0.56 | 0.29 | 0.57 | 0.48 | 0.34 | 0.57 | 0.47 | 0.21 | 0.55 | 0.53 |
| d(S2,S−) | 0.51 | 0.59 | 0.57 | 0.29 | 0.46 | 0.33 | 0.48 | 0.33 | 0.40 | 0.21 | 0.54 | 0.53 |
| d(S3,S−) | 0.51 | 0.55 | 0.54 | 0.40 | 0.33 | 0.22 | 0.34 | 0.35 | 0.46 | 0.29 | 0.55 | 0.53 |
Table 8.
Calculation of d+,d− and CCi.
Table 8.
Calculation of d+,d− and CCi.
| Supplier | d+ | d− | CCi | Rank |
|---|
| S1 | 7.00 | 5.50 | 0.4398 | 1 |
| S2 | 7.57 | 5.24 | 0.4093 | 2 |
| S3 | 7.69 | 5.07 | 0.3972 | 3 |
Table 9.
Numerical results of sensitivity analysis.
Table 9.
Numerical results of sensitivity analysis.
| Experiment No. | Definition | S1 | S2 | S3 | Ranking |
|---|
| C1, C2, C3 = | C4, C5, C6 = | C7, C8, C9 = | C10, C11, C12 = |
|---|
| E1 | (0.1, 0.37, 0.7) | (0.3, 0.63, 1) | (0.5, 0.83, 1) | (0.7, 0.9, 1) | 0.5705 | 0.5443 | 0.5496 | S1 > S3 > S2 |
| E2 | (0.1, 0.37, 0.7) | (0.3, 0.63, 1) | (0.7, 0.9, 1) | (0.5, 0.83, 1) | 0.5718 | 0.5416 | 0.5462 | S1 > S3 > S2 |
| E3 | (0.1, 0.37, 0.7) | (0.5, 0.83, 1) | (0.3, 0.63, 1) | (0.7, 0.9, 1) | 0.5690 | 0.5405 | 0.5446 | S1 > S3 > S2 |
| E4 | (0.1, 0.37, 0.7) | (0.5, 0.83, 1) | (0.7, 0.9, 1) | (0.3, 0.63, 1) | 0.5719 | 0.5343 | 0.5370 | S1 > S3 > S2 |
| E5 | (0.1, 0.37, 0.7) | (0.7, 0.9, 1) | (0.3, 0.63, 1) | (0.5, 0.83, 1) | 0.5708 | 0.5313 | 0.5334 | S1 >S3 > S2 |
| E6 | (0.1, 0.37, 0.7) | (0.7, 0.9, 1) | (0.5, 0.83, 1) | (0.3, 0.63, 1) | 0.5692 | 0.5348 | 0.5376 | S1 > S3 > S2 |
| E7 | (0.3, 0.63, 1) | (0.1, 0.37, 0.7) | (0.5, 0.83, 1) | (0.7, 0.9, 1) | 0.4402 | 0.4227 | 0.4259 | S1 > S3 > S2 |
| E8 | (0.3, 0.63, 1) | (0.1, 0.37, 0.7) | (0.7, 0.9, 1) | (0.5, 0.83, 1) | 0.4414 | 0.4197 | 0.4222 | S1 > S3 > S2 |
| E9 | (0.3, 0.63, 1) | (0.5, 0.83, 1) | (0.1, 0.37, 0.7) | (0.7, 0.9, 1) | 0.4360 | 0.4148 | 0.4153 | S1 > S3> S2 |
| E10 | (0.3, 0.63, 1) | (0.5, 0.83, 1) | (0.7, 0.9, 1) | (0.1, 0.37, 0.7) | 0.4397 | 0.4033 | 0.3989 | S1 > S2 > S3 |
| E11 | (0.3, 0.63, 1) | (0.7, 0.9, 1) | (0.1, 0.37, 0.7) | (0.5, 0.83, 1) | 0.4359 | 0.4096 | 0.4087 | S1 > S2 > S3 |
| E12 | (0.3, 0.63, 1) | (0.7, 0.9, 1) | (0.5, 0.83, 1) | (0.1, 0.37, 0.7) | 0.4383 | 0.4011 | 0.3961 | S1 > S2 > S3 |
| E13 | (0.5, 0.83, 1) | (0.1, 0.37, 0.7) | (0.3, 0.63, 1) | (0.7, 0.9, 1) | 0.4184 | 0.4062 | 0.4054 | S1 > S2 > S3 |
| E14 | (0.5, 0.83, 1) | (0.1, 0.37, 0.7) | (0.7, 0.9, 1) | (0.3, 0.63, 1) | 0.4210 | 0.3992 | 0.3966 | S1 >S2 > S3 |
| E15 | (0.5, 0.83, 1) | (0.5, 0.83, 1) | (0.1, 0.37, 0.7) | (0.7, 0.9, 1) | 0.4152 | 0.3889 | 0.3828 | S1 > S2 > S3 |
| E16 | (0.5, 0.83, 1) | (0.5, 0.83, 1) | (0.7, 0.9, 1) | (0.1, 0.37, 0.7) | 0.4163 | 0.3840 | 0.3743 | S1 > S2 > S3 |
| E17 | (0.5, 0.83, 1) | (0.7, 0.9, 1) | (0.1, 0.37, 0.7) | (0.3, 0.63, 1) | 0.4160 | 0.4014 | 0.3985 | S1 > S2 > S3 |
| E18 | (0.5, 0.83, 1) | (0.7, 0.9, 1) | (0.3, 0.63, 1) | (0.1, 0.37, 0.7) | 0.4197 | 0.3896 | 0.3813 | S1 > S2 > S3 |
| E19 | (0.7, 0.9, 1) | (0.1, 0.37, 0.7) | (0.3, 0.63, 1) | (0.5, 0.83, 1) | 0.3990 | 0.3873 | 0.3830 | S1 > S2 > S3 |
| E20 | (0.7, 0.9, 1) | (0.1, 0.37, 0.7) | (0.5, 0.83, 1) | (0.3, 0.63, 1) | 0.4003 | 0.3834 | 0.3778 | S1 > S2 > S3 |
| E21 | (0.7, 0.9, 1) | (0.3, 0.63, 1) | (0.1, 0.37, 0.7) | (0.5, 0.83, 1) | 0.3989 | 0.3732 | 0.3610 | S1 > S2 > S3 |
| E22 | (0.7, 0.9, 1) | (0.3, 0.63, 1) | (0.5, 0.83, 1) | (0.1, 0.37, 0.7) | 0.3965 | 0.3822 | 0.3755 | S1 > S2 > S3 |
| E23 | (0.7, 0.9, 1) | (0.5, 0.83, 1) | (0.1, 0.37, 0.7) | (0.3, 0.63, 1) | 0.3958 | 0.3751 | 0.3662 | S1 > S2 > S3 |
| E24 | (0.7, 0.9, 1) | (0.5, 0.83, 1) | (0.3, 0.63, 1) | (0.1, 0.37, 0.7) | 0.3969 | 0.3699 | 0.3569 | S1 > S2 > S3 |


