Article

Improving Log Loading Efficiency for Improved Sustainable Transport within the Irish Forest and Biomass Sectors

1
School of Biosystems Engineering, University College Dublin, Belfield, Dublin 4, Ireland
2
Faculty of Forestry and Wood Technology, Mendel University, Zemědělská 3, 613 00 Brno, Czech Republic
3
Department of Chemical and Life Sciences, Waterford Institute of Technology, Cork Road, Waterford, Ireland
*
Author to whom correspondence should be addressed.
Sustainability 2015, 7(3), 3017-3030; https://doi.org/10.3390/su7033017
Submission received: 12 November 2014 / Revised: 22 February 2015 / Accepted: 24 February 2015 / Published: 12 March 2015
(This article belongs to the Special Issue Transportation and Sustainability)

Abstract

:
In Ireland, timber and biomass haulage faces the challenge of transporting enough material within strict legal dimensions and gross vehicle weights restrictions for trucks and trailers. The objective of this study was to develop a method to control payload weight by knowing the moisture content of the wood. Weights, volumes, and moisture content were gathered from 100 truckloads of Sitka spruce pulpwood. Truck volume and weight utilization patterns were analyzed based on stacked volume, truck volume, and weights recorded from the weighbridge. Solid/bulk volume conversion factors for the truckloads were estimated indicating the truck’s solid volume capacity to be filled. Trucks were grouped into five conditions based on their configuration—volume capacity and legal maximum payload. A loaded volume fraction was estimated to assess the optimal volume capacity and stanchion height at which the trucks should be loaded. Results showed that 100% of the trucks presented volume underutilization, with a maximum of 27.5 m3 (only 39.85% volume capacity). In contrast, 67% of trucks were overweight while the remaining 33% were under the legal maximum weight. The average solid/bulk volume conversion factor was 0.66 ± 0.013 at 95% confidence level. Depending on the conditions, trucks can be filled to 100% of their volume capacity with wood at an MC from 29% to 55%. The minimum truck volume capacity utilization was 45%. This methodology can be used by truck hauliers, enabling them to determine in-forest the optimum volume and weight of wood to be transported by knowing the moisture content (MC), the wood specie, and using the height of the stanchions of the trailer as reference when loading the truck.

Graphical Abstract

1. Introduction

In 2007, forests covered 10% of Ireland’s land area, and this is projected to increase to 17% by 2030 [1]. It is also forecasted that roundwood volume will increase from 3.79 million m3 in 2011 to 6.41 million m3 in 2028 [2]. This volume increase will also have a direct correlation and impact on the logistics involved in the wood supply chain.
Several modes of transportation are used in the forestry sector worldwide and truck transportation constitutes an important part of the supply chain. Road haulage represents more than 75% of Europe’s freight transport activity and according to the European Conference of Ministers of Transport [3] freight transport will grow from 50% to 60% by 2015 from the 2001 values. Road transportation is and will remain the most important mode of timber transport in Ireland, forming a substantial part of the industry’s raw material cost and having a major influence on the sector’s overall economic performance and competitiveness [4,5].
The transport of wood from the forest to the industries is carried out by trucks of different makes and models. The difference is usually given by the number of axles, axle spacing, tare weight of the truck, and the engine position in relation to the front axle. All European countries impose haulage regulations related to the restriction on dimensions and weight of the trucks. The weight restriction is more complex due to the relationship between number of axles and the distance between them and how this changes the design gross vehicle weight (DGVW).
Ireland sets a maximum of 44,000 kg for trucks with 6 axles (to be increased to 46,000 kg), and 42,000 kg for 5-axled trucks (now proposed to be reduced to 40,000 kg) [6]. The truck’s weight is monitored at weighbridges and overloaded trucks incur penalties, normally of a financial nature or ban on transporting timber for a specified period of time.
Overweight trucks can cause problems such as deterioration of roads, short vehicle life, vehicle maneouver difficulty and safety issues [7]. Martin et al. (2001) described how over one third (178,000 ha) of the existing forest in Ireland are located on peatland soil and are served by basic road infrastructure of flexible road pavements. These pavements were severely deteriorated due to heavily loaded trucks. It was reported that even trucks with 3000 kg overloaded could reduce the roads serviceability [8].
Smart Way, (2009) stated that truck fuel consumption increases with the weight of the vehicle. Heavier trucks require more fuel to accelerate and to climb hills, and may reduce the amount of cargo that can be carried relative to the unladen (tare) weight of the truck. For every 10% drop in truck weight, fuel use is reduced by between 5% and 10% [9].
Regulation on the trucks weight and dimensions highlights the challenge facing truck operators to place enough material on a truck (and trailer) of fixed dimensions in an efficient manner. According to Angus-Hankin et al. (1995) to carry less than the legal maximum weight is incurring opportunity costs [10]. In the case of wood biomass (chips and bundles) low density can decrease the productivity in transport with loads reaching the maximum legal dimensions of the truck and/or trailer before meeting the legal maximum weight [10]. Talbot and Suadicani (2006) considered the cost of road transport as being the main factor limiting the expansion of the bioenergy sector since secondary transport can be responsible for 20% to 40% of the supply chain costs [11]. Johansson et al. (2006) studied the transportation of bundles, and results showed that material with desirable low moisture content could not reach the full load weight capacity due to volume constraints, even though the material was subject to different compaction techniques. This implies that the transport vehicles cannot be used in an optimal way [12].
In the case of logs the situation is different; the material has a higher bulk density in comparison to bundles and woodchips. Maximizing the load implies attempting to reach the full load volume capacity without exceeding the legal maximum weight. Beardsell (1986) determined that there could be a substantial net gain in average payloads by eliminating both overloading and under loading [13]. Considering that many problems arise in the distribution of the payload on the truck and the effect of this on the forest road structure, Bustos and Bussenius (1996) developed a model to calculate how to distribute the load keeping the logs’ weight in an optimal position so that the gross vehicle weight (GVW) is evenly distributed in order to obtain a homogeneous weight [14].
Hamsley et al. (2007) stated that another way to potentially increase efficiency in transportation is to reduce the variability of the GVW. Their study examined variability of gross, tare and net weights to determine if more uniform weights were associated with higher payloads and lower costs. Results showed that there was an inverse relationship between the variability of GVW and mean net payload, concluding that less variable GVW yielded higher net payloads [15].
Gross vehicle weight can be controlled by weighing devices—a truck scale is a common device for measuring the weight of a heavy vehicle. However, truck scales are usually installed at fixed locations, which are not convenient for patrols to check vehicle payload on the road [7]. Gallagher et al. (2004) analyzed the differences in GVW between trucks that use scale and trucks that do not use scales (either with in-forest platform scales or electronic on-board scales). In general, they found that trucks weighed in the forest had higher net payloads than those that were not weighed. In addition, trucks that utilized scales had higher average GVW than those without scales, and they had reduced variation of GVW [16].
Bustos and Bussenius (1996) considered that it is practically impossible to handle the relationship of weight and volume of the wood accurately. The interactions between parameters as wood Moisture Content (MC), dry matter, solid and bulk density and truck payloads constraints are complex but need to be evaluated in order to deliver the material cheaply and efficiently [14]. Acuna et al. (2012) [17] used the interaction of these parameters to study how the moisture content of wood affected the costs and operational planning of three biomass supply chains. Transportation decisions from this study included calculation of total number of truckloads with chips or logs to be transported to the plant by using MC as a determining factor [17,18].
The objective of this paper is to present a methodology that can be used by truck hauliers to determine in-forest the optimum volume and payload weight of wood to be transported by knowing the wood moisture content and using the height of the stanchions of the trailer as reference point to improve the overall log loading efficiency for subsequent improved payload as a more sustainable and efficient approach to timber/biomass transportation which is a major link in the supply chain for both the timber and bio-economy going forward

2. Materials and Methods
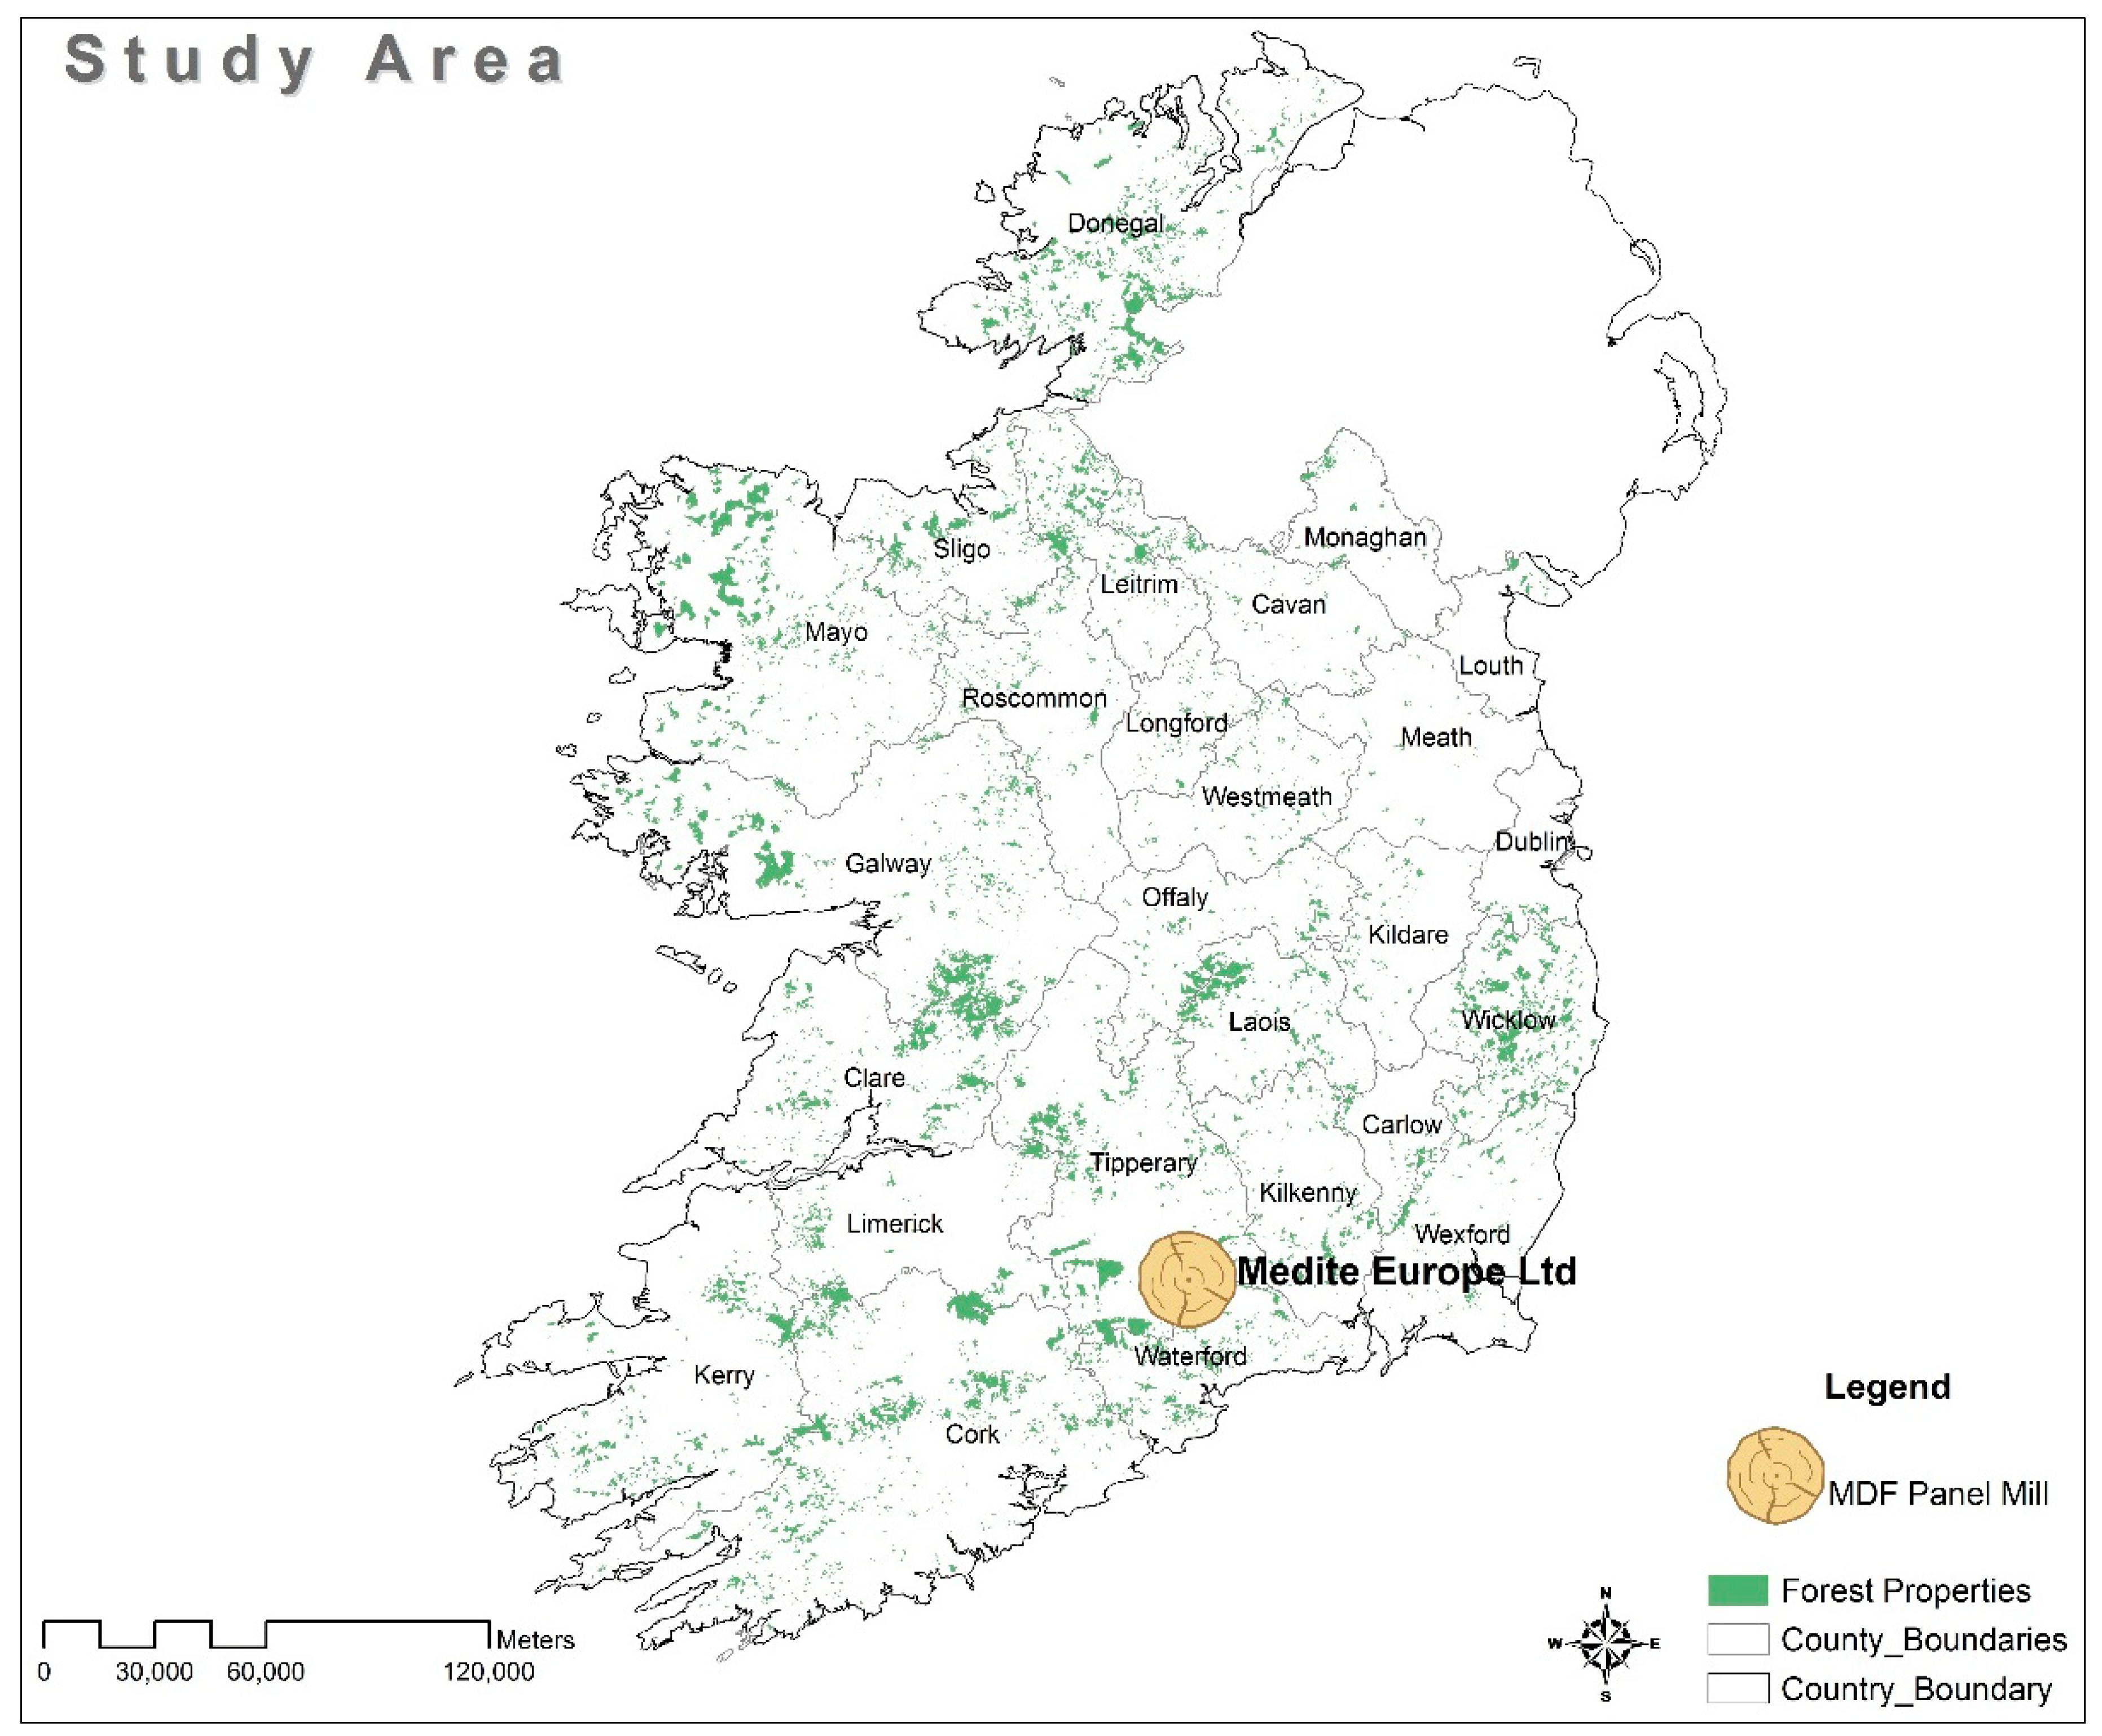
2.1. Study Site

The study was carried out in Medite Europe Ltd., one of the leading manufacturers of MDF (medium density fibreboard) in Europe, located in Clonmel, Co. Tipperary, Ireland (Figure 1). The plant has an average wood consumption of 233,525 dry tonnes/annum, used not only for panelboard production but also satisfying 90% of their 55MW heating system [18]. In 2012, Ireland processed 2.59 million m3, with 811,000 m3 processed by the panelboard industry. Biomass in this instance is mentioned as pulpwood for panel and sawmills and is also used for biomass energy. Depending on the supply chain, the pulpwood for energy is also transported in the same manner (chipped at depot as opposed to chipped in forest which means hauling biomass in timber skellig trailers and woodchips in box trailers.) Quality requirements for woodchip deliveries (chipped in forest) are based primarily on moisture and range between 40%–55% MC. MC for logs to be chipped is more flexible since chipping can occur at depot locations and in most situations can undergo a process of storing and natural drying before chipping, so the analysis in this paper has implications whether it transports logs for panel mills/sawmills or logs for biomass.
Figure 1. Study area location.
Sustainability 07 03017 g001

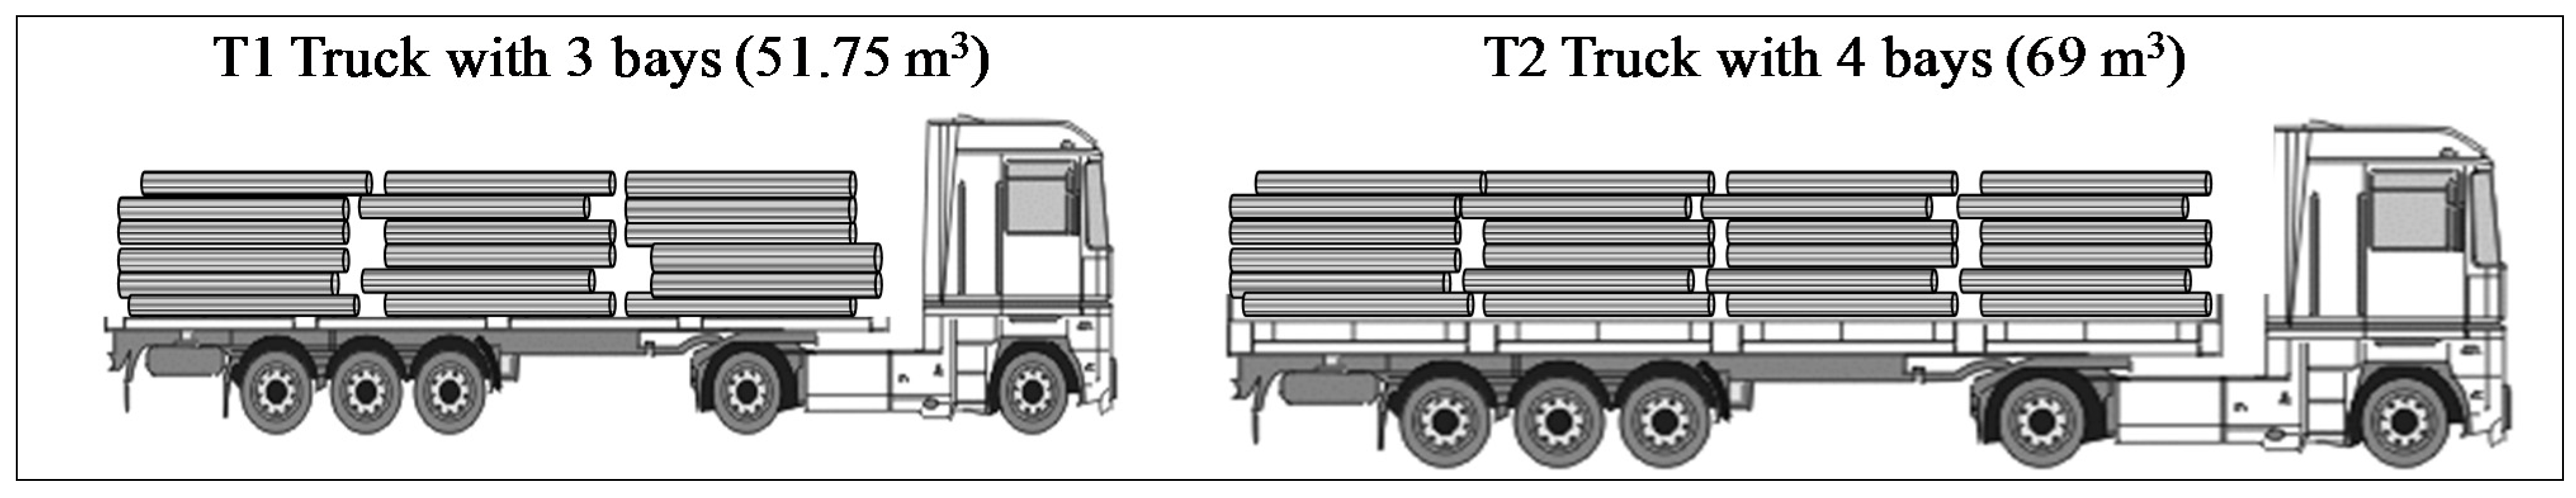
2.2. Utilization of Load Volume and Weight

In order to understand the pattern of utilization of volume, two cameras were positioned on both sides of the weighbridge at Medite Europe Ltd. Pictures were taken of 100 trucks entering the weighbridge carrying pulpwood logs of Sitka spruce. Sitka spruce represents Ireland’s most important timber species, accounting for slightly less than 60% of the forested area but more than 80% of the harvest volume [19].
The images were then processed with Adobe Photoshop CS5 Extended® software in order to digitally determine the stack volume of the loads on the trucks. Photoshop counts with a measurement extension that can define any section in an image with a ruler tool (set to a known scale o value) and accurately compute height, area, perimeter, etc. [20]
The use of Photoshop and its precise measuring tool has been used in other forest research areas [21,22]. In this study, a measurement scale was set specifying the number of pixels in the image equal to the length (cm) of the telescopic measuring staff located next to the weighbridge (Figure 2).
Figure 2. Location of the measuring staff for scaling.
Sustainability 07 03017 g002
Based on truck specifications and volume capacities of the 100 trucks studied, three types of truck combinations were identified (Table 1). However, in order to estimate the real volume utilization on trucks carrying pulpwood (3 m-long logs) the trucks were classified based in two types of volume: trucks with 3 and 4 bays carrying capacity (Figure 3).
Table 1. Truck type base on volume capacity.
Truck TypeTruck ConfigurationVolume Capacity (m3)
1Articulated/3 bays capacity67.6
2Articulated/4 bays capacity78.2
3Rigid + Trailer/4 bays capacity90.3
Figure 3. Types of truck based on real volume capacity for pulpwood.
Sustainability 07 03017 g003
To study the weight patterns on the trucks, the gross vehicle weight (GVW) at the weighbridge was recorded and compared to the design gross vehicle weight (DGVW) established in the Ireland Road Traffic Construction and Use of Vehicles Regulations [6].

2.3. Solid/Bulk Volume Conversion Factor

Wood solid volume in Ireland includes bark (indicated as over back volume) and is expressed in cubic meters. The stack volume does not accurately represent the amount of solid wood per m3 on the trucks since the logs are stacked with air spaces between them [23]. For this reason, a solid/bulk volume conversion factor needed to be calculated in order to estimate the actual solid wood volume carried by the trucks. A sample of the data recorded for the trucks can be seen in table 2 outlining the truck number in sequence, crane details, axle configuration, number of timber bays, bulk and solid volume measured along with the payload and gross vehicle weights.
The solid/bulk volume conversion factor (F) was estimated for 44 out of the 100 trucks through image processing (using the same technique used to measure stack volume), and following the standard procedures for the measurement of round timber in Ireland. This procedure consists of using a quadrant of a known area (0.49 m2) and recording the diameter of the pulpwood logs inside the quadrant, this process was repeated five times on each truck load [23].
The conversion factor is then determined by dividing the total area of the five quadrants by the area occupied by the surface area of the logs. The solid/bulk volume conversion factor helped to determine the solid volume capacity of the trucks.
Table 2. Sample selection of truck data recorded on site. Volume data measured through image processing with Photoshop.
No.Crane (Y/N)AxlesConfigurationNo. BaysBulk Volume (m3)Solid Volume (m3)DGVW (kg)Payload (kg)GVW (kg)Tare Weight (kg)
1N5 (2 + 3)Articulated345.4730.9242,00031,44046,06014,620
2Y6 (3 + 3)Rigid + Trailer437.1825.2844,00024,38044,90020,520
3Y6 (3 + 3)Rigid + Trailer539.4726.8444,00026,02046,46020,440
4Y5 (2 + 3)Articulated342.7529.0742,00029,62046,92017,300
5Y6 (3 + 3)Articulated339.0226.5344,00024,58042,34017,760
6Y6 (3 + 3) Articulated341.7628.3944,00026,08043,64017,560
7Y6 (3 + 3) Rigid + Trailer442.0928.6244,00024,84043,42018,580
8N6 (3 + 3) Articulated441.8528.4644,00026,04041,60015,560
9N5 (2+3) Articulated452.7535.8742,00030,02044,48014,460
10N6 (3+3)Articulated445.3230.8244,00027,86044,02016,160
12N5 (2+3) Articulated338.3326.0642,00026,46040,58014,120

2.4. Load Weight Determination

The basic density of Sitka spruce was estimated from 12 truckloads where the MC was available. Sample MC data was recorded by collecting sawdust from chainsaw cutting into different parts of the logs on the truck and at various locations on the truck. These samples were then measured for MC through the oven dry test method. The density of wood, including its MC was calculated in this study using Equation (1) from the Forest Products Laboratory (2010) [24].
ρ = D b × ( 1 + M C d b 100 ) ( kg / m 3 )
Where ρ   is density of wood as a function of Moisture Content (MC), D b is the basic density of the wood and MCdb is the moisture content (dry basis) of the wood. By calculating the wood density ( ρ ) at different MC the weight of the load (Wmax) to fill the two truck types based on volume (See Figure 2) and their solid volume ( T s v ) capacities were estimated (Equation (2)).
W m a x = ρ × T s v   ( kg )

2.5. Legal Maximum Payload (LMP)

In order to identify if the amount of wood loaded on the trucks was under the legal weight limit the average payload was calculated (Equation (3)), where DGVW is the design gross vehicle weight, and x ¯ T w   is the average truck tare weight.
L M P = D G V W x   ¯ T w   ( kg )
Trucks were grouped into five conditions based on their configuration, volume capacity, design gross vehicle weight (DGVW) and number of axles which determine the legal weight limit; this consists on 42,000 kg for 5-axle trucks and 44,000 kg for 6-axle trucks (Table 3).
Table 3. Characteristics of each condition.
ConditionTruck ConfigurationTruck Vol. TypeNo. AxlesDGVW (kg)
C1Rigid + Trailer with craneT26 (3 + 3)44,000
C2Truck articulated no craneT16 (3 + 3)44,000
T26 (3 + 3)44,000
C3Truck articulated with craneT16 (3 + 3)44,000
C4Truck articulated no craneT15 (2 + 3)42,000
T25 (2 + 3)42,000
C5Truck articulated with craneT15 (2 + 3)42,000

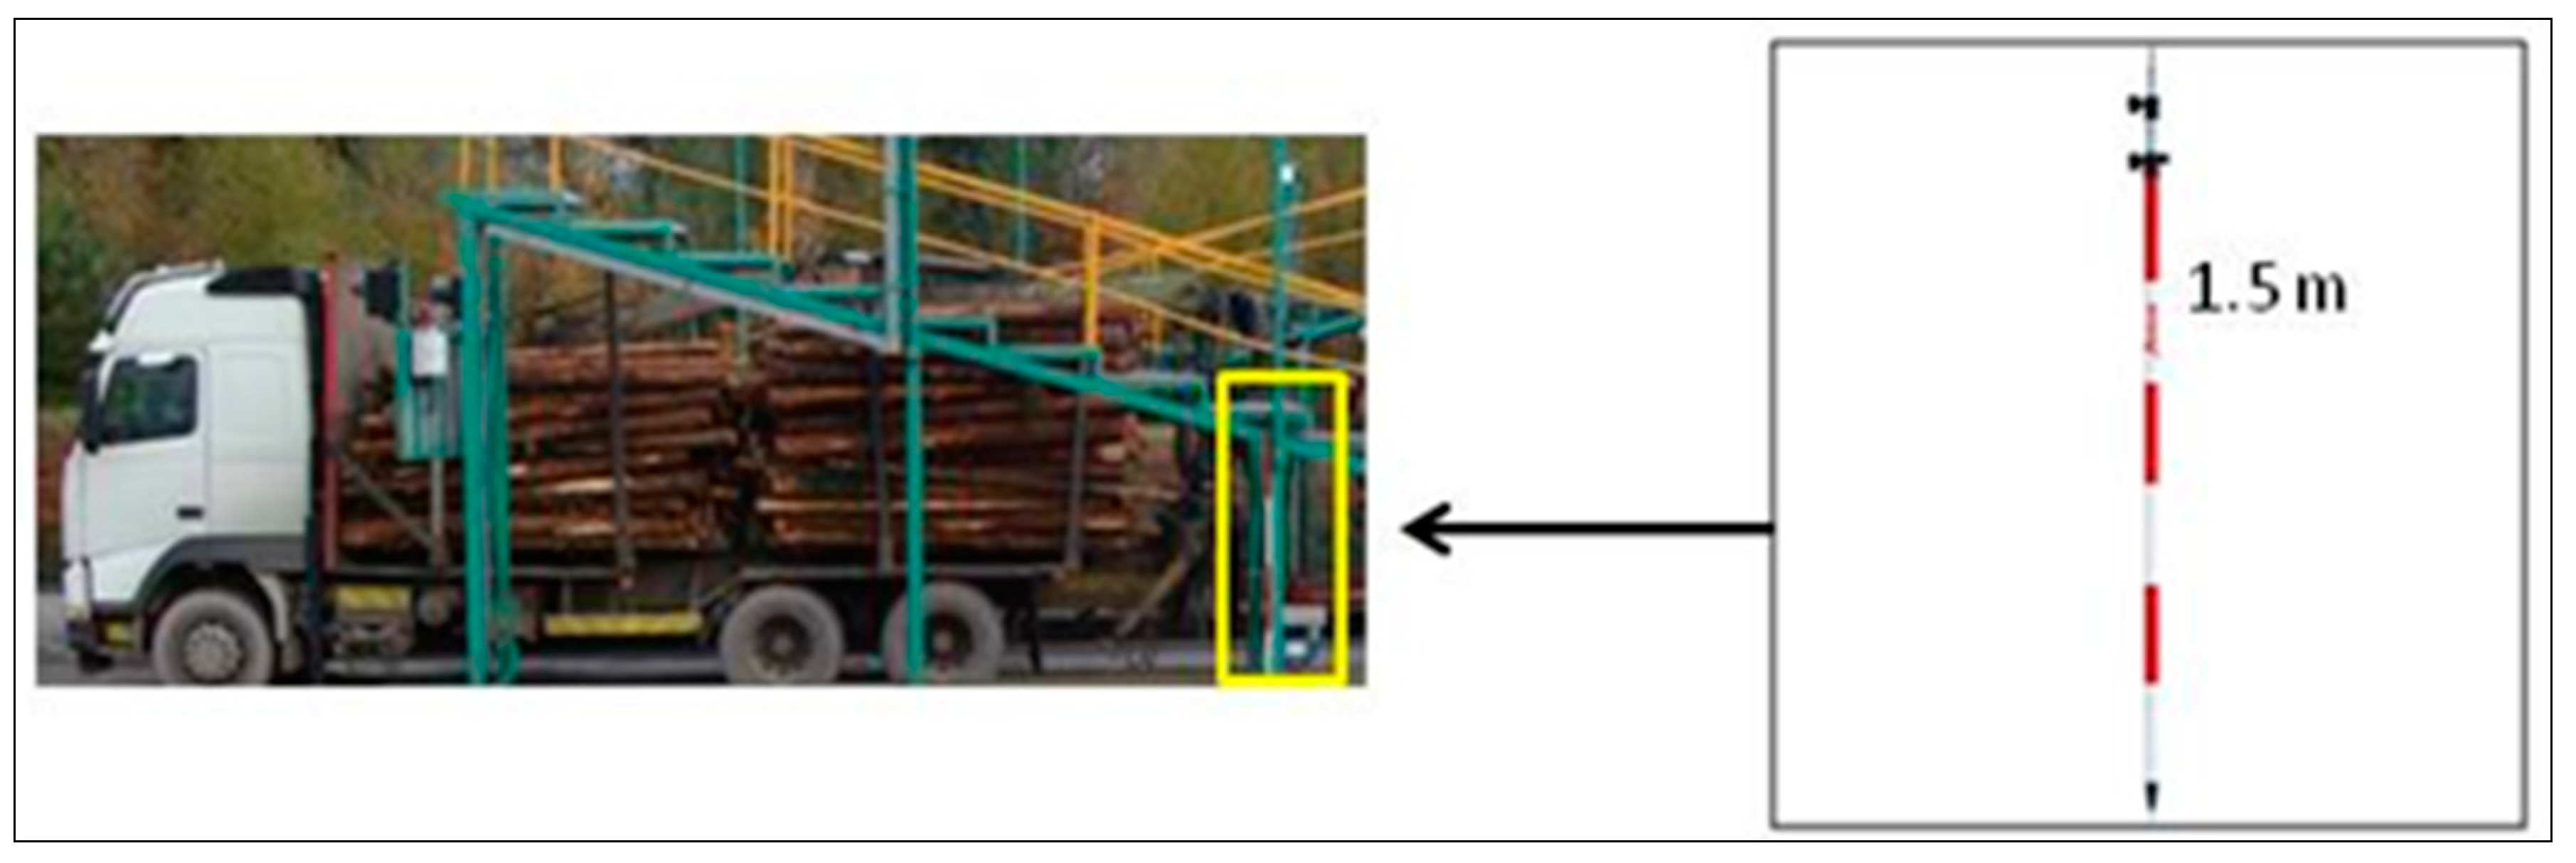
2.6. Loaded Volume Fraction (LVF)

To determine the optimal volume and stanchion’s height at which the LMP is met the Loaded fraction (LVF) was calculated for each condition as a function of the legal maximum payload (LMP), the density of the wood ( ρ ) , the moisture content (MC) and the trucks volume capacity.
L V F = L M P W m a x

3. Results

3.1. Utilization of Weight and Volume Capacity

The loads delivered to Medite ranged from 21,800 kg to 35,280 kg and load volumes ranged from 36.16 m3 to 52.75 m3. In terms of weight utilization, a higher proportion of trucks in each condition were over the legal maximum weight, with up to an average of 5050 kg (individual maximum of 7006 kg), the average weight under the LMP was 1913 kg (individual maximum of 3000 kg). Comparison between the stack volume from the 100 truckloads and the truck’s volume capacity showed that 100% of the truck loads were under the truck’s maximum volume capacity. Truck volume type T2 (four bays and 69 m3 capacity) presented the highest underuse of volume, with a maximum of 27.5 m3 for C1 (rigid + trailer). Trucks T1 (three bays capacity and 51.75 m3) presented a maximum of 10.73 m3 underused for C3 (articulated).
Loads on trucks over the legal weight limit cannot be optimized in terms of volume due to weight constraints (Table 4).
Table 4. Patterns of weight and volume by trucks under the five conditions.
ConditionTruck Vol. TypeOver the Legal Weight LimitUnder the Legal Weight Limit
% of TrucksUnderused Vol. (m3)(kg)% of TrucksUnderused Vol. (m3)(kg)
C1T26026.712284027.5845
C2T1636.632084377.52836
T26223.069003824.11913
C3T1648.117113610.73828
C4T1707.8325743010.41447
T210021.23620---
C5T1508.385050507.451020

3.2. Solid/Bulk Volume Conversion Factor

The Sitka spruce pulpwood stack/solid volume conversion factor presented an average of 0.66 ± 0.013 at 95% confidence level. An overall factor of 0.66 means that 1 m3 of stacked volume in the trucks equals to 0.66 m3 of solid wood volume. In terms of the volume capacity of the trucks, T1 with 51.75 m3 represent 34.16 m3 of solid volume capacity, and T2 with 69 m3 has a solid volume capacity of 45.54 m3.

3.3. Density with MC Variation and Load Determination

Moisture content in wood could be determined in field with the help of moisture meters. Becerra (2012) tested the accuracy on different moisture meter instruments on different products of varied species. He concluded that factors such as tool accuracy, precision, efficiency, and mechanical reliability are important factors that should be considered when determining which tool or combination of tool to use, and those improvements are still needed in the manufacturing of moisture meters [25].
Moisture content measurement can also be carried out in conjunction with the forest companies that can monitor the moisture content of the wood at roadside. The use of drying models like the one developed by Murphy et al. (2012) shows how the air drying rates depend on the specie, season in which drying began, and storage system. This model is able to predict the number of days required for the wood to reach a specific MC at any off-forest location in Ireland [19].
The estimated basic density of Sitka spruce for this study presented a mean value of 377 ± 22 kg/m3 (at 95% confidence level), providing the basis for calculating the density of wood at different MC and the weight of the load (Wmax) to fill the total solid volume capacity of the trucks (Table 5).
Table 5. Amount of wood at different moisture contents to be loaded in the trucks.
MC %Density (kg/m3)Wood in T1 (kg)
at 34.16 m3
Wood in T2 (kg)
at 45.54 m3
037712,87617,169
3053918,39524,527
4062821,46128,614
5075425,75334,337
6094332,19142,921
70125742,92157,229

3.4. Legal Maximum Payload

The Legal Maximum Payload varied depending on the number of axles on the truck and on the materials used on the construction of the trucks which affect the tare weight. Trucks in C1, C3 and C5 present a higher LMP than trucks from C2 and C4 due to the presence of crane on the truck which increases the tare weight on an average of 2800 kg. There are variations on the tare weight on trucks for each condition that can possibly be attributed to the weight of fuel on the truck at the weighbridge (Table 6).
Table 6. Estimation of the Legal Maximum Payload for each condition with 95% confidence intervals of the mean.
ConditionTruck TypeTare Weight (kg)LMP (kg)
C1T219,49624,504 (±0.99%)
C2T115,24728,753 (±1.46%)
T216,03327,967 (±0.95%)
C3T118,14425,856 (±1.53%)
C4T214,40227,598 (±0.99%)
T114,70727,293 (±2.60%)
C5T117,18524,815 (±1.62%)

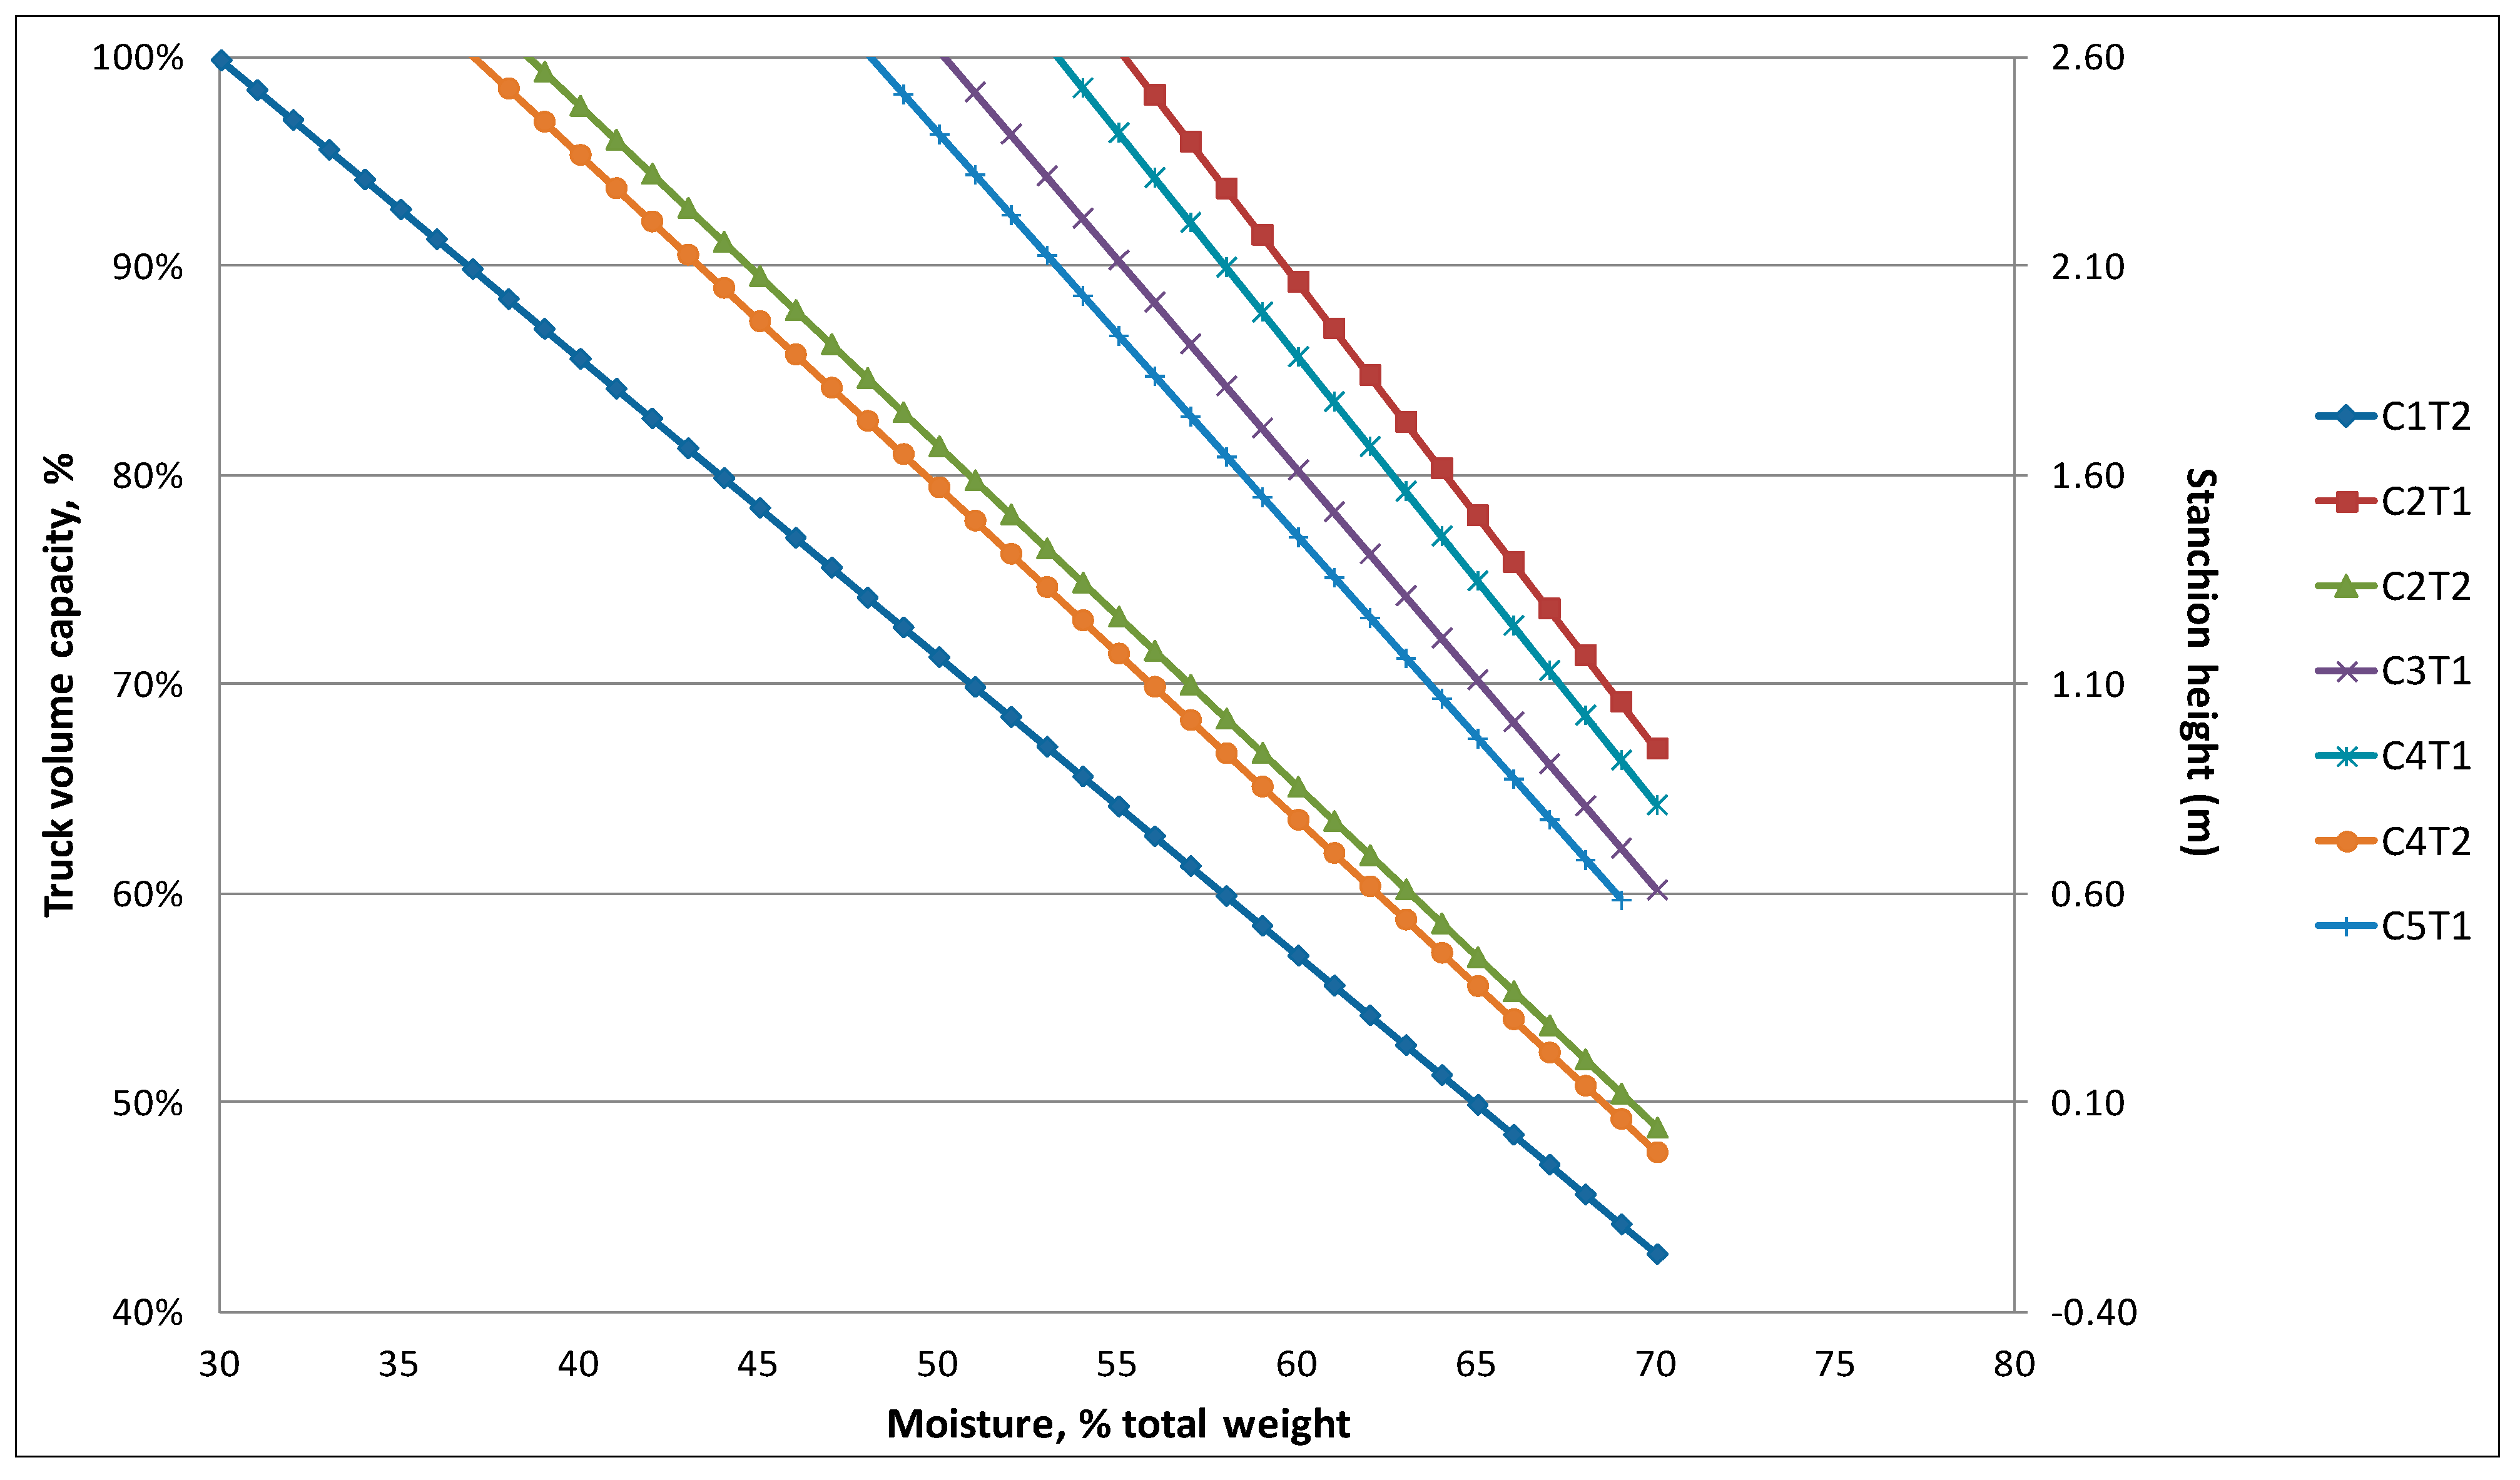
3.5. Volume Fraction

The volume fraction indicates the optimal proportion of the truck to be loaded restricted by the LMP. As MC increases the load weight also increases, reaching the LMP at lower levels of the truck’s volume capacity and stanchion height (Figure 4).
Figure 4. Different volume capacities and stanchion heights at which trucks can be loaded for each condition.
Sustainability 07 03017 g004
Table 7 presents details of the maximum volume percentage and related stanchion height at which trucks can be loaded efficiently for each condition. It depicts how the varying MC (dependent) is used to predict the stanchion heights of the timber trailer relative to the legal maximum payload restrictions for each particular truck combination and condition. The maximum MC% at which the trucks can be fully loaded varies from 25%–55%; loads exceeding these MC percent will make the truck overloaded, incurring penalties whilst on the other hand, loads under the maximum MC will result in lost revenue for that particular delivery which in turn implies more truck trips needed to deliver the required material and ultimately driving transportations costs higher.
Table 7. Different volume capacities and height of the stanchions to be filled at maximum MC% for each Condition.
Truck Volume (%) 100%90%80%70%60%55%45%
ConditionLMP (kg)Stanchion Height (m)
2.52.252.001.751.51.381.30
Maximum MC (%)
C1-T224,50425364350576168
C2-T128,7535559646872
C2-T227,96738445056636672
C3-T125,8565055606570--
C4-T127,5985358626772
C4-T227,29337434955626571
C5-T124,815485358636871-

4. Discussion and Conclusions

In terms of weight and volume utilization on trucks, it is natural that loads from the 100 trucks entering the weighbridge varied depending on factors as the loader operator, MC, loading area conditions, etc. The variation of underutilization on volume (6.63 m3 to 27.5 m3) and on weight (828 kg to 1913 kg) affect the transportation costs; the smaller the load, the higher hauling costs per unit of product supplied.
The Legal Maximum Payload (LMP) varied for each condition, with articulated trucks in C2-T1 and C2-T2 presenting the highest load weight capacity; this is mostly influenced by having 6 axles which sets the maximum legal GVW in Ireland (44,000 kg) combined with a low tare weight, and the absence of crane. On the contrary, the high tare weight in rigid + trailer trucks translates into low LMP. Šušnjar et al. (2011) studied the weights and wheel pressure on articulated and rigid + trailer trucks obtaining similar results, and envisaging a bigger use of articulated trucks in Croatia [26].
Improving loading efficiency improves hauling productivity (kg/day); to make as many trips as possible with the maximum legal weight will depend upon to a certain extent on the tare weight of the truck and trailer [27]. The heavier the truck’s tare the lower the payload and this points out the importance of construction materials when choosing a truck, considering also that a crane increases the tare weight by an average of 2800 kg.
Studies in United States present how weight reduction methods can increase payloads by 1–4 tonnes [28]. Some strategies consist on the installation of a more modern and lighter crane of the same capabilities [26], the use of more modern materials for the construction of trailers/using lightweight components [29], using a fold-up pole trailer [30], and even, when possible, eliminating the sleeper-cab [31].
Another strategy to increase payload is by reducing gross vehicle weight (GVW) variability, Hamsley et al. (2007) stated that 1% decrease in GVW variability yielded 0.22 to 0.73 ton increase in payload weight. A suggested potential savings of $100 million annually in the southern United States by fully loading trucks more consistently; so determine the load weight before arriving at the mill is important [15].
Weighing in-forest through an on-board system generally reduces the variability of GVW, and increases the payload by minimizing the light payloads and reducing the possibilities of financial penalties due to overweight trucks [16,28]. On the other hand, implementing on-board weighing systems constitute initial capital investment to install such a system together with the increase in managerial duties in order to effectively use the information it provides to the benefit of the haulage company [32].
In Ireland, most of the truckloads are weighed at the processing plant or weigh stations at fixed locations along the road network. Weighing devices on trucks are not common in Ireland, with only few hauliers installing basic systems based on pressure gauges to give an indication of payload weight. The UK Code of Practice on timber transport requires all timber haulage vehicles to operate with weighing devices [33]. Load weighing devices were initially trialled experimentally in Ireland some 10 years ago, without any appreciable uptake, mainly as result of cost. In more recent years, individual hauliers have been experimenting with less expensive units. A more recent study that tested a new air weigh system fitted to the middle axle airbags of the trailer and back axle of the truck that gave a digital in-cab reading for the driver suggests an average accuracy to within 568 kg [34].
The aim of this study was to control and improve the truck’s loading efficiency by developing a methodology where the maximum loading volume can be determined under legal weight restrictions through managing the moisture content of the wood in the field. A possible scenario for this method consists on truck hauliers determining the moisture content before loading the trucks. The Load Volume Fraction (LVF) for specific species and products at different moisture content could be tabulated with the purpose of helping the haulier to determine the percentage (or side bar heights) of their trucks to be loaded, thus providing confidence to the hauliers that their load is under the maximum legal weight restrictions.
By optimizing the load efficiency using the LVF, an aspect to consider is to choose the proper loading technique to help constitute a more uniform load. In Ireland it is common practice to load logs top to tail to ensure an even balance of the load. This loading method was observed to increase the payload for pulpwood loads by 3% and facilitate unloading without having the load fall apart [16].
Shaffer and Stuart (2009) consider that while it is always desirable to maximize payload, there may be times when under loading is a more efficient strategy. The extra ton on a truck may actually be costing money if it required that the truck be pushed out of the woods by a skidder, run on lower range gears to make it over a mountain, use more fuel, and take longer to complete the trip [31].
In conclusion, getting a better understanding of truck configurations and the volume and weight capacities is crucial to assessing the adequate type of truck to use. The use of articulated trucks without crane allow higher payload, followed by articulated trucks with crane, and ultimately rigid-trailer trucks presented the lowest LMP. Nevertheless, it has to be considered that rigid-trailer truck combinations give more accessibility to forest areas than the articulated counterparts. The authors acknowledge that further studies may be required to test and relate the variability of basic density for Sitka spruce in Ireland and is ultimately one of the factors that will affect the LMP in Ireland.

Acknowledgments

This study was funded by CoFoRD Forest Energy Programme 2008/RD (National Council for Forest Research and Development in Ireland) and under the Charles Parsons Energy Research Program (Grant Number 6C/CP/E001) of Science Foundation Ireland (www.sfi.ie).

Author Contributions

Ger Devlin, Amanda Sosa and Radomir Klvac collected the data and wrote the manuscript. Enda Coates and Tom Kent contributed with the concept development and access to the study area.

Conflicts of Interest

The authors declare no conflict of interest.

References

  1. Department of the Environment Heritage and Local Government. Ireland: National Climate Change Strategy 2007–2012; Department of the Environment, Heritage and Local Government: Dublin, Ireland, 2007; p. 60. [Google Scholar]
  2. Phillips, J.; Redmond, J.; Mac Siurtain, M.; Nemesova, A. Roundwood Production from Private Sector Forests 2009–2028. A Geospatial Forecast; COFORD (National Council for Forest Research and Development): Dublin, Ireland, 2009. [Google Scholar]
  3. ECMT (European Conference of Ministers of Transport). Regulatory Reform in Road Freight Transport. In Proceedings of the International Seminar, Paris, France, 29–30 March 2001; p. 84.
  4. Devlin, G.; McDonnell, K.; Ward, S. Timber haulage routing in Ireland: An analysis using GIS and GPS. J. Transp. Geogr. 2008, 16, 63–72. [Google Scholar] [CrossRef]
  5. Devlin, G.; Klvac, R.; McDonnell, K. Fuel efficiency and CO2 emissions of biomass based haulage in Ireland—A case study. Energy 2013, 54, 55–62. [Google Scholar] [CrossRef]
  6. Road Traffic (Construction, Use of Vehicles). Guidelines on Maximum Weight and Dimensions of Mechanically Propelled Vehicles and Trailers; Department of Transport: Dublin, Ireland, 2003. [Google Scholar]
  7. Yang, S.; Liu, T.; Cheng, Y. Automatic measurement of payload for heavy vehicles using strain gages. Measurement 2008, 41, 491–502. [Google Scholar] [CrossRef]
  8. Martin, A.; Owende, P.; Holden, N.; Ward, S.; O’Mahony, M. Designation of timber extraction routes in a GIS using road maintenance cost data. For. Product J. 2001, 51, 32–38. [Google Scholar]
  9. U.S. Environmental Protection Agency. Smart Way Weight Reduction: A Glance at Clean Freight Strategies; U.S. Environmental Protection Agency: Washington, DC, USA, 2009. [Google Scholar]
  10. Angus-Hankin, C.; Stokes, B.; Twaddle, A. The transportation of fuelwood from forest to facility. Biomass Bioenerg. 1995, 9, 191–203. [Google Scholar] [CrossRef]
  11. Talbot, B.; Suadicani, K. Road transport of forest chips: Containers vs. bulk trailers. For. Stud./Metsanduslikud Uurim. 2006, 45, 11–22. [Google Scholar]
  12. Johansson, J.; Liss, J.; Gullberg, T.; Björheden, T. Transport and handling of forest energy bundles—advantages and problems. Biomass Bioenerg. 2006, 30, 334–341. [Google Scholar] [CrossRef]
  13. Beardsell, M. Decreasing the Cost of Hauling Timber through Increasing Payload. Ph.D. Thesis, Virginia Polytechnic Institute and State University, Blacksburg, VA, USA, 1986. [Google Scholar]
  14. Bustos, O.; Bussenius, W. Optimization of load distribution on forest trucks. In Seminar on Environmentally Sound Forest Roads and Wood Transport; FAO: Sinaia, Romania, 1996; p. 424. [Google Scholar]
  15. Hamsley, A.; Greene, W.G.; Siry, J.; Mendell, B. Improving timber trucking performance by reducing variability of log truck weights. South. J. Appl. For. 2007, 31, 12–16. [Google Scholar]
  16. Gallagher, T.; Mc Donald, M.; Smidt, M.; Tufts, R. Let’s Talk Trucking: Weights and Loading Methods, Technical Paper; Forest Resources Association Inc.: Rockville, MD, USA, 2004. [Google Scholar]
  17. Acuna, M.; Anttila, P.; Sikanen, L.; Prinz, R.; Asikainen, A. Predicting and Controlling Moisture Content to Optimise Forest Biomass Logistics. Croat. J. For. Eng. 2012, 33, 225–238. [Google Scholar]
  18. Coillte. Coillte Annual Report 2012. Available online: http://annualreport2012.coillte.ie/index.php?id=47 (accessed on 10 March 2015).
  19. Murphy, G.; Kofman, P.; Kent, T. Modeling air drying of Sitka spruce (Picea sitchensis ) biomass in off-forest storage yards in Ireland. For. Prod. J. 2012, 62, 443–449. [Google Scholar]
  20. Adobe Systems. Using Adobe Photoshop CS5: Help and Tutorials; Adobe Systems Inc.: San Jose, CA, USA, 2011. [Google Scholar]
  21. Chen, B.; Fu, Z.; Pan, Y.; Wang, J.; Zeng, Z. Single Leaf Area Measurement Using Digital Camera Image. In Computer and Computing Technologies in Agriculture IV SE-64; Li, D., Liu, Y., Chen, Y., Eds.; Springer: Berlin, Germary, 2011; Volume 345, pp. 525–530. [Google Scholar]
  22. James, R.R.; Newcombe, G. Defoliation patterns and genetics of insect resistance in cottonwoods. Canad. J. For. Res. 2000, 30, 85–90. [Google Scholar] [CrossRef]
  23. Kofman, P.D.; Kent, T. Storage and seasoning of conifer roundwood in the forest. Available online: http://www.coford.ie/media/coford/content/publications/projectreports/cofordconnects/ccn09-ht17.pdf (accessed on 10 March 2015).
  24. Wood Handbook—Wood as an Engineering Material; General Technical Report FPL-GTR-190; U.S. Department of Agriculture, Forest Service, Forest Products Laboratory: Madison, WI, USA, 2010.
  25. Becerra, F. Evaluation of Six Tools for Estimating Woody Biomass Moisture Content. Master’s Thesis, Oregon State University, Corvallis, OR, USA, 2012; p. 146. [Google Scholar]
  26. Šušnjar, M.; Horvat, D.; Zorić, M.; Pandur, Z.; Vusić, D. Comparison of Real Axle Loads and Wheel Pressure of Truck Units for Wood Transportation with Legal Restrictions. In Proceedings of FORMEC 2011: Pushing the Boundaries with Research and Innovation in Forest Engineering, Graz, Austria, 9–13 October 2011.
  27. Tufts, R.; Gallagher, T.; McDonald, T.; Smidt, M. Let’s Talk Trucking: Truck Performance and Fuel Consumption; Tech. Pap.05-P-3; Forest Resources Association Inc.: Rockville, MD, USA, 2004. [Google Scholar]
  28. Lang, A.H.; Mendell, B.C. Sustainable Wood Procurement: What the Literature Tells Us. J. For. 2012, 110, 157–163. [Google Scholar]
  29. Gallagher, T.; Smidt, M.; Tufts, R.; McDonald, T. Increasing Truck Payloads and Performance. For. Oper. Rev. 2005, 7, 18–19. [Google Scholar]
  30. Tufts, R.; Gallagher, T.; McDonald, T.; Smidt, M. Trucks and Trailers in the South; Forest Resources Association Inc.: Rockville, MD, USA, 2005. [Google Scholar]
  31. Shaffer, R.; Stuart, W. A checklist for efficient log trucking. In Virginia Cooperative Extension Publication 420–094; Virginia Tech.: Blacksburg, VA, USA, 2009; p. 5. [Google Scholar]
  32. Pletts, T. The Feasibility of Automatic on-Board Weighing Systems in the South African Sugarcane Transport Industry. Master’s Thesis, University of KwaZulu-Natal, Dublin, Ireland, 2009; p. 104. [Google Scholar]
  33. Round Haulage of Round Timber: Code of Practice. Available online: http://www.forestry.gov.uk/pdf/TimberHaulageCodeofPractice.pdf/$file/TimberHaulageCodeofPractice.pdf (accessed on 10 March 2015).
  34. Devlin, G. Assessing the Accuracy of New Innovative on Board Weighing Devices for Timber Haulage. In Proceedings of the Forest Industry Transport Group Conference, Port Laoise, UK, 6 September 2013.

