Article

Boosting Blue Growth in a Mild Sea: Analysis of the Synergies Produced by a Multi-Purpose Offshore Installation in the Northern Adriatic, Italy

1
Department of Civil, Chemicals, Environmental and Material Engineering—University of Bologna, Viale Risorgimento 2, 40136 Bologna, Italy
2
Department of Engineering Università degli Studi Roma TRE, Via Vito Volterra 62, 00146 Rome, Italy
3
Kefalonia Fisheries S.A.—Livadi, Lixouri, 28200 Kefalonia, Greece
4
ENEL Ingegneria e Ricerca—Via A. Pisano 120, Pisa 56122, Italy
5
Department of Biological, Geological and Environmental Science, BIGEA, University of Bologna, Via S. Alberto 163, 48123 Ravenna, Italy
6
Department of Economics, University of Bologna, via Angherà 22, 47921 Rimini, Italy
7
Institute for the Protection Environmental Research, Via Vitaliano Brancati 48, 00144 Rome, Italy
8
Energy, Environment and Water Research Center, The Cyprus Institute, 20 Konstantinou Kavafi Street, 2121 Aglantzia, CY-1645 Nicosia, Cyprus
9
Plymouth Marine Laboratory, The Hoe, Prospect Place, PL1 3DH Plymouth, UK
*
Author to whom correspondence should be addressed.
Sustainability 2015, 7(6), 6804-6853; https://doi.org/10.3390/su7066804
Submission received: 28 January 2015 / Revised: 11 May 2015 / Accepted: 11 May 2015 / Published: 28 May 2015

Abstract

:
In the near future, the oceans will be subjected to a massive development of marine infrastructures, including offshore wind, tidal and wave energy farms and constructions for marine aquaculture. The development of these facilities will unavoidably exert environmental pressures on marine ecosystems. It is therefore crucial that the economic costs, the use of marine space and the environmental impacts of these activities remain within acceptable limits. Moreover, the installation of arrays of wave energy devices is still far from being economically feasible due to many combined aspects, such as immature technologies for energy conversion, local energy storage and moorings. Therefore, multi-purpose solutions combining renewable energy from the sea (wind, wave, tide), aquaculture and transportation facilities can be considered as a challenging, yet advantageous, way to boost blue growth. This would be due to the sharing of the costs of installation and using the produced energy locally to feed the different functionalities and optimizing marine spatial planning. This paper focuses on the synergies that may be produced by a multi-purpose offshore installation in a relatively calm sea, i.e., the Northern Adriatic Sea, Italy, and specifically offshore Venice. It analyzes the combination of aquaculture, energy production from wind and waves, and energy storage or transfer. Alternative solutions are evaluated based on specific criteria, including the maturity of the technology, the environmental impact, the induced risks and the costs. Based on expert judgment, the alternatives are ranked and a preliminary layout of the selected multi-purpose installation for the case study is proposed, to further allow the exploitation of the synergies among different functionalities.

1. Introduction

Europe’s 89,000 km coastline along two oceans and four seas strongly influences the lifestyle, wealth, and public wellbeing of its citizens.
The maritime economy accounts for as much as 5% of the total European economic activity, leading to almost 40% the Europe Union’s (EU’s) Gross Domestic Product (GDP). European fisheries and aquaculture employ 0.7 million people and generate more than 30 billion Euros a year. European aquaculture alone has an annual production of 2.5 million tons. Components derived from marine organisms through biotechnology are already being used in food, pharmaceutical, cosmetic and chemical industries. Ninety percent of the EU’s external, and 40 percent of its internal trade are carried out by maritime transport, with 1200 ports, managing 3.5 billion tons of goods, and 350 million passengers per year.
The unexploited potential of the marine ecosystem is very large, since it is estimated that more than 90% of the marine biodiversity remains unexplored, offering a huge potential for discovery of new species and applications derived from biotechnologies, which is foreseen to generate 10% annual growth for this sector [1].
The potential for marine energy is also still far from being realized and used. Offshore, together with onshore, wind energy could deliver, competitively, 2600 TWh of energy, which represents up to 20% of the total demand for electricity in Europe [2]. Wave, tidal and thermal energy could provide a substantial contribution to the renewable energy production of many European countries. However, costs are still high, especially for immature technology, i.e., wave energy extraction, due to the limited energy conversion efficiency, unreliable moorings, and survivability of the devices [3,4].
At the same time, these human activities are causing environmental and ecological changes of global significance. Europe ranks first among the regions whose coastal ecosystems are most threatened by degradation, with the 86% of its coasts at either high or moderate risk [5]. Over the centuries, land reclamation, coastal development, overfishing and pollution have caused dramatic loss of European wetlands, seagrass meadows, shellfish beds, biogenic reefs and other productive and diverse coastal habitats [6], while the remaining habitats face increasing pressures from urban sprawl, commercial exploitation and climatic instabilities.
Wind turbines, off shore terminals, pipelines, motorways at sea and fish farms are going to occupy more and more marine space in the future. The development of these activities and the competition for limited coastal and marine space poses great challenges to the fragmented approach of maritime affair management. There is therefore an urgent need to increase awareness among private and public bodies and to provide policy makers with knowledge and tools to optimize the design and the location of these activities, thus preserving ecosystem services, whilst aiming to keep up with the ever increasing global food and energy demand, which is forecasted to rise 50% by 2030.
Within this context, the “Innovative Multi-purpose offshore platforms: planning, design & operation” FP 7 MERMAID project [7] is developing concepts for next generation offshore platforms, including energy extraction, aquaculture and transportation. Other recently ended FP 7 projects (“Modular multi-use deep water offshore platform harnessing and servicing Mediterranean, Subtropical and Tropical marine and maritime resources”, TROPOS, [8]; “Development of a Wind-Wave Power Open-Sea Platform Equipped for Hydrogen Generation with Support for Multiple Users of Energy”, H2Ocean, [9]) also investigated similar concepts.
Some research already exists on the synergies achievable by combining wind and wave energy installation (ORECCA project [10,11]). The co-location might lead to a common regulatory framework for a better coordinated maritime spatial planning and a simplified licensing procedure. Technological advantages might include enhanced energy yields, smoothed power output, common grid infrastructure and substructure or foundations, shared logistics, operation and maintenance. The combined use of wave and wind field data and numerical models allowed to demonstrate the improved power production in both terms of continuity and magnitude in real case studies, a. o. in France [12], California [13], Denmark [14], Spain [15], Germany [16], and Ireland [17]. These studies also underlined the significance of shadow effects and interactions among devices, suggesting the need to target the optimized layout, based on the local wave climate.
Currently, there are only a few studies dealing with co-location of aquaculture and wind farms [18,19,20,21]. This paper aims to demonstrate the potential synergies in terms of resources exploitation, space optimization and mitigation of environmental impacts that can be achieved by considering the integration of different uses in a Multi-purpose offshore Platform (MUP) at a given offshore site. It makes use and integrates some of the outcomes of the ongoing MERMAID project, through their application to a case study in the Mediterranean Sea, addressing the following more specific questions.
  • What is the knowledge base necessary to develop a MUP?
  • How can different conceptual MUP alternatives be examined and ranked?
  • How far can synergies among different uses affect the design and decision making process for an offshore installation?
The paper structure is as follows. Section 2 describes the site where the hypothetical offshore installation would be placed, including the climate and the environmental conditions, the legal constraints and incentives, and the perception of local communities. Section 3 analyses the potential of single-purpose installations for the exploitation of renewable energy from wind and waves and of aquaculture. The possibility of transferring energy to the grid or to construct a stand-alone solution, in the case where different uses are combined together, is examined. Section 4 is a first attempt of an environmental impact assessment, taking into account the proposed uses of the installation in Section 3. In Section 5, a multi-criteria procedure [22] is applied to select and rank different conceptual design alternatives. Some indications regarding the best configuration of the layout for the selected schemes are also given. Finally, some conclusions about the synergies that can be obtained by integrating different uses are drawn in Section 6.

2. Description of the Site

This Section provides the meteorological, oceanographic, environmental, social and economic conditions and constraints for the hypothetical design of the offshore installation. Section 2.1 synthesizes the location and the main challenges of the site. The meteorological and oceanographic conditions, including the typical and extreme wind and wave climate, are reported in Section 2.2. The environmental characteristics and the main habitats and species (including transient marine mammals) populating the area are described in Section 2.3. Legal constraints and incentives regulating offshore installations, and specifically the exploitation of aquaculture and renewable energies, at European, National and local levels are summarized in Section 2.4. The opinions of stakeholders participating in focus groups are the subject of Section 2.5.

2.1. Features of the Site

The selected area for this hypothetical installation is the Northern Adriatic Sea, East of Italy, and specifically offshore Venice coastline. The area is characterized by the following challenging features:
  • it is one of the areas with the lowest marine renewable energy potential in the Mediterranean, and therefore a single purpose installation aiming at energy exploitation only would be ineffective;
  • the area is already largely developed, with potential conflict of uses due to the presence of harbors, commercial and touristic maritime routes, and fisheries;
  • the Northern Adriatic is already severely affected by multiple anthropogenic pressures (including existing oil and gas platforms), which combined with increasing climatic instabilities, can exacerbate nonlinear responses of ecosystems to further human impacts and limit their recovery capacity; and
  • the vicinity of the city of Venice increases the social sensitivity to the construction of new marine infrastructures.
The hypothetical multi-use platform is placed nearby the Acqua Alta platform (Coordinates: latitude: 45°18′51″ North; longitude: 12°30′30″ East), a research platform at 16 m depth held by the Italian National Research Centre [23].
The Acqua Alta platform has collected met-ocean and physical information since it was built in 1970, including measurements of: wind (two levels), air temperature, air humidity, solar radiation, rain, waves (directional), tide, and sea temperature (two levels). There are also underwater cameras that allow monitoring the fish species present nearby the platform. These data have allowed a careful evaluation of the site.
The platform is located in Regione Veneto, 16 km off the coastline of Venice (Figure 1), in one of the most developed and wealthy Regions in Italy (e.g., 26,455 euro GDP per capita; 6% unemployment rate; 36% graduate; and 10% post-graduate education). The area is of renowned cultural, technical and industrial interest due to the presence of the city of Venice and to the challenges imposed by extreme flood events to the harbor and City of Venice, and its tourist and industrial activities.
In this area, the interest in wave energy production has recently increased, leading to two pilot installations of point absorbers in Venice Lagoon co-funded by the Venice Municipality: the GIANT in Giudecca canal (patent 2007, estimated power production: 3–5 kW/module, [24] ) and the WEMpower in Certosa island (patent 2011, estimated power production: 35 MW/module, [25]).
Figure 1. Location of the site and bathymetry of the area.
Sustainability 07 06804 g001
Most significant environmental characteristics of the area include
  • micro-tidal environment (tidal range < 2 m);
  • semi-enclosed basin with an average slope of 0.35 m/km and an average depth of 40 m;
  • high seasonal variability, sharp stratification and very high productivity rates;
  • peculiar biogeography and hydrology;
  • high population density and tourism; and
  • high levels of eutrophication, pollution, and development of coastal and marine infrastructures, a. o. presence of 100 offshore gas platforms in sedimentary environments (~10–120 m) in the Northern Adriatic Sea.

2.2. Met-Ocean Conditions and Renewable Energy Potential

The wind and wave measurements, collected at the Acqua Alta Tower, cover most of the period from 1987 up to 2007.
The mean annual wind and wave regimes are represented in Figure 2 by means of the frequency/direction/intensity diagram (i.e., rose diagram). Both mean wind velocities, Vw, and significant wave heights, Hs, clearly show two main directions from the North East (Bora, between 0°N and 85°N) and from the South East (Scirocco, between 105°N and 175°N), being the Bora direction dominant both in intensity and frequency.
Figure 2. Mean annual wind (to the left) and wave (to the right) regime (rose diagram), based on measurements at the Acqua Alta platform in the periods 1992–2007 and 1987–2007, respectively.
Sustainability 07 06804 g002
The values of Vw range between 3 and 4 m/s at 25 m height, with a corresponding estimated Vw = 4.54 m/s at 100 m height. The available resource appears to be quite limited, as Orecca FP7 project [10] established a minimum threshold value of 6 m/s at hub height for the exploitation of offshore wind energy at a given site.
Table 1 synthesizes the typical yearly wave climate by assigning the percentage frequency to the combinations of wave heights and periods. The maximum measured value of Hs is slightly higher than 4 m and the calm period is close to 40% (if one considers as calm, the wave conditions characterized by the significant wave height Hs < 0.25 m). This is consistent with the wave features of the Northern Adriatic Sea, i.e., enclosed basin with relatively small fetches.
Table 1. Typical yearly wave climate, summarizing the percentage frequency (reported in each cell) of different combinations of peak wave periods Tp (ranges of Tp reported in the first column) and wave heights Hs (ranges of Hs reported in the first row).
Tp (s)\Hs (m)0–0.250.25–0.50.5–11–1.51.5–22–2.52.5–33–44–55–7%
0–10.0000.0000.0000.0000.0000.0000.0000.000.000.000.00
1–20.9900.4490.0040.0000.0000.0000.0000.000.000.001.44
2–310.2435.4170.3260.0100.0000.0020.0000.000.000.0016.00
3–415.56614.1785.9440.2000.0080.0080.0000.000.000.0035.91
4–55.9546.6669.4552.6830.2730.0550.0140.000.000.0025.10
5–62.4042.2483.4542.5531.3750.4730.0290.000.000.0012.54
6–71.0450.9301.5431.0880.6260.3630.2040.020.000.005.82
7–80.3980.3550.4710.4260.2840.1630.0430.020.000.002.16
8–90.1490.1270.1160.0840.0860.0370.0100.010.000.000.63
9–100.0670.0330.0370.0160.0270.0140.0060.010.000.000.21
10–120.060.020.020.020.020.000.000.000.000.000.14
12–140.020.000.000.010.010.000.000.000.000.000.05
14–160.010.000.000.000.000.000.000.000.000.000.01
%36.9030.4221.377.092.711.120.310.070.000.00100.00
The wave energy resource can be assessed from Table 1 by calculating the available energy power per unit of wave front, Pw, according to the following equation that is suited to intermediate depths:
P w = 1 16 ρ g H s 2 c g
where ρ is the sea water density, g is the acceleration due to gravity, and cg is the local celerity of the wave group.
The mean available annual wave power is around 1.1 kW/m and therefore around an order of magnitude lower with respect to the typical existing installations.
To design a MUP, also survivability conditions have to be assessed. Both for wind and waves, the Peak Over Threshold (POT) method was used, by assuming the threshold values Vw = 20.0 m/s and Hs = 2.5 m that ensure carrying out the analysis on homogeneous and statistically independent datasets. Three Probability Density Functions (PDFs) were adopted to obtain the design parameter as a function of the return period, namely the Gumbel, Frechet and Generalized Extreme Value (GEV) distributions. Table 2 provides the design values of Hs and Vw as a function of the return period.
The GEV and the Frechet distribution better fit the empirical observations of Hs and Vw, respectively.

2.3. Environment and Biota

The North Adriatic is a shallow, semi-enclosed, basin with an average slope of 0.35 m/km and an average depth of 40 m. The bottom is a mixture of sand and mud, deepening gently towards the Southeast with a 1 m/km slope. These bathymetric characteristics lead to peculiar circulation patterns, high seasonal variability, sharp stratification and very high productivity rates [26]. The general circulation is cyclonic (counter-clockwise), highly variable with seasons, mainly driven by the prevalent winds (NE and SE, see Section 2.2) and by river discharge [27]. The most significant contribution is from the Po River, with an annual mean flow rate of 1700 m3/s [28].
Table 2. Estimate of the significant wind velocity as a function of the return period TR.
TR (years)Vw (m/s) GumbelVw (m/s) FrechetVw (m/s) GEVHs (m) GumbelHs (m) FrechetHs (m) GEV
1.122.2922.2422.172.562.582.58
1024.9325.0325.323.323.313.31
2025.7125.9126.443.53.513.51
3026.1626.4427.143.63.623.63
5026.7327.1128.073.733.783.78
10027.5028.0629.443.93.993.99
15027.9528.6330.3044.124.12
20028.2729.0330.934.074.224.22
The Po river plume largely affects the deposition of sediments and causes a reduction in salinity from freshwater discharge [26,29]. Owing to river runoff and oceanographic conditions, the region also exhibits a decreasing trend of nutrient concentration and production from North to South and from West to East [30], see the mean concentration of Chlorophyll-a in Figure 3.
Figure 3. Estimated geophysical parameters from MEdium Resolution Immaging Spectrometer (MERIS) sensor onboard ENVironmental SATelite (ENVISAT) satellite for the period 2002–2012. To the left: Average Chlorophyll-a concentration (g·m−3). To the right: Total Suspended Matter concentration (g·m−3). Main cities and rivers are shown on landside (grey area).
Sustainability 07 06804 g003
Seaward, the black star shows the location of the Acqua Alta platform. The bathymetric contours represent 10 m gradients.
Prevailing winds and circulation patterns affect the transport and distribution of the plume [28,29] showed that the plume is generally confined to the North of Ravenna. There are also regional environmental discontinuities along an inshore-offshore axis, related to differences in depth, wave-induced shear stress, sediment deposits and human impacts [29,31]. In particular, a high contribution of wave-induced shear stress in shallow water was found inshore of the 20 m isobaths, leading to high re-suspension of sediments at shallow depths [29]. This can also be appreciated in Figure 3, showing the mean concentration of Total Suspended Matter. Higher concentrations are visible in spatial patterns which reflect the effect of intense wind stress, sediment re-suspension inshore of the 20 m isobaths, basin circulation and rivers runoff.
Information on habitat distribution is scattered. Bottoms are prevailingly sedimentary, comprising mainly mud, with a mean fraction of coarser sediments (>63 µm) generally lower than 8%. Sites to the North tend to show a higher content of organic matter compared to sites to the South at similar depths. There are also differences between shallow (<20 m) and deep (>20 m) sites: the latter are characterized by a greater content of organic matter, and a lower content of coarse sediment (>63 µm), while the former have a greater proportion of sand.
Macrofaunal assemblages at shallow sites comprise mainly amphipods (Ampelisca spp.) and bivalves (Nucula nucleus, Corbula gibba, Mysella bidentata), with a lower presence of polychaetes (Lumbrineris spp. and unidentified Paraonidae). Assemblages at deeper sites have higher species diversity, and are characterized by greater abundances of polychaete worms (Sternapsis scutata, unidentified Cirratulidae and Polycirrus cf. haematodes). Sites to the North (which are under the direct influence of the Po river plume) tend to be characterized by higher average abundances of bivalves (Abra nitida, Abra albra), amphipods (Ampelisca spp.), and polychaetes (Polycirrus cf. haematodes, Polydora flava, unidentified Cirratulidae and unidentified Paraonidae) compared to Southern sites.
Sparse coralligenous rocky outcrops (locally named Tegnùe), also occur in the region, between 10 and 40 m depth, ranging in size from few to 1000 s·m2, and with elevations of 1 to 4 m above surrounding sediments [32]. These rocky outcrops are biogenic reef built predominantly by calcareous algae and characterized by highly diverse assemblages, mainly comprising filter feeders (sponges, colonial ascidians and cnidarians), endobiotic organisms and fish fauna.
The Northern Adriatic Sea is a strategic area for marine vertebrate conservation, sheltering important seabird populations [33]. The area also includes important populations of endangered marine mammals, turtles and elasmobranchs [34,35,36]. The common bottlenose dolphin (Tursiops truncatus) is the most frequently recorded mammal of the Northern Adriatic cetacean fauna, while the short-beaked common dolphin (Delphinus delphis) is nowadays very rare [35]. The area is also a feeding and wintering area of extreme importance for the loggerhead turtle (Caretta caretta).
In the Northern Adriatic Sea, human pressure on the coast has been historically intense [37], and environmental problems are varied and severe, including: erosion and land subsidence (both natural and human-induced); development of urban, industrial and tourist infrastructures (including the presence of >100 offshore gas platforms); transformation and loss of native habitats and assemblages; eutrophication and spread of exotic species; overfishing (including the use of impacting techniques such as trawling and hydraulic dredging) and aquaculture; extraction of offshore relict sand for beaches; and dumping of harbor-dredged material.

2.4. Current Policy, Management and Planning Strategies

Within the European framework (in particular, about social and environmental issues) and the National framework (in particular, about incentives and subsidies), the Legislative Decree No. 112 of 1998 on Regional Responsibility for Maritime State Property transfers to peripheral regional agencies all the functions related to the maritime State property (i.e., within 12 Maritime Miles).
Therefore, the site falls within the legislation of the Veneto Region. The Regional Law No. 11 of 2001 implements the Legislative Decree No. 112 of 1998, and the Deliberation of the Regional Government No. 454 of 2002 specifies referring to peripheral offices of Genio Civile for concession demands for using the maritime State property.

2.4.1. Aquaculture

The Legislative Decree No. 154 of 2004, Art. 12 (7) on the Modernization of the Fisheries and Aquaculture Sectors states that: “As for marine aquaculture carried out in coastal areas with essential ecological relevance for the conservation of biodiversity and of biological resources, with impacts on the maritime fishery such as ponds, lagoons, marshes (Comacchio, Delta del Po, Venice lagoon, Marano lagoon and Grado lagoon), peculiar dispositions are set up to control for environmental impact and to avoid water pollution”. Next, the Legislative Decree No. 11954 of 2010, Art. 4 (1) on the Production of Marine Animals and Algae by Biological Aquaculture states that “in order to reduce impacts on the sea bed and on surrounding sea water, current must be greater than 0.02 m/s on average per year and sea depth must be greater than 20 m”.
Therefore, based on these conditions, the site location has to be moved further offshore with respect to the existing Acqua Alta Tower.
However, again, the Legislative Decree No. 154 of 2004, Art. 10 (1) states that “Regions set up consulting local commissions” and the Legislative Decree No. 11954 of 2010, Art. 2 (1) states that “Regions are in charge of authorization for aquaculture activities”. Therefore, as for types of aquaculture, a hypothetical installation could develop organic and conventional aquaculture activities, either algae or sea bass, with similar ex-ante and ex-post controls on environmental issues by the peripheral offices of Genio Civile, together with the Consulting Regional Commissions.
Indeed, all types of aquaculture will have to refer to the same EU legislation (710/2009; 1005/2008; 889/2008; 834/2007), to the same control agencies (i.e., regional authorities for sustainable management) and to the same EU principles implemented by national legislation (Legislative Decree No. 11954 of 2010, Art. 1 (1); Legislative Decree No. 226 of 2001 on the Guidelines and Organization of Fisheries and Aquaculture Sectors).
The maximum size of aquaculture plants was increased from the maximum limit of 2600 ha up to 3% first by the Deliberation of the Regional Government No. 2948 of 2007 on Integrative Dispositions about Maritime State Property Concession Release for Fish and Aquaculture Activities. Then the size was further increased up to 10% in 2008 and finally the limitation was cancelled in 2009, by introducing ex-ante assessments at the macro-system level, such as:
  • environmental sustainability of impacts on marine ecosystems, by taking into account the fishery relying on coastal resources;
  • optimal location of plants, by considering the alternative uses of the maritime State property (e.g., production activities, infrastructure, services, environmental protection, etc.) within a planning approach involving the whole coastal area; and
  • impacts of increased production on prices, employment and profitability of aquaculture activities.
Note that the Legislative Decree No. 4 of 2012, Art.7 (1) on Dispositions for Reorganization of Normative Framework on Fisheries and Aquaculture introduces fines and temporary suspension up to permanent withdrawal of concessions, in order to preserve marine biological resources as well as to prevent, discourage and eliminate illegal, undeclared or unregulated fishery.
As for incentives, for insurance, within EU Regulation No. 1263 of 1999 on the Financial Instrument for Fisheries Guidance and the Legislative Decree No. 100 of 2005 on Further Provisions for the Modernization of the Fisheries and Aquaculture Sectors, in order to favor insurance contracts covering structural risks linked to natural events, meteorological conditions and prices fluctuations, states that “up to 80% of insurance premium can be refunded by the State” if specific conditions are met. As for subsidies, for investments, within EU Regulation No. 2792 of 1999 on Community Structural Assistance in the Fisheries Sector and the Deliberation of the Regional Government No. 3316 of 2007 on Subsidies for Fish and Aquaculture Activities states that “up to 50% of expenditures can be reimbursed by the Region”, if specific conditions are met.

2.4.2. Renewable Energy

As for sizes and locations, the Circular Letter No. 40 of 2012 by the General Direction of the Ministry of Infrastructures and Transports on Offshore Plants for Energy Production from Renewable Resources, actually focused on wind plants, states that “authorisation for construction and operation is issued by the Ministry of Infrastructures and Transports”.
The Legislative Decree No. 28 of 2011 on Incentives for Energy from Renewable Sources, which implements the Directive No. 28 of 2009 on the Promotion of the Use of Energy from Renewable Sources, ensures 0.34 € per kWh for all plants smaller than 5 MW producing energy from marine renewable sources. There is no national or regional legislation on subsidies.

2.4.3. Current Practices

There are no current experiences of offshore fish or energy farms in Veneto—actually, in Italy, an offshore marine renewable energy plant does not exist. However, a sea-bass pilot project was developed by the Veneto Region, in 2008–2010, in Porto Tolle (RO), in order to test the technical, economic, and environmental sustainability of a bio-production. The plant production was about 18000 fish and its size was 300 m2. The results of this pilot project highlighted large exploitation potential, however the pilot was completed without further development.

2.5. Social Perception and Constraints

The development of a hypothetical MUP installation has been discussed with relevant stakeholders in the area: energy companies, technical consultants, regional and local authorities, managers, private companies and associations as well as NGOs. An overview of the stakeholder composition is shown in Figure 4. First, a session was organized to invite all relevant stakeholders to express their general understanding of MUP concepts and their viewpoint about applicability to the site. Later on, all the stakeholders were asked to fill in a questionnaire. Details about the way this participatory approach to the design was organized can be found in the companion papers [38,39], and in MERMAID [7].
Figure 4. Composition of the stakeholders involved in the focus groups.
Sustainability 07 06804 g004
The more popular answers provided by the stakeholders regarding their goals for participating in the MUP design process, and the requirements are summarized in Figure 5. The stakeholders were asked to give multiple-choice answers and to rank each answer with a weight from 1 to 5. The answers were grouped under these three main sectors: Society, Economy and Environment. The weights for each of the three sectors were then derived from the normalization procedure suggested by [40] for each stakeholder, and then, as average values for the whole group of stakeholders, leading to the following final weights: Society = 25%, Economy = 27%, and Environment = 48%.
Overall, the concept of MUPs is considered an interesting demonstration activity useful for boosting synergies among private and public institutions, to use marine resources in a responsible way, with an ultimate goal of exploring the potentials of new solutions for energy harvesting in the mid-term and at preserving ecosystem services in the long run.
For the stakeholders a key prerequisite for a MUP installation is the set-up of a participatory and multidisciplinary design process based on clear responsibilities and cooperation amongst users. Specifically, the energy companies and technical consultants mentioned two additional social and economic pre-requisites: the access to targeted educational programs for training MUP managers and the need of financially attractive arrangements to execute the plans.
Figure 5. Most popular goals (top) and requirements (bottom) selected by the stakeholders for participating to the MUP development.
Sustainability 07 06804 g005
The stakeholders also pointed out the following potential constraints that require specific attention and further discussion during the design phase.
  • Conflict of uses. The exact location of the MUP should be determined as the best compromise considering the potential conflicts with maritime routes, and particularly with the new port to be built offshore Venice. Moreover, the exploitation of new technologies for fishery activities is seen as potentially detrimental to the current fishery sector.
  • Governmental regulations. Specific regulations for the exploitation of marine renewable energy are not yet available and therefore the permits for the use of offshore areas take a very long time to be issued.
  • Environmental impact. A detailed assessment of the impacts on the ecosystems and on ecosystem services induced by the operation of the MUP should be carried out. The construction type, materials and requirements, the type and frequency of maintenance, and the transportation to/from the MUP are still not defined and therefore do not allow making a realistic impact assessment.
  • Financial feasibility. The technological challenge is high and at present there are no funds and incentives to support such an ambitious project by industry. The uncertainty about the real costs for design, development and installation is very high as well as the real benefits and return time of the investment.

3. Potential of Single Purpose Installations

This Section investigates the different design concepts that can be considered for single-use offshore installation at the site, i.e., renewable energy from wind (Section 3.1) and waves (Section 3.2) and aquaculture, specifically fish farming (Section 3.3). These concepts are examined as single-purpose and multi-purpose solutions (see Section 5), and are designed for energy production and transfer or as stand-alone solutions, with energy partially used to sustain the platform itself (Section 3.4).
In all the following subsections, the single-use platforms are designed based on the same starting assumption of occupied marine space, i.e., a maximum size for the offshore installation that does not exceed 1 km2.

3.1. Wind Energy Exploitation

Two options have been considered, large wind, referring to a multi megawatt, utility scale offshore wind farm built with the precise aim of being connected to the mainland, in order to sell electricity; and mini wind, with the main aim of supplying local offshore loads.

3.1.1. Large Wind Turbines

The reference turbine for calculations is the Vestas V112, which is characterized by a 112 m rotor diameter and by a rated power of 3.3 MW. By assuming the hub height equal to 100 m, the estimated productivity at the site is less than 1000 equivalent hours; leading to a capacity factor around 11% and a production of 0.96 GWh/year per installed MW. Those numbers are, from an investor point of view, not attractive, even for on-shore installations, where the impact of foundation, grid connection, installation and operational and maintenance (O&M) costs are significantly lower.
In case of a wind farm, a further productivity decrease for each machine in the range of 10% to 20% has to be expected due to wake effects. The larger the distance among turbines, the lower the wake effects on productivity, the lower the wake induced fatigue loads, and the higher the energy losses across cables. However, it also has to be taken into account that the turbine water depth might change by increasing the distance among the machines, and therefore the installation and foundation costs, as well as the visual impact of the farm. Moreover, the extension of the wind farm area may increase the potential conflicts with other uses and does not support the optimization of marine spatial planning.
In this site, a spacing of seven rotor diameters [41], leading to a distance of around 800 m among each wind generator, is assumed to be the basic case, see the layout in Figure 6. By neglecting the wake effects and cable losses:
  • a single 800 × 800 m cell, made up of four turbines (black circles in Figure 6), covering 0.64 km2, would produce 12.7 GWh/year;
  • an extended matrix of nine machines (see additional five machines in dark grey in Figure 6) would cover 2.54 km2 and produce 28.5 GWh/y; and
  • an array of 16 machines (see additional seven machines in light grey in Figure 6) would cover 5.76 km2 and produce 50.7 GWh/y, and so on, neglecting wake effects.
Figure 6. Proposed reference layout for the large wind farm. Circles represent wind turbines: black = single 800 × 800 m cell; dark grey = extended matrix 2.54 km2; light grey = total array 5.76 km2.
Sustainability 07 06804 g006
From the analysis of met-ocean conditions in Section 2.2, it is clearly demonstrated that the most promising winds for energy production come from the Bora and the Scirocco sectors, approximately perpendicular to each other, the first one being much more energetic. A detailed assessment of wakes is needed to provide the reference orientation of the wind farm with respect to prevailing wind directions, also depending on how many wind generators would be installed at the site. With the aim of minimizing wakes, a slightly skewed layout should be considered.

3.1.2. Mini-Wind

A site that is not attractive for utility scale wind is even less attractive for mini-wind technology, due to higher specific costs per unit power installed, increased wind turbulence and lower wind resource available when decreasing hub height.
The Bergey EXCEL 10 wind turbine is selected due to the certified power curve and to its horizontal axis, generally providing a higher annual energy production in comparison with vertical axis turbines of the same rated power.
Using the logarithmic Prandtl model to estimate the wind speed at a hub height of about 25 m, the calculated mean wind speed is around 4.06 m/s. The calculations lead to less than 800 equivalent hours, around 9% capacity factor, a very low value even if compared with traditional on-shore installations.
Mini-wind turbines are mostly installed as single turbines. Occasionally, a single row of turbines might be found, perpendicularly, to the prevailing wind direction. Due to reduced resources at low hub heights, wakes would dramatically affect the investment.
For the Acqua Alta hypothetical platform, a single line of mini-wind turbines is recommended, placed perpendicularly to the Bora direction. In this case, the distance between turbines could be reduced to four diameters. The Excel10 has a diameter of 7 m, so that a distance of around 30 m is envisaged. A slight offset angle with respect to a perfect facing of Bora winds (Figure 7) might avoid production losses by Scirocco winds to be repeated a number of times depending on the wave energy installation adopted, as the mini-wind needs to be supported by another marine infrastructure.
Figure 7. Layout and orientation of mini-wind turbines.
Sustainability 07 06804 g007

3.1.3. Synthesis for Wind Energy Harvesting

The results of the analyses are resumed in Table 3. Per each installed MW, large wind would produce 0.96 GWh/y, while mini-wind would produce 0.74 GWh/year.
The main conclusion is that there is no margin for wind energy alone to be deployed at the site for energy production and sale. No detailed modeling is necessary to conclude that the lack of resource would strongly affect the business plan of any wind installation, since the simplified calculations carried out so far are quite optimistic as wake effects, cable losses and machine unavailability would only lower the capacity factor.
Table 3. Synthesis of estimated yearly power production for large and mini-wind installations.
Large WindMini-Wind
Hub height [m]10025
Mean wind speed [m/s]4.544.06
Capacity Factor11%9%
Equivalent Hours [h/y]960745
Reference turbineVestas V112 3.3 MWBergey EXCEL10

3.2. Wave Energy Harvesting

This subsection analyzes first a floating and then a fixed installation. In both cases, the mild wave climate requires the design of a large array of Wave Energy Converters (WECs) to support a sufficient level of energy production.

3.2.1. Floating Devices: DEXA

The DEXA device is a Wave Activated Body (WAB) type. It consists of two rigid pontoons with a hinge in between, which allows each pontoon to pivot in relation to the other (Figure 8). The draft is such that, at rest, the free water surface passes in correspondence of the axis of the four buoyant cylinders [42]. The Power Take-Off (PTO) system consists of a low-pressure power transmission technology and is placed close to the center of the system, in order to maximize the stabilization force.
Figure 8. DEXA concept (left) and rendering of DEXA wave energy farm [42] (right).
Sustainability 07 06804 g008
This device has been selected mainly for the following reasons.
  • Preliminary tests showed that it is very effective [43,44] for a device length to wave length ratio close to 1.00; this aspect allows to also produce energy when the sea conditions are not extreme, such as in the Mediterranean site.
  • It is a floating WEC and so it adapts to sea level changes.
  • It has a low visual impact since it is floating without highly emerged parts.
However, the DEXA device has some limitations, among them:
  • the low efficiency (not higher than 30%);
  • the wide mutual distance required between devices due to the mooring systems and the device motions; and
  • the non-modularity, which leads to higher construction costs, more difficult maintenance and replacement operations.
The power production at the site is estimated on the basis of small-scale physical tests [45] that allowed the following efficiency (η) trend to be derived:
η = −0.615(l/Lp)2 + 1.3163(l/Lp) − 0.3566
where l is the long-shore device length and Lp is the peak wave length.
The efficiency is maximum for l/Lp around 1.0, therefore the design of the device is carried out by assuming l/Lp = 1, where Lp is derived from a weighted average based on wave frequency of the values of Lp associated to the wave conditions summarized in Table 1, Section 2.2.
By calculating the average value of Lp = 30.4 m, the device length l is assumed to be equal to 30 m, and therefore the device width b is imposed equal to 15 m, in order to keep the aspect ratio similar to the proposed Danish prototype and at the same time optimize stability with the squared shaped pontoons. For each sea state, the power produced by the device is calculated as
P = ΣiPWi b ηi fi
where PWi is the available wave power following Equation (1); b is the device width, and f is the yearly probability of wave occurrence. By assuming that there is no efficiency loss due to device re-orientation under oblique waves, each device produces about 77 MWh/year.
If one considers a basic module of five staggered devices (as in Figure 9), a power production around 0.4 GWh/year can be achieved.
To make the wave farm more competitive, the following configuration is proposed.
  • CALM mooring system for each WEC to allow a prompt device re-orientation following the incoming wave direction.
  • Gaps width equal to 7l in long-shore and to 3l in cross-shore in order to avoid collisions between near devices during their re-orientation.
  • The wave farm will be composed of six lines of devices and, therefore, by a total number of 30 devices, leading to an average annual power production of 2.3 GWh/year.
  • The occupied marine space for the whole farm will be 1350 m (long-shore) × 720 m (cross-shore), i.e., 0.97 km2. The wave farm will therefore consist of six modules: three modules placed in the long-shore and two modules in the cross-shore direction.
It is worthy to remark that:
  • the evaluation of the power production has been derived based only on hydraulic efficiency;
  • the assumption of perfect re-orientation without any energy losses has been made; and
  • the proposed wave farm will use several mooring chains/lines that can lead to possible problems for the ships performing maintenance operations.
Figure 9. Layout of the proposed wave farm of DEXA wave energy converters (six lines in cross-shore direction, six device in long-shore direction). A single module with five staggered devices is represented by the black dotted line; the wave farm consists of six modules.
Sustainability 07 06804 g009

3.2.2. Fixed System: Wave Star

The Wave Star machine draws energy from wave power with floats that rise and fall with the up and down motion of waves [46]. The floats are attached by arms to a platform, which includes all the electrical and mechanical parts. The platform stands on legs secured to the sea floor and it is sufficiently high above the water surface, so even the highest waves cannot reach the structure (see Figure 10).
Figure 10. (left) the principle of operation of the Wave Star; (right) a Wave Star prototype (with only two floaters) installed at Hanstholm (DK).
Sustainability 07 06804 g010
The motion of the floats is transferred via hydraulics to the rotation of a generator, producing electricity. The Wave Star is designed with multiple arms (each one with a length at least equal to the main wave length) in order to optimize the power production regardless of the incoming wave direction.
This device has been selected mainly for the following reasons:
  • it is at an advanced state of progress, since it is already grid connected;
  • it is a point absorber, therefore it is particularly suited to this site, where the energy is associated with two different main wave directions;
  • it is proven to also produce energy in a milder climate (Hs > 0.5 m); and
  • it can be combined with other uses, for example by integrating the supporting piles with offshore wind piles and the platform with micro-wind turbines.
The Wave Star device has some limitations, among them:
  • the fixed foundations may lead to higher environmental impacts, may produce liquefaction problems and are usually expensive;
  • the adaptability to sea level changes is related to the platform height with respect to the mean sea level, including storm surges; and
  • the emerged parts lead to a locally non-negligible visual impact.
The WaveStar is supposed to be placed on 20–25 m depth and composed of arms, up to 80 m long with 10 floaters on both sides of each arm. Each floater has a diameter of 10 m.
The power prediction is based on the results of numerical simulations available in the literature [47]. From these tests, the efficiency (η) trend was derived first as function of HS
η1 = 0.2612•(HS) − 0.1306  0 < HS < 1 m
η1 = 0.0191•(HS) + 0.1139  1 < HS < 5 m
then, also, the effect of the wave period Tp was included by keeping constant the wave height
η2 = −0.0278•(Tp) + 0.4529  HS = 2.5 m, 4 < Tp < 12s
The overall efficiency ηTOT trend used in the calculations reported below is
ηTOT = η1•η2
For each sea state (Table 1 in Section 2.2), the power produced by the device is calculated as
P = ΣiPWi D ηTOTi fi
where PWi is the available wave power following Equation (1); D is the floater diameter; and f is the yearly probability of wave occurrence. Each floater produces around 10 MWh/year.
Based on the experimental report, the Wave Star power production performance is affected by:
  • the gap width between near floaters; specifically, the greater the gap width, the lower the reduction of power production between one floater and the subsequent one;
  • the number of the subsequent floaters for each side of the arm—the maximum number of investigated floaters was five; and
  • the angle between the arm and the direction of incoming waves—specifically, the larger this angle, the greater the power production.
Therefore the layout for the WaveStar module includes:
  • five floaters for each side of the arm, i.e., 10 floaters for each arm;
  • the gap width between the floater equal to 5 m, i.e., to half the floater diameter; and
  • three arms with the central arm oriented at 100°N and an angle of 120° between them—based on the two conditions above, each arm is about 80 m long and 8 to 15 m wide (to allow the placement of the 5 m diameter piles and the access to the instrumentation).
The average yearly power production is then estimated under the following assumptions:
  • power reduction due to arm inclination with respect to the incoming waves: 50% for the central arm, since the angle between the directions is characterized by higher energy density (70° and 130°), and the arm (100°) is only about 30°, with a similar reduction of 10% for the other two arms; and
  • same efficiency for the all floaters along an arm.
For the basic module of three arms (Figure 11), a power production of around 0.6 GWh/year is obtained.
To make the wave farm more competitive, the following configuration is proposed.
  • The gap width between two module equals the arm length (80 m), both in long-shore and in cross-shore direction to allow maintenance operation and possibly implementation of combined fish-farming options.
  • The wave farm is composed of 15 modules (five modules long-shore and three modules in cross-shore), for a total power production of 9 GWh/year.
  • The occupied marine space will be 1200 m (long-shore) × 720 m (cross-shore), i.e., 0.86 km2.
Figure 11. Layout of the proposed wave farm of WaveStar wave energy converters, composed of 15 modules. Each module (in the dotted box) consists of three arms with five floaters for each side.
Sustainability 07 06804 g011
It is worthy to remark that:
  • the evaluation of the power production has been derived based on hydraulic efficiency only;
  • the assumption of negligible losses of incident wave energy along the arm has been made; and
  • the proposed wave farm will need many foundation piles.

3.3. Aquaculture Development

The Mediterranean Sea accommodates the largest part of aquaculture production of Mediterranean sea bass (Dicentrarchus labrax) and gilthead sea bream (Sparus auratus) for over 30 years now. The conditions in the Mediterranean are favorable for both species and there is long experience in growing them at the commercial level. Additionally, there is ever increasing demand on the global market for these fish. Yet, fish health issues arising in coastal areas and lagoons, along with the existing strong conflict for space by many users in coastal areas, have stirred interest in moving aquaculture further offshore. The longer travelling time to offshore sites makes the combination with other activities, such as energy converters more cost-effective.
To assess the Acqua Alta site for its sea bass and sea bream farming potential, three different scenarios based on different environmental conditions (temperature, salinity and biochemical parameters) were analyzed for each species. The scenarios considered the production of average marketable size (~350 gr) fish starting for both species with stocking of juveniles of average weight of 2 g, in March, June or September.
The results for the Acqua Alta site are reported in Table 4 and compared with the equivalent on-growing periods for sea bass and sea bream farming in a benchmark case in the Southeastern Mediterranean in Table 5. Due to environmental conditions, fish farming at the Acqua Alta site will require a significantly longer time than the Southeastern Mediterranean site, and will therefore be a less cost-effective investment.
Table 4. On-growing periods for sea bass and sea bream farming in the Acqua Alta site.
Northern Adriatic Temperatures
Juvenile Stocking MonthMean Start Weight (grams)Growing Period (months)Mean Final Weight (grams)Food Conversion RatioWater Temperature (°C)
MeanSTDEV
Sea BassMarch9183581.4018.63.5
June2253651.8618.33.4
Sept2243671.5618.33.5
Sea BreamMarch11193851.6318.83.5
June2253652.1118.33.4
Sept2243671.7618.33.5
Table 5. On-growing periods for sea bass and sea bream farming in a reference site in the Southeastern Mediterranean.
South-Eastern Mediterranean Temperatures
Juvenile Stocking MonthMean Start Weight (grams)Growing Period (months)Mean Final Weight (grams)Food Conversion RatioWater Temperature (°C)
MeanSTDEV
Sea BassMarch9133631.1221.83.9
June2143721.0622.63.9
Sept2143580.9622.43.7
Sea BreamMarch11113601.0722.53.8
June2143651.2222.63.9
Sept2143671.0822.43.7
Basic requirements that have to be considered for establishing and operating a sea bass/sea bream fish farm at any site are the following.
  • To secure good fish health, the bottom depth has to be around three times the depth of the nets of the sea cages. This allows for adequate renewal of the water around the cages and proper dispersal of the material that tends to accumulate underneath the cages. Therefore, in the case of a net depth of at least 9 m, the total depth of the site should equal 27 m.
  • Individual cages must be at least 8 m apart, to allow sufficient circulation of clean water between and within cages.
In our model installation, the fish farm is designed to support a hypothetical 2000 ton annual production capacity. The following specific design issues are suggested:
  • 56 sea cages of 32 m diameter;
  • rectangular spacing around each cage of about 40 m side length, allowing for operations that need to take place at each cage and for good circulation of water among cages;
  • three cage parks consisting of parallel rows of sea cages, for better handling and more efficient production;
  • automatic feeding systems, which are effective up to ~300–400 m distance and therefore determine the position of the furthest cage;
  • feed storage space able to accommodate 150 tons of feed at any time as this allows for a frequency of transportation of feed from land to the offshore platform once every four days;
  • space between neighboring parks, according to legislation, must be at least 100 m, this also allows unobstructed sailing of the harvesting vessel as well as other vessels;
  • mooring chains of about three times the water depth, i.e., 50 m long; and
  • the use of mooring devices to secure each cage.
The design layout comprehensive of all these indications is shown in Figure 12.
Figure 12. Layout proposed for the fish farm.
Sustainability 07 06804 g012

3.4. Offshore Energy Storage and/or Transmission Systems

Based on the design concepts outlined in Section 3.1, Section 3.2 and Section 3.3, this subsection explores the possibility of connecting the offshore installation to the shore, or building it as a stand-alone solution in case the selected design scheme is targeted, or at least include marine renewable energy extraction.
In the presence of a limited energy resource, the offshore wind connection represents the major cost, so that it might be impossible to recover the capital costs in a reasonable amount of time. In this frame, considering also the vicinity to “Tegnùe”, a stand-alone configuration, i.e., not connected via subsea cables to the mainland, can be particularly suited.
Potential advantages of the stand-alone configuration are the following.
  • The avoidance of substation and export cables, with consequent reduction in the environmental impact on the sea bottom, and of the overall cost, which may also benefit from margins of reduction from array cables, depending on the extension of the MUP.
  • Boost of blue-growth, by using renewable energy instead of diesel fuel and therefore fostering a greener process; in this case, of course, the renewable production actually results into avoided expenses rather than into active incomes (no energy is sold to the grid), assuming that the renewable energy substitutes conventional diesel engines potentially located on the offshore MUP. A reference cost for the energy produced by diesel engines on Italian islands not interconnected with mainland ranges between 180 and 300 €/MWh.
On the other hand, an appropriate energy storage system to manage the power balance of the MUP is needed, since wind, wave and tidal energy devices produce a variable and not fully predictable amount of electric energy and introduce it into the local energy system. In order for the system to be stable, the power consumption of all the local loads deriving from aquaculture operations, lighting and any other offshore use must be equal to the energy generation. The energy flux across the energy storage will be bi-directional, i.e., the stored energy will be accumulated or released depending on the actual conditions at the site.
In order to keep the electrical system stable, a power quality management system is required to provide all the services necessary to sustain voltage and frequency, such as primary, secondary and tertiary reserve and voltage regulation. The identification of the most suitable storage technology has to take into account the capability of the storage system itself to provide all of these services, for the needed amount of time. A detailed assessment is therefore needed in terms of:
  • aquaculture power consumption at the site and typical uses across the day, considering the fish feeding system, the platform crane, the ice producing machines to kill fish and deliver them to the shore, the electric boats and floating vehicles, the lighting and ancillary services as communication, data acquisition, and heat pumps, among others; and
  • time-series-based renewable energy power production, whose analysis will provide information on the most suitable technology in terms of Power and Energy capacity and suitability to cover a specific amount of power cycles.
It has to be noted that the storage system and other MUPs electrical components should be located on the same platform hosting aquaculture fish food and feeding system.
In case the MUP is connected to the grid, the connection might be based on MV, HVAC or HVDC, according to the installed capacity and distance to shore. While the exact size of the MUP still has to be identified, it can already be derived from the estimated power capacity (<100 MW) and the distance from shore (<100 km) that this MUP will fall into the MVAC category. An offshore substation will collect array cables from different devices and subsequently export power, including switchgears, control apparatus, compensation of reactive power, etc.
A HV substation on the mainland will be required to obtain enough capacity for energy transport. Based on the minimum water depth (>27 m) needed for aquaculture, the distance to the closest HV substation will be of the order of 35 km (Chioggia). If the installation includes wind and/or wave energy devices only, it may still be realized in proximity to the existing Acqua Alta Tower and therefore 22 km of MV connection will be needed.

4. Preliminary Considerations on Environmental Impact

Based on the design concepts outlined in Section 3, a preliminary environmental impact assessment is performed here, highlighting the key issues that should be considered when dealing with installation for wind and wave energy extraction (Section 4.1), and for fish farming (Section 4.2).

4.1. Wind and Wave Farms

The construction of marine infrastructures, including MUPs, typically involves the replacement of natural, most often sedimentary, substrata with harder surfaces of stone, concrete, asphalt, metal wood or other artificial material [48]. These habitat modifications damage the seabed, associated recipient habitats and assemblages. They also alter the distribution of a number of hard-bottom species, which thrive on anthropogenic surfaces, and change marine seascapes and species connectivity at regional scales [48]. The impacts from the sprawl of artificial structures into the sea have recently been reviewed by [49], who identified four main categories of impacts: (1) direct physical disturbance; (2) addition of artificial habitat; (3) indirect physical disturbance; and (4) noise and light pollution.
Physical disturbances arise from the addition or removal of artificial materials during construction and decommissioning, respectively [49]. For example, it has been estimated that about 12.5 m2 of seabed can be lost in the footprint of a 4 m diameter offshore turbine with 10 m scour protection. In the UK, a total projected loss up to 8600 km2 of seabed by 2020 as a consequence of offshore development has been calculated [50]. Dredging during construction can displace 1539–2356 m3 sediment per turbine into the water column [51], and removal of underwater scaffolding increases turbidity, which can negatively affect marine plants and animals [52]. During their operation, artificial structures can alter water flow, sediment deposition and topography, with subsequent larger-scale effects to infaunal assemblages and productivity [53]. The extent of the disturbed area will depend on the sediment type, device type, water depth, anchoring depth of device foundations into the seabed, and surrounding flow regimes [53].
The constructions built in replacement of the natural habitats lost have been increasingly viewed as an opportunity for habitat enhancement, providing local benefits associated to hard substrata where none previously existed, or potential refugia for rare or threatened native rocky species [54,50]. At the same time, the ecological value of artificial structures as habitats for native species is very much debated [49,55]. In the Northern Adriatic Sea, more than 190 km of human-made structures (comprising piers, breakwaters, groyns and over 100 offshore gas platforms) have largely modified marine seascapes at regional scales [6], introducing over 2 km2 of artificial hard surfaces that have disproportionally facilitated the colonization of Non-Indigenous Species (hereafter NIS), and rocky reef species otherwise rare or absent in such sedimentary environments [55]. The long-term and regional consequences of these extensive habitats modifications, and the possibility of mitigating these impacts by incorporating ecological principles in the design of marine infrastructures are the subject of increasing debate [56,57,49].
The epibenthic communities that grow on artificial structures are largely shaped by the distinctive structural and environmental conditions intrinsic to artificial structures and renewable energy extraction [53]. Marine infrastructures offer atypical substrates for benthic assemblages in terms of orientation, exposure, size, shape, slope, surface composition and texture [48,56,58], all of which are known to affect the recruitment, survival and growth of a variety of species. Artificial structures are characterized by unnaturally high levels of disturbance from both natural (e.g., storms, sediment scour) and anthropogenic (e.g., harvesting, trampling, maintenance works) sources. These disturbances damage the native assemblages, and offer prolonged availability of unoccupied space or other resources that favor the establishment of species with opportunistic and invasive traits [59]. Experiments have also revealed considerable differences in community composition between floating and fixed structures, related to such features as the presence or absence of intertidal and “swash” zones and varying levels of exposure to light [49]. As such, we expect floating wave energy devices to harbor considerably different communities, compared with fixed energy structures, although there has been little research to date focused on such structural differences.
As a consequence, one of the greatest risks at the Aqcua Alta site is the facilitated expansion of NIS in relation to MUPs expansion. The risk is amplified in the study area because the Lagoon of Venice, with its crowded recreational and commercial harbors, as well as flourishing mariculture activity, is the Italian locality with the highest number of marine aliens [60].
Recent work done within the MERMAID project has demonstrated that the proliferation of marine infrastructures has disproportionally favored NIS over native species along 500 km of the Northern Adriatic coastline, affecting their spread at regional scales [55]. At the same time, the likelihood of recruitment of NIS on artificial hard structures could be limited by using materials or coatings that prevent settlement of fouling [61], by favoring the design of fixed surfaces rather than floating ones [49], by using design options that favor colonization by native species and by minimizing disturbances [57]. For example, ecologically informed repair schedules of artificial structures in the study region have been shown to limit the spread of non-indigenous species by favoring a quicker recovery of the native ones [59]. Recent attempts at a variety of artificial structures along the Northern Adriatic coastline have also been done to actively garden ecologically relevant habitat forming species, to contemporaneously enhance native species, and deter non-indigenous ones [62].
Other impacts can arise at all engineering stages as a consequence of artificial light on platforms and vessels [63], noise and vibration during foundation construction, pile driving, cable laying, seismic surveys, wind farm operation and boating [52], contamination from oil and lubricant spills, from the antifouling paintings used for the floating parts of the energy devices and around vessel berths [49], and from collision and entrapment of marine mammals and birds. Night lighting and operational lights on offshore structures can disorient birds and lead to elevated mortality among migratory species [64]. These effects could be relatively limited at the Acqua Alta site, as the migrating birds in this region use the coastal zone more intensively than offshore areas. Far more concerning are the effects from the noise and vibrations, which can reach levels that dramatically affect fish and invertebrate eggs, larvae and embryos, ultimately causing their mortality [65,66], and are associated with auditory injuries and disorientation in marine mammals with effects up to 50 km away [67].
Other cumulative or unforeseen non-linear responses could also arise from interactions among energy installations, aquaculture, and other environmental and anthropogenic impacts in the system, as well as from the developments at increasing densities of installations [68], either amplifying or mitigating some effects of offshore platforms. For example, trawling is known to modify deep benthic systems, causing reduced species abundances and changes in species composition, with an increase in deposit feeders and a decrease in suspension feeders with increasing fishing pressure [69].
In the Northern Adriatic Sea commercial trawling is so intensive [70] that the system is considered to have entered a “fished state”, sensu [71], where additional disturbances may no longer lead to clear responses in assemblage structure. Offshore structures provide some degree of refuge from trawling activities [72], because safety regulations prevent navigating closer than a distance of between 200 m and 1000 m from offshore platforms (Art. 28 del D.P.R. 886/79), which could potentially compensate other negative effects of structures on the benthos.

4.2. Fish Farming

Experimental work in the Mediterranean Sea has shown that the impacts of fish farming of sea bass and sea bream can vary greatly depending on the hydrography of the site, stocking density, or the feed type, and that these effects can be significantly reduced by careful site selection, control of stock density, improved feed formulation and integrated culture with macroalgae, filter-feeders and deposit-feeders [73]. For integrated culture to be successful, there must be synchronization between the growing cycles of the cultured species [74], therefore site environmental and hydrological conditions at the site, coupled with species life history cycles, play a crucial role.
Some of the most important documented effects of aquaculture comprise increase in organic matter contents and compositional changes of the sediment below fish cages, alteration of inorganic and organic chemistry of farm water and sediments, alteration of abundance, biomass and biodiversity of micro, meio and macro benthic communities and modification of distributional patterns of phytoplankton and micro-zooplankton abundance and production [75,76,77,78]. Although large-scale modification of the trophic status (i.e., nutrient concentrations and phytoplankton biomass) of marine areas has been described as a consequence of fish farming [75], most of the described impacts are confined to within 25 m up to 1 km distance [79,80]. A site might be classified as undisturbed based on physico-chemical parameters, but estimates of biological or ecological effects, for example the Marine Biotic Index, tend to increase the size of the impacted areas [81].
Chemical inputs and residues originate mainly from fish feed (Zn, Cd) and anti-fouling chemicals (Cu) [82]; their effects can vary from causing changes in swimming, burrowing and general behavior as well as causing death, depending on concentration and target species [83]. Local accumulation of antibacterial medications in the deeper sediments under cages can also have long-term adverse effects on ecosystem functions, by affecting the microbes/bacteria, which are responsible for the decomposition of organic matter and mineralization of nutrients [84].
Wild fish populations also occur around cages, increasing the fish abundance and diversity and altering the community composition of a site [85,86,87]. Wild fish species consume processed fish [88], pellets, parasites of cultured fish and bio-fouling species [89,90]. A waste feed diet can affect metabolic pathways and gene coding expression, as well as depress the predatory behavior of wild fish near cages [91]. On an ecosystem level, a change in diet of relevant fish fauna can lead to alterations in the system trophic state, affecting community structure and species abundance via top-down cascading effects [86].
There is currently a strong interest in developing mitigation strategies and best practice codes for sustainable aquaculture. Long-term studies at fish farming sites where all operations were conducted following the legislative specifications and the code of conduct for responsible development of aquaculture have generally shown limited environmental changes around or under the sea cages [79,92]. However, even when the overall impact on benthic macro-invertebrate assemblages is small, a general shift towards a prevailing abundance of tolerant species is observed under cages [92,93,94], as well as changes in community structure as a result of toxicity and bioaccumulation of chemicals [82]. The introduction of pathogens, alien species, and new genetic strains produced by escaped fish mating with wild fish also raise growing environmental and ecological concerns [95].

5. Multi-Purpose Solutions: Selection of the Most Promising Concept

This Section applies an objective procedure for the evaluation of different design concepts at the study site and presents the preliminary design of the most promising MUP. The procedure—whose details can be found in [22]—consists of: a pre-screening phase, to assess the feasibility of the single purpose installations, and a ranking phase, where the MUPs performance is scored based on selected criteria and sub-criteria that account for technological and non-technological issues relevant to installation, operation and maintenance. The methodological process is synthesized and the conceptual design alternatives are selected based on the pre-screening phase and on the data presented in Section 3 (Section 5.1). The application of the ranking procedure to the alternative design concepts is then described and the most promising concept is selected (Section 5.2). Some design considerations to maximize the synergy of the selected MUP are finally drawn (Section 5.3).

5.1. Brief Description of the Procedure and Selection of the Alternative Design Concepts

In the first step, the potential uses of the platforms are investigated, considering key technical feasibility criteria, and related threshold values where applicable, see the summary in Table 6.
In the case of offshore wind and tidal energy, where the technology is more mature and assessments from previous research projects [96] are available, the “go/no-go” option is determined on the basis of the average yearly value of wind and tidal velocity. For wave energy, a threshold value is not available, however single purpose installations have been carried out so far in sufficiently energetic seas only, i.e., where the mean annual potential is not lower than 10 kW/m.
For aquaculture the “go/no-go” decision is complex, since it is first necessary to collect time series of key environmental parameters such as temperature, salinity and nutrients in the water column, both on a mean (at least monthly) basis and accounting for seasonal variability (over at least one year of data). Based on these data, the first step is to identify if there is the potential for any commercial species. If this is the case, then estimates of the installation viability can be made after assessing the time required for stocks to grow to a commercially valuable size and the basic farm module for a sufficient production level.
Table 6. Criteria and sub-criteria for the identification of the uses, and for the selection of the optimal portfolio of uses, in the case of a Multi-Purpose Offshore Installation. To be continued.
Step 1- Feasibility Assessment
CriteriaType of judgment
Renewable energy potentialYes/no
WindWind: >6 m/s on average for offshore plants, after ORECCA, 2011
WaveWave: no specific threshold available
TideTide: 2.5 m/s mean spring peak based on DECC, 2010
Aquaculture potentialYes/no—if yes specification of
  • what (sea-weeds, fish farm, etc.)
  • minimum installation requirements (depth, space, etc.)
Step 2—Ranking
CriteriaType of judgment
Exploitation potentialScore 1 (highest)…5 (lowest)
Renewable energy potential (to be repeated for wind, wave and tide):
  • Maturity of technology
  • Reliability
  • Performance
Aquaculture potential:
  • Existing practice in the area
  • Technological challenges
  • Performance
InnovationScore 1 (highest)…5 (lowest)
Technological Innovation:
Synergy with other uses:
Environmental impactScore 1 (lowest)…5 (highest)
Use of marine space
  • Wind piles/devices dimension
  • Size of energy farm
  • Size of aquaculture farm
Foundation type
Materials
Impact on the coast
Inclusion of exposed components/parts
Noise /Vibration
Aesthetic impact
Local energy storage/use
Maintenance
  • Transportation
  • Fouling
  • Material durability
RisksScore 1 (lowest) 5 (highest)
Structural failure
  • Modular or single/ rigid structure
  • Geotechnical failure
  • Moorings
Power failure
  • Power take off/feeding
  • Local energy storage/use
Pollution
CostsScore 1 (lowest)…5 (highest)
Installation depth
Installation type
  • Complexity
  • Moorings
Power extraction and storage
  • Power take off type
  • Local energy storage/use
Installation/maintenance requirements
  • Accessibility
  • Materials
Transportation
  • Installation
  • Operation
In the Acqua Alta site, none of the conditions required for the feasibility of the single purpose installations is achieved:
  • the average value of the wind speed Vw is 4.5 m/s < 6 m/s;
  • the yearly available wave energy power is about 1 kW/m << 10 kW/m; and
  • there are successful current practices for fish farming, and the demand for the sea bass- and sea bream-selected farming species is high, however the sea bass and sea bream growing period is not competitive with benchmark sites (see Table 4 and Table 5).
A single-purpose offshore installation at the Acqua Alta site will not be further investigated, because only the combination of different uses in the area, i.e., a MUP solution, makes an offshore installation feasible. Different combinations of MUP are assessed:
  • fixed or floating wave energy devices, either combined with wind production or not, since the local stakeholders mainly have experience and interest in wave energy (see Section 3.2);
  • offshore large wind or micro-wind, the latter being possible only when integrated with the fixed wave energy devices (see Section 3.1); and
  • aquaculture, which will be combined with all the other different uses (see Section 3.3).
A detailed cost-benefit analysis is beyond the scopes of the present contribution; rather we explore different design concepts for MUPs, which are summarized in Table 7.

5.2. Ranking the Alternative Design Concepts

In the second step, the selected MUPs are evaluated against selected criteria that have to be comprehensive of the design, installation, operation and maintenance, i.e., of the performance and impact during the project life cycle. Multi-criteria frameworks are commonly used for the assessment of environmental impacts [97,98], for the selection of the optimal installation site [96,99], and to find the most suitable energy converter at a given area [22]. Experts with different backgrounds have to define the criteria to be addressed and a related score method to provide a robust tool for comparative analysis of alternatives.
Table 7. Synthesis of the multi-purpose concepts to be explored.
NameWaveWindFish FarmElectricity Connection
WaveStarDEXALargeMiniStandAloneConnected to Grid
MUP 1XXXXX
MUP 2XXXXX
MUP 3XXXX
MUP 4XXXX
MUP 5XXXX
MUP 6XXXX
MUP 7XXX
MUP 8XXX
MUP 9XXXX
MUP 10XXXX
MUP 11XXX
MUP 12XXX
Five key criteria (Innovation, Exploitation Potential, Environmental Impact, Risks, Costs) were selected, and for each criterion, specific sub-criteria were identified to facilitate expert judgment (Table 6).
The experts/users of the methodology provided scores for each sub-criterion, then the score of each criterion was determined as the un-weighted mean of the scores of the sub-criteria. The decision not to include weights was taken to exclude any somewhat subjective relevance assigned to technological, economic and environmental issues depending on the expertise of the different experts/stakeholders. Indeed the discussion about scores and weights is still open within the scientific community (for instance, within the Ocean Energy Europe Association), where their values are periodically updated with the upcoming technological advances in the field. Weights should be ideally assigned by stakeholders to better reflect the social, economic and environmental site characteristics [100].
Among the five criteria, two are “measurements” of benefits (i.e., the Exploitation potential and the Innovation) while the other three are “measurements” of impacts. The scores range from 1 to 5, where 1 = best solution, lowest impact, best performance, etc.; and 5 = worst solution, highest impact, worst performance, etc. The resulting scores for each MUP concept are given in Table 8. The explanation of these scores is provided in the following paragraphs.
The ranking was performed by ordering the MUPs from the most successful (lowest score) to the least successful (highest score). A further development of this methodology can be the inclusion of weights for each criteria depending on the background of the users completing the evaluation procedure or on the relevance assigned by local stakeholders to the different criteria (see Section 2.5).

5.2.1. Innovation

Technological Innovation. In the case of wind energy and aquaculture, the installation is based mainly on existing technologies, even if the practices are not consolidated in the area. The installation of a large array of WECs is a significant step in technological innovation, at both the national and global levels. A score equal to 1 is assigned to the case where all the uses are combined (large- and mini-wind, waves, aquaculture) in a stand-alone solution. The technological innovation is estimated to be lower with decreasing number of uses, so that 1 point is added for each missing use, and when the platform is connected to the grid, therefore 1 point is added also to all grid-connected solutions.
Synergy with other uses. The score is decreasing with the addition of further uses, with the score equal to 1 assigned when waves, wind and aquaculture are combined together. The score increases by 1 point for each missing use and by 0.5 points when the platform is connected to the grid, since this solution leads to a lower level of interaction among the different uses.
Table 8. Ranking of the multi-purpose concepts based on expert judgment. To be continued.
CriteriaType of judgmentMUP 1MUP 2MUP 3MUP 4MUP 5MUP 6
InnovationScore:1.001.751.252.251.502.25
· Technological Innovation:1212.51.52.5
· Synergy with other uses:11.51.521.52
Exploitation potentialScore:2.112.112.562.561.891.89
· Renewable energy potential (wind):1.671.673.003.001.001.00
 · Maturity of technology222211
 · Reliability:222211
 · Performance:115511
· Renewable energy potential (wave):2.672.672.672.672.672.67
 · Maturity of technology333333
 · Reliability:222222
 · Performance:333333
· Aquaculture potential (fish farming):2.002.002.002.002.002.00
 · Existing practice in the area:222222
 · Technological challenges:111111
 · Performance:333333
Environmental impactScore:3.703.932.933.263.593.81
· Use of marine space:4.334.333.673.674.334.33
 · Wind piles/devices dimension443344
 · Size of energy farm:443344
 · Size of aquaculture farm:555555
· Foundation type553355
· Materials333333
· Impact on the coast:222222
· Inclusion of exposed components/parts:444433
· Noise /Vibration:443344
· Aesthetic impact:553355
· Local energy storage/use:352535
· Maintenance:3.003.002.672.673.003.00
 · Transportation:443344
 · Fouling:222222
 · Material durability:333333
RiskScore:2.833.172.723.062.783.11
· Structural failure:3.503.503.173.173.333.33
 · Modular or single/ rigid structure:3.53.53.53.533
 · Geotechnical failure (liquefaction):554455
 · Moorings:222222
· Power failure:2.003.002.003.002.003.00
 · Power take off/feeding:222222
 · Local energy storage/use:242424
· Pollution:333333
CostsScore:3.253.503.053.303.153.40
· Installation depth:333333
· Installation type:2.502.502.502.502.502.50
 · Complexity:333333
 · Moorings:222222
· Power extraction and storage:3.504.503.254.253.254.25
 · Power take off type:443.53.53.53.5
 · Local energy storage/use:353535
· Installation/Maintenance requirements:3.003.002.752.753.003.00
 · Accessibility:222222
 · Materials:443.53.544
· Transportation:4.254.503.754.004.004.25
 · Installation:4.553.5444.5
 · Operation:444444
Total (using equal weights)12.9014.4512.5014.4212.9114.46
CriteriaType of judgmentMUP 7MUP 8MUP 9MUP 10MUP 11MUP 12
InnovationScore:2.503.251.52.252.253
· Technological Innovation:341.52.52.53.5
· Synergy with other uses:22.51.5222.5
Exploitation potentialScore:3.223.222.222.223.563.56
· Renewable energy potential (wind):5.005.001.001.005.005.00
 · Maturity of technology551155
 · Reliability:551155
 · Performance:551155
· Renewable energy potential (wave):2.672.673.673.673.673.67
 · Maturity of technology334444
 · Reliability:223333
 · Performance:334444
· Aquaculture potential (fish farming):2.002.002.002.002.002.00
 · Existing practice in the area:222222
 · Technological challenges:111111
 · Performance:333333
Environmental impactScore:2.703.043.563.782.652.98
· Use of marine space:3.673.674.334.333.503.50
 · Wind piles/devices dimension33442.52.5
 · Size of energy farm:334433
 · Size of aquaculture farm:555555
· Foundation type334422
· Materials334444
· Impact on the coast:222222
· Inclusion of exposed components/parts:333333
· Noise /Vibration:224422
· Aesthetic impact:334422
· Local energy storage/use:253525
· Maintenance:2.672.673.673.673.333.33
 · Transportation:334433
 · Fouling:223333
 · Material durability:334444
RiskScore:2.673.003.944.283.834.17
· Structural failure:3.003.004.334.334.004.00
 · Modular or single/ rigid structure:334444
 · Geotechnical failure (liquefaction):444433
 · Moorings:225555
· Power failure:2.003.003.504.503.504.50
 · Power take off/feeding:225555
 · Local energy storage/use:242424
· Pollution:334444
CostsScore:2.903.153.754.003.503.75
· Installation depth:333333
· Installation type:2.502.504.504.504.504.50
 · Complexity:334444
 · Moorings:225555
· Power extraction and storage:3.004.003.754.753.504.50
 · Power take off type:334.54.544
 · Local energy storage/use:353535
· Installation/Maintenance requirements:2.502.503.503.503.003.00
 · Accessibility:223333
 · Materials:334433
· Transportation:3.503.754.004.253.503.75
 · Installation:33.544.533.5
 · Operation:444444
Total (using equal weights)13.9915.6614.9716.5315.7917.45
Technological Innovation. In the case of wind energy and aquaculture, the installation is based mainly on existing technologies, even if the practices are not consolidated in the area. The installation of a large array of WECs is a significant step in technological innovation, at both the national and global levels. A score equal to 1 is assigned to the case where all the uses are combined (large- and mini-wind, waves, aquaculture) in a stand-alone solution. The technological innovation is estimated to be lower with decreasing number of uses, so that 1 point is added for each missing use, and when the platform is connected to the grid, therefore 1 point is added also to all grid-connected solutions.
Synergy with other uses. The score is decreasing with the addition of further uses, with the score equal to 1 assigned when waves, wind and aquaculture are combined together. The score increases by 1 point for each missing use and by 0.5 points when the platform is connected to the grid, since this solution leads to a lower level of interaction among the different uses.

5.2.2. Exploitation Potential

In the assessment of wind potential, both the maturity of technology and the reliability are scored 1 when the widely applied VESTAS V-112 turbines are selected, while a score equal to 2 is assigned to the mini-wind, due to the narrower application and higher failure potential. In the case where both large- and mini-wind are included, the latter dominates the overall scores. Regarding performance, a score equal to 1 is assigned when large wind is present, due to its high energy production (one order of magnitude higher) when compared with the other renewable energy sources at the site, while for micro-wind alone, the score equals to 5, due to the mild climate conditions at the site and low conversion efficiency.
For wave potential, the maturity of technology is still modest, especially when regarding the proper moorings and PTO design. Additionally, the number of physical and numerical modeling studies, the testing of the devices at prototype scale, the number of working hours connected to the grid and the reported failures, play a significant role in the evaluation of their reliability and performance. Therefore, the scores assigned to the WaveStar (maturity = 3, reliability = 2, performance = 3) are always (1 point) lower than the ones attributed to the more immature DEXA device. Just like for wind installations, the performance score is strongly affected by the mild climate at the site.
Aquaculture farms of similar type are already present in Italy and the characteristics of the site do not require the introduction of any specific and novel feature, the technological challenges are considered to be associated to the lowest score of 1. However, since the only existing pilot plant was completed without seeking any further developments, a score equal to 2 is assigned to the existing practice. Based on the site characteristics and production from similar single use installation, the production of sea bass and sea bream is non-optimal compared to other Mediterranean sites with higher temperature and currents, leading to a performance score equal to 3.
When considering the Exploitation Potential, the connection to the grid does not play any role, since the scores relate only to the rough preliminary evaluation of the expected production of the MUP. Moreover, the score equal to 5 is automatically assigned to the use that is not included in the MUP under evaluation.

5.2.3. Environmental Impact

The score assigned to wind piles/devices dimension slightly increases from floating (score = 2.5) to fixed (score = 3) wave energy arrays due to the combination of the larger surface area occupied by floating DEXA and the presence of a number of piles supporting the WaveStar floaters. When mini-wind is added to the WaveStar, installation does not require further foot space and therefore the score does not increase. When large wind turbines are combined with WECs, the score increases to 4, since the turbine foundations and the anchors cannot be combined in case of DEXA, and only a few can be integrated in the WaveStar foundations, due to the need of a sufficient distance among the turbines. The Size of the farm is estimated to have a fairly high impact, especially due to the large number of WECs and the distance among turbines; therefore, two fixed scores of 3 and 4 are selected in absence and in presence of large wind, respectively. Due to the particularly valuable environment and the expected productivity/minimum size required for viability of the plant, the size of aquaculture farm plays a relevant role, and therefore, again, the score is equal to 5 for all the MUPs including this use.
Foundation type is evaluated to be 2 and 3 for moorings (DEXA) and for fixed foundations (WaveStar), respectively. The score increases by 1 point when wind piles are present. The contribution due to aquaculture lines and cables was considered to similarly affect all the MUPs.
The score assigned to materials equals 4 for the majority of the MUPs, mainly due to the use of steel components and related corrosion and fouling problems. A lower score equal to 3 is applied to the WaveStar due to the greater use of other materials (concrete for piles, fiber glass for floaters) and the lack of impact from chains for moorings.
The impact on the coast is assumed to be modest (score = 2) in all cases, due to the water depth at installation, the mild climate, and the depth limited wave conditions.
The score for the inclusion of exposed components/parts is never below than 3, since it is assumed to be driven by the potential debris generated by the WECs (pontoons of DEXA, floaters of WaveStar). This score measures the likelihood of materials breaking during heavy storms and the effect of such debris on the environment. It is expected that mini-wind can also generate debris, and therefore a (1 point) greater score is assigned when this additional use is present.
Noise/vibration is essentially associated with the presence of wind turbines; therefore the scores equal to 2, 3 and 4 are, respectively, assigned to WECs only, to WECs and mini-wind, and to WECs, mini and large wind.
The aesthetic impact is lower for DEXA (score = 2) than for WaveStar (score = 3) and is strongly affected by the presence of large wind, which is leading to a (2 points) greater score.
The Local energy storage/use is considered to produce a lower impact than the connected-to-grid solution, since it allows the avoidance of power cables from the site to the shore and minimize the need of power hubs. However, it requires an electrical infrastructure including a generator and an accumulation system, whose size and impact depend on the production of the installation. Therefore a score equal to 2 and to 3 is assigned to the stand-alone solution, respectively, in absence and in presence of large wind (i.e., the major potential power source with high discontinuity over time), while a score equal to 5 is given to the connected-to-grid solution.
Regarding Maintenance, MUPs require regular periodic transportation for feeding the aquaculture system. While specific transportation due to the wind farm is considered minimum due to technological reliability, transportation for maintenance of the WECs (moorings, reflectors, fouling) can be high (score = 3 for WaveStar, score = 4 for DEXA). Fouling is expected to occur without consequences on the aquaculture cages and on the wind piles, while it can represent a serious problem for the floating WECs (score = 2 for WaveStar, score = 3 for DEXA). The impact induced by material durability is considered to be high and mainly ascribed to the steel components of the wind and wave farms, therefore a higher score is given to MUPs, including DEXA (score = 3 for WaveStar, score = 4 for DEXA).

5.2.4. Risks

Structural failure depends on the following.
  • Modular or single/rigid structure: the WECs, especially the DEXA devices, consist of parts that have to be built up ad hoc and are also particularly exposed to intense storms (score = 3 for WaveStar, score = 4 for DEXA); based on existing experience, due to the fragility of mini-wind components the scores are increased of a 0.5 point when this use is included.
  • Geotechnical failure: a lower score is given when only anchors are present (score = 3 for DEXA, due to the huge number of anchors), while a higher score is assigned to piles due to potential liquefaction problems (score = 4 for WaveStar, increase of 1 point for each configuration including large wind).
  • Moorings: based on recent documented failures and maturity of technology, the score is lower for aquaculture in combination with fixed structures (score = 2 for WaveStar and aquaculture and wind) and maximum importance for floating WECs (score equal to 5 for DEXA).
Power failure risk derives from the following.
  • The type of Power take off, which is considered to be driven by the more immature WEC installations; a score equal to 2 is assigned to WaveStar, since it has experienced a large amount of working hours, while a score equal to 5 is given to DEXA, which has never even reached a prototype installation.
  • The local energy storage/use, which is assumed to lead to a lower risk (score = 2), due to energy discontinuity and insufficient combined electrical infrastructure, with respect to the connected-to-grid solution (score = 4), due to the failure of one or more of the power cables.
Pollution is essentially due to the nutrients and other substances required for aquaculture use and by the need to use antifouling paints, but since these pollutions characterize all the MUPs, it is driven by the expected corrosion and abrasion of WECs (score = 3 and 4 for WaveStar and DEXA, respectively, due to the larger surface exposed to the sea).

5.2.5. Costs

Costs increase with increasing installation depth. In this case, a constant score equal to 3 is assigned to all MUPs since the minimum required bottom depth of 27 m is determined by aquaculture (to guarantee legislative compliance, good animal health and mitigation of environmental impact).
The complexity of the installation type is essentially driven by the WECs, since the devices contain many components that are non-commercially available (a.o. DEXA pontoons, WaveStar floaters) and have to be built ad hoc. All the DEXA installations are expected to lead to a higher cost than the WaveStar (since piles and modular emerged parts are commercially available).
Moorings are required for the aquaculture system (minimum score = 2 when the WEC is fixed) and especially for the DEXA (score = 5).
Power extraction and storage depends on the following.
  • The PTO type, which is expensive for WaveStar, since it is related to each floater, but even more for DEXA, since it has never been tested at prototype scale (score = 3 for WaveStar, score = 4 for DEXA); in the presence of large and mini-wind, the scores increase, respectively, by 0.5 and 1 point.
  • The local energy storage/use, which reduces the costs due to the reduction of power cables to shore. However, this solution includes costs related to the storage system and electrical stabilization (score = 3). The connected-to-grid solution is supposed to have the highest costs (score = 5) due the huge distance from shore (>20 km due to the mild bottom slope).
Installation/maintenance requirements derive from the following.
  • The level of accessibility, for which a lower score is assigned to the fixed WECs, because more monitoring and maintenance of the anchors for the floating WECs is expected (score = 2 for WaveStar, score = 3 for DEXA).
  • the materials, depending on the type and volumes; a lower score is assigned to aquaculture and WECs (3); with respect to aquaculture, WECs and mini (3.5) or large wind farm/s (4).
Transportation cost depends on the following.
  • Installation, whose cost is driven by volumes, i.e., piles and number of devices to be transported; therefore, the minimum score is assigned to the MUPs, including WECs only (score = 3), while additional points are given when large- and mini-wind are also present (0.5 and 1 point, respectively); in case of connection to the grid, an additional 0.5 point is considered.
  • Operation mean cost, which is mainly due to the regular maintenance of the aquaculture plant but can be significantly higher considering exceptional maintenance to wind and wave farms; here the costs due to ordinary maintenance are accounted for, with a score equal to 4 for all MUPs.

5.3. Selection of the Most Promising Alternative and Preliminary Design Layout

The sum of the mean scores achieved for each criterion gives the total score of the different MUPs and therefore their ranking from the lowest score to the highest score, i.e., from the best to the worst scheme. It can be observed that:
  • all the stand-alone MUPs are more suited than the connected-to-grid-solutions, essentially due to greater innovation, lower environmental impact and lower costs;
  • all the MUPs including the WaveStar device, despite the potential higher environmental impact and higher geotechnical risks, are more suited than the DEXA installation, due to the maturity of the technology, more reliable foundations and power take off and to the relatively limited water depth that is close to the suggested range for this device; and
  • the stand-alone alternatives including WaveStar, aquaculture and large/mini-wind (MUPS 1, 3, 5) provide global scores that are very close to each other, especially when the difference is given by the inclusion of the mini-wind only (MUPs 1 and 3)—this result may suggest that more detailed analysis should be carried out when considering the effects of fixed foundations, especially for wind turbines.
Based on these results, some preliminary design considerations are drawn for the selected scheme, MUP 3, including aquaculture and mini-wind placed on WaveStar devices, while using part of the energy produced to sustain the MUP and part for local energy storage.
The separated layouts for mini-wind, WaveStar, and aquaculture have already been discussed together with their constraints in Section 3 and presented in Figure 9, Figure 11 and Figure 12, respectively.
The MUP design should optimize the use of marine space while combining constraints related to each single use (such as minimum safety distances, maximum distances from the shore, required space for ordinary and extraordinary operation/maintenance, etc.) and desirable features (i.e., minimize the occupied space, protect aquaculture, maximize energy harvesting for wind and wave energy devices, etc.). The MUP design has to account for potential synergistic use of components (piles, emerged supports, etc.) or indirect benefits deriving from different uses (e.g., wave absorption by WECs for protecting aquaculture installation).
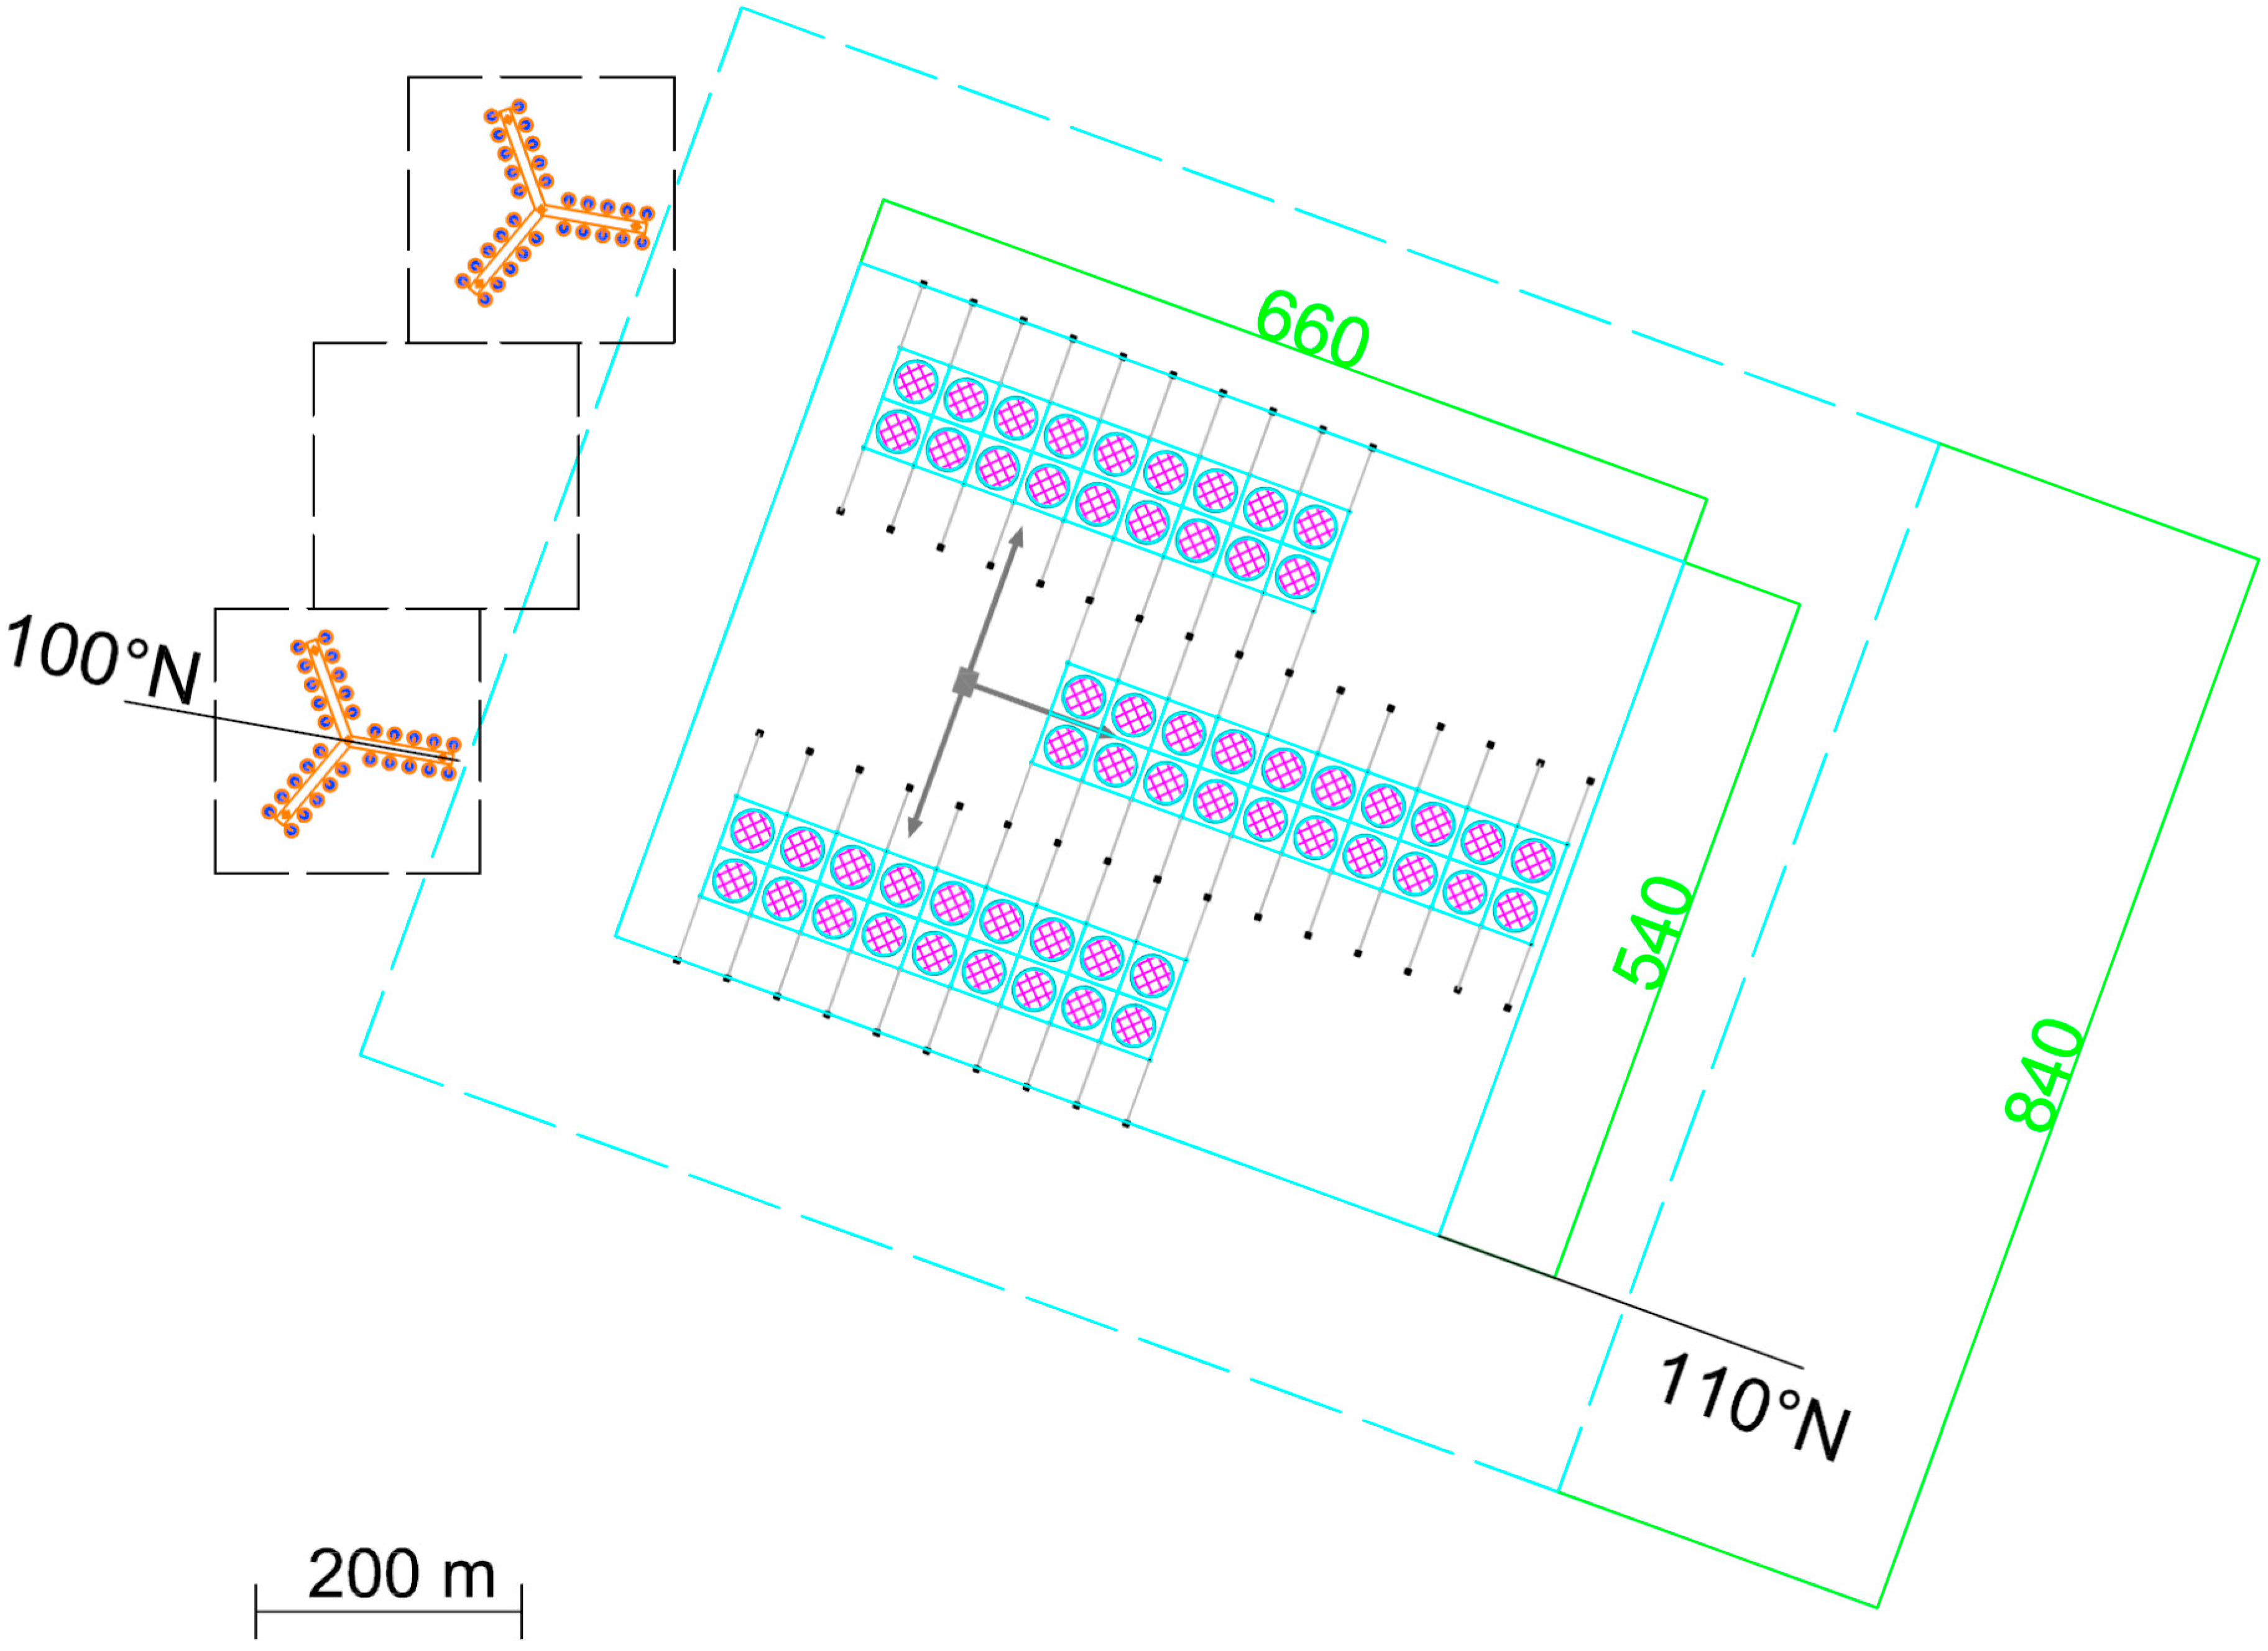
The orientation of the MUP is selected to be 110°N, accounting for the Bora and Scirocco wave conditions.
The selection of a stand-alone MUP leads to some essential design constraints, as it is not technically feasible to set-up huge local energy storage and to stabilize the energy production without a detailed analysis of the power production outputs in time. The detailed numerical modeling of the electrical synergies and the overall stability of the MUP are out of the scope of this paper and, therefore, we are here referring to the more relevant results.
The number of WECs and the related number of mini-wind turbines have thus to be defined based on two main issues: (1) the power consumption of the fish farm; and (2) the power continuity. In this site, the combination of wind and wave energy devices does not lead to any significant reduction of the unproductive hours of the MUP, as in this site waves are typically wind generated with a very limited time shift.
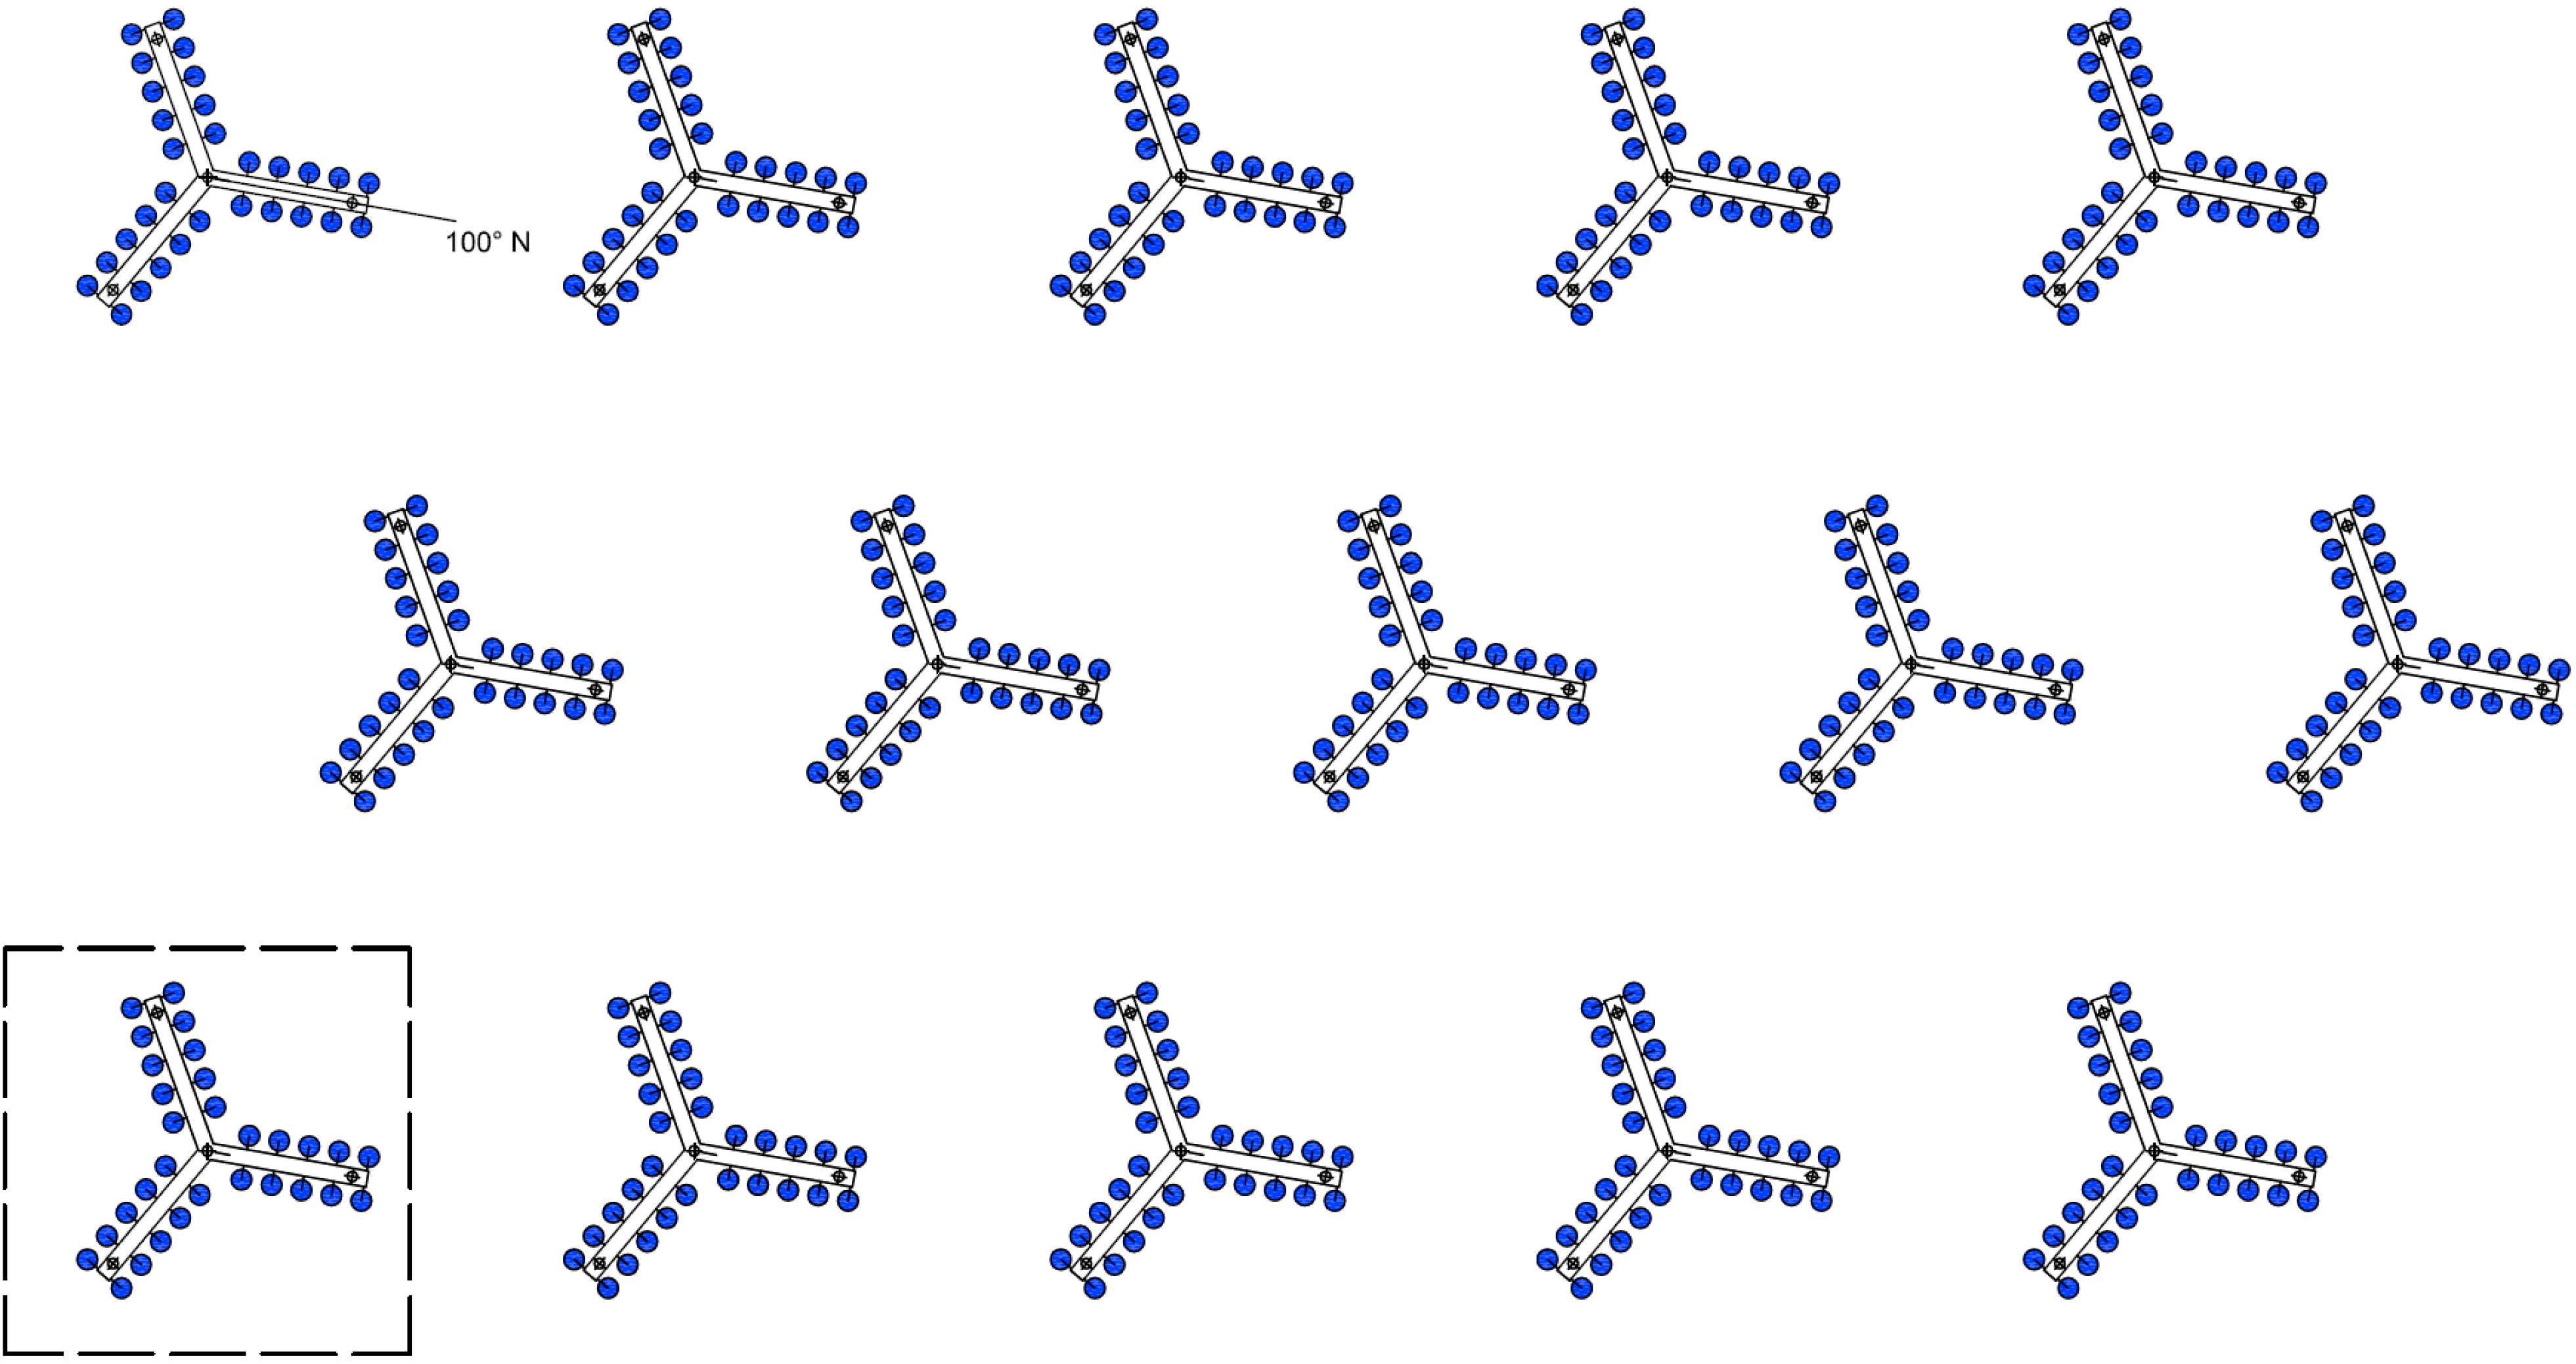
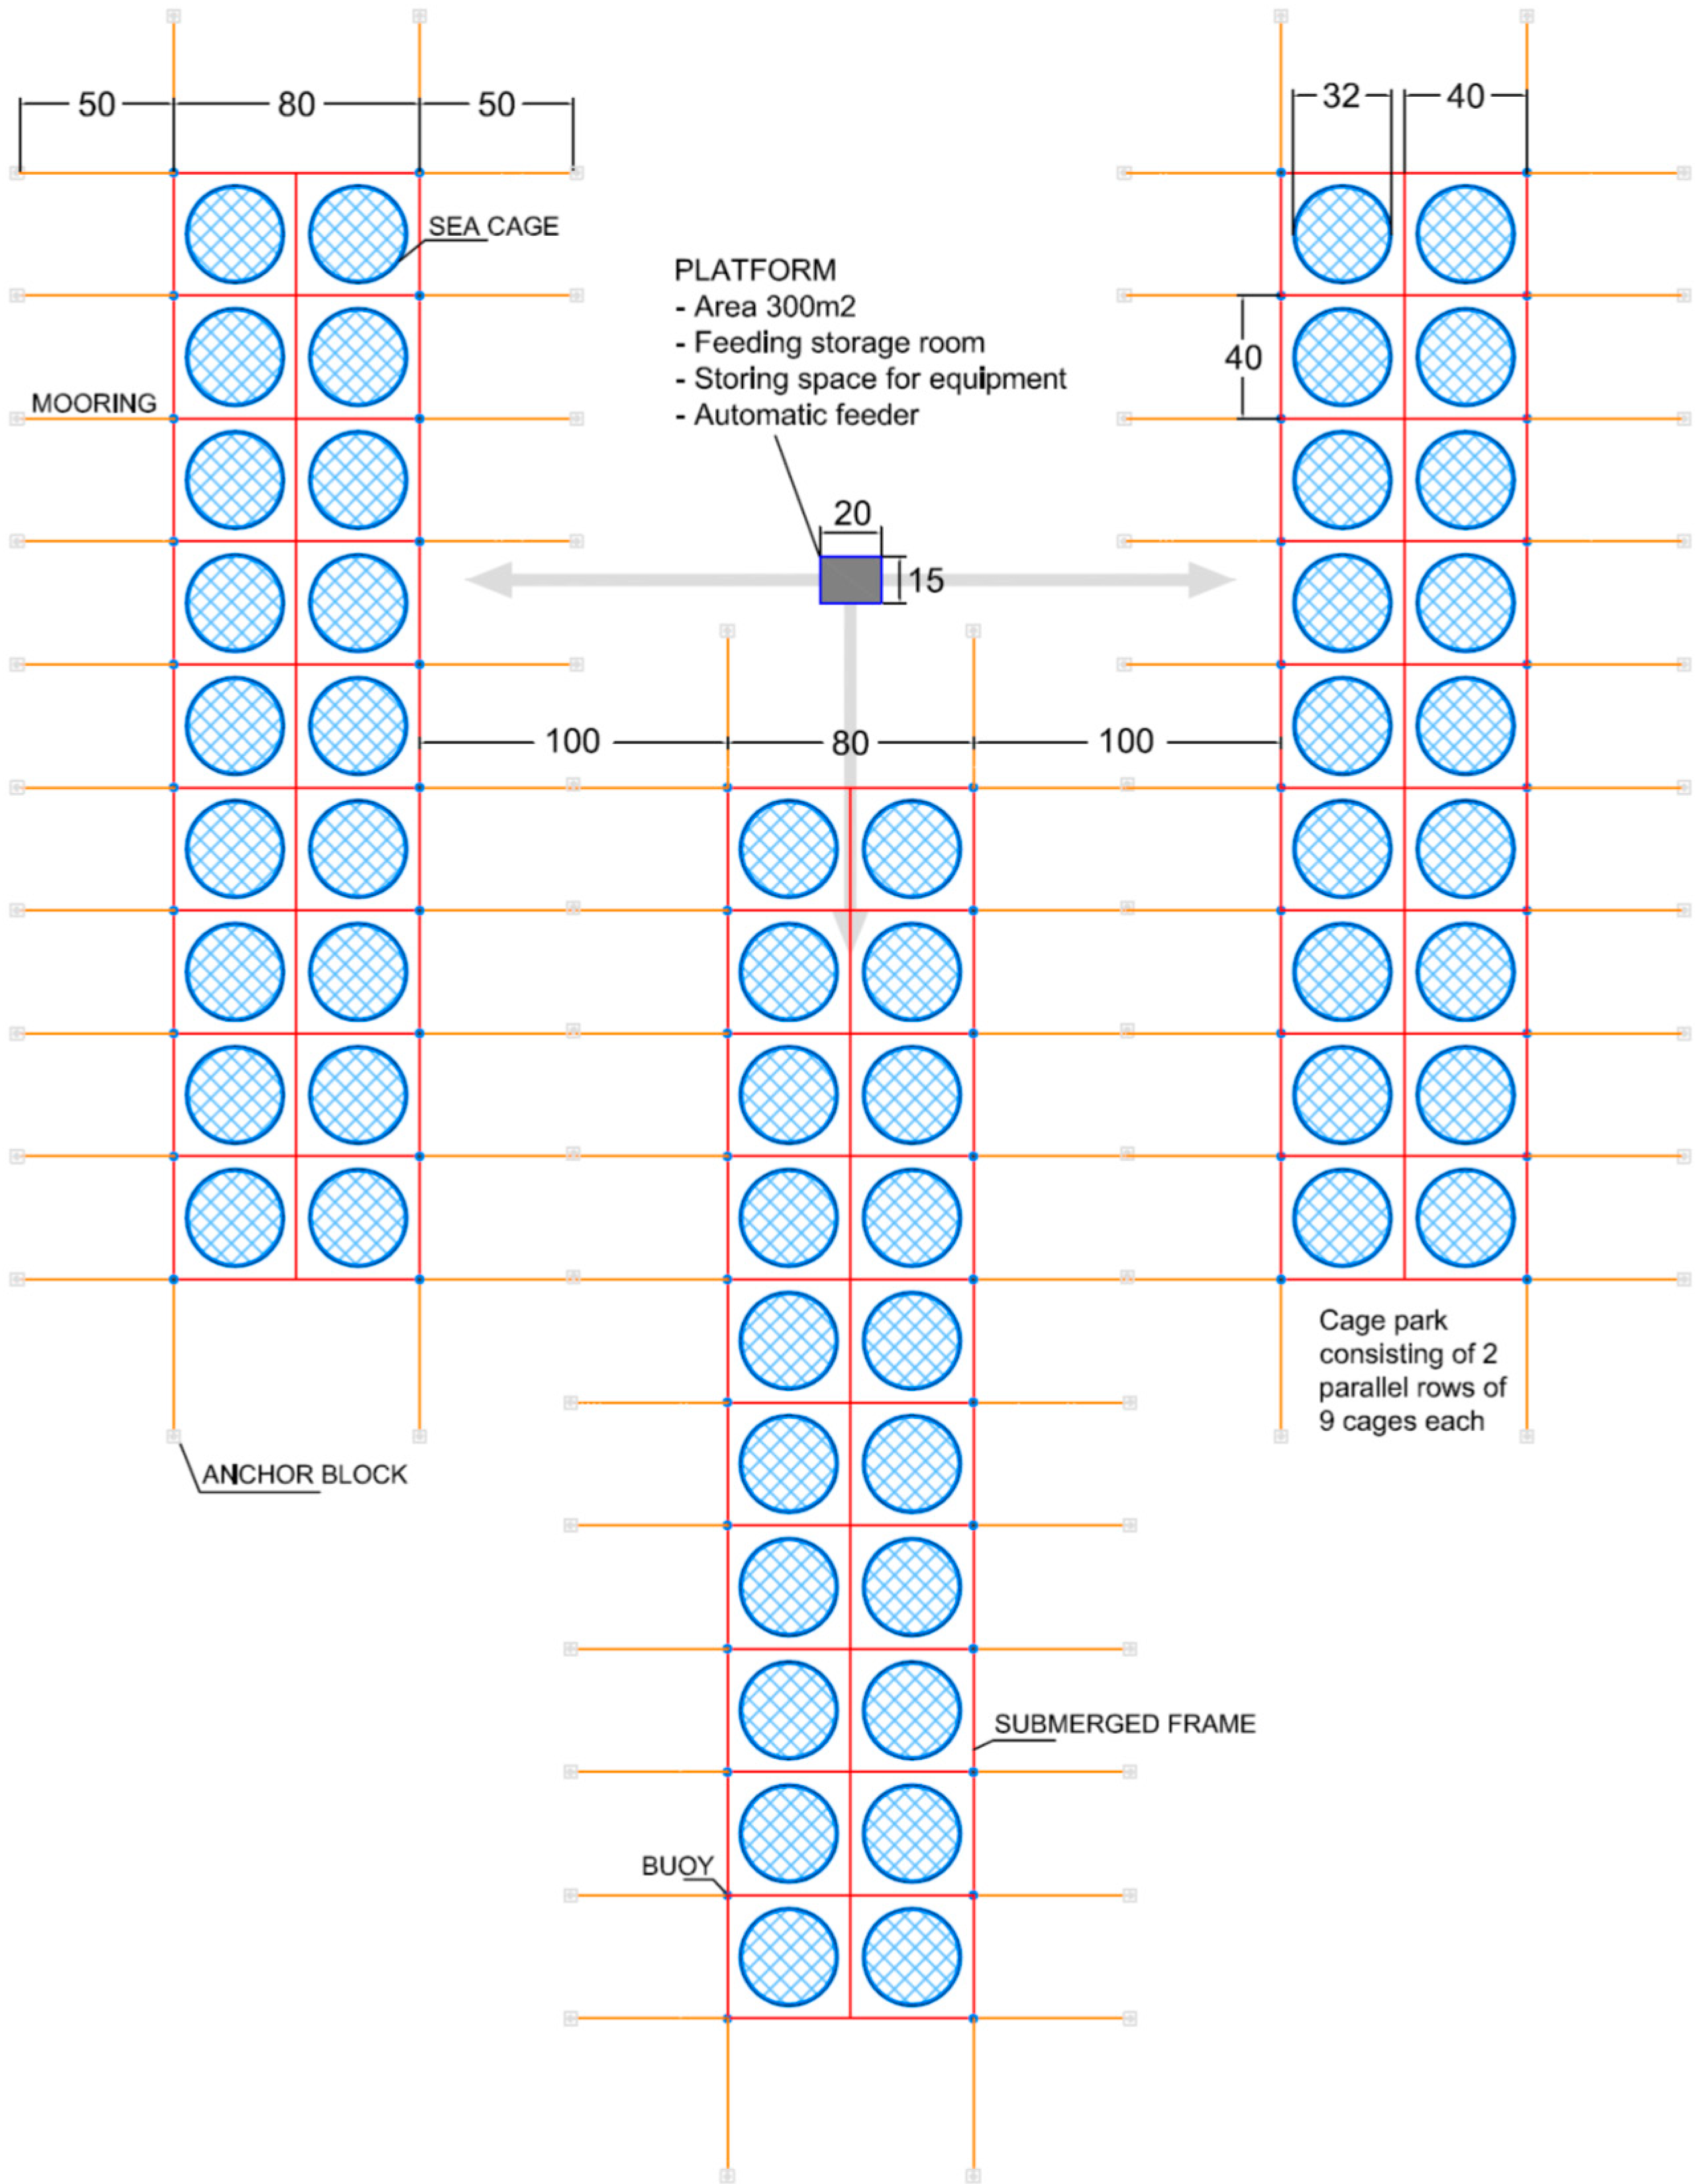
The power required by the fish farm is about 200 kWh for 6 h during winter time and 12 h during summer time, for a total of about 0.8 GWh/year, which is a figure close to the production assured by two WaveStar platforms consisting of three arms placed in a “star” configuration. The layout of MUP 3 (Figure 13) will therefore include two2 WaveStar platforms with three mini-wind turbines installed at the each arm edges and one module of the fish farm. The configuration for the mini-wind installations is made to avoid wake effects, balance structural loads and maximize the power production, which would be produced by a perpendicular exposure to Bora winds. However, such exposure is never perfectly achieved with the selected arms orientation. In this particular case (only two WECs and mild climate), the WECs are placed inshore of the fish farm, to avoid asymmetrical wakes on the fish farm.
An additional back-up generator set has to be introduced, since the capacity of the actual storage systems is quite limited and the power load for the fish farm has to be guaranteed during unproductive intervals from marine renewables.
Figure 13. Suggested layout for the selected MUP 3.
Sustainability 07 06804 g013
As this study allowed developing relevant synergies among the experts, it is worth reporting here some considerations also regarding the layout of the corresponding connected-to-grid solution (MUP 4), as an exercise leading to guidelines exportable to similar cases.
When connected to the grid, the energy produced by the MUP is not upper limited. It will be necessary to design the number and type of marine renewable energy devices in such a way that their combination leads to the minimum hours of energy-generating idleness and to stable electrical conditions. This issue is not considered here in the set-up of this preliminary layout.
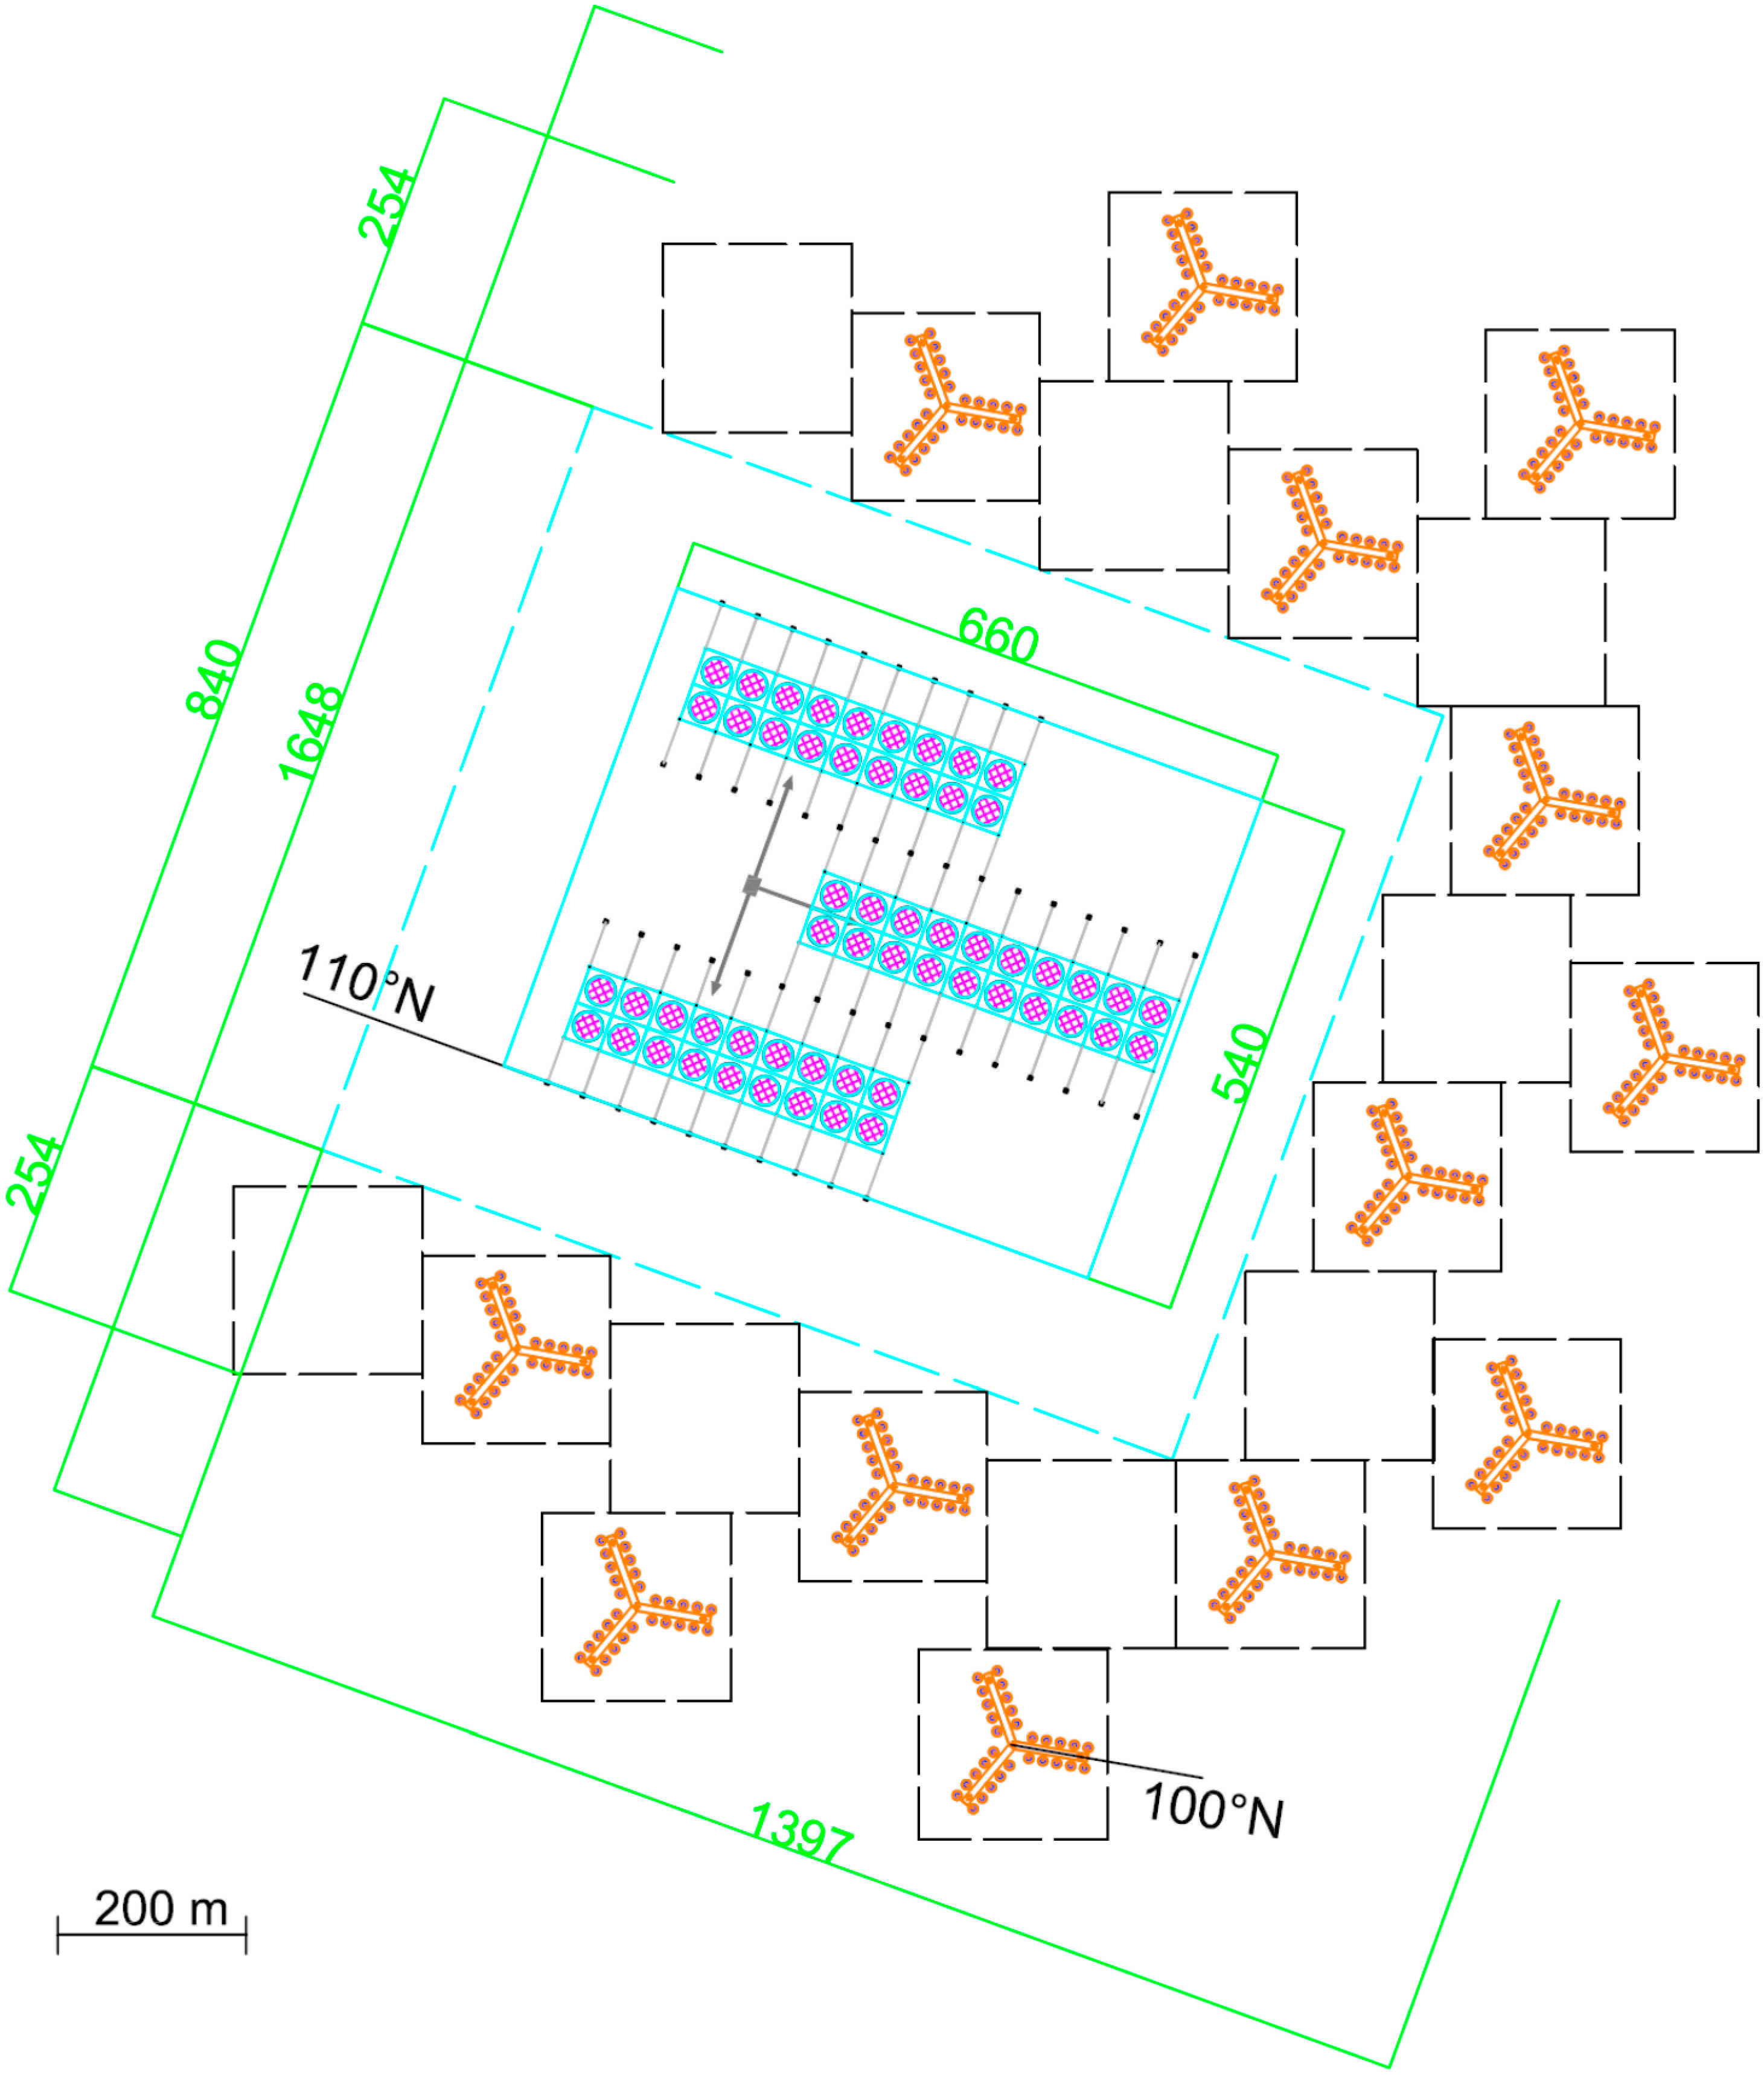
To assure protection to the aquaculture cages, the WECs should be installed in front and on the sides of the aquaculture cages in a “C” configuration, facing both Bora and Scirocco waves.
As in the previous design, the mini-wind is also installed at the edges of the three arms of the WaveStar, for a total of 39 mini-wind turbines.
The MUP total area to maximize power production and sheltering effects would be around 2 km2, being about 1.4 km long in both long-shore and cross-shore directions (see the layout in Figure 14).
Figure 14. Suggested layout for the MUP 4, i.e., MUP 3 but connected to the grid. Dashed boxes represent the minimal mutual distance among WEC modules to reduce wake effects and allow for navigation. Dimensions are in meters.
Sustainability 07 06804 g014
The power production is roughly estimated as 4.2 GWh/year, of which only the 19% is needed for the operation of the aquaculture plant. In this specific case, it would be worth also including four large wind turbines integrated in correspondence of the central axis of four Wave Stars placed at the corners of the “C” configuration, leading to an increase of the production of additional 12.6 GWh/year, for a MUP total power production of around 16.8 GWh/year.
It is also worth remarking that all these considerations related to power production of both MUP 3 and MUP 4 do not account for power losses (PTO, cables, wake effects, etc.), as the performance of wind and wave energy devices is based on hydraulic efficiency only.

6. Conclusions

Based on a hypothetical installation in the mildest area of the Mediterranean Sea, the Northern Adriatic, this paper examined the potential of offshore installations for renewable energy and aquaculture. The steps to examine the different solutions have been synthesized, including the site environmental conditions, the policy constraints and the interaction with local stakeholders. A preliminary assessment of the requirements and production potential of the single-purpose solutions has been carried out, showing that these solutions would never lead to viable projects at the site. The analysis, however, proceeded further in depth to investigate the synergies achievable by combining different uses within the same installation.
An objective multi-criteria procedure has been applied to integrated conceptual alternatives, leading first to the identification of 12 MUP schemes combining in different ways the fish farm, the (mini and/or large) wind and the (floating or fixed) wave energy installation within either a stand-alone or a connected-to-grid solution. Then the MUP concepts have been ranked, accounting for the expected benefits related to production and technological innovation, the impacts on local and costal environment, the installation and maintenance costs, and the risks due to structural, geotechnical, electrical failures, and pollution.
The results of this expert judgment ranking identified as the most promising solution, the stand-alone MUP integrating the fixed wave energy devices, the mini-wind and the fish farm. The preference for the stand-alone solution is mainly given by the large distance of the MUP from the shore, which increases the costs significantly, and by the strong impact that power cables would have on the soft bottom assemblages in this area.
This selected MUP is designed for a power production close to the requirements of the fish farm, to fulfill the constraints posed by the electrical infrastructure for power stabilization and local storage. A critical issue for the design of both stand-alone and connected-to-grid solutions is the power discontinuity at the site, due to the mild climate, and the close correlation between wind and wave power, due to the wind-generated waves in the semi-enclosed Adriatic basin.
The technological constraints of each single use platform and the synergies derived from the combined uses provided some general main suggestions for the preliminary design layout. Wave energy arrays can offer protection to aquaculture and should therefore be placed on the exposed side and around the fish farm cages (depending on the number of the devices), along the direction of the more energetic wave states. In this specific case, with a bi-directional wave climate, the main axis of the MUP should be oriented almost perpendicularly to the two prevailing directions of incoming waves to maximize wave energy production and protection to aquaculture. Stand-alone solutions are particularly suited to minimize the impacts on valuable ecosystems; however, they still require some technological advance to overcome the strong limitation on MUP allowable power production.
The main result of this application is not in the site-specific considerations as such, but in the global result that installations integrating more functions at the same site may lead to projects that would have otherwise been unfeasible and to significantly optimize the use of marine resources and space, boosting a more sustainable blue growth.

Acknowledgments

The support of the European Commission through FP7.OCEAN2011-1, Contract 244104—MERMAID project (“Innovative Multi-purpose Offshore Platforms: Planning, Design and Operation”) [7], is gratefully acknowledged.

Author Contributions

The paper has several authors, with different backgrounds: hydraulic engineers (Barbara Zanuttigh, Elisa Angelelli, Giorgio Bellotti , Alessandro Romano), biologist (Yukiko Krontira), marine ecologist (Laura Airoldi, Carlos Jimenez, Marina Evriviadou, Stefanie Broszeit), electrical engineers (Roberto Suffredini, Giulia Franceschi, Matteo Cantù), economist (Fabio Zagonari), geologists (Andrea Taramelli, Federico Filipponi).
The specific authors contribution to the paper is listed in the following.

Conflicts of Interest

The authors declare no conflict of interest.

References

  1. European Commission. The EU Research & Innovation Magazine. Available online: http://ec.europa.eu/research/ (accessed on 26 May 2015).
  2. European Environment Agency. Available online: http://www.eea.europa.eu/publications/europes-onshore-and-offshore-wind-energy-potential (accessed on 26 May 2015).
  3. Fernandez Chozas, J.; Jensen, H.N.E.; Sørensen, H.C. Economic benefit of combining wave and wind power productions in day-ahead electricity markets. In Proceedings of the Fourth International Conference on Ocean Energy (ICOE), Dublin, Ireland, 19 October 2012.
  4. Astariz, S.; Iglesias, G. The economics of wave energy: A review. Renew. Sustain. Energy Rev. 2015, 45, 397–408. [Google Scholar] [CrossRef]
  5. Halpern, B.S.; Walbridge, S.; Selkoe, K.A.; Kappel, C.V.; Micheli, F.; D’Agrosa, C.; Bruno, J.F.; Casey, K.S.; Ebert, C.; Fox, H.E.; et al. A global map of human impact on marine ecosystems. Science 2008, 319, 948–952. [Google Scholar] [CrossRef] [PubMed]
  6. Airoldi, L.; Beck, M.W. Loss, status and trends for coastal marine habitats of Europe. In Oceanography and Marine Biology: An Annual Review; Gibson, R.N., Atkinson, R.J.A., Gordon, J.D.M., Eds.; CRC Press: London, UK, 2007; Volume 45. [Google Scholar]
  7. Mermaid FP 7 European project. Available online: www.mermaidproject.eu (accessed on 26 May 2015).
  8. Tropos FP 7 European project. Available online: http://www.troposplatform.eu/ (accessed on 26 May 2015).
  9. H2ocean FP 7 European project. Available online: http://www.h2ocean-project.eu/ (accessed on 26 May 2015).
  10. Orecca Platform. Available online: www.orecca.eu (accessed on 26 May 2015).
  11. Pérez-Collazo, C.; Greaves, D.; Iglesias, G. A review of combined wave and offshore wind energy. Renew. Sustain. Energy Rev. 2015, 42, 141–153. [Google Scholar] [CrossRef]
  12. Babarit, A.; Ben Ahmed, H.; Clément, A.H.; Debusschere, V.; Duclos, G.; Multon, B.; Robin, G. Simulation of electricity supply of an Atlantic island by offshore wind turbines and wave energy converters associated with a medium scale local energy storage. Renew. Energy 2006, 31, 153–160. [Google Scholar] [CrossRef]
  13. Stoutenburg, E.D.; Jenkins, N.; Jacobson, M.Z. Power output variations of co-located offshore wind turbines and wave energy converters in California. Renew. Energy 2010, 35, 2781–2791. [Google Scholar] [CrossRef]
  14. Fernandez Chozas, J.; Kofoed, J.P.; Kramer, M.M.; Sørensen, H.C. Combined production of a full-scale wave converter and a full-scale wind turbine—A real case study. In Proceedings of the 4th International Conference on Ocean Energy (ICOE), Dublin, Ireland, 17–19 October 2012.
  15. Veigas, M.; Iglesias, G. A Hybrid Wave-Wind Offshore Farm for an Island. Int. J. Green Energy 2015, 12, 570–576. [Google Scholar] [CrossRef]
  16. Astariz, S.; Perez-Collazo, C.; Abanades, J.; Iglesias, G. Co-located wind-wave farm synergies (Operation & Maintenance): A case study. Energy Convers. Manag. 2015, 91, 63–75. [Google Scholar]
  17. Fusco, F.; Nolan, G.; Ringwood, J.V. Variability reduction through optimal combination of wind/wave resources—An Irish case study. Energy 2010, 35, 314–325. [Google Scholar] [CrossRef]
  18. Fayram, A.H.; de Risi, A. The potential compatibility of offshore wind power and fisheries: An example using bluefin tuna in the Adriatic Sea. Ocean Coast. Manag. 2007, 50, 597–605. [Google Scholar] [CrossRef]
  19. Buck, B.H.; Ebeling, M.W.; Michler-Cieluch, T. Mussel cultivation as a co-use in offshore wind farms: potential and economic feasibility. Aquac. Econ. Manag. 2010, 14, 255–281. [Google Scholar] [CrossRef]
  20. Bartelings, H.; van den Burg, S.; Jak, R.; Jansen, H.; Klijnstra, J.; Lagerveld, S.; Leopold, M.; Poelman, M.; Röckmann, C.; Scholl, M. Combining Offshore Wind Energy and Large-Scale Mussel Farming: Background & Technical, Ecological and Economic Considerations. Available online: https://www.wageningenur.nl/en/Publication-details.htm?publicationId=publication-way-343737343831 (accessed on 26 May 2015).
  21. Gimpel, A.; Stelzenmüller, V.; Grote, B.; Buck, B.H.; Floeter, J.; Núñez-Riboni, I.; Pogoda, B.; Temming, A. A GIS modelling framework to evaluate marine spatial planning scenarios: Co-location of offshore wind farms and aquaculture in the German EEZ. Mar. Policy 2015, 55, 102–115. [Google Scholar] [CrossRef] [Green Version]
  22. Zanuttigh, B.; Angelelli, A.; Kortenhaus, A.; Koca, K.; Krontira, Y.; Koundouri, P. A methodology for multi-criteria design of Multi-Use Offshore Platforms for Marine Renewable Energy Harvesting. Renew. Energy 2015. submitted for publication. [Google Scholar]
  23. Italian National Research Centre. Available online: http://www.ismar.cnr.it/infrastructures/piattaforma-acqua-alta?set_language=en&cl=en (accessed on 26 May 2015).
  24. Giant wave energy converter. Available online: www.giantgiem.it (accessed on 26 May 2015).
  25. WEMpower wave energy converter. Available online: www.wempower.it (accessed on 26 May 2015).
  26. Artioli, Y.; Bendoricchio, G.; Palmeri, L. Defining and modelling the coastal zone affected by the Po River (Italy). Ecol. Model. 2005, 184, 55–68. [Google Scholar] [CrossRef]
  27. Artegiani, A.; Bregant, D.; Paschini, E.; Pinardi, N.; Raicich, F.; Russo, A. The Adriatic sea general circulation. Part II: Baroclinic circulation structure. J. Phys. Oceanogr. 1997, 27, 1515–1532. [Google Scholar] [CrossRef]
  28. Wang, X.H.; Pinardi, N. Modeling the dynamics of sediment transport and resuspension in the northern Adriatic Sea. J. Geophys. Res.-Oceans 2002, 107. [Google Scholar] [CrossRef]
  29. Bever, A.J.; Harris, C.K.; Sherwood, C.R.; Signell, R.P. Deposition and flux of sediment from the Po River, Italy: An idealized and wintertime numerical modeling study. Mar. Geol. 2009, 260, 69–80. [Google Scholar] [CrossRef]
  30. Zavatarelli, M.; Raicich, F.; Bregant, D.; Russo, A.; Artegiani, A. Climatological biogeochemical characteristics of the Adriatic Sea. J. Mar. Syst. 1998, 18, 227–263. [Google Scholar] [CrossRef]
  31. Boldrin, A.; Langone, L.; Miserocchi, S.; Turchetto, M.; Acri, F. Po River plume on the Adriatic continental shelf: Dispersion and sedimentation of dissolved and suspended matter during different river discharge rates. Mar. Geol. 2005, 222–223, 135–158. [Google Scholar] [CrossRef]
  32. Ponti, M.; Fava, F.; Abbiati, M. Spatial–temporal variability of epibenthic assemblages on subtidal biogenic reefs in the northern Adriatic Sea. Mar. Biol. 2011, 158, 1447–1459. [Google Scholar] [CrossRef]
  33. Zotier, R.; Bretagnolle, V.; Thibault, J.C. Biogeography of the marine birds of a confined sea, the Mediterranean. J. Biogeogr. 1999, 26, 297–313. [Google Scholar] [CrossRef]
  34. Groombridge, B. Marine turtles in the Mediterranean: Distribution, population status, conservation. In Nature and Environment Series; Book 48; European Council: Strasbourg, France, 1990. [Google Scholar]
  35. Bearzi, G.; Holcer, D.; di Sciara, G.N. The role of historical dolphin takes and habitat degradation in shaping the present status of northern Adriatic cetaceans. Aquat. Conserv.-Mar. Freshw. Ecosyst. 2004, 14, 363–379. [Google Scholar] [CrossRef]
  36. Ferretti, F.; Osio, G.C.; Jenkins, C.J.; Rosenberg, A.A.; Lotze, H.K. Long-term change in a meso-predator community in response to prolonged and heterogeneous human impact. Sci. Rep. 2013, 3, 1057. [Google Scholar] [CrossRef] [PubMed]
  37. Lotze, H.K.; Coll, M.; Dunne, J.A. Historical Changes in Marine Resources, Food-web Structure and Ecosystem Functioning in the Adriatic Sea, Mediterranean. Ecosystems 2011, 14, 198–222. [Google Scholar] [CrossRef]
  38. Stuiver, M.; Koundouri, P.; González Dávila, O.; Papagianni, C.; van den Burg, S.; Gerritsen, A.; Harkamp, T.; Zanuttigh, B.; Zagonari, F.; Guanche, R.; et al. Governance regimes for Multi-use Offshore Platforms, experiences in four case studies in Europe, to appear. Sustain. J. 2015, in press. [Google Scholar]
  39. Van den Burg, S.; Koundouri, P.; Stuiver, M.; Rockmann, C.; Norrmann, J.; Soderqvist, T.; Schouten, J.J.; Petersen, O.; Guanche García, R.; Diaz-Simal, P.; et al. The interactive design of Multi-Use Platforms at Sea, Mermaid’s lessons for future developers, to appear. Sustain. Sustain. J. 2015, in press. [Google Scholar]
  40. Kodikara, P.N.; Pereraa, B.J.C.; Kularathnab, M.D.U.P. Stakeholder preference elicitation and modeling in multicriteria decision analysis—A case study on urban water supply. Eur. J. Oper. Res. 2010, 206, 209–220. [Google Scholar] [CrossRef]
  41. Rivas, R.A. Master Thesis, Optimization of Offshore Wind Farm Layouts. 2007. Available online: http://www.dffv.dk/VindKraftNet%20Wake%20day%2016%20sept%202008/Rivas%20rajai-presentation.pdf (accessed on 30 December 2014).
  42. DEXA wave energy converter. Available online: www.dexawave.com (accessed on 26 May 2015).
  43. Kofoed, J.P. Hydraulic Evaluation of the DEXA Wave Energy Converter, DCE Contract Report No. 57; Aalborg University: Aalborg, Denmark, 2009. [Google Scholar]
  44. Zanuttigh, B.; Angelelli, E.; Castagnetti, M.; Kofoed, J.K.; Clausens, L. The wave field around DEXA devices and implications for coastal protection. In Proceedings of the 9th European Wave and Tidal Energy Conference, Southampton, UK, 5–9 September 2011.
  45. Angelelli, E.; Zanuttigh, B.; Ferri, F.; Kofoed, J.P. Experimental assessment of the mooring influence on the power output of a Wave Activated Body floating WEC. In Proceedings of the 10th European Wave and Tidal Energy Conference, Aalborg, Denmark, 2–5 September 2013.
  46. Wavestar wave energy converter. Available online: http://wavestarenergy.com (accessed on 26 May 2015).
  47. Wave Star Energy—Wave Star Bølgekraftmaskine 1:40 Skala Model. Available online: http://wavestarenergy.com/sites/default/files/nei-dk-4501.pdf (accessed on 26 May 2015).
  48. Dugan, J.E.; Airoldi, L.; Chapman, M.G.; Walker, S.J.; Schlacher, T. Estuarine and Coastal Structures. In Treatise on Estuarine and Coastal Science; Book 8; Wolansk, I.E., McLusky, D.S., Eds.; Academic Press: Waltham, MA, USA, 2011. [Google Scholar]
  49. Dafforn, K.A.; Glasby, T.M.; Johnston, E.L. Comparing the Invasibility of Experimental “Reefs” with Field Observations of Natural Reefs and Artificial Structures. PLoS ONE 2012, 7, e38124. [Google Scholar] [CrossRef] [PubMed]
  50. Wilson, J.C.; Elliott, M. The habitat-creation potential of offshore wind farms. Wind Energy 2009, 12, 203–212. [Google Scholar] [CrossRef]
  51. Lozano-Minguez, E.; Kolios, A.J.; Brennan, F.P. Multi-criteria assessment of offshore wind turbine support structures. Renew. Energy 2011, 36, 2831–2837. [Google Scholar] [CrossRef] [Green Version]
  52. Gill, A.B.; Bartlett, M.; Thomsen, F. Potential interactions between diadromous fishes of U.K. conservation importance and the electromagnetic fields and subsea noise from marine renewable energy developments. J. Fish Biol. 2012, 81, 664–695. [Google Scholar] [CrossRef] [PubMed]
  53. Miller, R.G.; Hutchison, Z.L.; Macleod, A.K.; Burrows, M.T.; Cook, E.J.; Last, K.S.; Wilson, B. Marine renewable energy development: Assessing the Benthic Footprint at multiple scales. Front. Ecol. Environ. 2013, 11, 433–440. [Google Scholar] [CrossRef]
  54. Inger, R.; Attrill, M.J.; Bearhop, S.; Broderick, A.C.; Grecian, W.J.; Hodgson, D.J.; Mills, C.; Sheehan, E.; Votier, S.C.; Witt, M.J.; et al. Marine renewable energy: potential benefits to biodiversity? An urgent call for research. J. Appl. Ecol. 2009, 46, 1145–1153. [Google Scholar] [CrossRef]
  55. Airoldi, L.; Turon, X.; Perkol-Finkel, S.; Ruis, M. Corridors for aliens but not for natives: Effects of marine urban sprawl at a regional scale. Divers. Distrib. 2015. [Google Scholar] [CrossRef]
  56. Chapman, M.G.; Underwood, A.J. Evaluation of ecological engineering of “armoured” shorelines to improve their value as habitat. J. Exp. Mar. Biol. Ecol. 2011, 400, 302–313. [Google Scholar] [CrossRef]
  57. Firth, L.B.; Thompson, R.C.; Bohn, K.; Abbiati, M.; Airoldi, L.; Bouma, T.J.; Bozzeda, F.; Ceccherelli, V.U.; Colangelo, M.A.; Evans, A.; et al. Between a rock and a hard place: Environmental and engineering considerations when designing coastal defence structures. Coast. Eng. 2014, 87, 122–135. [Google Scholar] [CrossRef] [Green Version]
  58. Mineur, F.; Cook, E.J.; Minchin, D.; Bohn, K.; MacLeod, A.; Maggs, C.A. Changing coasts: Marine aliens and artificial structures. In Oceanography Marine Biology Annual Review; Book 50; Gibson, R.N., Atkinson, R.J.A., Gordon, J.D.M., Hughes, R.N., Eds.; Crc Press-Taylor & Francis Group: Boca Raton, FL, USA, 2012. [Google Scholar]
  59. Airoldi, L.; Bulleri, F. Anthropogenic disturbance can determine the magnitude of opportunistic species responses on marine urban infrastructures. PLoS ONE 2011, 6, e22985. [Google Scholar] [CrossRef] [PubMed]
  60. Occhipinti-Ambrogi, A.; Marchini, A.; Cantone, G.; Castelli, A.; Chimenz, C.; Cormaci, M.; Froglia, C.; Furnari, G.; Gambi, M.C.; Giaccone, G.; et al. Alien species along the Italian coasts: An overview. Biol. Invasions 2011, 13, 215–237. [Google Scholar] [CrossRef]
  61. Grozea, C.M.; Walker, G.C. Approaches in designing non-toxic polymer surfaces to deter marine biofouling. Soft Matter 2009, 5, 4088–4100. [Google Scholar] [CrossRef]
  62. Perkol-Finkel, S.; Ferrario, F.; Nicotera, V.; Airoldi, L.; Cadotte, M. Conservation challenges in urban seascapes: promoting the growth of threatened species on coastal infrastructures. J. Appl. Ecol. 2012, 49, 1457–1466. [Google Scholar] [CrossRef]
  63. Wiese, F.K.; Montevecchi, W.; Davoren, G.; Huettmann, F.; Diamond, A.; Linke, J. Seabirds at Risk around Offshore Oil Platforms in the North-west Atlantic. Mar. Pollut. Bull. 2001, 42, 1285–1290. [Google Scholar] [CrossRef]
  64. Merkel, F.R.; Johansen, K.L. Light-induced bird strikes on vessels in Southwest Greenland. Mar. Pollut. Bull. 2011, 62, 2330–2336. [Google Scholar] [CrossRef] [PubMed]
  65. Soto, N.A.; Delorme, N.; Atkins, J.; Howard, S.; Williams, J.; Johnson, M. Anthropogenic noise causes body malformations and delays development in marine larvae. Sci. Rep. 2013, 3. Article 2831. [Google Scholar] [Green Version]
  66. Nedelec, S.L.; Radford, A.N.; Simpson, S.D.; Nedelec, B.; Lecchini, D.; Mills, S.C. Anthropogenic noise playback impairs embryonic development and increases mortality in a marine invertebrate. Sci. Rep. 2014, 4. Article 5891. [Google Scholar] [CrossRef] [PubMed] [Green Version]
  67. Bailey, H.; Senior, B.; Simmons, D.; Rusin, J.; Picken, G.; Thompson, P.M. Assessing underwater noise levels during pile-driving at an offshore windfarm and its potential effects on marine mammals. Mar. Pollut. Bull. 2010, 60, 888–897. [Google Scholar] [CrossRef] [PubMed]
  68. Witt, M.J.; Sheehan, E.V.; Bearhop, S.; Broderick, A.C.; Conley, D.C.; Cotterell, S.P.; Crow, E.; Grecian, W.J.; Halsband, C.; Hodgson, D.J.; et al. Assessing wave energy effects on biodiversity: The Wave Hub experience. Philos. Trans. R. Soc. A 2012, 370, 502–529. [Google Scholar] [CrossRef] [PubMed]
  69. Thrush, S.F.; Hewitt, J.E.; Cummings, V.J.; Dayton, P.K.; Cryer, M.; Turner, S.J.; Funnell, G.A.; Budd, R.G.; Milburn, C.J.; Wilkinson, M.R. Disturbance of the marine benthic habitat by commercial fishing: Impacts at the scale of the fishery. Ecol. Appl. 1998, 8, 866–879. [Google Scholar] [CrossRef]
  70. Pranovi, F.; Raicevich, S.; Franceschini, G.; Farrace, M.G.; Giovanardi, O. Rapido trawling in the northern Adriatic Sea: Effects on benthic communities in an experimental area. ICES J. Mar. Sci. 2000, 57, 517–524. [Google Scholar] [CrossRef]
  71. Jennings, S.; Kaiser, M.J. The effects of fishing on marine ecosystems. Adv. Mar. Biol. 1998, 34, 201–352. [Google Scholar]
  72. Terlizzi, A.; Bevilacqua, S.; Scuderi, D.; Fiorentino, D.; Guarneri, G.; Giangrande, A.; Licciano, M.; Felline, S.; Fraschetti, S. Effects of offshore platforms on soft-bottom macro-benthic assemblages: A case study in a Mediterranean gas field. Mar. Pollut. Bull. 2008, 56, 1303–1309. [Google Scholar] [CrossRef] [PubMed]
  73. Borja, A.; Rodriguez, J.G.; Black, K.; Bodoy, A.; Emblow, C.; Fernandes, T.F.; Forte, J.; Karakassis, I.; Muxika, I.; Nickell, T.D. Assessing the suitability of a range of benthic indices in the evaluation of environmental impact of fin and shellfish aquaculture located in sites across Europe. Aquaculture 2009, 293, 231–240. [Google Scholar] [CrossRef]
  74. Navarrete-Mier, F.; Sanz-Lázaro, C.; Marín, A. Does bivalve mollusc polyculture reduce marine fin fish farming environmental impact? Aquaculture 2010, 306, 101–107. [Google Scholar] [CrossRef]
  75. Pusceddu, A.; Fraschetti, S.; Mirto, S.; Holmer, M.; Danovaro, R. Effects of intensive mariculture on sediment biochemistry. Ecol. Appl. 2007, 17, 1366–1378. [Google Scholar] [CrossRef] [PubMed]
  76. Sarà, G.; lo Martire, M.; Sanfilippo, M.; Pulicano, G.; Cortese, G.; Mazzola, A.; Manganaro, A.; Pusceddu, A. Impacts of marine aquaculture at large spatial scales: Evidences from N and P catchment loading and phytoplankton biomass. Mar. Environ. Res. 2011, 71, 317–324. [Google Scholar] [CrossRef] [PubMed]
  77. Luna, G.M.; Corinaldesi, C.; Dell’Anno, A.; Pusceddu, A.; Danovaro, R. Impact of aquaculture on benthic virus-prokaryote interactions in the Mediterranean Sea. Water Res. 2013, 47, 1156–1168. [Google Scholar] [CrossRef] [PubMed]
  78. Martinez-Garcia, E.; Sanchez-Jerez, P.; Aguado-Gimenez, F.; Avila, P.; Guerrero, A.; Sanchez-Lizaso, J.L.; Fernandez-Gonzalez, V.; Gonzalez, N.; Gairin, J.I.; Carballeira, C.; et al. A meta-analysis approach to the effects of fish farming on soft bottom polychaeta assemblages in temperate regions. Mar. Pollut. Bull. 2013, 69, 165–171. [Google Scholar] [CrossRef] [PubMed]
  79. Karakassis, I.; Tsapakis, M.; Hatziyanni, E. Seasonal variability in sediment profiles beneath fish farm cages in the Mediterranean. Mar. Ecol. Prog. Ser. 1998, 162, 243–252. [Google Scholar] [CrossRef]
  80. Forchino, A.; Borja, A.; Brambilla, F.; Rodriguez, J.G.; Muxika, I.; Terova, G.; Saroglia, M. Evaluating the influence of offshore cage aquaculture on the benthic ecosystem in Alghero Bay (Sardinia, Italy) using AMBI and M-AMBI. Ecol. Indic. 2011, 11, 1112–1122. [Google Scholar] [CrossRef]
  81. Sanz-Lázaro, C.; Belando, M.D.; Marín-Guirao, L.; Navarrete-Mier, F.; Marín, A. Relationship between sedimentation rates and benthic impact on Maërl beds derived from fish farming in the Mediterranean. Mar. Environ. Res. 2011, 71, 22–30. [Google Scholar] [CrossRef] [PubMed]
  82. Dean, R.J.; Shimmield, T.M.; Black, K.D. Copper, zinc and cadmium in marine cage fish farm sediments: An extensive survey. Environ. Pollut. 2007, 145, 84–95. [Google Scholar] [CrossRef] [PubMed]
  83. Mayor, D.J.; Solan, M.; Martinez, I.; Murray, L.; McMillan, H.; Paton, G.I.; Killham, K. Acute toxicity of some treatments commonly used by the salmonid aquaculture industry to Corophium volutator and Hediste diversicolor: Whole sediment bioassay tests. Aquaculture 2008, 285, 102–108. [Google Scholar] [CrossRef]
  84. Capone, D.G.; Weston, D.P.; Miller, V.; Shoemaker, C. Antibacterial residues in marine sediments and invertebrates following chemotherapy in aquaculture. Aquaculture 1996, 145, 55–75. [Google Scholar] [CrossRef]
  85. Dempster, T.; Sanchez-Jerez, P.; Bayle-Sempere, J.T.; Giménez-Casalduero, F.; Valle, C. Attraction of wild fish to sea-cage fish farms in the south-western Mediterranean Sea : Spatial and short-term temporal variability. Marine Ecol. Prog. Ser. 2002, 242, 237–252. [Google Scholar] [CrossRef]
  86. Felsing, M.; Glencross, B.; Telfer, T. Preliminary study on the effects of exclusion of wild fauna from aquaculture cages in a shallow marine environment. Aquaculture 2005, 243, 159–174. [Google Scholar] [CrossRef]
  87. Aguado-Giménez, F.; Piedecausa, M.A.; Carrasco, C.; Gutiérrez, J.M.; Aliaga, V.; García-García, B. Do benthic biofilters contribute to sustainability and restoration of the benthic environment impacted by offshore cage finfish aquaculture? Mar. Pollut. Bull. 2011, 62, 1714–1724. [Google Scholar] [CrossRef] [PubMed]
  88. Fernandes, M.; Angove, M.; Sedawie, T.; Cheshire, A. Dissolved nutrient release from solid wastes of southern bluefin tuna (Thunnus maccoyii, Castelnau) aquaculture. Aquac. Res. 2007, 38, 388–397. [Google Scholar] [CrossRef]
  89. Carss, D.N. Concentrations of wild and escaped fishes immediately adjacent to fish farm cages. Aquaculture 1990, 90, 29–40. [Google Scholar] [CrossRef]
  90. Halide, H.; Jompa, J.; McKinnon, A.D. Wild fish associated with tropical sea cage aquaculture in South Sulawesi, Indonesia. Aquaculture 2009, 286, 233–239. [Google Scholar]
  91. Ramírez, B.; Montero, D.; Izquierdo, M.; Haroun, R. Aquafeed imprint on bogue (Boops boops) populations and the value of fatty acids as indicators of aquaculture-ecosystem interaction: Are we using them properly? Aquaculture 2013, 414–415, 294–302. [Google Scholar] [CrossRef]
  92. Klaoudatos, S.D.; Klaoudatosa, D.S.; Smithb, J.; Bogdanosc, K.; Papageorgiouc, E. Assessment of site specific benthic impact of floating cage farming in the eastern Hios island, Eastern Aegean Sea, Greece. J. Exp. Mar. Biol. Ecol. 2006, 338, 96–111. [Google Scholar] [CrossRef]
  93. Edgar, G.J.; Macleoda, C.K.; Mawbeyb, R.B.; Shieldsb, D. Broad-scale effects of marine salmonid aquaculture on macrobenthos and the sediment environment in southeastern Tasmania. J. Exp. Mar. Biol. Ecol. 2005, 327, 70–90. [Google Scholar] [CrossRef]
  94. Huang, Y.-C.A.; Huang, S.-C.; Hsieh, H.J.; Mengd, P.-J.; Chen, C.A. Changes in sedimentation, sediment characteristics, and benthic macrofaunal assemblages around marine cage culture under seasonal monsoon scales in a shallow-water bay in Taiwan. J. Exp. Mar. Biol. Ecol. 2012, 422–423, 55–63. [Google Scholar] [CrossRef]
  95. Rigos, G.; Troisi, G.M. Antibacterial agents in mediterranean finfish farming: A synopsis of drug pharmacokinetics in important euryhaline fish species and possible environmental implications. Rev. Fish Biol. Fish. 2005, 15, 53–73. [Google Scholar] [CrossRef]
  96. ORECCA. Site Selection Analysis for Offshore Combined Resource Projects in Europe. Available online: http://www.orecca.eu/c/document_library/get_file?uuid=1fff9401-0348-463e-8a6f-62dfd21bdfc8&groupId=10129 (accessed on 26 May 2015).
  97. EquiMar Project Deliverables. Available online: http://www.equimar.org/equimar-project-deliverables.html (accessed on 26 May 2015).
  98. SOWFIA. Deliverable D 3.1. Inventory of Environmental Impact Monitoring Activities at Wave & Tidal Energy Sites in Europe. Available online: http://www.sowfia.eu/fileadmin/sowfia_docs/documents/D3.1_April12.pdf (accessed on 26 May 2015).
  99. Equimar. Protocols for wave and tidal resource assessment. Available online: http://www.equimar.org/equimar-project-deliverables.html (accessed on 26 May 2015).
  100. Zanuttigh, B.; Simcic, D.; Bagli, S.; Bozzeda, F.; Pietrantoni, L.; Zagonari, F.; Hoggart, S.; Nicholls, R.J. THESEUS decision support system for coastal risk management. Coastal Eng. 2014, 87, 218–239. Available online: http://dx.doi.org/10.1016/j.coastaleng.2013.11.013 (accessed on 26 May 2015). [Google Scholar] [CrossRef]

