
The Water Footprint of Data Centers

Center for Environmental Policy, Imperial College London, London SW7 1NA, UK
*
Author to whom correspondence should be addressed.
Sustainability 2015, 7(8), 11260-11284; https://doi.org/10.3390/su70811260
Submission received: 16 June 2015
/
Revised: 5 August 2015
/
Accepted: 12 August 2015
/
Published: 18 August 2015
(This article belongs to the Special Issue Water Footprints and Sustainable Water Allocation)
Abstract
:The internet and associated Information and Communications Technologies (ICT) are diffusing at an astounding pace. As data centers (DCs) proliferate to accommodate this rising demand, their environmental impacts grow too. While the energy efficiency of DCs has been researched extensively, their water footprint (WF) has so far received little to no attention. This article conducts a preliminary WF accounting for cooling and energy consumption in DCs. The WF of DCs is estimated to be between 1047 and 151,061 m3/TJ. Outbound DC data traffic generates a WF of 1–205 liters per gigabyte (roughly equal to the WF of 1 kg of tomatos at the higher end). It is found that, typically, energy consumption constitues by far the greatest share of DC WF, but the level of uncertainty associated with the WF of different energy sources used by DCs makes a comprehensive assessment of DCs’ water use efficiency very challenging. Much better understanding of DC WF is urgently needed if a meaningful evaluation of this rapidly spreading service technology is to be gleaned and response measures are to be put into effect.
1. Introduction
The world is experiencing an era of dramatic socio-technical change. The internet and associated information and communications technologies (ICT) have been diffusing at an astounding pace. In 2001, 8% of humanity was online, but by 2013, 38% were [1]. Not only is the Internet being adopted quickly, but global data traffic is rising at an exponential rate: 100 gigabytes/second (GB/s) in 2002, 2000 GB/s in 2007, and 28,875 GB/s in 2013 [2]. This change has been facilitated by a rapid deployment of data centers (DCs) to store, retrieve, and transmit information.
DCs have increased in number and sophistication, enabling the rapid adoption of Internet use and, more recently, the use of cloud-based services and mobile Internet access. DCs are amongst the most rapidly-growing electricity consumers. The installed base of servers worldwide has grown from just under 5 million in 1996, to 30 million in 2007 [3]. In the US, between 2013 and 2020 DC energy use is predicted to rise by 53% to 139 billion kilowatt-hours (kWh) [4].
Simultaneous to this information revolution, the world is also experiencing rapidly-rising environmental stress. Alongside the implications of climate change, many freshwater and other natural systems are losing the ability to maintain their ecological functions while simultaneously being compelled to service humanity’s growing needs. Such stresses are imposing new constraints on both public and private sector decision-making. These systems and the human systems for controling energy and water are highly inter-linked and exhibit reinforcing feedbacks. Using more energy increases the use of water, which in turn increases energy use even further [5]. Global energy use is set to rise by 35%–40% [6,7] and electricity by 70% by 2035 [8]. As a result, global water withdrawals for thermal electricity are set to rise by 40% [8] and water consumption by more than 100% by 2050 [9]. Globally, the energy sector will likely see an increase in the annual water footprint (WF) between 37% and 66% by 2035 with WF per unit energy produced rising between 5% and 10% [10]. In the United States and Europe, 50% and 43% of freshwater withdrawals respectively are used for cooling purposes in electricity generation [8]. Such rising demand means that energy and water consumers are in tight competition for resources. The spread of DCs and their growing energy use compete alongside the established players.
Worldwide, DCs accounted for 1.1%–1.5% of all electricity use in 2010 [11]. ICT end-user-equipment and infrastructure accounted for 7.7% of the total EU-27 electricity use in 2011 [12]. DCs and telecommunication networks themselves accounted for 1.9% of electricity consumption, but this is set to rise 35% between 2011 and 2020, with the the ICT sector serving as the greatest driver for electricity consumption growth [12]. This rise in DC electricity consumption, coupled with concerns about energy systems’ greenhouse gas emissions, has promoted interest in their energy efficiency. DCs can reduce energy use in the broader economy enough to offset their own energy use [13]. The application of ICT-based efficiency applications in other sectors, as well as the dematerialization of economic activity through the application of ICT, will deliver reductions in the EU’s net energy consumption even under business-as-usual scenarios without a push for ICT-based efficiency [14]. Without such a push, however, ICT may not have a positive effect on net CO2 emissions [14].
Reviewing the literature on DC energy efficiency, Koomey [11] finds the rapid diffusion of volume servers to be the main driver of DC electricity use. He argues that while large DCs can reap the greatest efficiencies, measures applied to the servers themselves have the greatest efficiency improvement potential because most DCs are still small and medium sized. Additionally, the growth rate of DC electricity use had slowed to 56% in the 2005–2010 period, relative to the 2000–2005 period which saw a doubling [11]. Koomey finds that this drop was mainly due to lower-than-expected installed server base as opposed to energy efficiency improvements. These points highlight the role of server manufacturers and other suppliers in reducing DC environmental footprints on top of innovations by DC operators themselves. Studies of particular interest in this area are the lifecycle assessments of data centres, which broadly indicate that electricity production forms the major part of DC impacts [15,16]. A series of studies also consider the cooling technologies applied and their impacts [17,18,19].
In the context of reducing DC carbon emissions, Masanet et al. [20] developed a formal model for determining DC electricity demand. They identified characteristics of low-carbon DCs, providing insight into the factors driving DC carbon performance which revolve mainly around energy efficiency. This is one among several publications dealing with the carbon emissions or renewables in relation to DCs. In particular, the literature is rich with new algorithms for optimizing workload distribution among data centres [21,22,23,24,25,26,27,28,29] and server electricity demand optimization [30,31]. Some publications have also highlighted the role of geographic location or siting in carbon emissions and energy use optimization [32,33,34].
Carbon emissions are only one form of environmental impact. Ignoring the impacts of DCs on water resources could lead to the partial displacement of impacts from the climate to water. Such a dynamic can take place when shifting from non-renewable to renewable energy sources [35]. Evaluating different energy sources along multiple criteria of environmental footprint, Hadian and Madani [35] find that even if an energy technology has a low carbon footprint, it cannot be considered “green” or “sustainable” unless its other footprints (i.e., water and land use footprints), together with cost, compare favourably to other energy technologies. Assessing the sustainability of DCs should take a similar approach. Namely, evaluating multiple criteria, in order to give a better understanding of the trade-offs involved with siting and cooling technology. Without a comprehensive assessment of the water impacts of energy soruces, our understanding of the resource use efficiency of DCs remains incomplete.
Even in terms of energy efficiency, much work remains to be done. The EU Commission’s Joint Research Center reported that within the EU, DCs are subject to only six “Green ICT” measures (one mandatory) which they see as inadequate [12]. 31% of data-center-related companies report on their water usage while 21% report on CO2 emissions [36]. Global Reporting Initiative data indicate that in the computer, as well as in the telecommunications, sector 64% report on water withdrawals by source [37]. Very few however report on total water discharge, recycling rates, waters affected by discharge, runoff or withdrawal, and associated biodiversity impacts [37]. Reporting will have to increase and be comminucated more widely for a better understanding of not just DC energy efficiency, but their overall environmental footprint and sustainability.
In terms of the water efficiency of DCs, very little has been published. Even the extremely detailed handbooks on cooling technologies published by the American Society of Heating, Refrigeration, and Air-Conditioning Engineers (ASHRAE), give very little guidance on water efficiency in DC cooling systems. To the authors’ knowledge, the Hewlett-Packard’s (HP) Sustainable IT Ecosystem Laboratory was the first to publish work dealing directly with DCs’ impacts on water [38]. They consider the infrastructure, in particular the cooling systems’ water use, and opportunities for water savings through building design and different cooling solutions. They find that a 1 megawatt (MW) DC can consume 18,000 gallons (68 m3) of water a day for cooling and provide guidance on managing water-energy trade-offs. They also consider opportunities for electricity use reductions, focusing on the energy use of direct and indirect water usage [39]. In Bash et al. [40], as part of the ongoing work at HP, this method was incorporated into a broader “cloud sustainability dashboard”. Frachtenberg [41], building on previous work in thermal design and high-efficiency DCs, published on the engineering principles for reducing environmental footprint deployed in the Facebook’s Open Compute Project. Ren [42], building on the vast body of literature on load distribution algorithms, developed a “software approach” which highlighted non-structural (soft) engineering solutions for water use optimization. This came in the form of an algorithm distributing workload between DCs that minimizes electricity costs, maximizes renewables use, and maximizes water efficiency across different times and locations. The team at HP have also developed methods to combine supply- and demand-side optimization to address energy use, carbon emissions, and water consumption [43]. The Green Grid has published on the topic of water use in DCs and, of greatest import, has developed the Water Use Effectiveness (WUEsource) metric which takes the indirect form of water use arising from electricity use into account [44]. This will be explored in more detail alongside water footprint below.
To be able to understand the water impacts of DCs, consistent water metrics should be applied, otherwise comparisons are invalid [5]. While water metrics such as withdrawal, consumption, and footprint are commonly used for evaluating the impacts of different processes on water resources, the literature has failed to use them consistently, making the resulting values incomparable in many cases [5]. Water use is a generic term referring to the use of water resources in human processes. It can be quantified by the following metrics. “Water withdrawal” measures the total freshwater input into a process. “Water consumption” measures the volume of total water input that has become unavailable for reuse due to evaporative losses, incorporation into a product, or transfer to another catchment. Water withdrawals can affect the environment through reduced water availability but this is not necessarily the case, particularly when good quality water is returned to the environment quickly. Likewise, water consumption implies reduced water availability but does not capture the environmental impact of polluted (but not consumed) water being returned to the environment. To overcome these issues Water Footprint (WF) [45] can be used as a comprehensive metric [5,10].
WF measures the quantity of freshwater consumed and polluted and is divided into blue, green, and grey water footprint [41]. Blue footprint covers the volume of freshwater (surface or groundwater) consumed. Green footprint covers the volume of rainwater consumed—rainwater being water that does not become run-off at the field level. The grey footprint is an indicator of water pollution and is defined “as the volume of freshwater that is required to assimilate the load of pollutants given natural background concentrations and existing ambient water quality standards” [46]. Ideally, WF also covers the full lifecycle of a process capturing both the direct (on-site) and indirect form of WF [46]. As such, WF offers the most comprehensive scoping of the measurement of impacts on water resources out of the metrics considered, as well as avoiding the problems associated with only considering water withdrawals or consumption. However, WF has not yet been used for measuring the water impacts of DCs. Thus, the objective of this article is to address this gap in the literature.
WF has a well-systematized measurement methodology which includes water used for energy use on top of on-site water use, and is broadly accepted as the standard for water use accounting. This makes it a valuable metric for assessing trade-offs in the water use of different cooling systems, their performance in different climatic conditions, and the indirect WF of the energy sources which are here taken together to define the WF of DCs. Equipped with this understanding further research can begin compiling comparable data and benchmarks applicable to efforts at minimizing the environmental footprint of our information-heavy societies.
Below, the application of WF in the water use component of the WUE will be developed and the question of the units of DC WF will be discussed. This will be followed by a review of DC structure and the likely sources of WF for each component. Subsequently, generic issues in WF of electricity and WF of cooling technologies are considered, taking particular notice of WF uncertainties and associated trade-offs. Next, using reported energy source values, the WF range for Apple’s DCs is calculated. Then, the uncertainties in the WF of energy will be highlighted. These uncertainties make decisions on the cooling technology difficult in the context of a dataset on different cooling technologies for a DC in Phoenix, Arizona. As a penultimate step, taking the above-mentioned considerations into account, a rough calculation for the global average WUE of DCs as well as a WF per outbound GB is performed. Finally, caveats, trade-off management principles, and potential corporate and governmental policy responses to deliver DC WF sustainability innovations are discussed. Although sources of blue, green, and grey WF throughout the lifecycle and supply chain of a DC will be identified, this “first-step” study into the WF of DCs will largely be limited to direct consumptive blue WF and indirect consumptive blue WF because of data and comparability constraints.
2. Water Footprint for Measuring Water Use Efficiency
Emerging as the industry standard in measuring DC water use is Water Use Effectiveness (WUE), as developed by the Green Grid [44]. It is defined as the total facility water use divided by the energy going solely to the IT equipment. A higher WUE indicates a more water-intensive DC (IT equipment energy is a proxy measure for DCs’ product. More detail on why this is the case is given later in this section).
While WUE differs somewhat from the WF, WF can be used to inform the WUEs Total Facility Water Use. Using WF as a metric for water use is helpful, particularly for avoiding the limitations of “withdrawals” or “consumption” as metrics. The Green Grid guidance on measuring total facility water use in WUE calls for the inclusion of consumptive water use in humidification, cooling, and in the production of energy. WF can account for all of these while opening the possibility for a broader WF account which can include green and grey WF along the full life-cycle and supply chain. Unlike WF, WUE, explicitly, does not take into account the full lifecycle [44] but does come in a second form, which captures indirect water use:
The reason for truncating the supply chain in the WUE to just energy is two-fold: firstly, servers have extremely complex supply chains with producers rarely, if ever, measuring and disclosing water use. This makes it prohibitiveley difficult to find accurate and not-double-counted values for server components. Secondly, the supply chain usually encompasses the greatest part of the WF of any process [46]. Subsequently, indirect WF is important to consider since often simple adjustments in the supply chain can dramatically reduce WF. However, including the full supply chain, and not just the WF of source energy, would grow DC’s WF enormously and subsequently the differences in the design and operation of the DC would be, proportionally, much smaller as opposed to differences in supply [44]. Full life-cycle and supply chain WF helpfully indicate how to supply DC water conscientiously.
In respect of the operation of DCs, a narrowed scope can however be more helpful. The point here, as with the units of measurement discussed below, is that different measures provide different information useful in different contexts. Confusion between these measures should be avoided by clear scoping. This study will focus on direct WF in cooling technology and indirect WF from energy use, in order to be applicable to WUE while indicating how WF could expand the remit of WUE.
WF is always expressed as a volume of water over some unit, such as number of products, quantity of energy, or time [46]. The question of which units will be used to express the WF of DCs is not immediately answerable since the product of DCs is debatable. Arguably, DCs offer information and communication services, as evidenced by Service Level Agreements or Quality of Service agreements (contracts many data centres sign with customers) [47,48,49,50].
This topic has been helpfully addressed by an international taskforce dealing with this question in the context of energy and greenhouse gas efficiency [51]. In defining DC energy productivity it recommends following the example set by the Green Grid: “useful work that a DC produces based on the amount of energy it consumes. ‘Useful work’ is a sum of tasks that are completed in a specified period of time, where each task is weighted based on a specified relative value” [51]. While the taskforce recommends that DCs self-assess what counts as useful work and what the relative weightings of different tasks are, it also provides guidance on proxy measures. Three proxy measures identified by the taskforce as particularly promising are:
- Network traffic (bits) per kilowatt-hour: Outbound bits/DC energy use
- Weighted CPU utilization: (SPECint_rate × CPU utilization)/DC energy use
- IT equipment energy efficiency (ITEE) × IT equipment utilization (ITEU): (Benchmark performance/rated power) × (IT energy/IT rated energy) [52]
Weighted CPU utilization gives another measure of the effectiveness of the IT equipment, but is based on a test of certain parts of the IT equipment as maintained by the Standard Performance Evaluation Corporation (SPEC). A set of programs are run on the servers and the speed at which they are run is measured. This value measures the amount of useful work that can be done by the IT equipment. Multiplied by the ratio of IT equipment actually used, this gives a sense of how much useful work is being done.
The ITEE × ITEU measures the IT equipment’s energy efficiency multiplied by the utilization of the IT equipment. Rated power and rated energy simply mean the capacity of the equipment as given by the producer on the equipment specification.
The metrics from the international taskforce mentioned above, could be converted into use for a WF. In such a case WF could be expressed as:
The ITEE × ITEU could not be converted in the same way because IT equipment is not rated for water use as the IT equipment itself does not directly use water. While future studies could use these units, they do entail serious challenges as values for bits and SPECint_rate are rarely readily available.
Therefore, a simpler, less data-limited, method for approximating the useful work done in a DC is power use effectiveness (PUE), as developed by the Green Grid [44]. In this metric, work done is represented simply by the electricity going to the IT equipment. This metric is much more readily available and more useful if one does not want to exhaustively determine how efficient the IT equipment and software itself is but rather how efficient the surrounding DC infrastructure is; including heating, ventilation, and air conditioning (HVAC). Here DC operators have more control and can deliver environmental innovation more readily.
Clearly, the question of the denominator of the WF is a challenging one. As with WF scoping above, it is wise to deploy different measures for different research objectives. Overall, however, it can be seen that WF can be used easily in WUE as a good measure of total facility water use. Clearly, WF is also compatible with IT equipment energy use as a proxy for useful work done. Later, values for DC WF will be expressed in the above formulae (i.e., WF and WUE) and units (i.e., per IT energy used and per outbound bits).
3. Data Center Structure and Water Footprint of Its Components
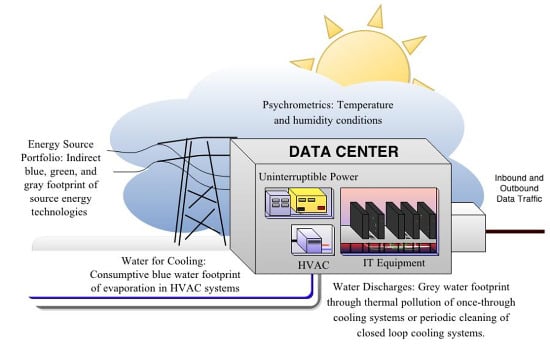
Figure 1 depicts a schematic of the components of a typical DC. It highlights some of the key drivers of DC WF which are elaborated below: IT equipment; heating, ventilation, and air conditioning (HVAC) systems; climatic conditions (psychrometrics); uninterruptible power supply equipment; and the energy source portfolio. After a brief overview of each component’s function and typical mechanism for generating water footprint, a more detailed review of uncertainties involved in the WF of energy use and HVAC systems follows.
Figure 1.
DC components and DC WF drivers: HVAC, Climate, and Energy Sources.

3.1. IT Equipment and Uniterruptible Power Supply
IT equipment covers a DC’s servers and communications equipment. Servers store and process data while the communications equipment sends and receives it. This component is “mission-critical”, meaning that proper functioning must be absolutely guaranteed. A serious failure of the IT equipment could entirely halt businesses reliant on data traffic (e.g., a bank that could no longer process financial transactions). Such a failure would most likely mean that the data centre has violated its contracts with its customers and, hence, would be obliged to pay substantial penalties. DC operators seeking to deliver environmental-friendly innovations are then looking for ways to reduce the environmental footprint without placing continued service provision at risk.
IT equipment does not directly consume water. It does, however, directly consume electricity. In order to guarantee the continued supply of electricity (even in case of grid supply failure), DCs are typically equipped with uninterruptible power supply equipment. This includes a switch which immediately turns on backup generators. Uninterruptible power supply is also responsible for transforming grid electricity to a form applicable in the DC. Importantly, power conversion efficiency improvements can play an important part of reducing electricity use and, hence, indirect WF.
During operation, IT equipment releases a lot of waste heat which, if not removed, will accumulate and cause the IT equipment to overheat and break down. The high cooling load for a DC can be between five and 10 times that of a office or a meeting room [52]. Greenberg et al.’s study of energy use in 22 DCs shows great variation in DC energy use going to HVAC, servers, and other functions, with IT equipment typically accounting for the largest share of energy use. HVAC is in second place, followed by conversion efficiency in power supply [53]. No definitive values exist due to the lack of measurement and reporting but a typical ratio of total facility energy use over IT equipment energy use is around 2 [54]. This means that IT equipment typically uses half of the energy going to the facility as a whole; the other half going to HVAC, power conversion losses, lighting, and other uses. As mentioned above, larger facilities often have better ratios.
3.2. Direct WF—HVAC
HVAC includes all the technologies monitoring and maintaining temperature and humidity within the DC at levels deemed appropriate to the functioning of the IT equipment. Temperature affects the efficiency of IT equipment components and can cause overheating. Low humidity can cause static buildup and sparks, while high humidity can cause dew to collect on and disrupt circuits. ASHRAE gives the following guidance on appropriate temperature and humidity (psychrometric conditions) for IT equipment: “a temperature range of 18–27 °C (64–81 °F), a dew point range of 5–15 °C (41–59 °F), and a maximum relative humidity of 60% for DC environments” [55]. ASHRAE also provides looser, “allowable” ranges and is encouraging DC operators to consider operating in less stringent conditions to save energy and reduce environmental footprints. This is one of the more convenient innovations to implement for DC operators seeking to reduce environmental footprints.
In order to achieve these conditions HVAC systems use many varied components but typically they employ a vapor-compression cycle and have three key components: the chiller, coolant loop (cycling water or a refrigerant), and airflow control (how cool air is distributed to the IT equipment) [44,55,56]. The vapor-compression cycle uses the thermal dynamics of coolant vaporization to extract heat from one place and compression to release it in another. When pressurizing the coolant, it releases heat and when vaporizing, it absorbs it.
The chiller includes the main components used to facilitate this process. Compressors pressurise the coolant. Condensers remove the heat the coolant releases using water and/or ambient air. Flow control mechanisms ensure the correct pressures in different parts of the cycle. In evaporators the coolant vaporization absorbs heat from air which is then distributed to the IT equipment by the airflow control (the fans, ducts, false-floor, convection currents in the room with the IT equipment, or otherwise). Thereby, the IT equipment is kept from overheating [56].
As mentioned, condensers can be cooled by air or water. This distinction is important to consider in the context of WF. Broadly speaking, water-cooled condensers are less energy intensive as water can cool the condensers more effectively than air [57,58]. For example, a Pacific Gas and Electric (PG&E) Co. study found that in a typical 100,000 m2 building in California, air-cooled condensers used 440,000 kWh while water-cooled condensers used only 190,000 kWh per year [59]. The question of whether air- or water-cooled condensers have a lower water use is addressed in more detail in [59] and in the example from Phoenix towards the end of this paper.
In dry conditions, HVAC systems can also employ evaporative cooling, where raising the humidity of air lowers the temperature. Although, in general, there are evaporative losses whenever water is used (e.g., water-cooled condensers evaporate some of the coolant in cooling towers to improve cooling), evaporative cooling is a key driver of blue WF. HVAC systems also generate grey WF through water pollution via expelling hot water to the environment if they are once-through cooling systems without a cooling pond and through the discharges of dirty water for cleaning and replacing water in the coolant loop. For more detail on the chemical use in HVAC systems refer to [57] whose values could be used to determine grey WF. As mentioned in the introduction, grey WF is not addressed here beyond indicating the need to study it further. Finally, but very importantly, HVAC systems also generate indirect WF through the electricity they consume for compressors, sensors, and control systems.
3.3. Psychrometrics: Temperature and Humidity
Psychrometrics examines the physical and thermal characteristics of mixtures of gas and vapor. In the context of DCs it is useful in managing the relationships between air temperature and humidity. A greater deviation in the DC’s environment from the standards necessary for the IT equipment means that the HVAC has more temperature and humidity control to do. That greater workload generates a greater WF through the evaporation of water and/or the consumption of electricity (indirect WF). ASHRAE [56] offers detailed understandings of the relation between climate and cooling and the Green Grid provides geographic maps of where free cooling and air-side economization can serve as an effective cooling option [57]. In air-side economization, the returning, warm coolant is first passed through a condenser exposed to outside air before being cooled further. In free cooling, outside air is filtered and directly used to cool the IT equipment. This is already prevalent in approximately 50% of DCs in the United States [60]. While the Green Grid’s maps are a useful tool, they should also be subject to the uncertainties arising from climate change. This is important particularly when siting and designing DCs which are expected to be operational for many decades.
Metzger et al. [61] conduct a bin analysis of four cooling technologies (individually and in combination with others) by their climate appropriateness and energy use reduction as compared to just a typical direct exapansion (DX) air-conditioning. While that study focused on energy reductions as indicators of efficiency, varying WF between these technological options should also be considered. The uncertainties involved in this are discussed in an example later in this paper.
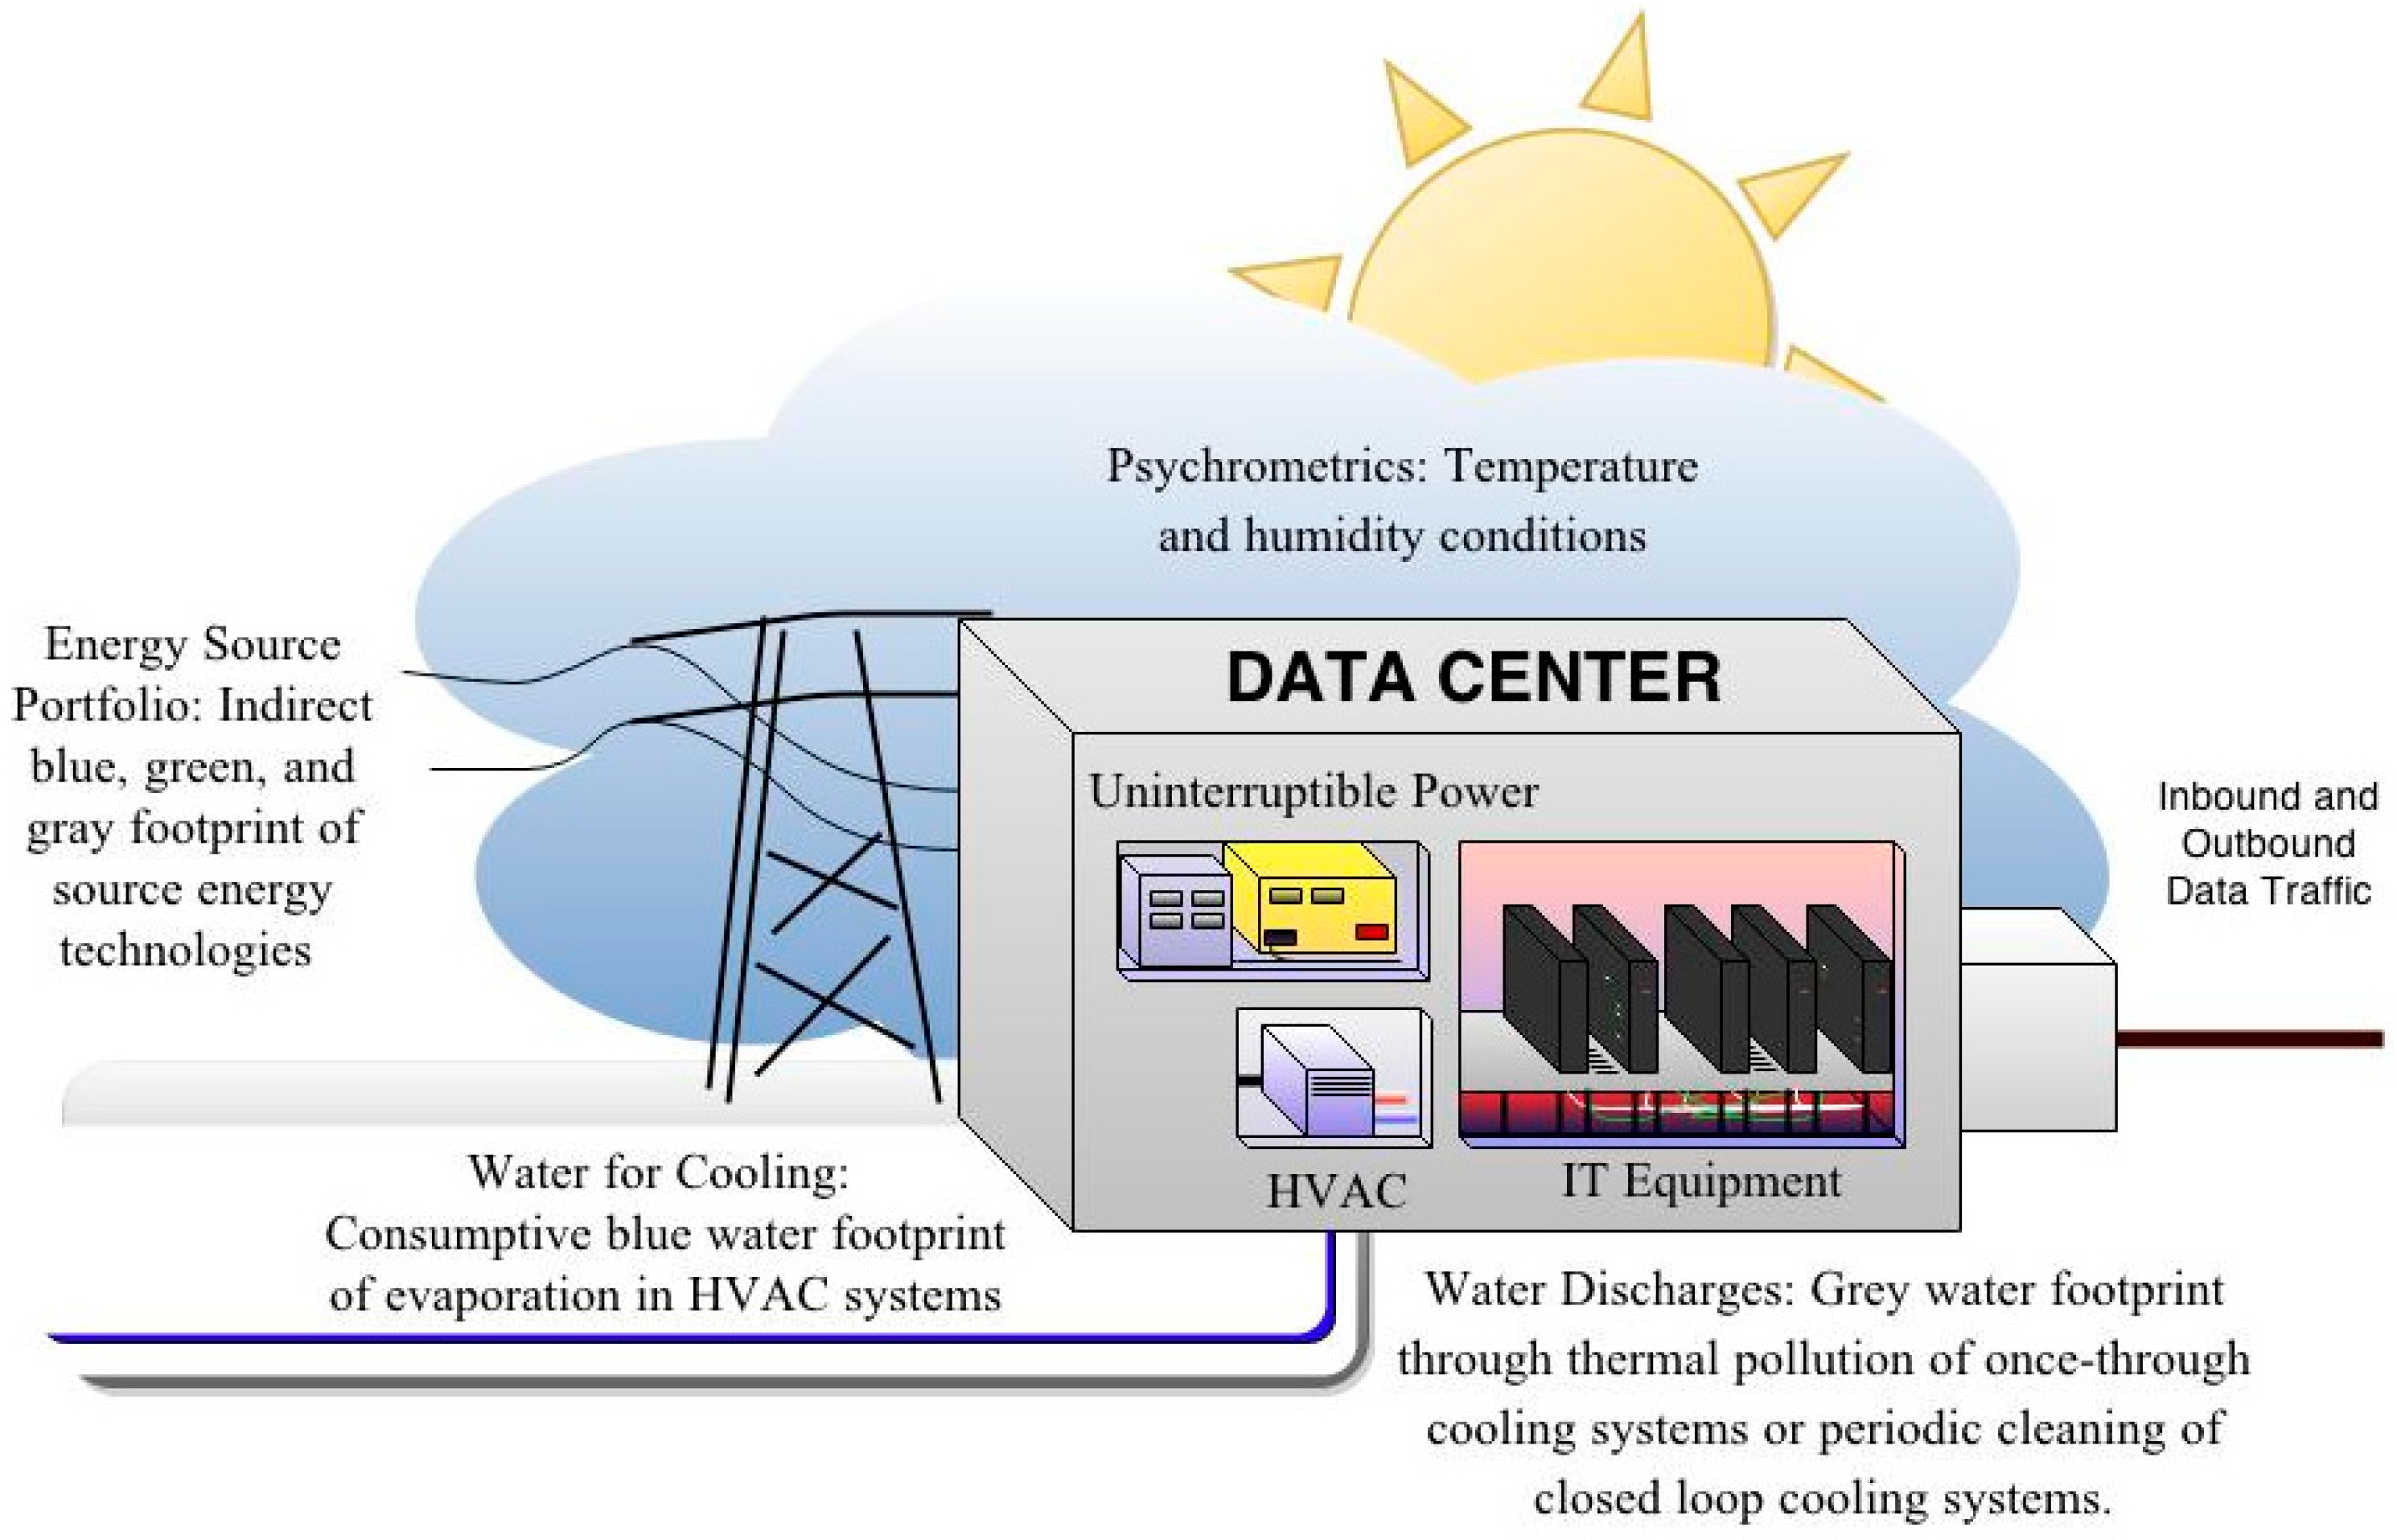
The technology options in the Metzger et al. study are: (1) direct expansion (DX): typically an off-the-shelf Computer Room Air Conditioning (CRAC) unit; (2) air-side economizer: outside air is used for cooling after treatment for air quality and humidity; (3) direct evaporative cooling: evaporation into air lowers its temperature; and (4) multistage indirect evaporative cooling: two cooling systems are connected to deliver cooling and humidity control. Seven combinations of these technologies are identified, defining seven cooling strategies. In Figure 2, the zones identifying under which temperature and humidity each cooling strategy is effective are mapped onto the psychrometric chart. In the middle of the chart is the ASHRAE recommended environment for IT equipment.
Figure 2.
Psychrometric chart displaying bin zones for the recommended envelope and alternative cooling strategies (after [61]). The blue zone represents the ASHRAE “recommended” temperature and humidity for IT equipment. The psychrometric chart is taken from [62].

For environments with >80% relative humidity and >15 °C dewpoint, DX is still the best option. With >15 °C dewpoint and <80% relative humidity, adding multistage indirect evaporation can reduce energy consumption. In environments with the ASHRAE recommended absolute humidity but below recommended temperature, air-side economizers can deliver the required cooling by themselves with great reductions in energy use. At a lower humidity ratio, an evaporative cooler should be used in combination with air economizers. For 5.5–15 °C wet-bulb temperature at lower than recommended relative humidity the evaporative cooler can deliver recommended air conditioning alone by the cooling effect of directly evaporating water into the air. Finally for >15 °C wet-bulb temperature and <15 °C dew point the multistage indirect evaporation alone will reduce energy use because it can reduce temperature without changing the humidity.
3.4. Indirect WF—Energy Source
Energy consumed by DCs during operation, is a key driver of DC WF. Determining the WF of the energy consumed by DCs (WFsource) can be done by determining the WF of each energy source in the electricity generation portfolio and then calculating a portfolio-share weighted average to get a a WF per unit of electricity supplied. The WFsource is then multiplied by the amount of energy used to get the WF of energy used.
where n is the number of energy sources in the energy supply portfiolio, WFEi is WF per unit of energy produced by energy technology i, and TSi is the percentage share of energy technology i in the total electricity supplied.
The energy source portfolio therefore determines the WF for the electricity used in the DC. This means that to reduce WF, DC can look for energy sources with a low WF as well as improving energy use efficiency, which reduces the amount of energy used in a DC and thereby also the indirect WF.
The most common electrical components of a DC and their relation to energy efficiency are reviewed in depth in Report to Congress on Server and DC Energy Efficiency [13] among many other publications dealing with this [13,44,53,63]. According to Miller [64], typical measures for reducing electricity are to: reduce power conversion efficiency losses, optimize airflow, economize on outside air, relax temperature and humidity standards, and centralize controls and sensors. Further energy efficiency measures for DCs are given by the Green Grid [57], US Department of Energy [65], and Environmental Protection Agency [66].
Regarding green WF, DCs typically do not interact with rainwater (green WF). That being said, it is worth briefly noting that large facilities may have substantial outdoor areas on campus which may generate green WF. Apple reports on changes in landscaping at one of their campuses which reduces green WF [67]. While the method for calculating the water footprint of DC energy source is relatively simple, large uncertainties remain in practice which are addressed in the section below.
4. Uncertainty Ranges in Determining the Water Footprint of Source Energy
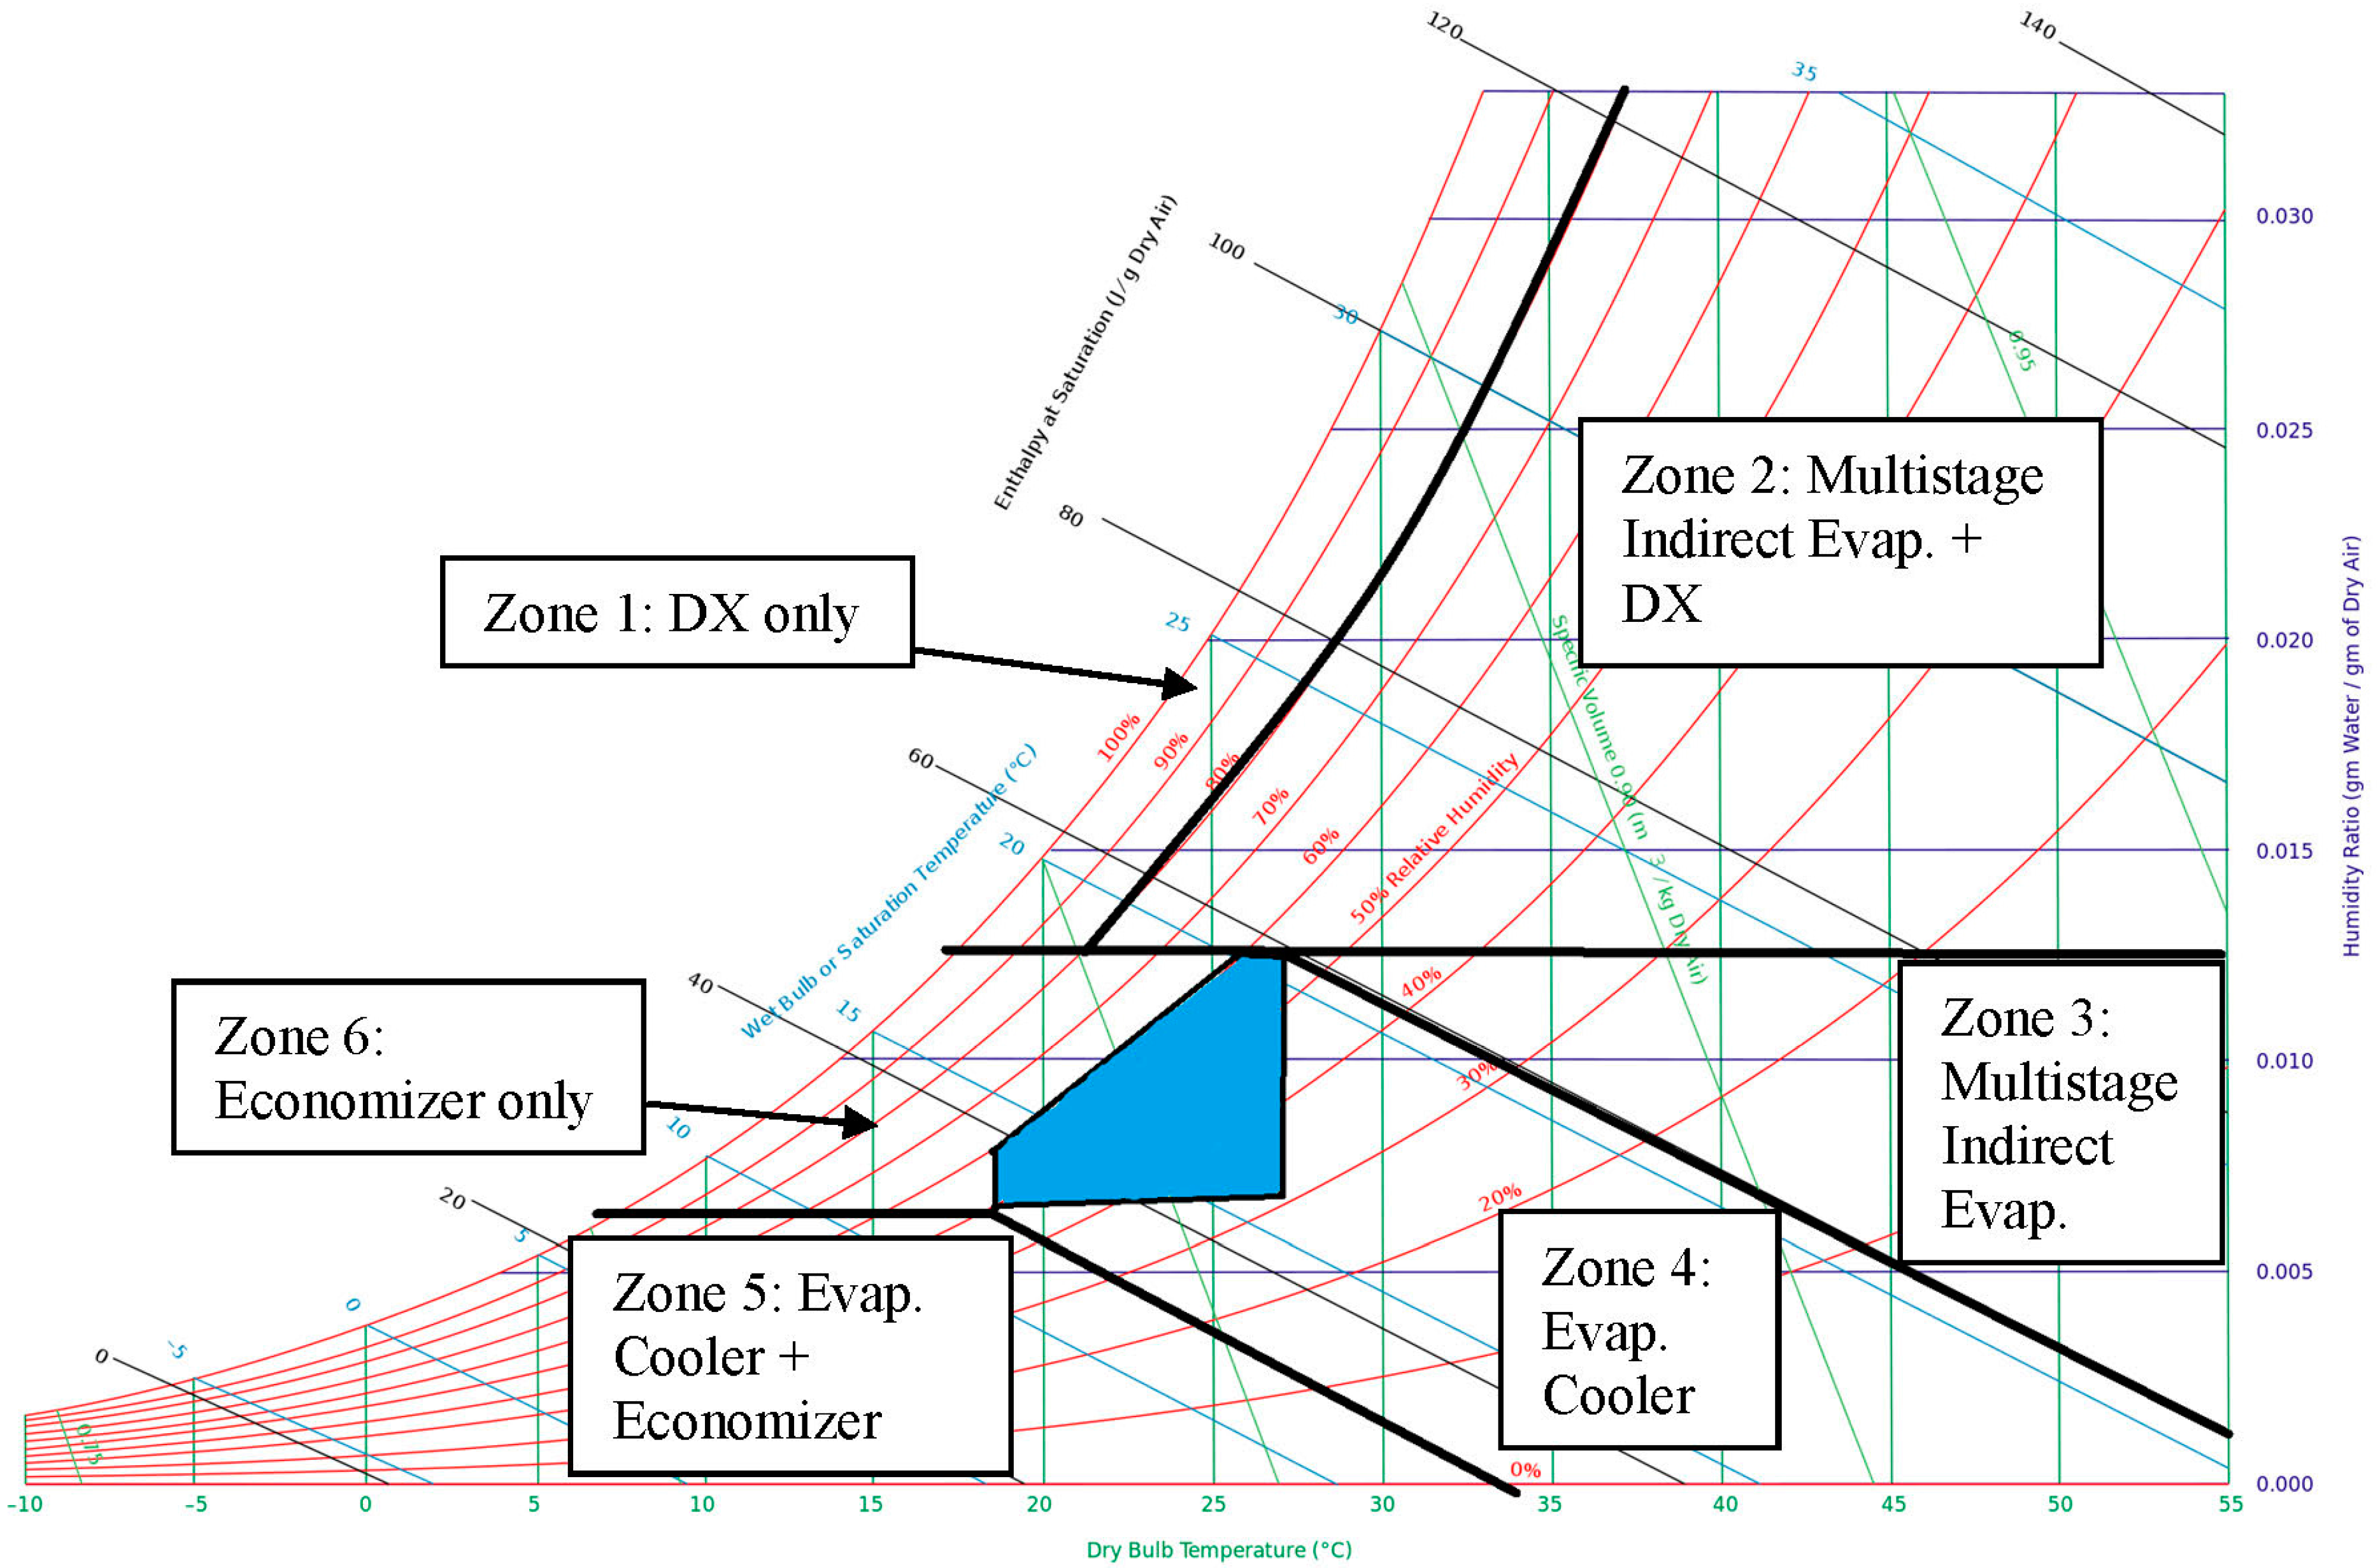
Figure 3 depicts WF per unit of electricity output as sorted by the range minimum [68]. The values reflect consumptive blue WF for fuel supply, construction, and operation.
Wind is clearly the least water intensive, and firewood and hydropower the most intensive. However, large ranges (Figure 3) in most other technologies indicate large uncertainty and variability. Therefore, understanding the particularities of each case of a technology is required for accurate WFE accounting. For example, all technologies except wind, photovoltaic, and firewood include 1000 m3·TJe−1 as a value in the range. It is likely that method of operation, its efficiency, location, regulatory and psychrometric setting, or other factors could at times overtake the energy technology itself as dominant drivers of WFE. The overlap between nuclear and many fossil fuels could be explained by the common reliance on steam turbines and associated uses of water. It is then possible that the steam turbine system’s WF is a greater driver of the energy generation technologies WF than the feedstock (e.g., coal or nuclear). Some further division and granular analysis of the dominant technologies employed per electricity type and their accompanying WFs would be helpful. It is also important to note that these values are the most up to date, but do not reflect the full WF account, which would also include the green and grey WF. Slightly older values for the full water footprint of energy technologies can be found in [10].
Figure 3.
The consumptive WF per unit of electricity output for different energy sources for the total production chain of electricity (after [68]).
Figure 3.
The consumptive WF per unit of electricity output for different energy sources for the total production chain of electricity (after [68]).

That being said, WF must be assigned to each generation technology, but it is important that as much detail as possible is given for the particular energy supply facility. Without such specific information, uncertainty will propagate through the WF assessment making it more difficult to decide on optimal technology choices. To highlight this, the above ranges will be carried into the subsequent analyses, showing how these uncertainties make decision between WF reduction strategies difficult.
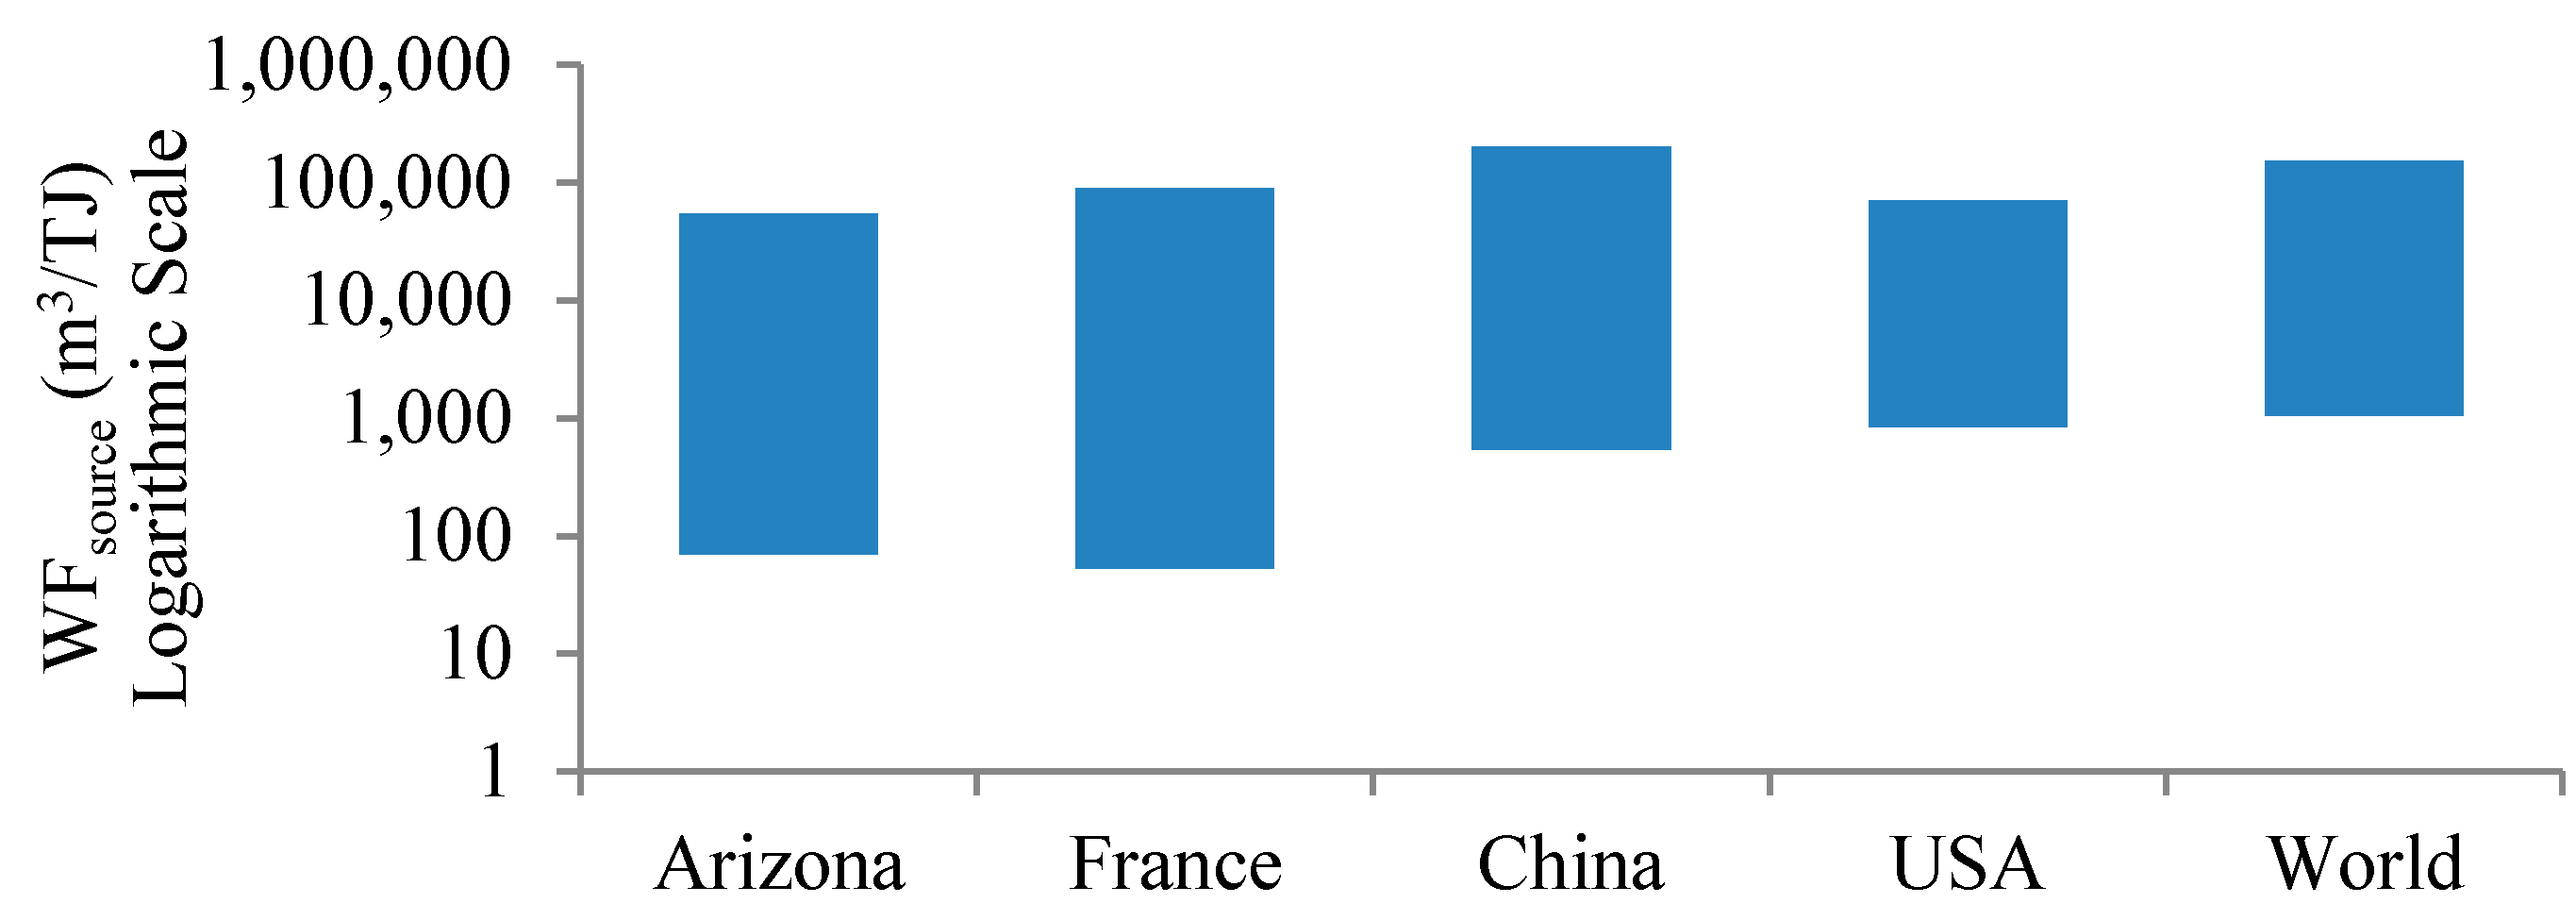
Other than for backup, most DC operators will not invest in their own electricity generation technology and will, therefore, simply purchase electricity from the grid. Figure 4 shows the estimated WF of electricity in a few sample regions around the world. The ranges have been calculated based on the technological mix in each country or area [6,69,70,71] with respect to the recent energy WF estimations of Mekonnen et al. [68] using the the WFsource equation. The figure therefore shows the WF of an average unit of electricity output to the grids in those areas. The WF of electricity varies by the mix of more and less water intensive electricity generation technologies and their associated uncertainty ranges. In particular, low-share, high-WF sources like biofuels and hydroenergy can drive WFsource disproportionately.
Figure 4.
Consumptive WF per unit of energy in different locations.

This relationship comes through particularly with the difference between the WFsource of France and the US. France relies much more on nuclear than the US. In the US, fossil fuels account for the majority of energy production. As seen above, nuclear’s range minimum is clearly below that of the fossil fuels. This allows France to enjoy a lower WFsource range minimum. However, France’s range maximum is well above that of the US. This could not be explained by the large share of nuclear, since nuclear’s range maximum is similar to that of the fossil fuels. France has a substantially larger share of energy coming from hydro than the US does. This drives France’s WFsource maximum well above that of the US.
Apple Inc., in operating its large DCs, provides an interesting case of DC operators adopting environmental innovations because it claims to be ambitiously pursuing environmental sustainability, including a zero carbon emissions policy, clean water programme, and others [69]. Apple has been building its own electricity generation capacities and reports a successful decarbonization of its DCs [69]. It also reports that the introduction of a new water reusing cooling system at the Maiden, North Carolina DC has reduced water consumption by 20%. Simultaneously, however, Apple reports it has seen a rise in water consumption in its DCs as a result of growing server room cooling load.
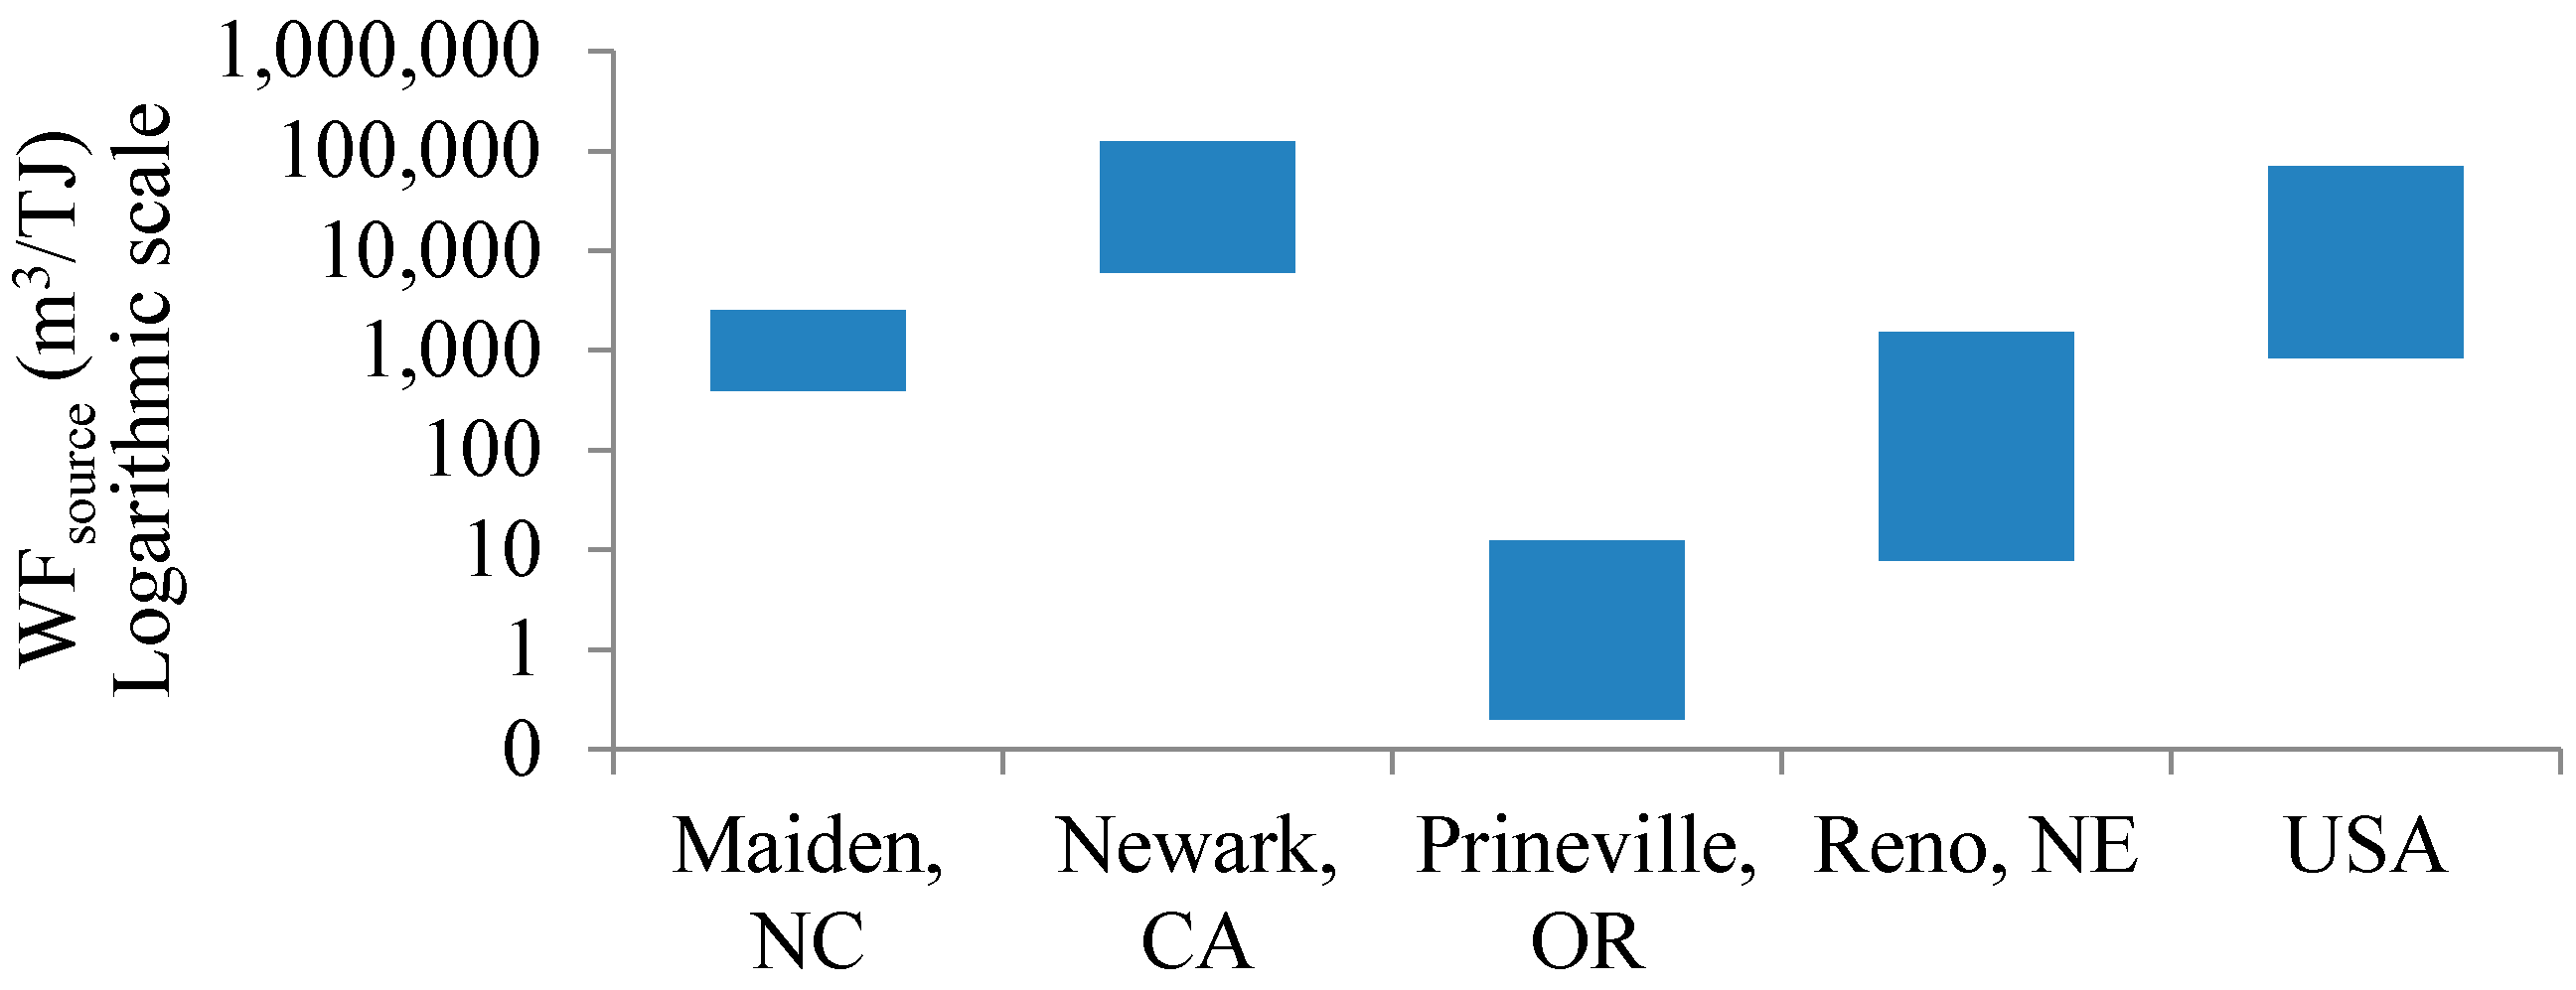
Figure 5 shows the calculated WFsource associated with Apple’s DCs based on their energy mixes as shown in Table 1. Apple facilities in Newark, Prineville, and Reno have a relatively low WF. The Newark facility still purchases all of its electricity from the grid. This is done through California’s Direct Access Program where consumers can buy renewable energy directly from generators. Although this means Apple can buy electricity to meet its zero carbon emissions policy, the exact electricity supply portfolio is not clear and so neither is the range of the WF. As a proxy, California’s renewables mix was used here to give a rough indication of what the values could be in this case [72]. The USA’s WFsource is replicated here to give a benchmark.
Figure 5.
WFsource for Apple’s DCs. Values are per unit of electricity as opposed to the total WF of electricity consumed annually.
Figure 5.
WFsource for Apple’s DCs. Values are per unit of electricity as opposed to the total WF of electricity consumed annually.


Table 1.
Apple Data Centers’ energy sources. Values are based on Apple’s 2014 Environmental Footprint Report [67].
| Location | Electricity (TJ/Year) | Biogas (from Landfill) | Solar | Grid Electricity | Wind | Geothermal |
|---|---|---|---|---|---|---|
| Maiden, North Carolina | 576 | 47% * | 53% | |||
| Newark, California | 443 | 100% ** | ||||
| Prineville, Oregon | 65 | 100% | ||||
| Reno, Nevada | 11 | 100% |
* WF of Biogas from landfill: 833.3–4166.6 m3/TJ [73], ** Apple reports that it purchases all electricity from renewable energy generators under California’s Direct Access Program.
In pursuing its zero carbon strategy and investing in its own generating capacity, Apple has reaped the co-benefit of reduced WF. This however, is not the case in Newark, if its electricity supply portfolio is the same as California’s renewables mix which has a substantial bioenergy share (11.5%). Therefore, the WF associated with that electricity comes out higher than the that for the US weighted average.
While the range for the Newark facility is already large, it does not include the uncertainties associated with the share of renewables in the energy mix. Retrospectively it is possible to fix the portfolio shares but these are not definite indicators of the future mix as it is subject to variablity in solar and wind energy supply, as well as the regulatory and policy uncertainty surrounding renewable energy.
To ascertain the total WF of electricity for each facility, the above WF of energy values would have to be multiplied by the amount of electricity each facility uses. This would still not yield the total WF of DC as the direct WF of each facility (particularly the WF of HVAC) would still have to be added. Uncertainties in that stage of the WF account are considered below for a DC in Phoenix, Arizona as an example.
4.1. Uncertain WFs of HVAC Systems
As discussed throughout, in order to understand the WF of DCs both direct and indirect WF should be taken into account. Thus, in addition to the indirect WF of DCs through energy use, one needs to quanitify the WF of different HVAC systems. This can be done by reviewing different HVAC systems’ energy use and WF in a given climate.
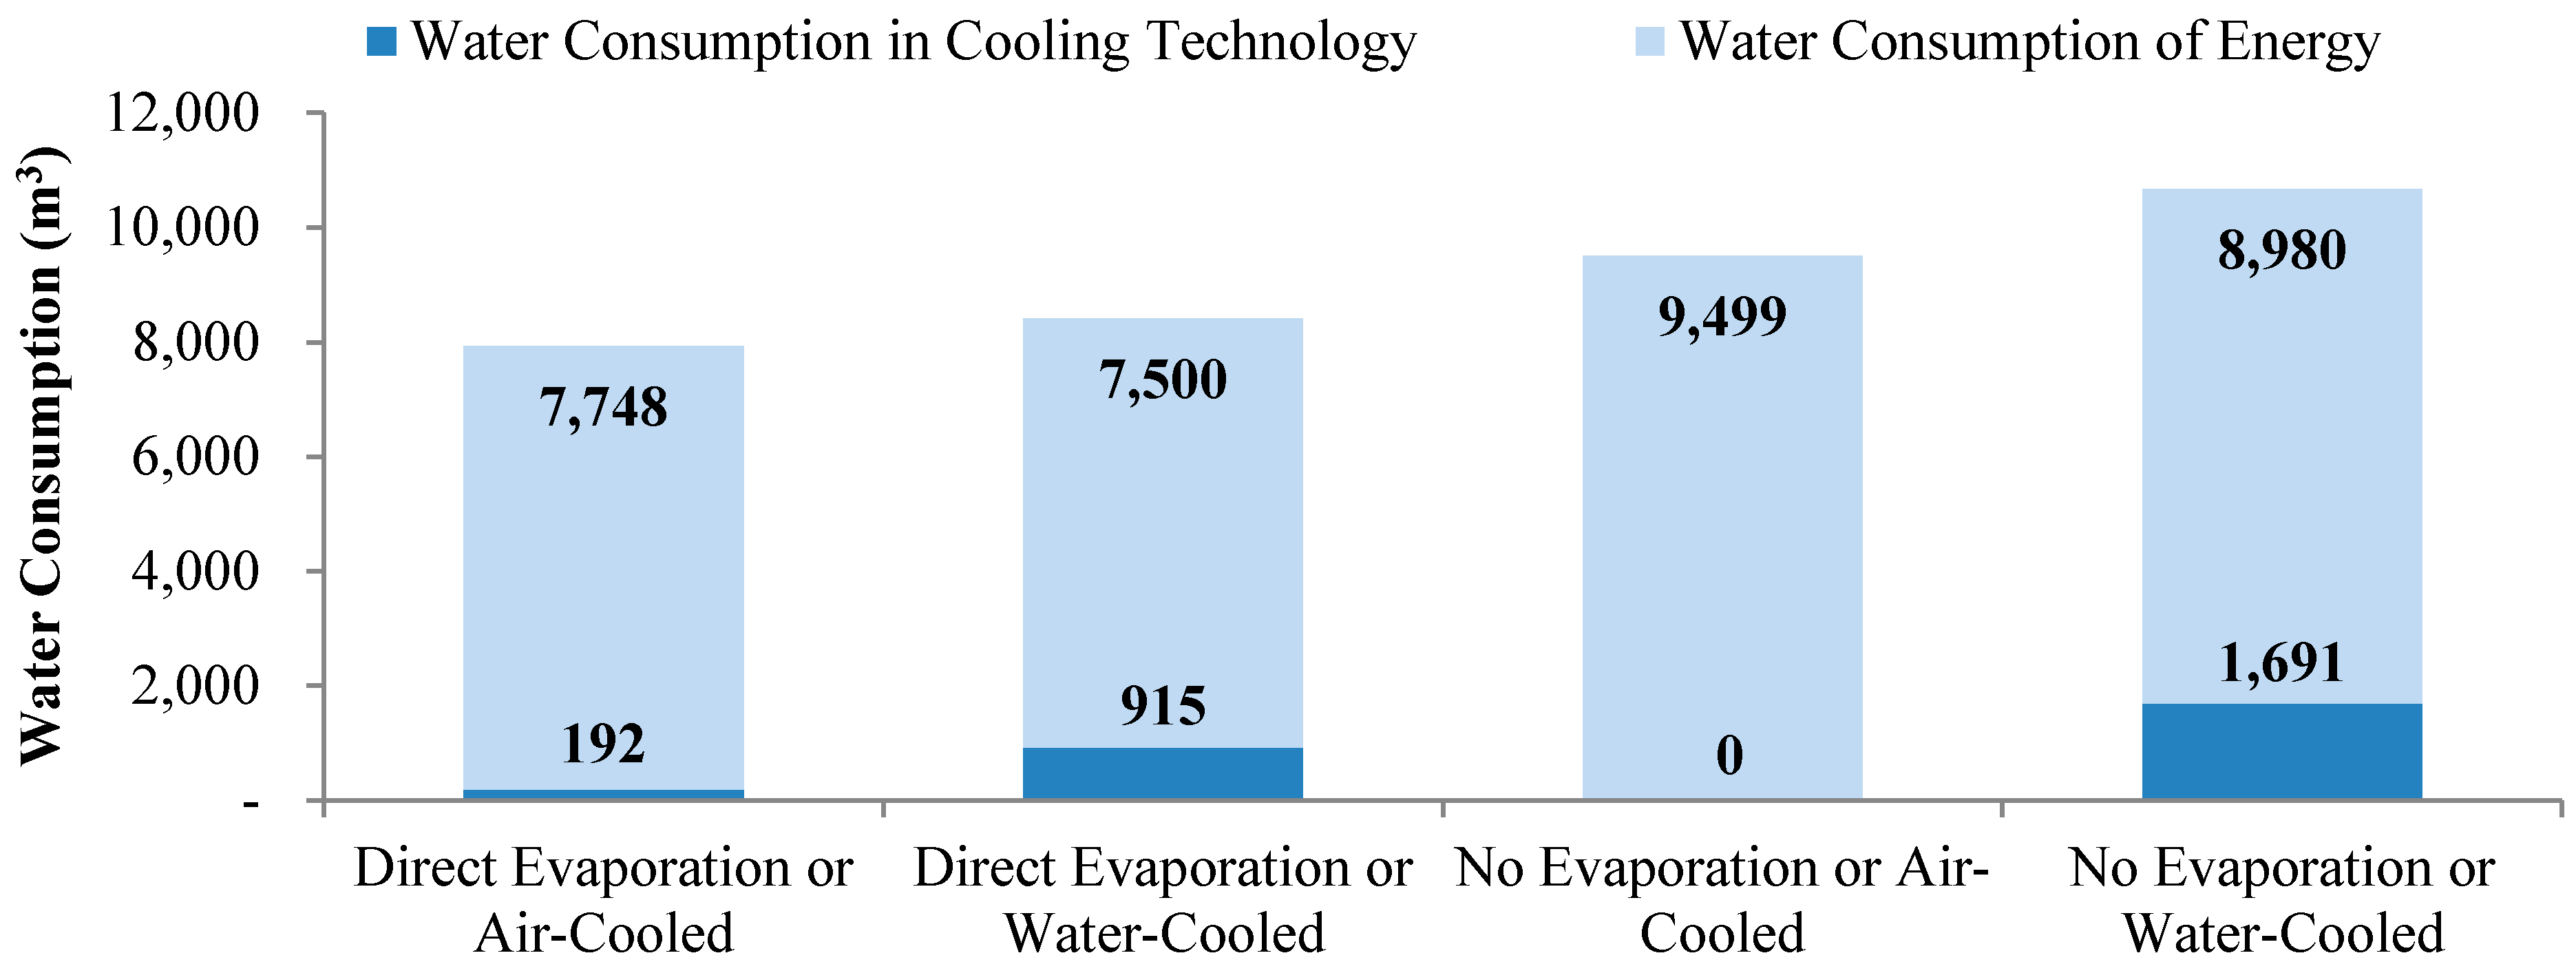
Figure 6 shows four different options for a DC cooling unit with a capacity of 36,000 cubic feet per minute (61,164 m3/min) operating on a DC in Phoenix, Arizona as compared by their direct and indirect WF. All options use outside air economization. They vary by two factors: (1) air- or water-cooled condersers and (2) direct evaporation or no evaporation. Direct evaporation is equivalent to the direct evaporative cooling option in Metzger et al. [61]. The third option, “no evaporation or air-cooled condenser” is essentially equivalent to the direct expansion option in the Metzger study. As expected from the Metzger et al. findings, the HVAC systems employing evaporative cooling use less electricity in the dry Arizona climate. Also, as expected, the water-cooled systems use less electricity.
Figure 6.
Annual water consumption of different cooling technologies in a DC cooling technology with a capacity of 61,164 m3/min, based on inlet supply temperature to servers of 27 °C in Phoenix, Arizona. (After Vokoun [74] who reports United Metals Products values. Vokoun uses National Renewable Energy Laboratory (NREL) figures for the water consumption for electricity production (8254 m3/TJ) [75]. Note that NREL is using only evaporative water consumption not WF).

When considering the values in Figure 6, some cooling systems appear to be less water intensive in terms of direct water consumption, but because of greater electricity demand, end up with greater total water consumption. In particular, while the “air cooled condensers/no evaporation” option has no direct WF, it requires significantly more electricity to achieve the same cooling. The WF of generating this additional electricity more than neutralizes the gains of not having a direct footprint. Thus, the ‘direct evaporation/air cooled condenser’ option has the lowest water consumption.
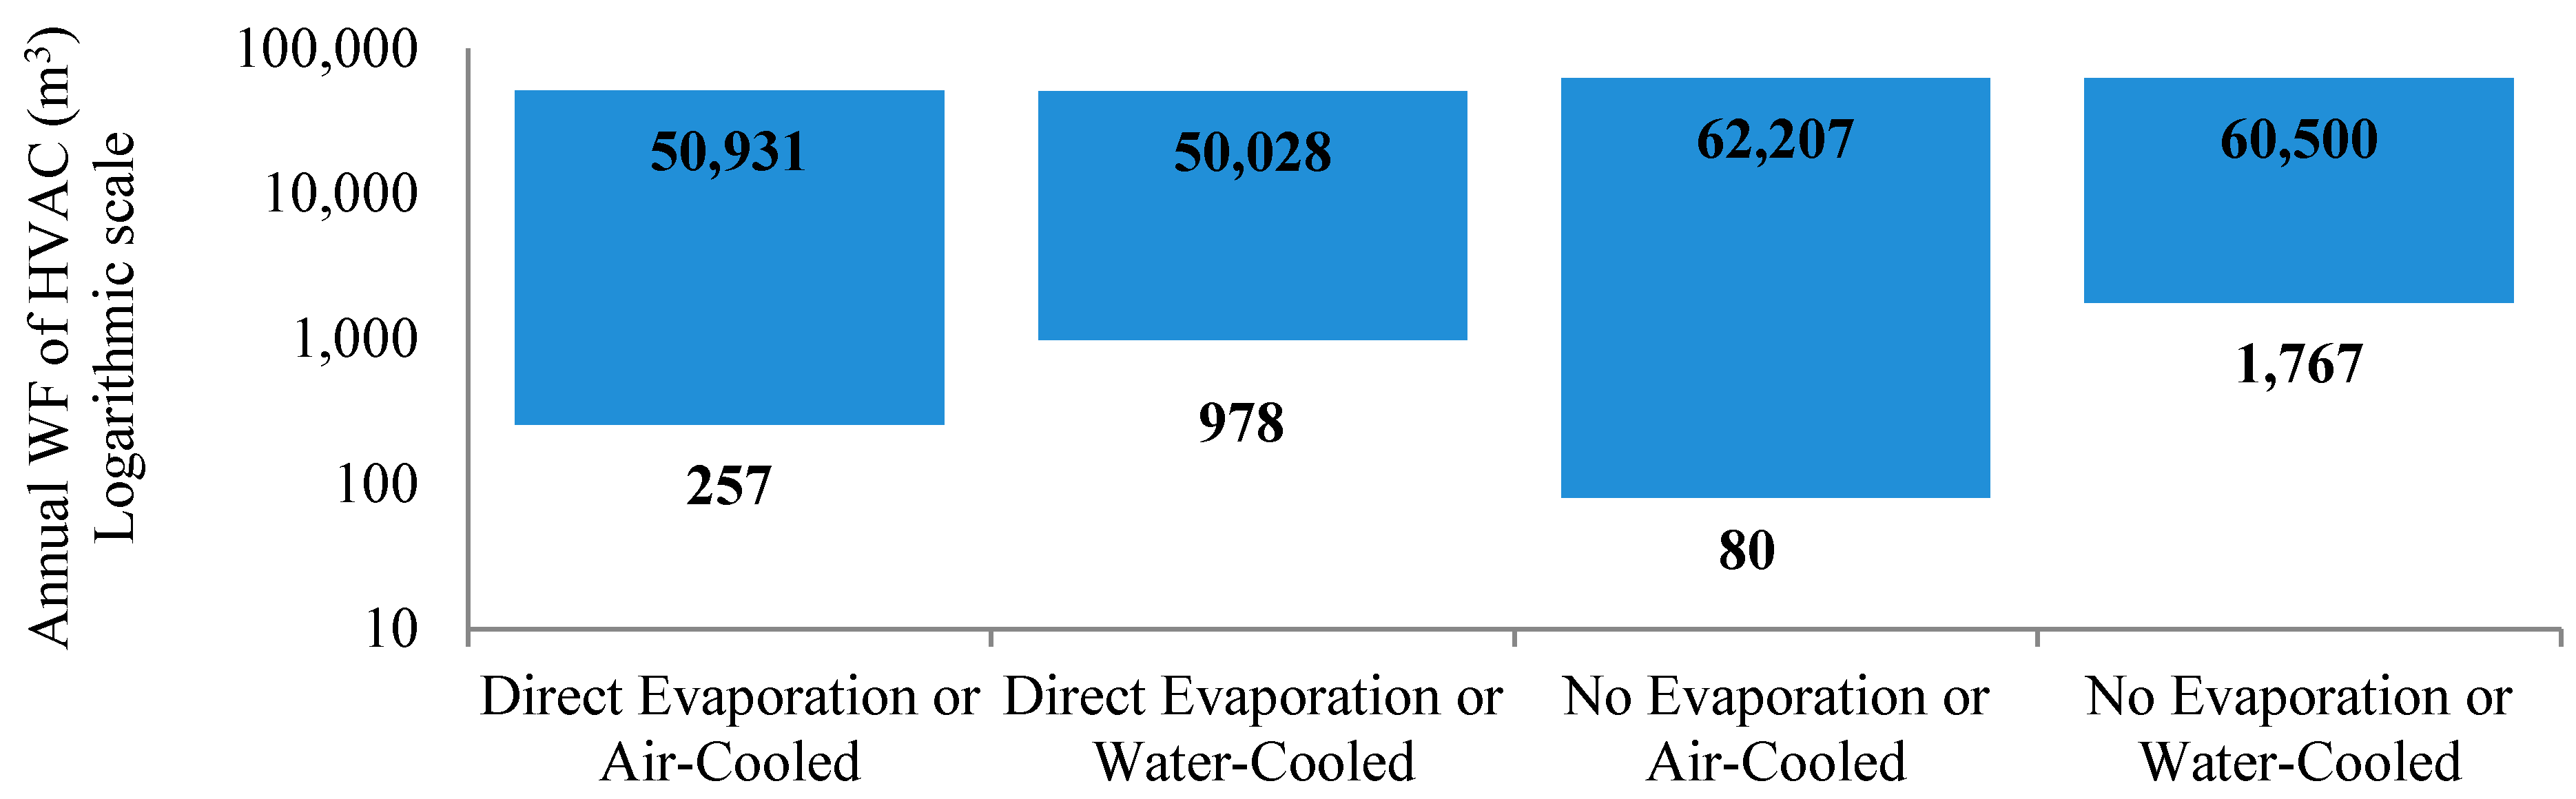
Figure 7 shows the annual WF of HVAC including direct and indirect WF as calculated with the WFsource range determined for Arizona above multiplied by the electricity consumption for the different HVAC options. At the low end of Arizona’s WFsource range (70 m3/TJ), the ‘no evaporation/air-cooled condenser’ comes out with the lowest footprint. This is despite the less efficient air-cooled condenser, and the lack of evaporative cooling (most appropriate to a dry climate) generating the greatest electricity use of all four options. At the high end (540,544 m3/TJ), “direct evaporation/water-cooled chiller” comes out with the lowest footprint. This runs counter to the result of the water consumption figures from NREL (8254 m3/TJ), where “direct evaporation/air-cooled condenser” came out best. These differences are indicative of the proportions in play. As the WF of electricity rises, the relative impact of electricity consumption over direct water consumption on WF rises. Subsequently, it becomes apparent that the uncertainty range involved in determining the WFsource hinders a definitive recommendation on which HVAC technology has the lowest total WF, hence which technologies can provide environmental innovations most readily.
Figure 7.
Annual WF of different HVAC systems. The direct water consumption values are taken from Vokoun [74] and added to Arizona WF of energy ranges from Figure 4.

The dataset from Vokoun used in these calculations has at least two important limitations. Firstly, the data comes from one firm (United Metal Products) [74]. The data are therefore dependant on that firm’s designs and are not necessarily representative of evaporative, air and water cooled chiller technologies in general. There is substantial variability between designs which is another source of uncertainty that must be acknowledged. Secondly, the above data do not include the grey water footprint that is associated with water cooling. This could again skew the HVAC system choice recommendation.
4.2. Water Footprint of Data Centres and Data Centre Outbound Traffic
This section provides a rough calculation of the WF of DCs. This is done by summing the WF of the energy consumed in DCs with the direct WF from HVAC systems.
To get the WF of total energy used by DCs, Koomey’s values for worldwide DC energy use in 2010 were applied (732,240–978,480 TJ/year) [11]. The range was multiplied by the WFsource range for the global average energy portfolio (1047–150,317 m3/TJ) as calculated for Figure 4. This gives the range 767–147,082 million cubic meters (mcm) for the annual WF of energy consumed by DCs. As a point of referance, the top end of the range is comparable with Italy’s WF of 130,000 mcm/year, and the bottom end of the range is comparable with the 650 mcm/year WF of the Bahamas [76].
Using Vokoun’s data on the water consumption in Arizona’s HVAC systems we can roughly calculate an uncertainty range for the WF of HVAC systems. This is done by dividing the HVAC water consumption by the HVAC electricity consumption. Given the electricity consumed by HVAC we can, thereby, establish a rough ratio between that and the direct WF of HVAC. This gives us a range of 0–1554 m3/TJ. Although, Sharma et al.’s [39] reported linear relationship of around 0.5 m3/TJ, for a water-cooled chiller it is compatible with this range, but it is at the very low end. This could imply that the distribution of values within the range are skewed towards the lower end.
To get the annual WF of DC HVAC systems, the above range is multiplied by the share of energy going to DC infrastructure annually in 2010 (as reported by Koomey: 331,200–468,720 TJ) [11]. This is an impefect metric as it includes lighting and other electricity uses in DCs but is used here as a rough proxy measure. This gives the range 0–728 (mcm) per annum for the direct WF of HVAC. This is a much smaller value than for the WF of DC energy use.
Added together the WF of HVAC and the WF of energy used in DCs gives us the range 767–147,810 mcm per annum for all the world’s DCs. Dividing this value by the useful work done by DCs will give us values comparable between DCs. Firstly, we can again divide by the total energy used in DCs thereby resulting in the WUEsource ranging from 1047 to 151,061 m3/TJ. Importantly, this value is much higher than the 787 m3/TJ reported by the Sharma et al. [38], and differs because of the use of WF accounting.
As discussed with regards to units of measurement, the range for annual WF of worldwide DC is divided by the outbound data traffic for which Cisco Systems, Inc. values were used [2]. Only 23.3% of all DC data traffic (3.1 zettabytes per year) actually goes to other DCs or to users giving us the value 722 exabytes (EB) outbound traffic per year in 2013. Dividing the above calculated values for annual DC WF gives us the range: 1–205 mcm/EB or liters per gigabyte of data sent out of DCs. The high end of the range is comparable to the WF of a kilogramme of tomatoes which is 214 litres [77], reflecting the high but overlooked water effects of data use and communcation.
5. Caveats for Policy and Innovation Recommendations
The three key uncertainties involved in determining the WF of DCs and recommending innovations towards reducing environmental footprint are: WF of electricity, psychrometrics, and WF of HVAC.
Due to the very high energy use in DCs, and broad tendency for IT equipment to use half or more of the total energy in a DC, indirect WF (WF of electricity) is typically much larger than direct WF. Therefore, the first focus for reducing DC WF should be on air-side economization and energy efficiency. Helpfully, this yields the important co-benefit of reduced operating costs going to electricity and reduced greenhouse gas emissions. If at least these three criteria are considered (i.e., cost, water, and carbon footprint), then DC innovation should remain strongly focused on energy efficiency. Also, given the possibility, investing in less water-intensive electricity generation technologies can dramatically reduce DC WF as seen in the case for Apple’s DCs.
Secondly, attention should be given to the choice of HVAC technology. Under high WFsource, HVACs with direct WF as opposed to those without any, can reduce total WF as seen in the case of the DC in Phoenix. On the other hand, under a very low WFsource, switching away from HVAC systems with direct WF can reduce DC WF. This technology decision, however, would have to be made with a more detailed understanding of the relative performances of different designs in different climates.
With regards to the WF values calculated for worldwide DCs above, the share of energy going to HVAC and the WF of HVAC remain very uncertain as specific values were not available. The proxy measure used was based on one simple dataset from one location. As such it should be interpreted very cautiously but does provide reaffirmation that the direct WF is relatively small compared to the WFsource. Consequently, the focus for WF reduction broadly remains on energy efficiency.
DC location choice can also greatly impact its WF. With regards to reducing WF, DC siting is subject to considerations of WFsource (if purchasing from grid) and psychrometric conditions in different possible locations. In this optimization, it is important to note that if a given amount of electricity is being bought from the grid, the WF of that electricity has a linear relationship with the total DC WF, assuming that the energy supply portfolio does not change by the amount of energy supplied. As in the case of Apple’s DCs, the total amount of energy used does not necessarily affect WFsource. However, this linearity will not necessarily hold when directly purchasing from generators. Relative prices or supply constraints from sources with a lower WF may make DCs buy a share of electricity from higher WF sources. The amount of energy used can affect the technology shares and, hence, WFsource. Thus, higher electricity consumption increases total WF which may be non-linearily greater because of the need to buy from energy sources with a higher WF.
Additionally, in considering siting, deviation from psychrometric conditions amenable to IT equipment is likely to display a non-linear relationship with the total WF. Such deviations imply not only changes in the amount of work needed to be done by HVAC (i.e., HVAC WF and energy consumption), but also the kinds of systems that can or must be deployed. This would be particuarly pronounced when crossing psychrometric envelopes in which free cooling with outside air is effective. Large DC operators such as Facebook, Google, and others therefore are building their new DCs in cold climates where outdoor air is most easily exploited [78,79,80]. As provided in the Green Grid and other sources, this psychrometric deviation is quantified by the average number of hours in a year where outside air has the psychrometric values appropriate to IT equipment cooling. Different locations have different frequency distributions for that number of hours and hence imply the possibility of non-linearity in the relationship between deviation of average psychrometric conditions and amount of energy and water used on HVAC. Possible siting trade-offs then include circumstances where an increase in WFsource at an alternative location may much more than offset the total WF increase by a much more air-side-economization-friendly climate. These difficulties in defining the relationships between the key uncertainties and DC WF make definitive decision-support difficult without the specific values which are generally challenging to come by.
For a given DC, the uncertainties are reducible when exploring specific options for the siting, design, and build stages of a DC. Once the operational phase has begun, reporting on a facility’s WF (and related carbon footprint and other environmental performance criteria) becomes possible with a reasonable degree of accuracy and can be validated by a third party should the desire to do so arise. Noting that site-specific uncertainty can be reduced, a number of corporate and regulatory/policy responses could reduce uncertainty for generic assessments, and boost innovation and best practice.
It is fundamental that firms collaborate in the development of leading industry standards such as the WUE. As a parallel activity, standardization, monitoring, and reporting templates for DC WF should be created. Currently, corporate sustainability frameworks, such as the Global Reporting Initiative (GRI) are not fit for purpose in this regard [37]. Standardized WF and WUE could be, summarily, introduced into the corresponding GRI methodology with a corresponding reporting template. This would improve knowledge of the water use in average DCs. It would also allow firms that rely upon DC service provision to select DC service suppliers by environmental performance, as well as cost and other metrics. Additionally, this would allow for the creation of a performance league table rewarding first mover advantage while calling attention to laggards, and enticing firms to improve performance.
More ambitiously, WF reduction methodologies and implementation solutions (including HVAC technologies, design solutions, and siting) could be built into the licensing or permitting frameworks for DCs. Implementing industry best practice in the form of “best available techniques (BAT)” is a standard feature of industrial installations throughout Europe in respect of how they are regulated under the Industrial Emissions Directive [81]. Though it is not suggested that DCs be regulated under this Directive, modest versions of BAT reference documents (BREFs) specifically designed for DCs would appear to be sensible given their growing contribution to energy and water resource use. Much of the content of BREFs would come from industry in any event as an exemplar of sectoral best practice.
6. Conclusions
Given the rising use of DCs coupled with rising environmental stress, substantially more attention should be paid to the WF of DCs. To do this, all three factors of WFsource, psychrometrics, and HVAC must be considered. In particular, more research and disclosure is needed to understand the relative performance of different DCs, the energy and water intensity of different HVAC technologies in different climates, and the water intensity of electricity generation. Large uncertainties remain in the quantification of the values necessary for addressing trade-offs involved in DC design, siting, and operation. These uncertainties also mean that the values determined in this paper should be considered with caution and are more indicative of the uncertainties involved than a definite quantitification of WF values. Building on the work done here, further research for determining WF of data traffic could develop interesting insights into the WF of the Internet and the associated virtual water flows.
In order for such values and understandings to develop, consistent metrics and methodologies need to be applied. WF offers a systematic approach for understanding the water impacts of DCs and can be applied in WUE and WUEsource. Different metrics yield different recommendations for reducing water footprint. When considering direct WF, the focus is on HVAC: evaporation for humidification and cooling, and the gray WF from heat pollution and chemical discharge. When we include the indirect WF, electricity use takes over as the biggest driver of DC WF. The focus then shifts to less water-intensive energy sources and boosting energy efficiency of both IT equipment as well as the facility more broadly. As seen in the comparison of different HVAC systems at a DC in Phoenix, systems which came out unfavourably when only considering direct WF can deliver a lower total WF when WFsource is included. Determining which HVAC system is the best requires a consideration of the psychrometry of the data center given its cooling needs, its (changing) climatic environment, and the energy and water performance of the HVAC systems.
Future studies in this area should seek to reduce the uncertainties surrounding the WF of electricity and provide a more systematic understanding of HVAC systems’ direct and indirect WF. Although, having considered other sources, this study has been limited to one simple dataset on different HVAC systems operating in Phoenix, because very little data can be found for the WF of DCs, or even HVAC systems, generally. More data for the water and energy performance of different HVAC systems in different climates would provide a better basis on which to develop trade-off management principles. Future studies should also consider expanding the scope of analysis to include a quantification of other parts of the DC supply chain and also to consider the grey and green WF in much more depth than the mention these factors recieved here. Apple, for example, reports on changes in landscaping which have led to reductions in green WF. While Apple and other large firms have environmental reporting, most DCs are small and have little to no reporting on environmental footprints. Although academia, industry, and the public sector have started making such efforts, much work remains to be done.
Acknowledgments
We would like to thank Cristobal Irazoqui, Policy Officer—ICT Environmental Sustainability, DG CONNECT, European Commission, for his consultation on this article.
Acknowledgement is also due to the Natural Environment Research Council (NERC) for the financial support provided to the first author.
Author Contributions
All authors have contributed equally to the realization of this research, albeit in different ways. The research question was concieved by Kaveh Madani who lead the study team. Bora Ristic was responsible for data collection and analysis, interpretation of results, and writing. Kaveh Madani and Zen Makuch both contributed substantially to improving the analysis and with suggestions for improvement in the manuscript. All authors have read and approved the final manuscript.
Conflicts of Interest
The authors declare no conflict of interest.
References
- International Telecommunications Union Percentage of Individuals Using the Internet. Available online: http://www.itu.int/en/ITU-D/Statistics/Pages/stat/default.aspx (accessed on 10 Feburary 2015).
- CISCO Global—Data Centre/Cloud Traffic Forecast. Available online: http://www.cisco.com/c/en/us/solutions/collateral/service-provider/visual-networking-index-vni/VNI_Hyperconnectivity_WP.html (accessed on 10 Feburary 2015).
- Woo, B.; Eastwood, M. WHITE PAPER Addressing Enterprise Computing Storage Performance Gaps with Enterprise Flash Drives. Available online: http://www.sandisk.com/assets/docs/EFD_whitepaper_from_IDC.pdf (accessed on 13 August 2015).
- America’s Data Centres Consuming and Wasting Growing Amounts of Energy. Available online: http://www.nrdc.org/energy/data-center-efficiency-assessment.asp (accessed on 10 Feburary 2015).
- Madani, K.; Khatami, S. Water for Energy: Inconsistent Assessment Standards and Inability to Judge Properly. Curr. Sustain. Energy Rep. 2015, 2, 10–16. [Google Scholar] [CrossRef]
- U.S. Energy Information Administration. International Energy Outlook 2011; International Energy Agency: Washington, DC, USA, 2011.
- Rodriguez, D.; Madrigal, M. Thirsty Enegy: Securing Energy in a Water-Constrained World. Available online: http://documents.worldbank.org/curated/en/2013/01/17932041/thirsty-energy (accessed on 13 August 2015).
- United Nations World Water Assessment Programme. World Water Development Report 2014 Water and Energy; UNESCO: Paris, France, 2014. [Google Scholar]
- World Energy Council. Water for Energy; World Energy Council: London, UK, 2010. [Google Scholar]
- Hadian, S.; Madani, K. The Water Demand of Energy: Implications for Sustainable Energy Policy Development. Sustainability 2013, 5, 4674–4687. [Google Scholar] [CrossRef]
- Koomey, J.G. Growth in Data Center Electricity Use 2005 to 2010; Anal Press: Oakland, CA, USA, 2011; pp. 1–24. [Google Scholar]
- Prakash, S.; Baron, Y.; Liu, R.; Proske, M.; Schlossler, A. Study on the Practical Application of the New Framework Methodology for Measuring the Environmental Impact of ICT—Cost/Benefit Analysis. Available online: https://ec.europa.eu/digital-agenda/en/news/study-practical-application-new-framework-methodology-measuring-environmental-impact-ict (accessed on 13 August 2013).
- Environmental Protection Agency (EPA). EPA Report to Congress on Server and Data Center Energy Efficiency Executive Summary; EPA: Washington, DC, USA, 2007.
- Beton, A.; Des Abbayes, C.; Iyama, S.; Stobbe, L.; Gallehr, S.; Scheidt, L.G. Impacts of Information and Communication Technologies on Energy Efficiency. Available online: ftp://ftp.cordis.europa.eu/pub/fp7/ict/docs/sustainable-growth/ict4ee-final-report_en.pdf (accessed on 13 August 2015).
- Whitehead, B.; Andrews, D.; Shah, A. The life cycle assessment of a UK data centre. Int. J. Life Cycle Assess. 2015, 20, 332–349. [Google Scholar] [CrossRef]
- Whitehead, B.; Andrews, D.; Shah, A.; Maidment, G. Assessing the environmental impact of data centres part 1: Background, energy use and metrics. Build. Environ. 2014, 82, 151–159. [Google Scholar] [CrossRef]
- Fakhim, B.; Behnia, M.; Armfield, S.W.; Srinarayana, N. Cooling solutions in an operational data centre: A case study. Appl. Therm. Eng. 2011, 31, 2279–2291. [Google Scholar] [CrossRef]
- Chi, Y.Q.; Summers, J.; Hopton, P.; Deakin, K.; Real, A.; Kapur, N.; Thompson, H. Case Study of a Data Centre Using Enclosed, Immersed, Direct Liquid-Cooled Servers. In Proceedings of the 2014 30th Annual Semiconductor Thermal Measurement and Management Symposium (Semi-Therm), IEEE Semiconductor Thermal Measurement and Management Symposium, New York, NY, USA, 9–13 March 2014; pp. 164–173.
- Oro, E.; Depoorter, V.; Pflugradt, N.; Salom, J. Overview of direct air free cooling and thermal energy storage potential energy savings in data centres. Appl. Therm. Eng. 2015, 85, 100–110. [Google Scholar] [CrossRef]
- Masanet, E.; Shehabi, A.; Koomey, J. Characteristics of low-carbon data centres. Nat. Clim. Chang. 2013, 3, 627–630. [Google Scholar] [CrossRef]
- Bi, J.; Yuan, H.; Tie, M.; Tan, W. SLA-based optimisation of virtualised resource for multi-tier web applications in cloud data centres. Enterp. Inf. Syst. 2015, 9, 743–767. [Google Scholar] [CrossRef]
- Dupont, C. Building Application Profiles to Allow a Better Usage of the Renewable Energies in Data Centres. In Energy Efficient Data Centers (E2DC 2014); Klingert, S., Chinnici, M., Porto, M.R., Eds.; Springer-Verlag: Berlin, Germany, 2015; Volume 8945, pp. 120–131. [Google Scholar]
- Dupont, C.; Hermenier, F.; Schulze, T.; Basmadjian, R.; Somov, A.; Giuliani, G. Plug4Green: A flexible energy-aware VM manager to fit data centre particularities. Ad Hoc Netw. 2015, 25, 505–519. [Google Scholar] [CrossRef]
- Lin, W.; Zhu, C.; Li, J.; Liu, B.; Lian, H. Novel algorithms and equivalence optimisation for resource allocation in cloud computing. Int. J. Web Grid Serv. 2015, 11, 193–210. [Google Scholar] [CrossRef]
- Uddin, M.; Memon, J.; Rozan, M.Z.A.; Alsaqour, R.; Rehman, A. Virtualised load management algorithm to reduce CO2 emissions in the data centre industry. Int. J. Glob. Warm. 2015, 7, 3–20. [Google Scholar] [CrossRef]
- Perumal, V.; Subbiah, S. Power-conservative server consolidation based resource management in cloud. Int. J. Netw. Manag. 2014, 24, 415–432. [Google Scholar] [CrossRef]
- Peoples, C.; Parr, G.; McClean, S.; Scotney, B.; Morrow, P. Performance evaluation of green data centre management supporting sustainable growth of the internet of things. Simul. Model. Pract. Theory 2013, 34, 221–242. [Google Scholar] [CrossRef]
- Doyle, J.; Knorn, F.; O’Mahony, D.; Shorten, R. Distributed thermal aware load balancing for cooling of modular data centres. IET Control Theory Appl. 2013, 7, 612–622. [Google Scholar] [CrossRef]
- Vandromme, N.; Dandres, T.; Maurice, E.; Samson, R.; Khazri, S.; Moghaddam, R.F.; Nguyen, K.K.; Cheriet, M.; Lemieux, Y. Life Cycle Assessment of Videoconferencing with Call Management Servers Relying on Virtualization. In Proceedings of the 2014 Conference ICT for Sustainability, Stockholm, Sweden, 24–27 August 2014; Hojer, M., Lago, P., Wangel, J., Eds.; Atlantis Press: Paris, France, 2014; pp. 281–289. [Google Scholar]
- Basmadjian, R.; Mueller, L.; de Meer, H. Data centres’ power profile selecting policies for Demand Response: Insights of Green Supply Demand Agreement. Ad Hoc Netw. 2015, 25, 581–594. [Google Scholar] [CrossRef]
- Berl, A.; Klingert, S.; Beck, M.T.; de Meer, H. Integrating Data Centres into Demand-Response Management: A Local Case Study. In Proceedings of the 39th Annual Conference of The Ieee Industrial Electronics Society (Iecon 2013), Vienna, Austria, 10–13 November 2013; IEEE Industrial Electronics Society: New York, NY, USA, 2013; pp. 4762–4767. [Google Scholar]
- Depoorter, V.; Oro, E.; Salom, J. The location as an energy efficiency and renewable energy supply measure for data centres in Europe. Appl. Energy 2015, 140, 338–349. [Google Scholar] [CrossRef]
- Jones, P.; Comfort, D.; Hillier, D. The changing geography of data centres in the UK. Geography 2013, 98, 18–23. [Google Scholar]
- Maurice, E.; Dandres, T.; Samson, R.; Moghaddam, R.F.; Nguyen, K.K.; Cheriet, M.; Lemieux, Y. Modelling of Electricity Mix in Temporal Differentiated Life-Cycle-Assessment to Minimize Carbon Footprint of a Cloud Computing Service. In Proceedings of the 2014 Conference ICT for Sustainability, Stockholm, Sweden, 24–27 August 2014; Hojer, M., Lago, P., Wangel, J., Eds.; Atlantis Press: Paris, France, 2014; pp. 290–298. [Google Scholar]
- Hadian, S.; Madani, K. A system of systems approach to energy sustainability assessment: Are all renewables really green? Ecol. Indic. 2015, 52, 194–206. [Google Scholar] [CrossRef]
- Uptime Institute. Uptime Institute Data Center Industry Survey 2013. Available online: https://uptimeinstitute.com/publications/asset/18 (accessed on 13 August 2015).
- Global Reporting Initiative Sustainability Disclosure Database. Available online: http://database.globalreporting.org/ (accessed on 10 Feburary 2015).
- Sharma, R.; Shah, A.; Bash, C.; Christian, T.; Patel, C. Water Efficiency Management in Datacenters (Part I): Introducing a Water Usage Metric Based on Available Energy Consumption. Available online: http://www.hpl.hp.com/techreports/2008/HPL-2008-206.pdf (accessed on 13 August 2015).
- Sharma, R.; Shah, A.; Bash, C.; Christian, T.; Patel, C. Water Efficiency Management in Datacenters: Metrics and Methodology. In Proceedings of the 2009 IEEE International Symposium on Sustainable Systems Technology, Phoenix, AZ, USA, 18–20 May 2009; Available online: http://ieeexplore.ieee.org/xpl/login.jsp?tp=&arnumber=5156773&url=http%3A%2F%2Fieeexplore.ieee.org%2Fxpls%2Fabs_all.jsp%3Farnumber%3D5156773 (accessed on 13 August 2015).
- Bash, C.; Cader, T.; Chen, Y.; Gmach, D.; Kaufman, R.; Milojicic, D.; Shah, A.; Sharma, P. Cloud Sustainability Dashboard, Dynamically Assessing Sustainability of Data Centers and Clouds. In Proceedings of the Fifth Open Cirrus Summit, Hewlett Packard, CA, USA, 1–3 June 2011.
- Frachtenberg, E. Holistic datacenter design in the open compute project. Computer (Long. Beach. Calif) 2012, 45, 83–85. [Google Scholar] [CrossRef]
- Ren, S. Optimizing Water Efficiency in Distributed Data Centers. In Proceedings of the 3rd International Conference Cloud Green Computer, Karlsruhe, Germany, 30 September–2 October 2013; pp. 68–75.
- Gmach, D.; Chen, Y.; Shah, A.; Rolia, J.; Bash, C.; Christian, T.; Sharma, R. Profiling Sustainability of Data Centers. In Proceedings of the 2010 IEEE International Symposium on Sustainable Systems And Technology (ISSST), Los Alamitos, CA, USA, 17–19 May 2010.
- Patterson, M.K. The Effect of Data Center Temperature on Energy Efficiency. In Proceedings of the 2008 11th IEEE Intersociety Conference Thermal Thermomechanical Phenomena Electronic Systems I-THERM, Orlando, FL, USA, 28–31 May 2008; pp. 1167–1174.
- Hoekstra, A.Y.; Chapagain, A.K.; Aldaya, M.M.; Mekonnen, M.M. The Water Footprint Assessment Manual; Routledge: London, UK, 2011. [Google Scholar]
- Hoekstra, A.Y.; Chapagain, A.K.; Aldaya, M.M.; Mekonnen, M.M. Water Footprint Manual State of the Art 2009; Water Footprint Network: Enschede, The Netherlands, 2009. [Google Scholar]
- Leitner, P.; Dustdar, S.; Wetzstein, B.; Leymann, F. Cost-Based Prevention of Violations of Service Level Agreements in Composed Services Using Self-Adaptation. In Proceedings of the 2012 1st International Workshop on European Software Services and Systems Research—Results and Challenges, Zurich, Switzerland, 2–9 June 2012; pp. 34–35.
- Rana, O.; Warnier, M.; Quillinan, T.; Brazier, F.; Cojocarasu, D. Managing Violations in Service Level Agreements. In Grid Middleware and Services SE—23; Springer: Berlin, Germany, 2008; pp. 349–358. [Google Scholar]
- Klingert, S.; Schulze, T.; Bunse, C. GreenSLAs for the Energy-efficient Management of Data Centres. In Proceedings of the 2nd International Conference on Energy-Efficient Computing and Networking, New York, NY, USA, 31 May–1 June 2011; pp. 21–30.
- Beloglazov, A.; Abawajy, J.; Buyya, R. Energy-aware resource allocation heuristics for efficient management of data centers for Cloud computing. Future Gener. Comput. Syst. 2012, 28, 755–768. [Google Scholar] [CrossRef]
- Global Taskforce. Harmonizing Global Metrics for Data Center Energy Efficiency. 2012. Available online: http://www.thegreengrid.org/~/media/WhitePapers/Harmonizing%20Global%20Metrics%20for%20Data%20Center%20Energy%20Efficiency%202012-10-02.pdf?lang=en%20 (accessed on 13 August 2015).
- Eicker, U. Low Energy Cooling for Sustainable Buildings; John Wiley and Sons: Chichester, UK, 2009. [Google Scholar]
- Greenberg, S.; Mills, E.; Tschudi, B.; Berkeley, L. Best Practices for Data Centers : Lessons Learned from Benchmarking 22 Data Centers. ACEEE 2006, Summer Volume, 76–87. [Google Scholar]
- Green ICT Is PUE Still above 2.0 for Most Data Centers? Available online: http://www.vertatique.com/no-one-can-agree-typical-pue (accessed on 20 February 2015).
- ASHRAE. ASHRAE Handbook—HVAC Applications; IHS under licence with ASHRAE: Atlanta, GA, USA, 2011. [Google Scholar]
- Langley, B.C. Heating, Ventilating, Air Conditioning, and Refrigeration, 4th ed.; Prentice-Hall, Inc.: Englewood Cliffs, NJ, USA, 1990. [Google Scholar]
- Strutt, S.; Kelley, C.; Singh, H.; Smith, V. Data Center Efficiency and IT Equipment Reliability at Wider Operating Temperature and Humidity Ranges. Available online: http://www.thegreengrid.org/~/media/WhitePapers/WP50-Data%20Center%20Efficiency%20and%20IT%20Equipment%20Reliability%20at%20Wider%20Operating%20Temperature%20and%20Humidity%20Ranges.pdf?lang=en (accessed on 13 August 2015).
- Pita, E. Air Conditioning Principles and Systems: An Energy Approach, 4th ed.; Prentice Hall: Columbus, OH, USA, 2002. [Google Scholar]
- Ackerman, J. What a Water-Cooled HVAC System Can Do for Your Building. Buildings 2008, 102, 72–76. [Google Scholar]
- Foster, P. Half of Data Centres Are Now Using Natural Cooling. Available online: http://www.theguardian.com/sustainable-business/data-centres-natural-cooling (accessed on 3 June 2015).
- Metzger, I.; VanGeet, O.; Rockenbaugh, C.; Dean, J.; Kurnik, C. Psychrometric bin analysis for alternative cooling strategies in data centers. ASHRAE Trans. 2011, 117, 254–261. [Google Scholar]
- Carrier Corporation Psychrometrics. Available online: http://upload.wikimedia.org/wikipedia/commons/thumb/9/9d/PsychrometricChart.SeaLevel.SI.svg/2000px-PsychrometricChart.SeaLevel.SI.svg.png (accessed on 14 Feburary 2015).
- Institute for Energy and Transport (IET). Data Centres Energy Efficiency. Available online: http://iet.jrc.ec.europa.eu/energyefficiency/ict-codes-conduct/data-centres-energy-efficiency (accessed on 13 August 2015).
- Miller, R. Google: Raise You Data Center Temperature. Available online: http://www.datacenterknowledge.com/archives/2008/10/14/google-raise-your-data-center-temperature/ (accessed on 10 February 2015).
- EPA Energy Star Benchmark Your Data Centre’s Energy Efficiency. Available online: http://www.energystar.gov/index.cfm?c=prod_development.server_efficiency_principles (accessed on 4 February 2015).
- Sartor, D. Saving Energy in Data Centers Applying Best Practices. Available online: https://mydesktop.doe.gov/sites/prod/files/2013/11/f4/session_1_industry_track_sartor_en.pdf (accessed on 13 August 2015).
- Apple. Environmental Responsibility Report. Available online: https://www.apple.com/environment/pdf/Apple_Environmental_Responsibility_Report_2014.pdf (accessed on 13 August 2015).
- Mekonnen, M.M.; Gerbens-Leenes, P.W.; Hoekstra, A.Y. The consumptive water footprint of electricity and heat: A global assessment. Environ. Sci. Water Res. Technol. 2015, 1, 285–297. [Google Scholar] [CrossRef]
- Blueconomics Electricity production by sources in France 1960–2012. Available online: http://www.bluenomics.com (accessed on 10 February 2014).
- Huang, Q. The Development Strategy for Coal-Fired Power Generation in China. 2013. Available online: http://cornerstonemag.net/the-development-strategy-for-coal-fired-power-generation-in-china/ (accessed on 13 August 2015).
- Renewable Enegy Network. Global Status Report. Available online: http://www.ren21.net/Portals/0/documents/Resources/GSR/2014/GSR2014_KeyFindings_low%20res.pdf (accessed on 13 August 2015).
- California Public Utilities Commission. Renewables Portfolio Standard Quarterly Report Q4 2014. Available online: http://www.cpuc.ca.gov/NR/rdonlyres/0605598F-AE7E-43D2-BA27-1580C0F09421/0/2014Q4RPSReportFINAL3315.pdf (accessed on 13 August 2015).
- Maimoun, M.A. Life-Cycle Greenhouse Gas Emissions and Water Footprint of Residential Waste Collection and Management Systems 2015. Ph.D. Thesis, University of Central Florida, Orlando, FL, USA, 2015. Available online: http://etd.fcla.edu/CF/CFE0005656/Dissertation_Final_042015.pdf (accessed on 13 August 2015). [Google Scholar]
- Vokoun, R. Water Consciousness Continues in the Data Centre. Available online: http://www.datacenterknowledge.com/archives/2013/01/03/water-consciousness-hits-the-data-center/ (accessed on 10 February 2015).
- Torcellini, P.; Long, N.; Judkoff, R. Consumptive Water Use for U.S. Power Production; National Renewable Energy Laboratory: Golden, CO, USA, 2003; pp. 1–18. [Google Scholar]
- Mekonnen, M.M.; Hoekstra, A.Y. National Water Footprint Accounts; UNESCO-IHE Institute for Water Education: Delft, The Netherlands, 2011. [Google Scholar]
- Water Footprint Network Product Gallery. Available online: http://waterfootprint.org/en/resources/interactive-tools/product-gallery/ (accessed on 20 February 2015).
- Peterson, M. The Importance of Location for Green Data Centers. Available online: http://www.vertatique.com/importance-location-green-data-centers (accessed on 1 August 2015).
- Thomas, J.; Yetman, C. Pursuing the Green Data Centre. Available online: http://www.datacenterjournal.com/pursuing-green-data-center/ (accessed on 8 January 2015).
- Verge, J. Google Data Center Investment in Finland Tops $1 Billion USD. Available online: http://www.datacenterknowledge.com/archives/2013/11/04/google-data-center-investment-in-finland-tops-1-billion-usd/ (accessed on 1 August 2015).
- European Commission. Directive 2010/75/EU on Industrial Emission; European Union: Brussels, Belgium, 2010. [Google Scholar]
© 2015 by the authors; licensee MDPI, Basel, Switzerland. This article is an open access article distributed under the terms and conditions of the Creative Commons Attribution license (http://creativecommons.org/licenses/by/4.0/).
Share and Cite
MDPI and ACS Style
Ristic, B.; Madani, K.; Makuch, Z. The Water Footprint of Data Centers. Sustainability 2015, 7, 11260-11284. https://doi.org/10.3390/su70811260
AMA Style
Ristic B, Madani K, Makuch Z. The Water Footprint of Data Centers. Sustainability. 2015; 7(8):11260-11284. https://doi.org/10.3390/su70811260
Chicago/Turabian StyleRistic, Bora, Kaveh Madani, and Zen Makuch. 2015. "The Water Footprint of Data Centers" Sustainability 7, no. 8: 11260-11284. https://doi.org/10.3390/su70811260