
Linear Parks along Urban Rivers: Perceptions of Thermal Comfort and Climate Change Adaptation in Cyprus

 and
and
Abstract
:1. Introduction
2. Methodology
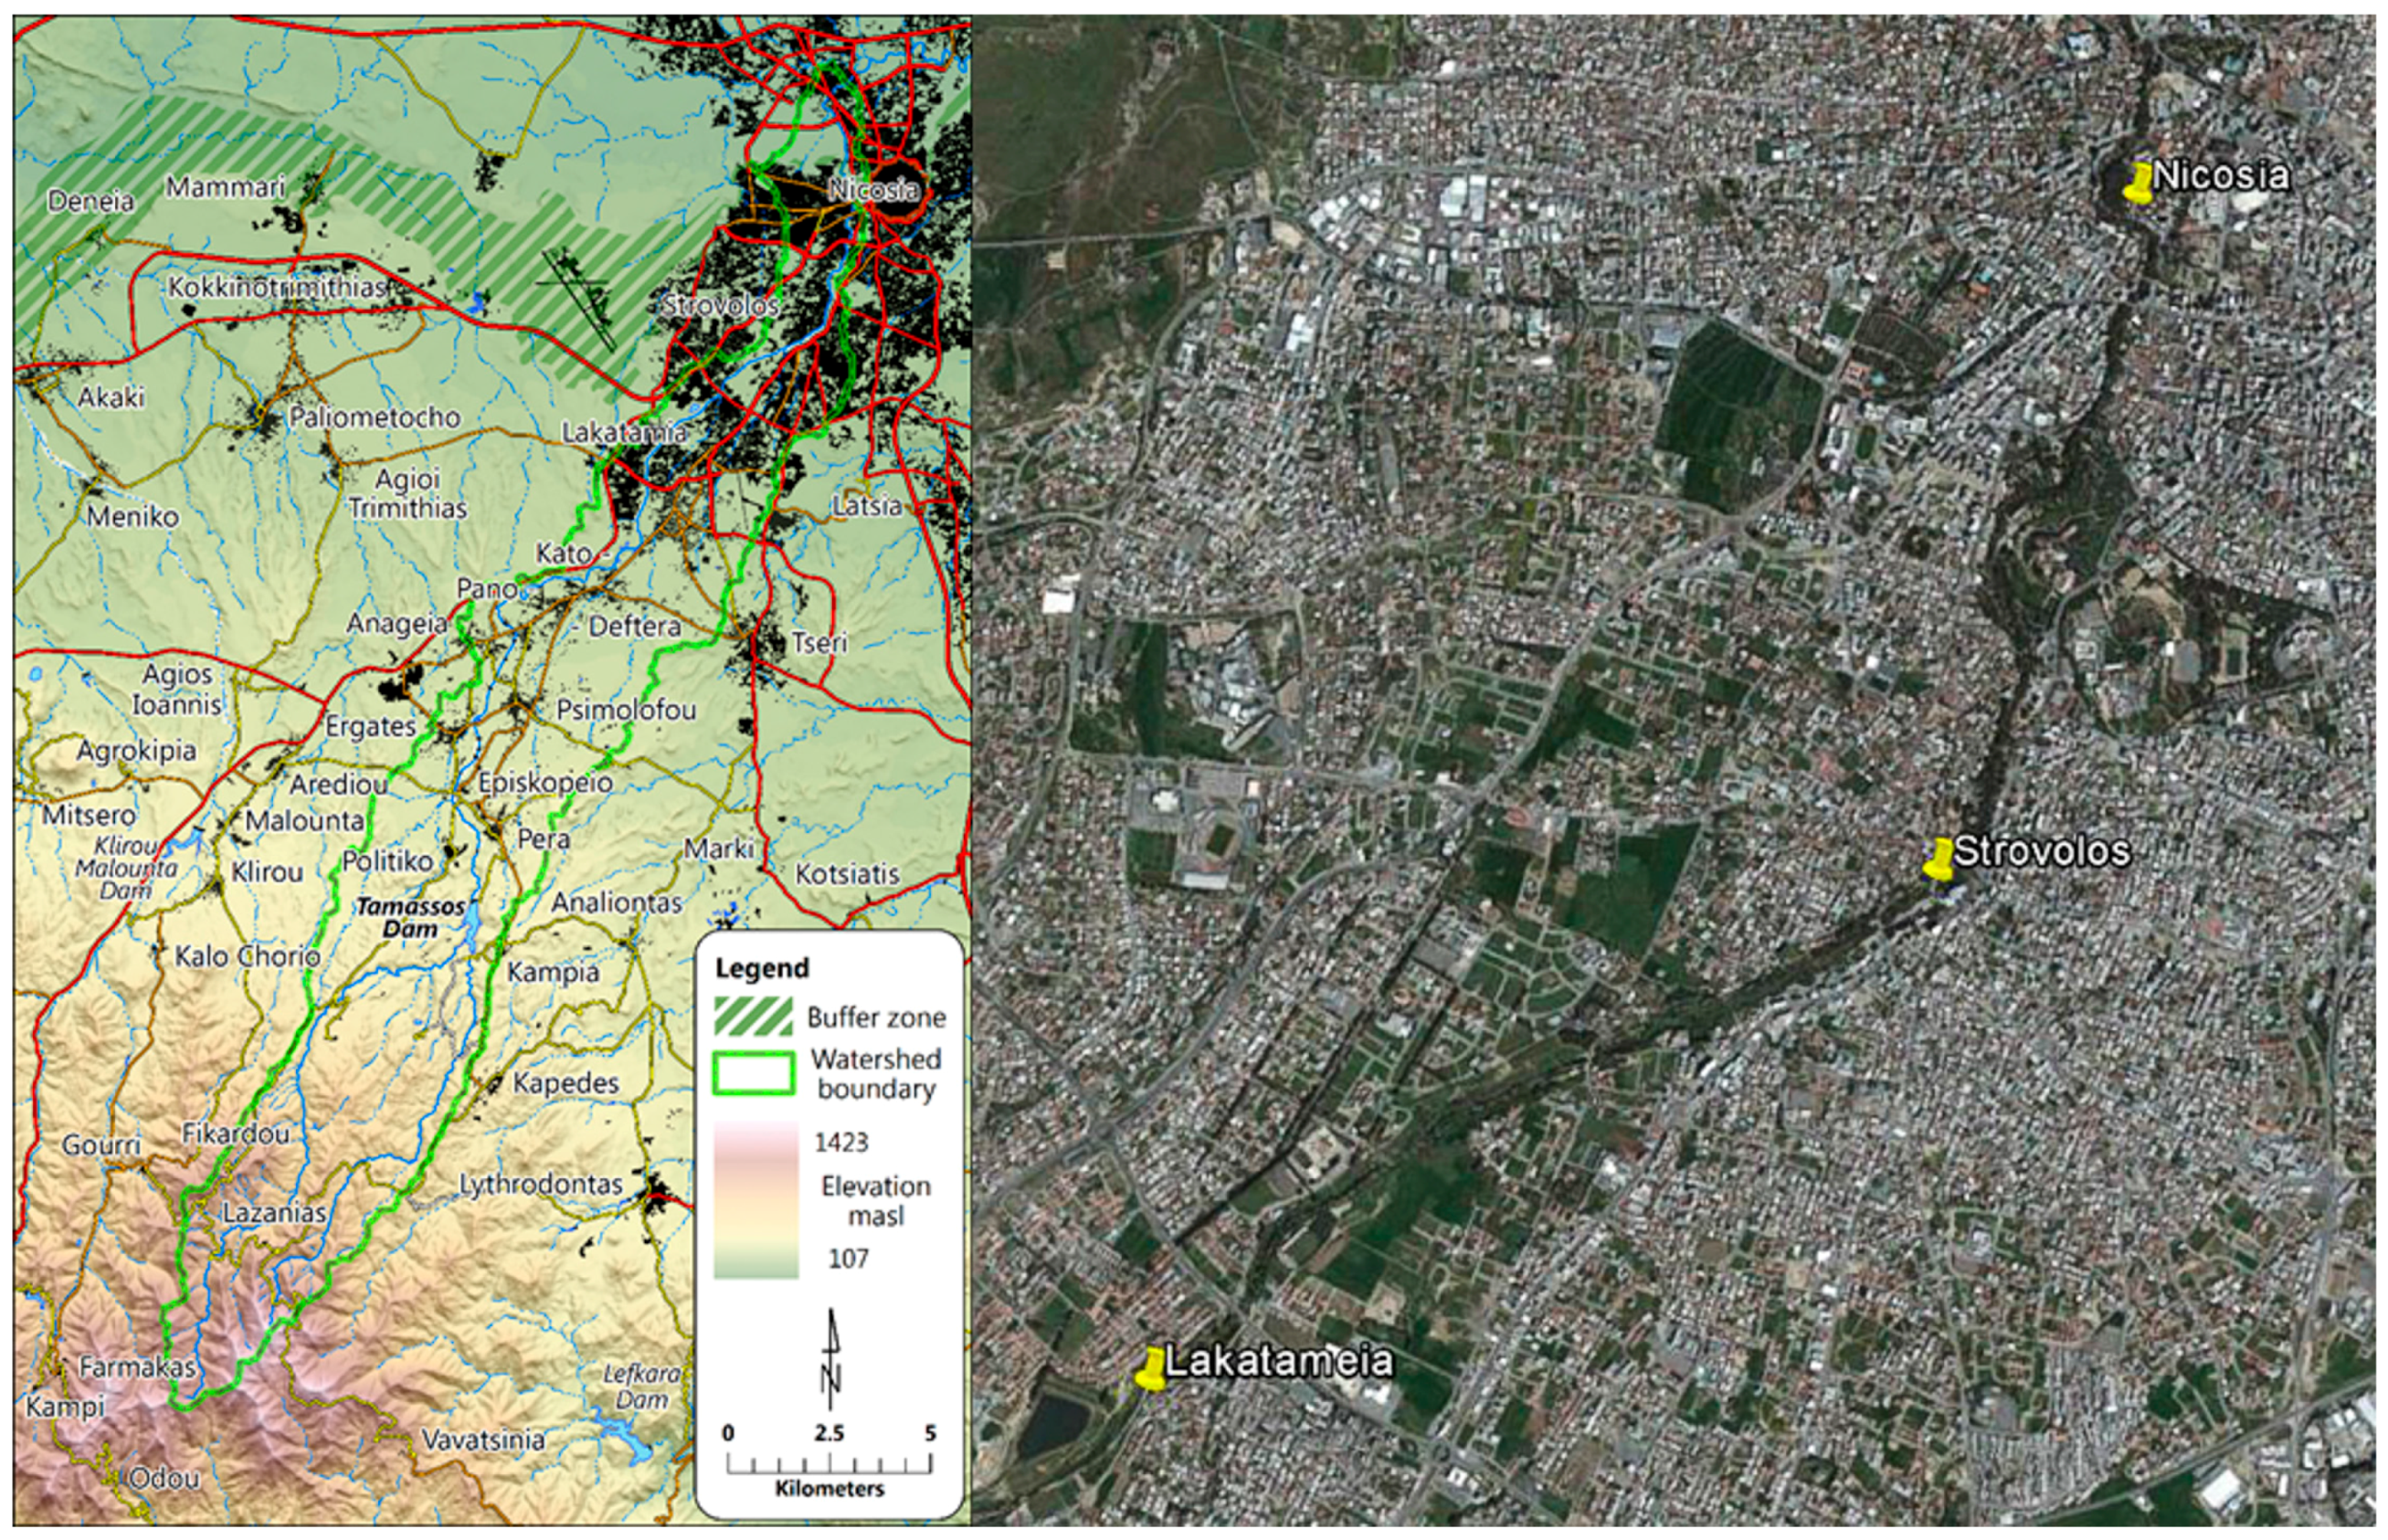
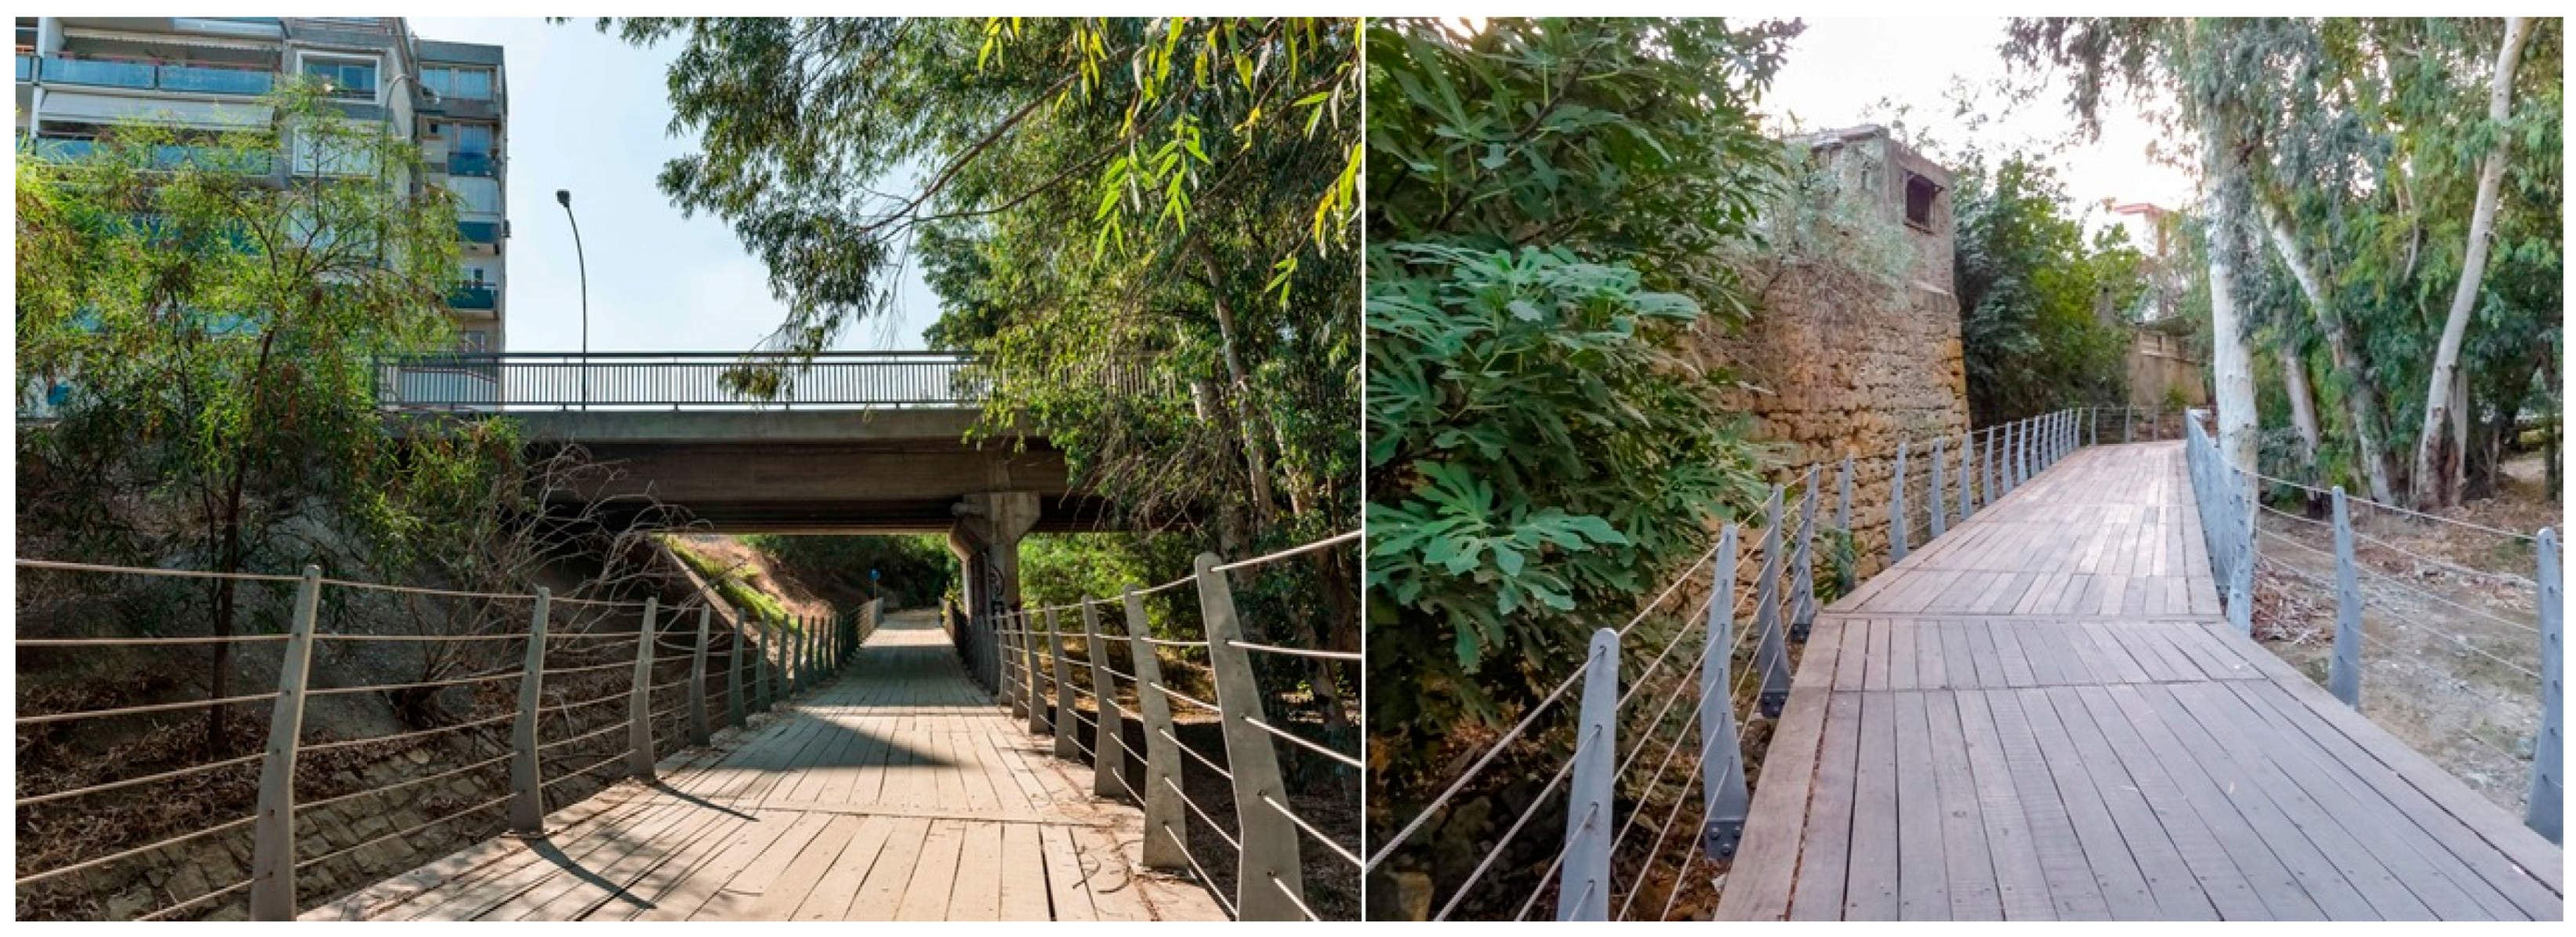
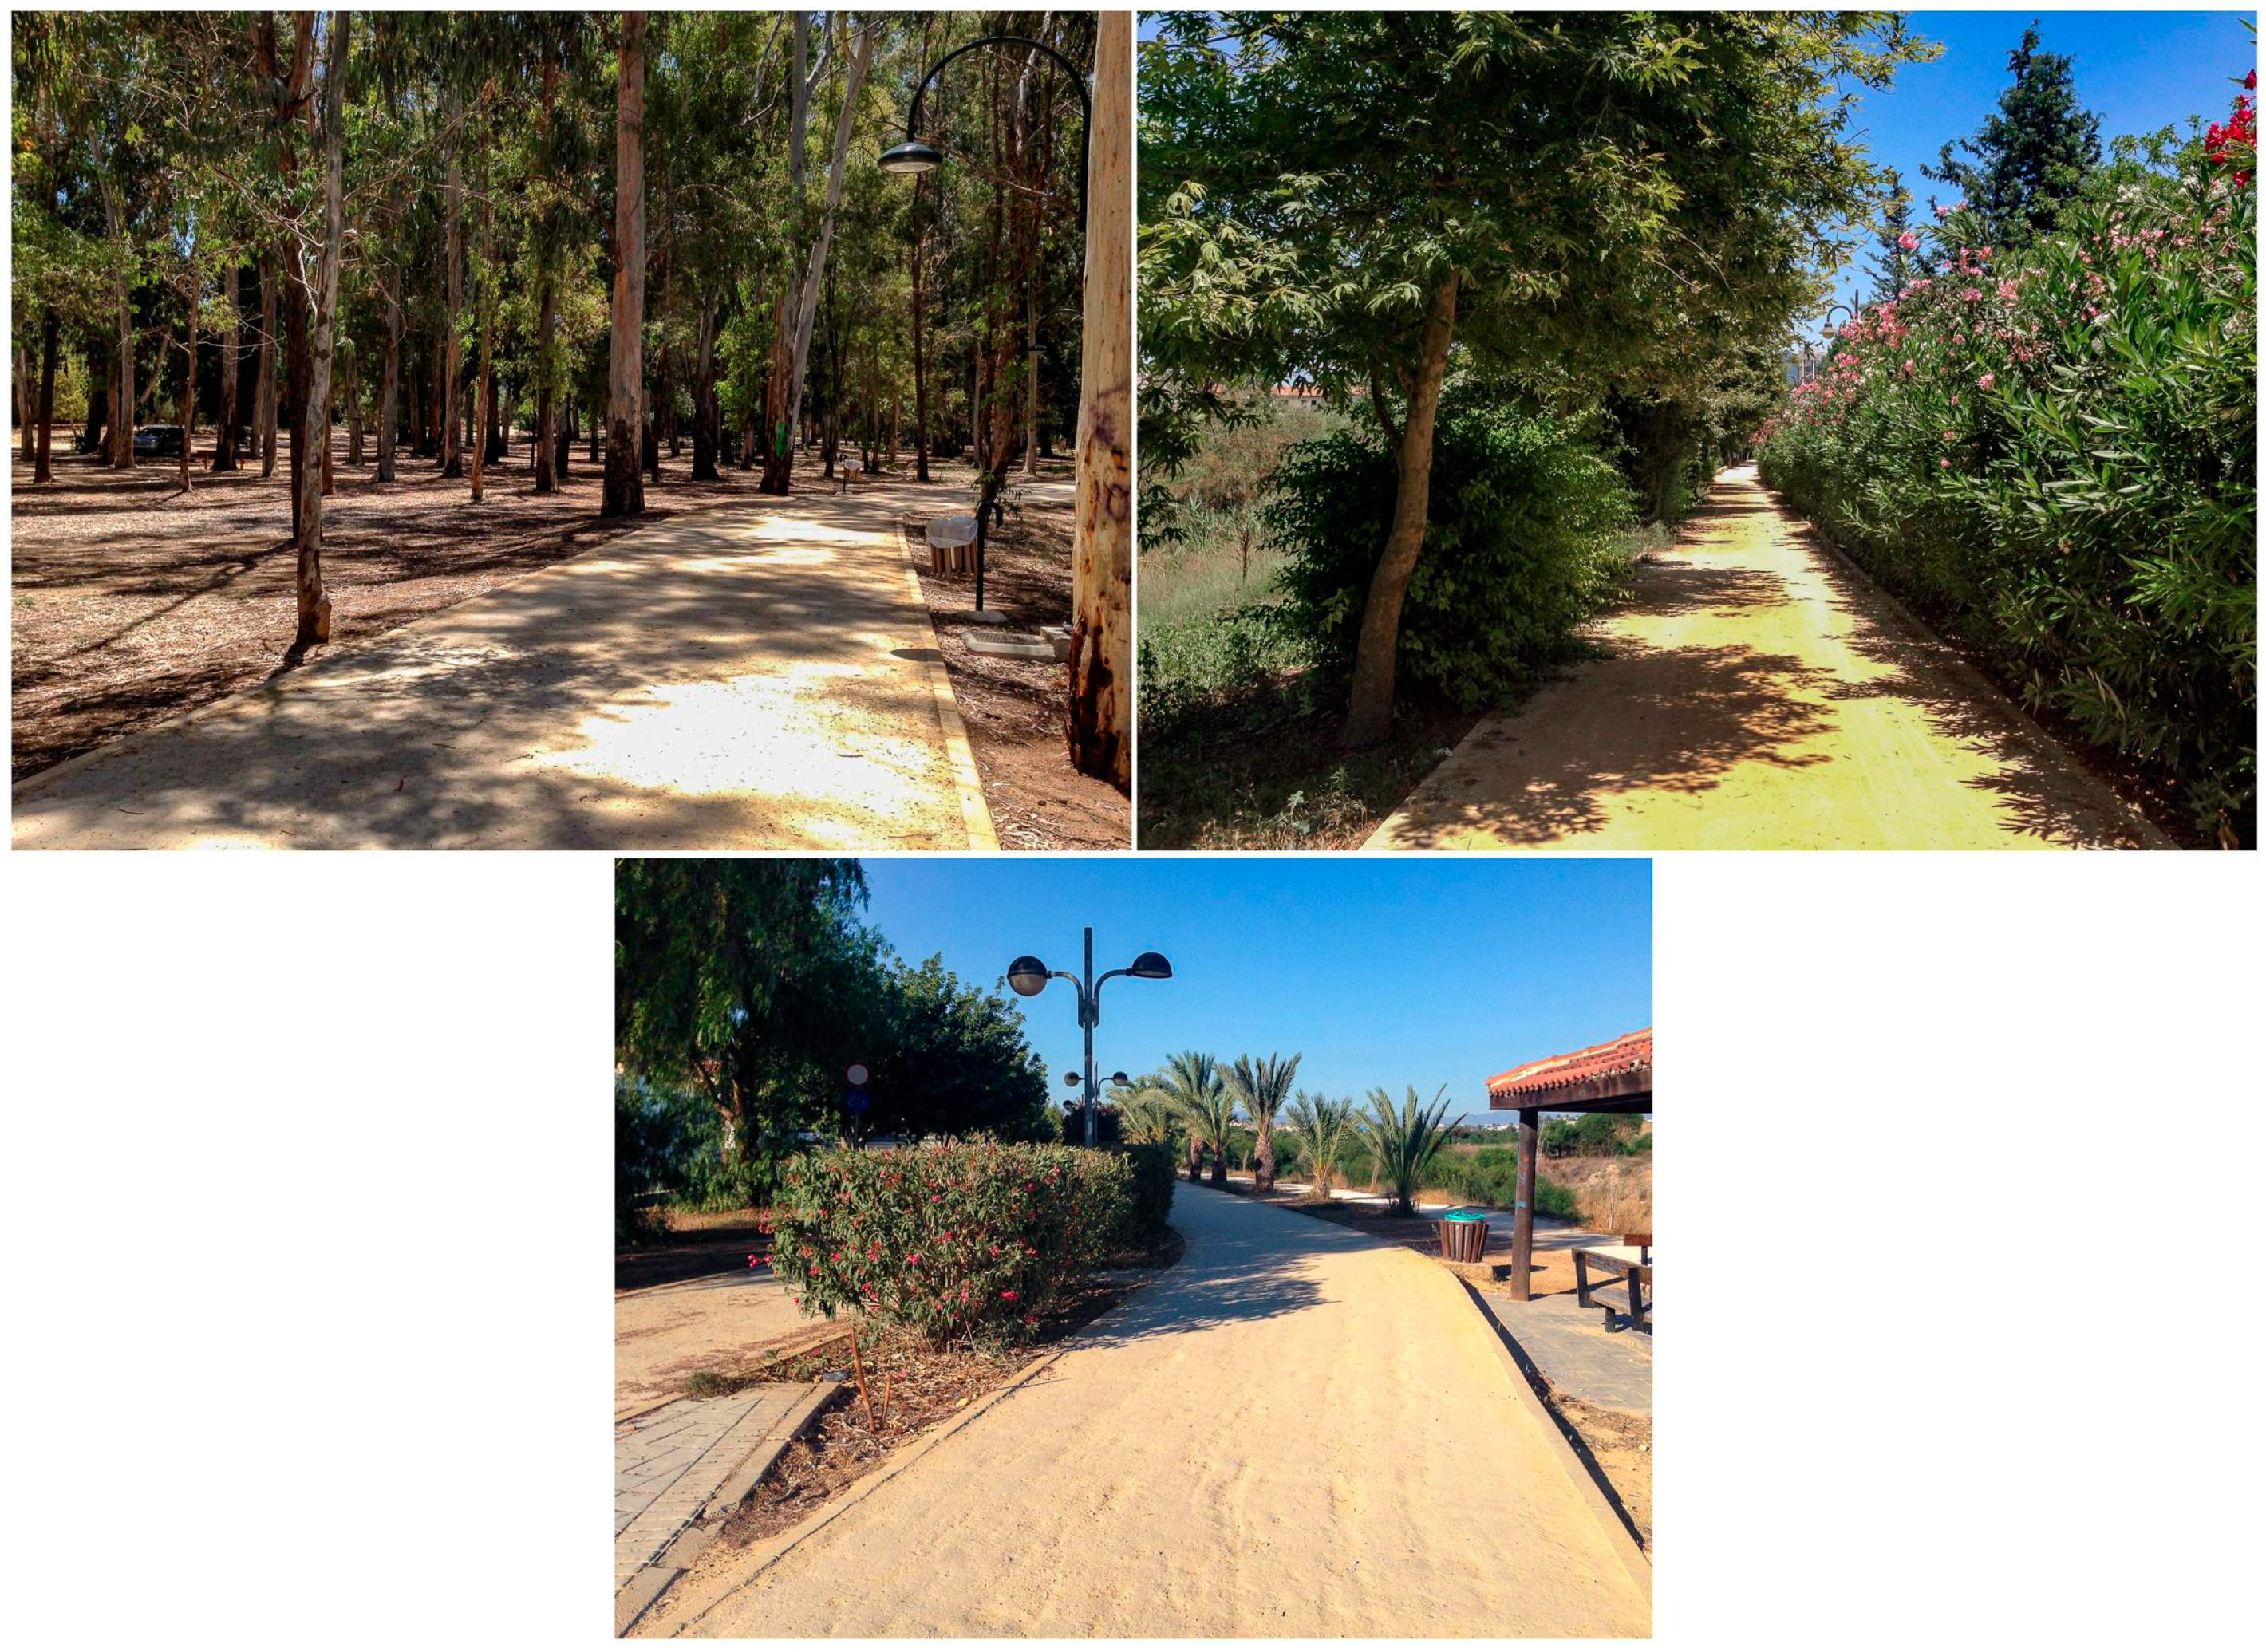
2.1. Study Area
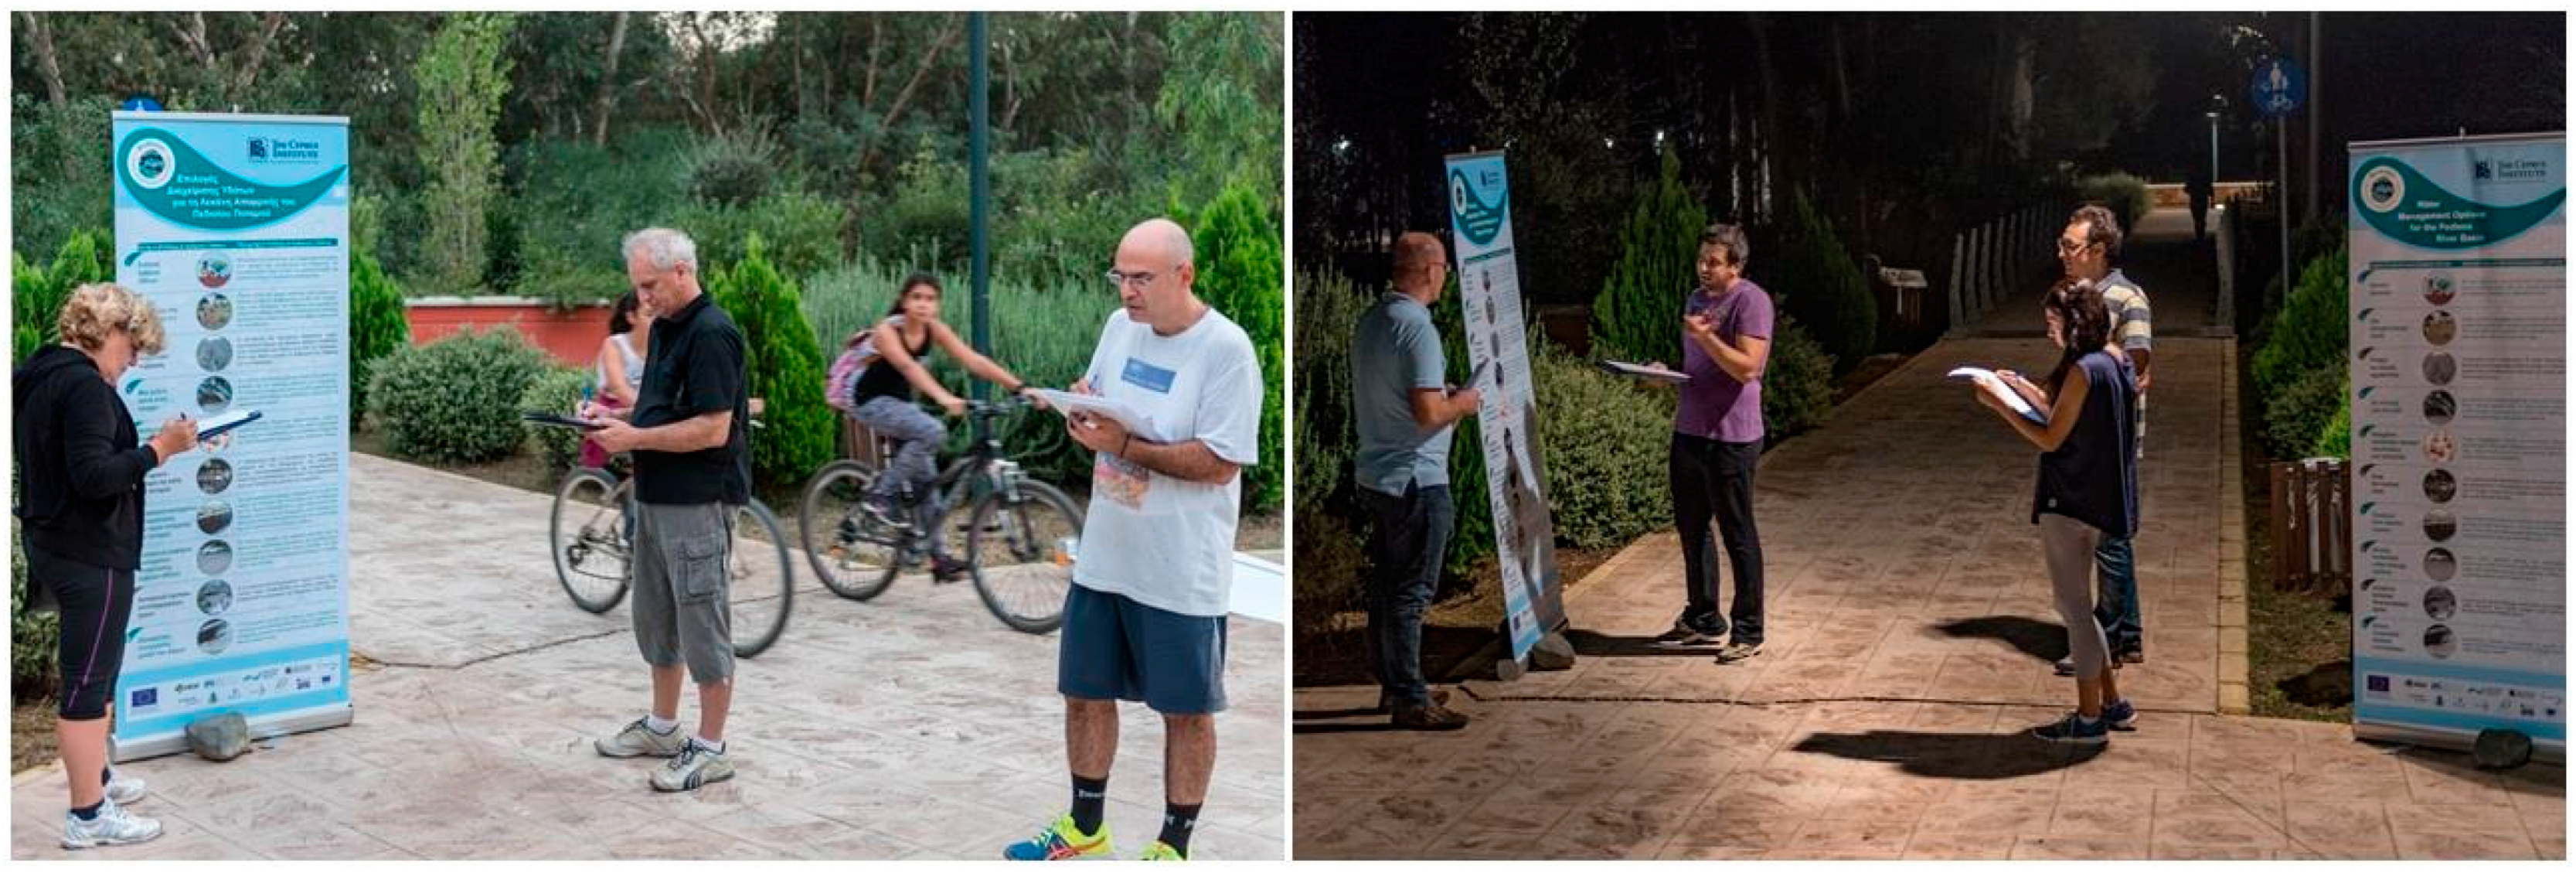
2.2. Questionnaire Survey on Park Services and Thermal Comfort Perceptions
2.3. Micrometeorological Measurements and Human Discomfort Index
2.4. Survey on Adaptation Options for Flood Protection
2.5. Data analysis
3. Results
3.1. Descriptive Analysis
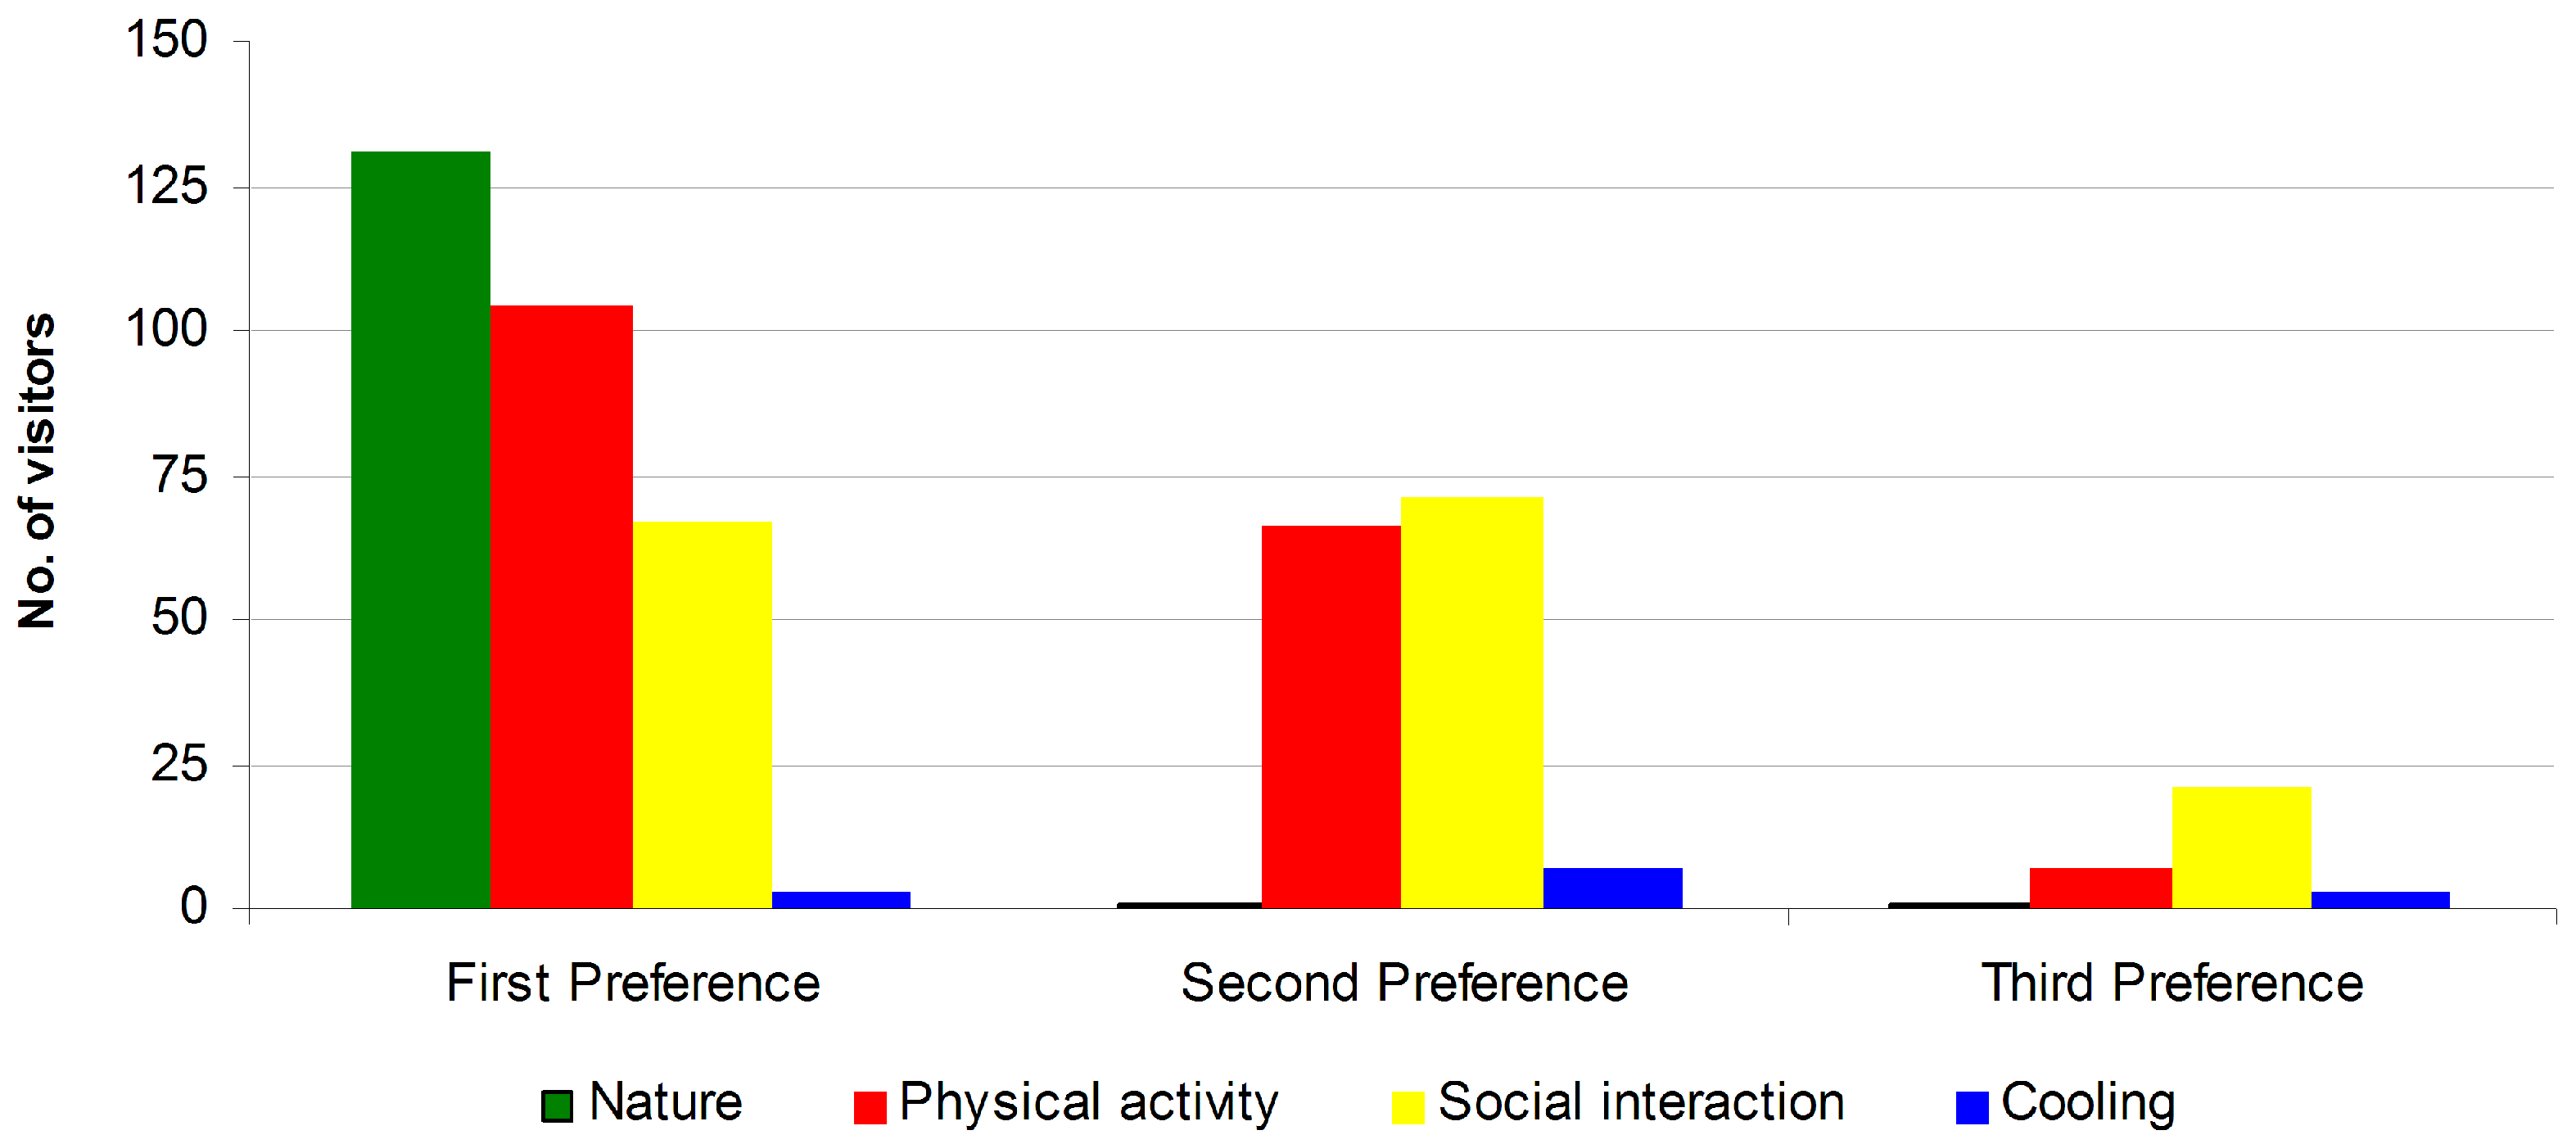
3.2. Park Users’ Perceptions of Urban Park Services and Satisfaction Levels
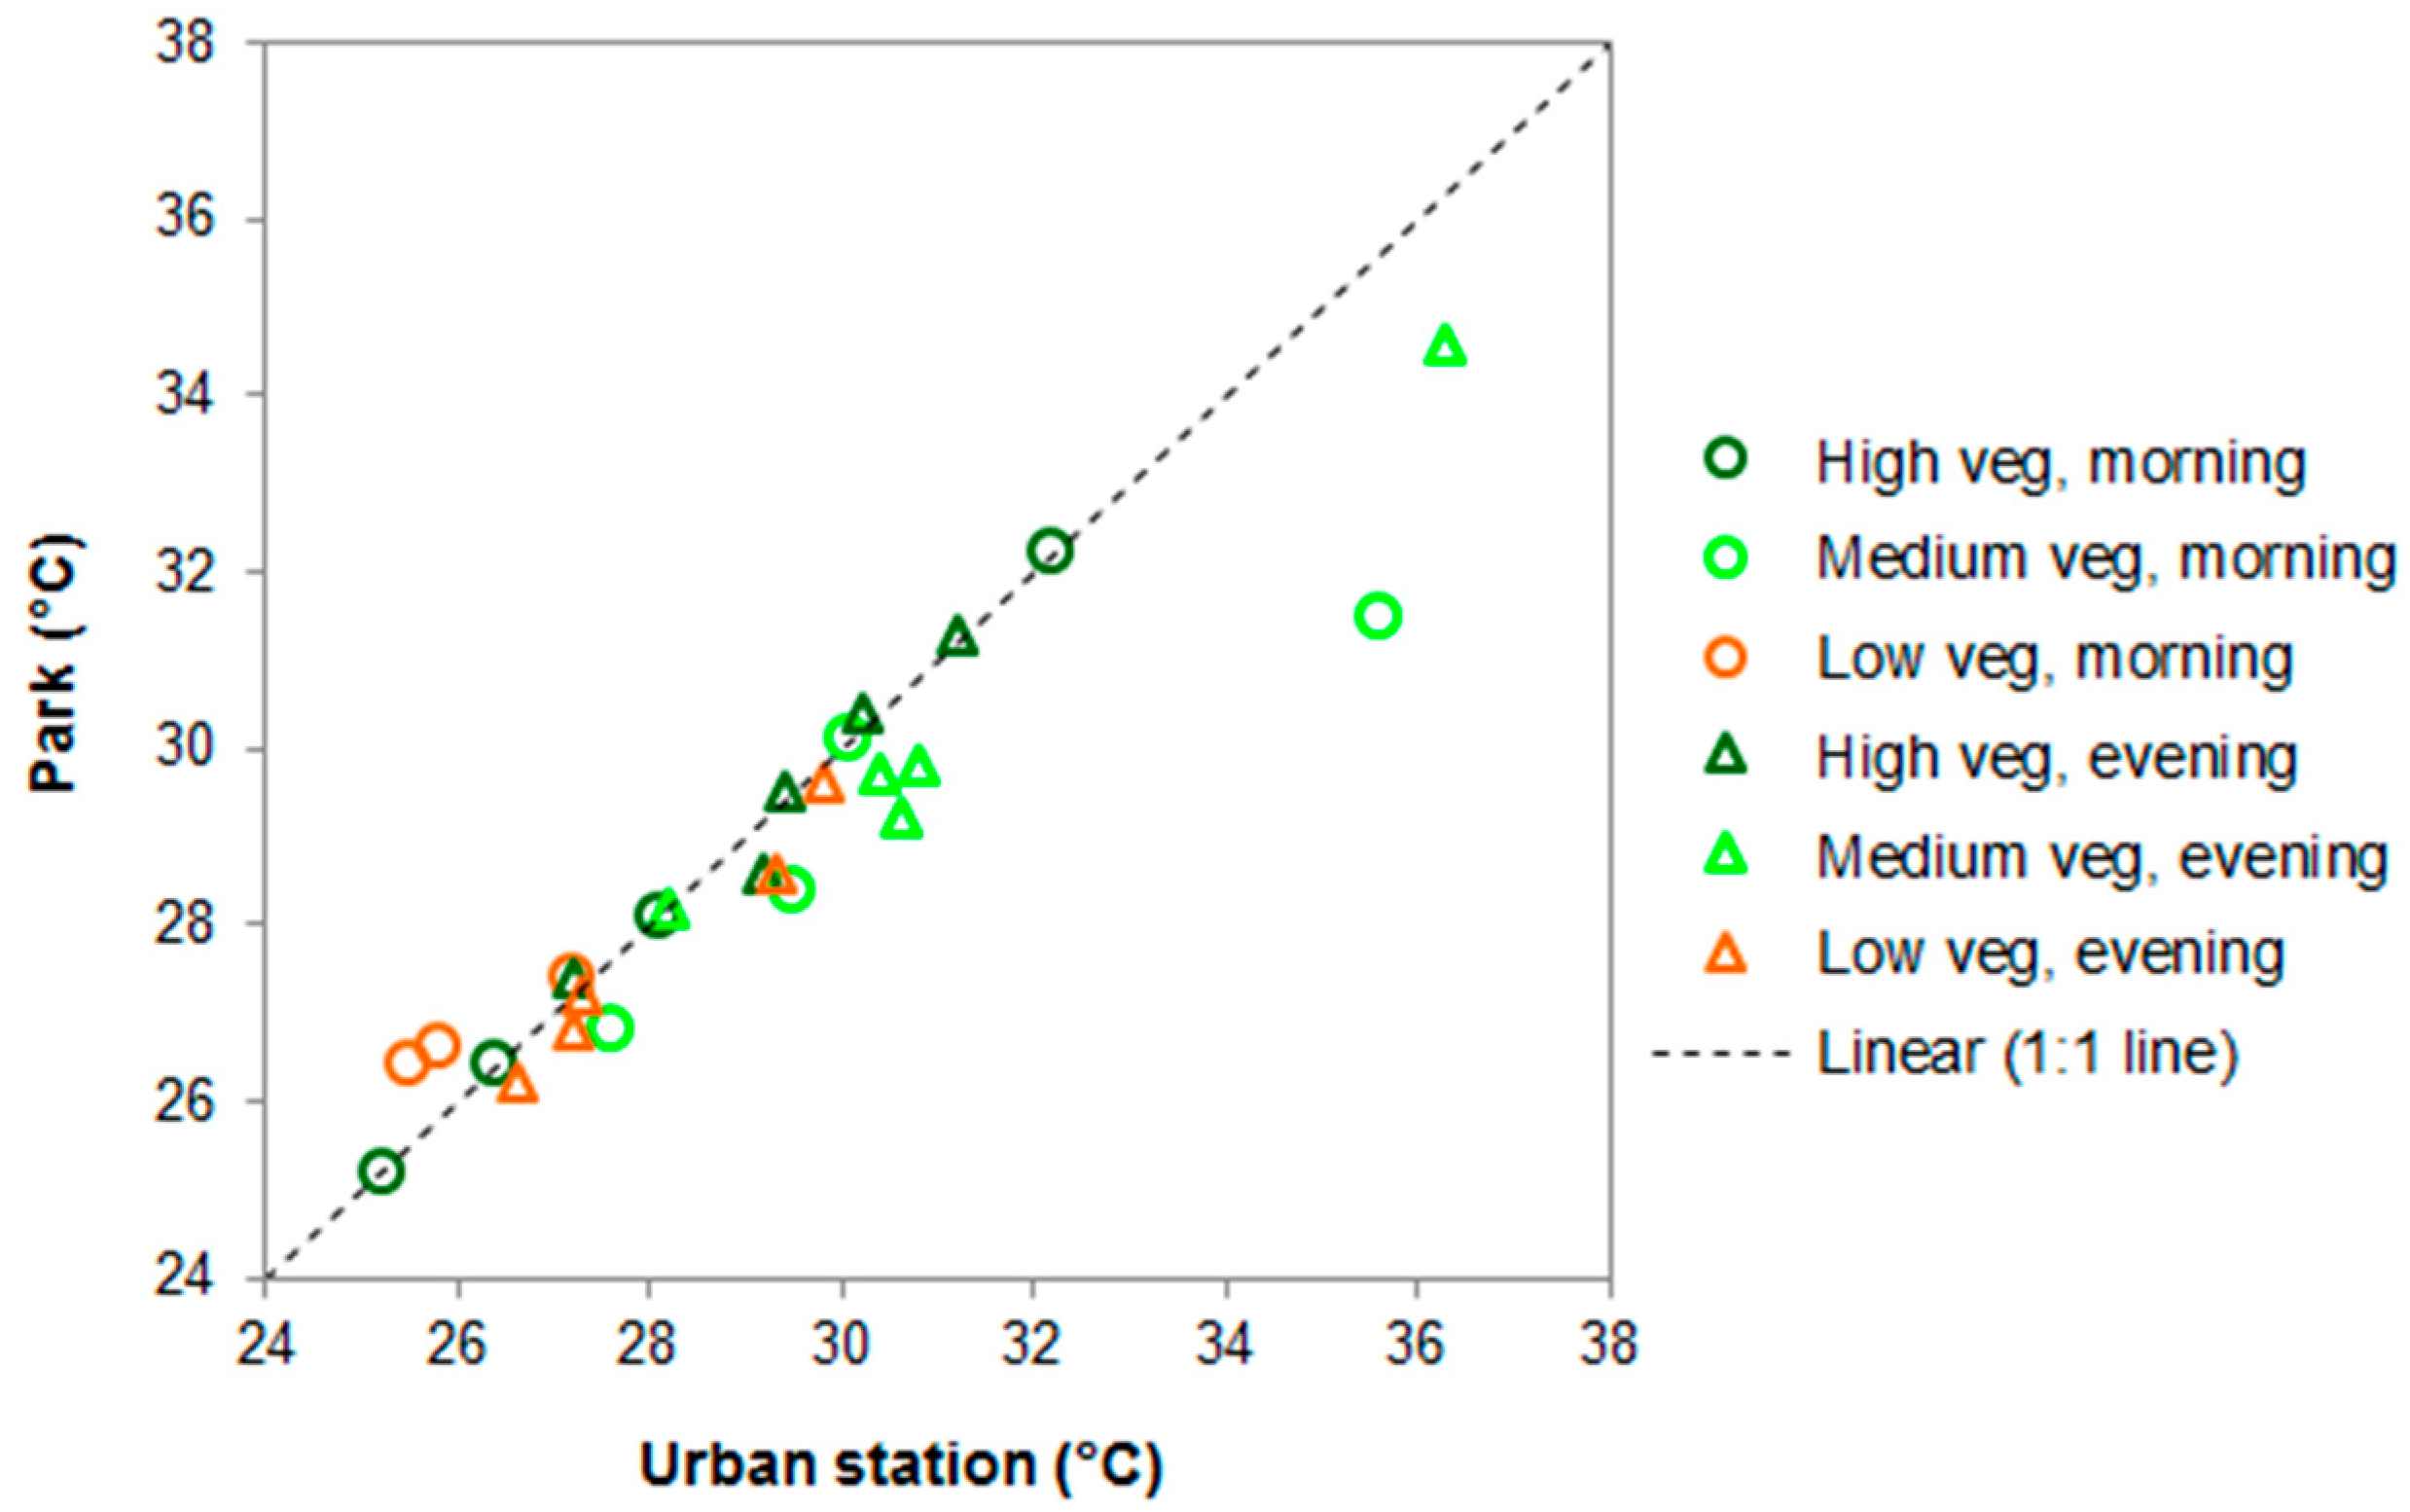
3.3. Microclimatic Measurements and Thermal Comfort Perceptions
3.4. Park Users’ Suggestions for the Improvement of the River Park and Climate Change Adaptation
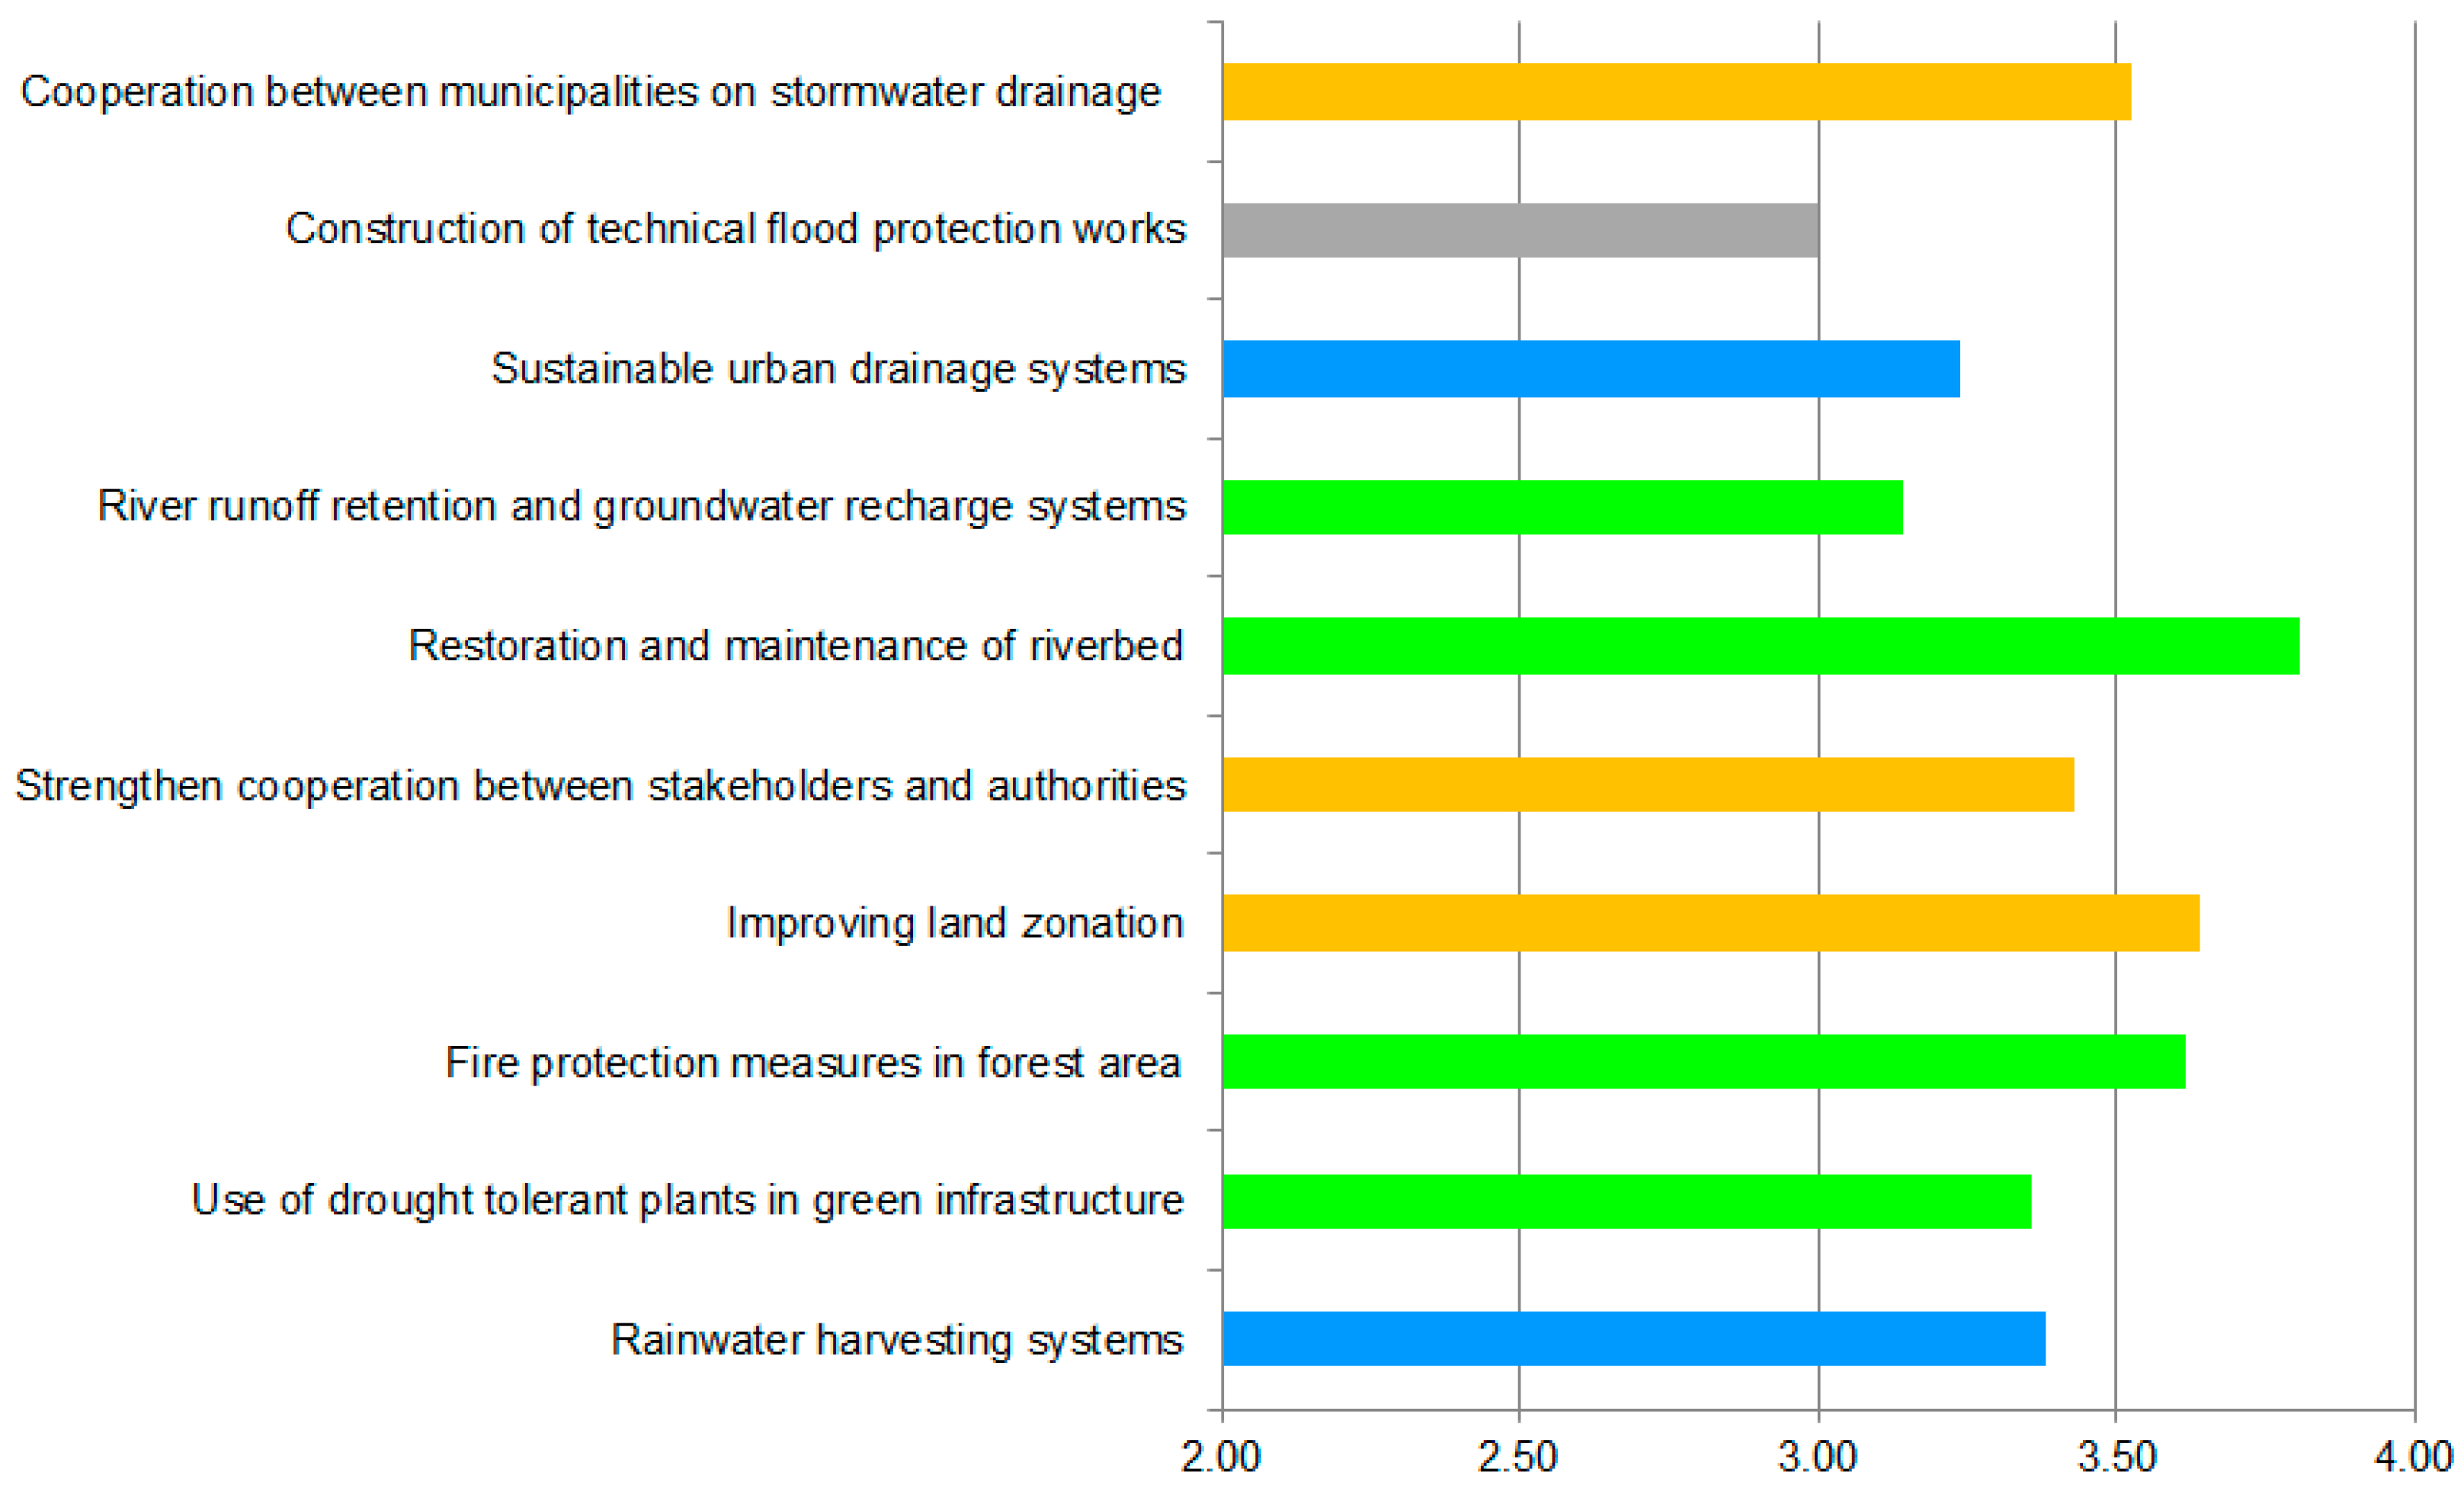
3.5. Adaptation Options for Flood Risk Reduction
4. Discussion
5. Conclusions
Acknowledgments
Author Contributions
Conflicts of Interest
References
- United Nations. World Urbanization Prospects: The 2014 Revision, Highlights (ST/ESA/SER.A/352). 2014. Available online: https://esa.un.org/unpd/wup/Publications/Files/WUP2014-Highlights.pdf (accessed on 9 October 2016).
- Vietz, G.J.; Walsh, C.J.; Fletcher, T.D. Urban hydrogeomorphology and the urban stream syndrome: Treating the symptoms and causes of geomorphic change. Prog. Phys. Geogr. 2016, 40, 480–492. [Google Scholar] [CrossRef]
- Wild, T.C.; Bernet, J.F.; Westling, E.L.; Lerner, D.N. Deculverting: Reviewing the evidence on the ‘daylighting’ and restoration of culverted rivers. Water Environ. J. 2011, 25, 412–421. [Google Scholar] [CrossRef]
- Heinl, M.; Hammerle, A.; Tappeiner, U.; Leitinger, G. Determinants of urban–rural land surface temperature differences—A landscape scale perspective. Landsc. Urban Plan. 2015, 134, 33–42. [Google Scholar] [CrossRef]
- Rotem-Mindali, O.; Michael, Y.; Helman, D.; Lensky, I.M. The role of local land-use on the urban heat island effect of Tel Aviv as assessed from satellite remote sensing. Appl. Geogr. 2015, 56, 145–153. [Google Scholar] [CrossRef]
- Argüeso, D.; Evans, J.P.; Pitman, A.J.; di Luca, A. Effects of city expansion on heat stress under climate change conditions. PLoS ONE 2015, 10, e0117066. [Google Scholar] [CrossRef] [PubMed]
- Russo, S.; Sterl, A. Global changes in seasonal means and extremes of precipitation from daily climate model data. J. Geophys. Res. 2012, 117, D01108. [Google Scholar] [CrossRef]
- Lelieveld, J.; Hadjinicolaou, P.; Kostopoulou, E.; Chenoweth, J.; El Maayar, M.; Giannakopoulos, C.; Hannides, C.; Lange, M.A.; Tanarhte, M.; Tyrlis, E.; et al. Climate change and impacts in the Eastern Mediterranean and the Middle East. Clim. Chang. 2012, 114, 667–687. [Google Scholar] [CrossRef] [PubMed]
- Geneletti, D.; Zardo, L. Ecosystem-based adaptation in cities: An analysis of European urban climate adaptation plans. Land Use Policy 2016, 50, 38–47. [Google Scholar] [CrossRef]
- Fink, H.S. Human-nature for climate action: Nature-based solutions for urban sustainability. Sustainability 2016, 8, 254. [Google Scholar] [CrossRef]
- Kabisch, N.; Frantzeskaki, N.; Pauleit, S.; Naumann, S.; Davis, M.; Artmann, M.; Haase, D.; Knapp, S.; Korn, H.; Stadler, J.; et al. Nature-based solutions to climate change mitigation and adaptation in urban areas: Perspectives on indicators, knowledge gaps, barriers, and opportunities for action. Ecol. Soc. 2016, 21, 39. [Google Scholar] [CrossRef]
- Derkzen, M.L.; van Teeffelen, A.J.A.; Verburg, P.H. Green infrastructure for urban climate adaptation: How do residents’ views on climate impacts and green infrastructure shape adaptation preferences? Landsc. Urban Plan. 2017, 157, 106–130. [Google Scholar] [CrossRef]
- Norton, B.A.; Coutts, A.M.; Livesley, S.J.; Harris, R.J.; Hunter, A.M.; Williams, N.S. Planning for cooler cities: A framework to prioritise green infrastructure to mitigate high temperatures in urban landscapes. Landsc. Urban Plan. 2015, 134, 127–138. [Google Scholar] [CrossRef]
- Miguez, M.G.; Veról, A.P.; de Sousa, M.M.; Rezende, O.M. Urban Floods in Lowlands-Levee Systems, Unplanned Urban Growth and River Restoration Alternative: A Case Study in Brazil. Sustainability 2015, 7, 11068–11097. [Google Scholar] [CrossRef]
- Gilbert-Norton, L.; Wilson, R.; Stevens, J.R.; Beard, K.H. A meta-analytic review of corridor effectiveness. Conserv. Biol. 2010, 24, 660–668. [Google Scholar] [CrossRef] [PubMed]
- Yin, S.; Shen, Z.; Zhou, P.; Zou, X.; Che, S.; Wang, W. Quantifying air pollution attenuation within urban parks: An experimental approach in Shanghai, China. Environ. Pollut. 2011, 159, 2155–2163. [Google Scholar] [CrossRef] [PubMed]
- Cohen, P.; Potchter, O.; Schnell, I. The impact of an urban park on air pollution and noise levels in the Mediterranean city of Tel-Aviv, Israel. Environ. Pollut. 2014, 195, 73–83. [Google Scholar] [CrossRef] [PubMed]
- Buchel, S.; Frantzeskaki, N. Citizens’ voice: A case study about perceived ecosystem services by urban park users in Rotterdam, the Netherlands. Ecosyst. Serv. 2015, 12, 169–177. [Google Scholar] [CrossRef]
- Potchter, O.; Cohen, P.; Bitan, A. Climatic behavior of various urban parks during hot and humid summer in the mediterranean city of Tel Aviv, Israel. Int. J. Climatol. 2006, 26, 1695–1711. [Google Scholar] [CrossRef]
- Peschardt, K.K.; Schipperijn, J.; Stigsdotter, U.K. Use of small public urban green spaces (SPUGS). Urban For. Urban Green. 2012, 11, 235–244. [Google Scholar] [CrossRef]
- Kabisch, N.; Qureshi, S.; Haase, D. Human-environment interactions in urban green spaces—A systematic review of contemporary issues and prospects for future research. Environ. Impact Assess. Rev. 2015, 50, 25–34. [Google Scholar] [CrossRef]
- Campbell-Lendrum, D.; Corvalán, C. Climate change and developing country-cities: Implications for environmental health and equity. J. Urban Health Bull. N. Y. Acad. Med. 2007, 84, 109–117. [Google Scholar] [CrossRef] [PubMed]
- Ortega, J.A.; Razola, L.; Garzón, G. Recent human impacts and change in dynamics and morphology of ephemeral rivers. Natl. Hazards Earth Syst. Sci. 2014, 14, 713–730. [Google Scholar] [CrossRef]
- Searns, R.M. The evolution of greenways as an adaptive urban landscape form. Landsc. Urban Plan. 1995, 33, 65–80. [Google Scholar] [CrossRef]
- Toccolini, A.; Fumagalli, N.; Senes, G. Greenways planning in Italy: The Lambro River Valley Greenways System. Landsc. Urban Plan. 2006, 76, 98–111. [Google Scholar] [CrossRef]
- Qiao, L.; Zhang, Y.; Qi, A.; Luo, H. Structural planning of urban green space system—A case study of Xuchang, China. J. Food Agric. Environ. 2013, 11, 1421–1425. [Google Scholar]
- Lee, Y.C.; Kim, K.H. Attitudes of citizens towards urban parks and green spaces for urban sustainability: The case of Gyeongsan City, Republic of Korea. Sustainability 2015, 7, 8240–8254. [Google Scholar] [CrossRef]
- Charalambous, K.; Bruggeman, A.; Bakirtzis, N.; Lange, M.A. Historical flooding of the Pedieos River in Nicosia, Cyprus. J. Water Hist. 2016, 8, 191–207. [Google Scholar] [CrossRef]
- Cystat. Population Census 1982 and 2011—Place of Residence; Cyprus Statistical Service: Nicosia, Cyprus, 2015. Available online: http://www.mof.gov.cy/mof/cystat/statistics.nsf (accessed on 16 December 2015).
- Copernicus Land Monitoring Services, CLC 2012. Available online: http://land.copernicus.eu/pan-european/corine-land-cover/clc-2012 (accessed on 7 September 2016).
- Camera, C.; Bruggeman, A.; Hadjinicolaou, P.; Michaelides, S.; Lange, M.A. Evaluation of a spatial rainfall generator for generating high resolution precipitation projections over orographically complex terrain. Stoch. Environ. Res. Risk Assess. 2016. [Google Scholar] [CrossRef]
- ISO 10551. Ergonomics of the Thermal Environment—Assessment of the Influence of the Thermal Environment Using Subjective Judgement Scales; International Organization for Standardization: Geneva, Switzerland, 1995. [Google Scholar]
- Van Hove, L.W.A.; Jacobs, C.M.J.; Heusinkveld, B.G.; Elbers, J.A.; Holtslag, A.A.M. Temporal and spatial variability of urban heat island and thermal comfort within the Rotterdam agglomeration. Build. Environ. 2015, 83, 91–103. [Google Scholar] [CrossRef]
- ISO 7730. Ergonomics of the Thermal Environment—Analytical Determination and Interpretation of Thermal Comfort Using Calculation of the PMV and PPD Indices and Local Thermal Comfort Criteria; International Organization for Standardization: Geneva, Switzerland, 2005. [Google Scholar]
- Knez, I.; Thorsson, S.; Eliasson, I.; Lindberg, F. Psychological mechanisms in outdoor place and weather assessment: Towards a conceptual model. Int. J. Biometeorol. 2009, 53, 101–111. [Google Scholar] [CrossRef] [PubMed]
- Thom, E.C. The discomfort index. Weatherwise 1959, 12, 57–60. [Google Scholar] [CrossRef]
- Poupkou, A.; Nastos, P.; Melas, D.; Zerefos, C. Climatology of discomfort index and air quality index in a large urban Mediterranean agglomeration. Water Air Soil Pollut. 2011, 222, 163–183. [Google Scholar] [CrossRef]
- Din, M.F.M.; Lee, Y.Y.; Ponraj, M.; Ossen, D.R.; Iwao, K.; Chelliapan, S. Thermal comfort of various building layouts with a proposed discomfort index range for tropical climate. J. Therm. Biol. 2014, 41, 6–15. [Google Scholar] [CrossRef] [PubMed]
- Papanastasiou, D.K.; Melas, D.; Kambezidis, H.D. Air quality and thermal comfort levels under extreme hot weather. Atmos. Res. 2015, 152, 4–13. [Google Scholar] [CrossRef]
- Giannakis, E.; Bruggeman, A.; Zoumides, C.; Charalambous, K.; Camera, C.; Stein, U.; Tröltzsch, J.; Davis, M.; Verkerk, H.; Robert, N.; et al. Pedieos River Basin Adaptation Plan; The Cyprus Institute: Nicosia, Cyprus, 2016. [Google Scholar]
- Irvine, K.N.; Warber, S.L.; Devine-Wright, P.; Gaston, K.J. Understanding urban green space as a health resource: A qualitative comparison of visit motivation and derived effects among park users in Sheffield, UK. Int. J. Environ. Res. Public Health 2013, 10, 417–442. [Google Scholar] [CrossRef] [PubMed]
- Brown, G.; Schebella, M.F.; Weber, D. Using participatory GIS to measure physical activity and urban park benefits. Landsc. Urban Plan. 2014, 121, 34–44. [Google Scholar] [CrossRef]
- Bowler, D.E.; Buyung-Ali, L.M.; Knight, T.M.; Pullin, A.S. A systematic review of evidence for the added benefits to health of exposure to natural environments. BMC Public Health 2010, 10, 456. [Google Scholar] [CrossRef] [PubMed]
- Kaczynski, A.T.; Henderson, K.A. Environmental correlates of physical activity: A review of evidence about parks and recreation. Leis. Sci. 2007, 29, 315–354. [Google Scholar] [CrossRef]
- Brown, R.D.; Vanos, J.; Kenny, N.; Lenzholzer, S. Designing urban parks that ameliorate the effects of climate change. Landsc. Urban Plan. 2015, 138, 118–131. [Google Scholar] [CrossRef]
- Skoulika, F.; Santamouris, M.; Kolokotsa, D.; Boemi, N. On the thermal characteristics and the mitigation potential of a medium size urban park in Athens, Greece. Landsc. Urban Plan. 2014, 123, 73–86. [Google Scholar] [CrossRef]
- Oliveira, S.; Andrade, H.; Vaz, T. The cooling effect of green spaces as a contribution to the mitigation of urban heat: A case study in Lisbon. Build. Environ. 2011, 46, 2186–2194. [Google Scholar] [CrossRef]
- Sun, R.; Chen, L. How can urban water bodies be designed for climate adaptation? Landsc. Urban Plan. 2012, 105, 27–33. [Google Scholar] [CrossRef]
- Steeneveld, G.J.; Koopmans, S.; Heusinkveld, B.G.; Theeuwes, N.E. Refreshing the role of open water surfaces on mitigating the maximum urban heat island effect. Landsc. Urban Plan. 2014, 121, 92–96. [Google Scholar] [CrossRef]
- Nikolopoulou, M.; Lykoudis, S. Thermal comfort in outdoor urban spaces: Analysis across different European countries. Build. Environ. 2006, 41, 1455–1470. [Google Scholar] [CrossRef]
- Nikolopoulou, M.; Steemers, K. Thermal comfort and psychological adaptation as a guide for designing urban spaces. Energy Build. 2003, 35, 95–101. [Google Scholar] [CrossRef]
- Matzarakis, A.; Mayer, H.; Iziomon, M.G. Applications of a universal thermal index: Physiological equivalent temperature. Int. J. Biometeorol. 1999, 43, 76–84. [Google Scholar] [CrossRef] [PubMed]
- Jendritzky, G.; de Dear, R.; Havenith, G. UTCI—Why another thermal index? Int. J. Biometeorol. 2012, 56, 421–428. [Google Scholar] [CrossRef] [PubMed] [Green Version]


| Characteristics/Opinions | |
|---|---|
| Average number of visitors per hour | |
| high vegetation—morning | 15 |
| high vegetation—evening | 63 |
| medium vegetation—morning | 20 |
| medium vegetation—evening | 42 |
| low vegetation—morning | 19 |
| low vegetation—evening | 62 |
| Distribution of respondents | % |
| high vegetation | 31 |
| medium vegetation | 30 |
| low vegetation | 38 |
| Age | |
| less than 20 years old | 6 |
| 21–40 years old | 31 |
| 41–60 years old | 44 |
| older than 61 years old | 20 |
| Gender | |
| male | 57 |
| female | 43 |
| Frequency of visits | |
| first visit | 4 |
| more than once a week | 94 |
| few times a year | 2 |
| Climate change concerns | |
| yes | 81 |
| no | 16 |
| no opinion | 3 |
| Contributing to park maintenance | |
| yes | 86 |
| no | 14 |
| If yes, how: | |
| financially | 12 |
| voluntarily | 58 |
| both financially and voluntarily | 28 |
| other | 2 |
| Park Services | Very Dissatisfied | Dissatisfied | Neutral | Satisfied | Very Satisfied | Mean Score * |
|---|---|---|---|---|---|---|
| Nature | 3 | 16 | 2 | 59 | 20 | 3.8 |
| Physical activities | 3 | 23 | 5 | 55 | 14 | 3.6 |
| Social interaction | 9 | 28 | 17 | 41 | 5 | 3.1 |
| Cooling | 1 | 11 | 3 | 69 | 15 | 3.9 |
| Variables | Coefficients | Std. Error | p Value | Odds Ratio |
|---|---|---|---|---|
| TEMP | −0.363 | 0.063 | 0.000 | 0.70 |
| HUM | −0.034 | 0.013 | 0.011 | 0.96 |
| WIND | 0.394 | 0.151 | 0.009 | 1.48 |
| Discomfort Index Conditions | DI Range | Number of Visitors | Park User Perceptions (%) | ||||
|---|---|---|---|---|---|---|---|
| Very Uncomfortable | Uncomfortable | Neutral | Comfortable | Very Comfortable | |||
| Less than 50% of population feels discomfort | 21 ≤ DI < 24 | 63 | 0 | 3 | 8 | 57 | 32 |
| More than 50% of population feels discomfort | 24 ≤ DI < 27 | 226 | 4 | 15 | 7 | 60 | 14 |
| Most of the population suffers discomfort | 27 ≤ DI < 29 | 16 | 6 | 31 | 31 | 31 | 0 |
© 2016 by the authors; licensee MDPI, Basel, Switzerland. This article is an open access article distributed under the terms and conditions of the Creative Commons Attribution (CC-BY) license (http://creativecommons.org/licenses/by/4.0/).
Share and Cite
Giannakis, E.; Bruggeman, A.; Poulou, D.; Zoumides, C.; Eliades, M. Linear Parks along Urban Rivers: Perceptions of Thermal Comfort and Climate Change Adaptation in Cyprus. Sustainability 2016, 8, 1023. https://doi.org/10.3390/su8101023
Giannakis E, Bruggeman A, Poulou D, Zoumides C, Eliades M. Linear Parks along Urban Rivers: Perceptions of Thermal Comfort and Climate Change Adaptation in Cyprus. Sustainability. 2016; 8(10):1023. https://doi.org/10.3390/su8101023
Chicago/Turabian StyleGiannakis, Elias, Adriana Bruggeman, Dimitra Poulou, Christos Zoumides, and Marinos Eliades. 2016. "Linear Parks along Urban Rivers: Perceptions of Thermal Comfort and Climate Change Adaptation in Cyprus" Sustainability 8, no. 10: 1023. https://doi.org/10.3390/su8101023