Article

Simulating the Impact of Economic and Environmental Strategies on Future Urban Growth Scenarios in Ningbo, China

1
School of Geography, Planning and Environmental Management, The University of Queensland, Brisbane, QLD 4072, Australia
2
College of Marine Sciences, Shanghai Ocean University, Shanghai 201306, China
3
The Key Laboratory of Sustainable Exploitation of Oceanic Fisheries Resources (Ministry of Education), Shanghai Ocean University, Shanghai 201306, China
*
Author to whom correspondence should be addressed.
Sustainability 2016, 8(10), 1045; https://doi.org/10.3390/su8101045
Submission received: 7 October 2016 / Revised: 7 October 2016 / Accepted: 13 October 2016 / Published: 18 October 2016
(This article belongs to the Section Sustainable Urban and Rural Development)

Abstract

:
Coastal cities in China are challenged by multiple growth paths and strategies related to demands in the housing market, economic growth and eco-system protection. This paper examines the effects of conflicting strategies between economic growth and environmental protection on future urban scenarios in Ningbo, China, through logistic-regression-based cellular automata (termed LogCA) modeling. The LogCA model is calibrated based on the observed urban patterns in 1990 and 2015, and applied to simulate four future scenarios in 2040, including (a) the Norm-scenario, a baseline scenario that maintains the 1990–2015 growth rate; (b) the GDP-scenario, a GDP-oriented growth scenario emphasizing the development in city centers and along economic corridors; (c) the Slow-scenario, a slow-growth scenario considering the potential downward trend of the housing market in China; and (d) the Eco-scenario, a slow-growth scenario emphasizing natural conservation and ecosystem protections. The CA parameters of the Norm- and Slow-scenarios are the same as the calibrated parameters, while the parameters of proximities to economic corridors and natural scenery sites were increased by a factor of 3 for the GDP- and Eco-scenarios, respectively. The Norm- and GDP-scenarios predicted 1950 km2 of new growth for the next 25 years, the Slow-scenario predicted 650 km2, and the Eco-scenario predicted less growth than the Slow-scenario. The locations where the newly built-up area will emerge are significantly different under the four scenarios and the Slow- and Eco-scenarios are preferable to achieve long-term sustainability. The scenarios are not only helpful for exploring sustainable urban development options in China, but also serve as a reference for adjusting the urban planning and land policies.

1. Introduction

The coastal cities are the most densely populated urban settlements and are also growing very rapidly. Particularly in China, rapid growth and globalization of the domestic economy have dramatically accelerated urban growth [1,2]. In 2014, there were 88 municipalities and prefecture-level cities each with more than 5 million people, nearly 40% of which were located in coastal areas [3]. Many cities are increasing uncontrollably in size in terms of both their non-agricultural population and the size of the built-up areas [4]. This is largely driven by the growing demand for higher living standards, higher incomes and better-living conditions [5]. The increasing effects of human activities on the physical environment of coastal cities have resulted in many unplanned or underplanned land use and land cover changes [6], undermining long-term sustainability. For instance, rapid urbanization and industrialization have led to serious environmental problems such as air and water pollutions [7,8,9,10]. Inevitably, there is growing public awareness of and demand for environmental protection. Different strategic directions for coastal city development have been proposed under the somehow conflicting demands for economic growth and environmental protection. Consequently, there is an urgent need to predict and assess the potential impact of different development strategies and the urban growth scenarios that these strategies would produce.
One common approach to predict future development is using a cellular automata (CA) based simulation approach. Over the past decades, CA has grown as a spatial simulation tool to investigate the dynamics of human-environment systems and their interactions [11,12,13,14,15]. Many studies on CA have concentrated on the definition of transition rules using different methods, which include logistic regression [16,17,18], particle swarm optimization [19], fuzzy set [20,21], simulated annealing algorithm [22], genetic algorithm [23,24], higher dimensional space [25,26], and Markov chain [27,28,29]. The CA models are usually applied in simulating and understanding the urban dynamics [30,31,32] and land use and cover change [33,34,35].
Among the above models, the logistic CA model (termed as LogCA hereafter) was the earliest approach proposed by Wu [13] to capture and calibrate the CA transition rules to simulate the rural-to-urban land transition in Guangzhou of China. This type of CA model has been widely adopted to simulate dynamic urban growth due to its effectiveness in addressing the urban dynamics [16,18]. Liu and Feng [17] extended the LogCA model by applying continuous cell states to represent the progressive rural-to-urban land transition, with a case study of Gold Coast, Australia. Reference [28] incorporated a Markov chain into the LogCA model to build a hybrid CA model for modeling dynamic land change in the Poyang Lake region of China. These studies show that the structure of the LogCA model allows for flexibility in incorporating changes into development regulations; it also allows for detailed spatial interaction settings to model urban growth drivers and processes.
While geographical information system (GIS) based CA models have been applied in a range of urban contexts to simulate urban growth, most of the existing research focuses on model calibration and testing. It is more challenging to predict future growth, particularly in the rapidly changing contemporary Chinese economy and its urban landscape [36]. It is necessary for policymakers to use science- and evidence-based scenario modeling to guide future urban development and be able to adequately assess the impact of different strategies, whether the focus is on economic growth or environmental protection [37]. Although CA-based urban and land use modeling in Chinese cities have been extensively documented [19,22,28,38,39], few are concerned with predicting possible future scenarios, especially at the current turning point in time concerning urbanization, population growth, economic prosperity, and environmental protection [40]. Ningbo is an important harbor city situated in the east coastal area of Zhejiang province, China. During the past 25 years, from 1990 to 2015, the city has witnessed rapid urban growth that has been accelerated by the prosperous housing market. Urbanization encroachment on green space, agricultural land, wetlands and forests has led to the degradation of environments and ecosystems [41]. This stimulated growing public awareness of and demand for environmental protection. Different strategic directions for coastal development have been proposed under somehow conflicting demands for economic growth and environmental protection. As a result, a crucial question has been aroused as to what the future scenarios would be like in Ningbo.
This paper calibrates the LogCA model to simulate future urban scenarios of Ningbo, a rapidly evolving coastal city in eastern China. The LogCA model was built using land use patterns classified from remotely sensed imagery during 1990–2015. Considering the impacts of economic development and environmental protection, four scenarios of urban growth to the year 2040 in Ningbo were constructed: (a) the Norm-scenario, a baseline scenario that maintains the urban growth rate from 1990 to 2015 and rate and bases on the normal transitions in economy; (b) the GDP-scenario, a GDP growth oriented scenario considering the economic corridors; (c) the Slow-scenario, the growth rate is much lower than in the past considering the potential downward trend of the housing market in China; and (d) the Eco-scenario, an ecosystem protection centered scenario considering the needs of environmental protection. By modeling the outcomes of different urban growth strategies, the impact of these strategies on Ningbo’s urban growth will be assessed and compared. The scenarios are not only helpful for exploring future urban development options in Ningbo, but also useful as a reference for decision makers to adjust relevant planning and land management policies in Chinese coastal areas.

2. Materials and Methods
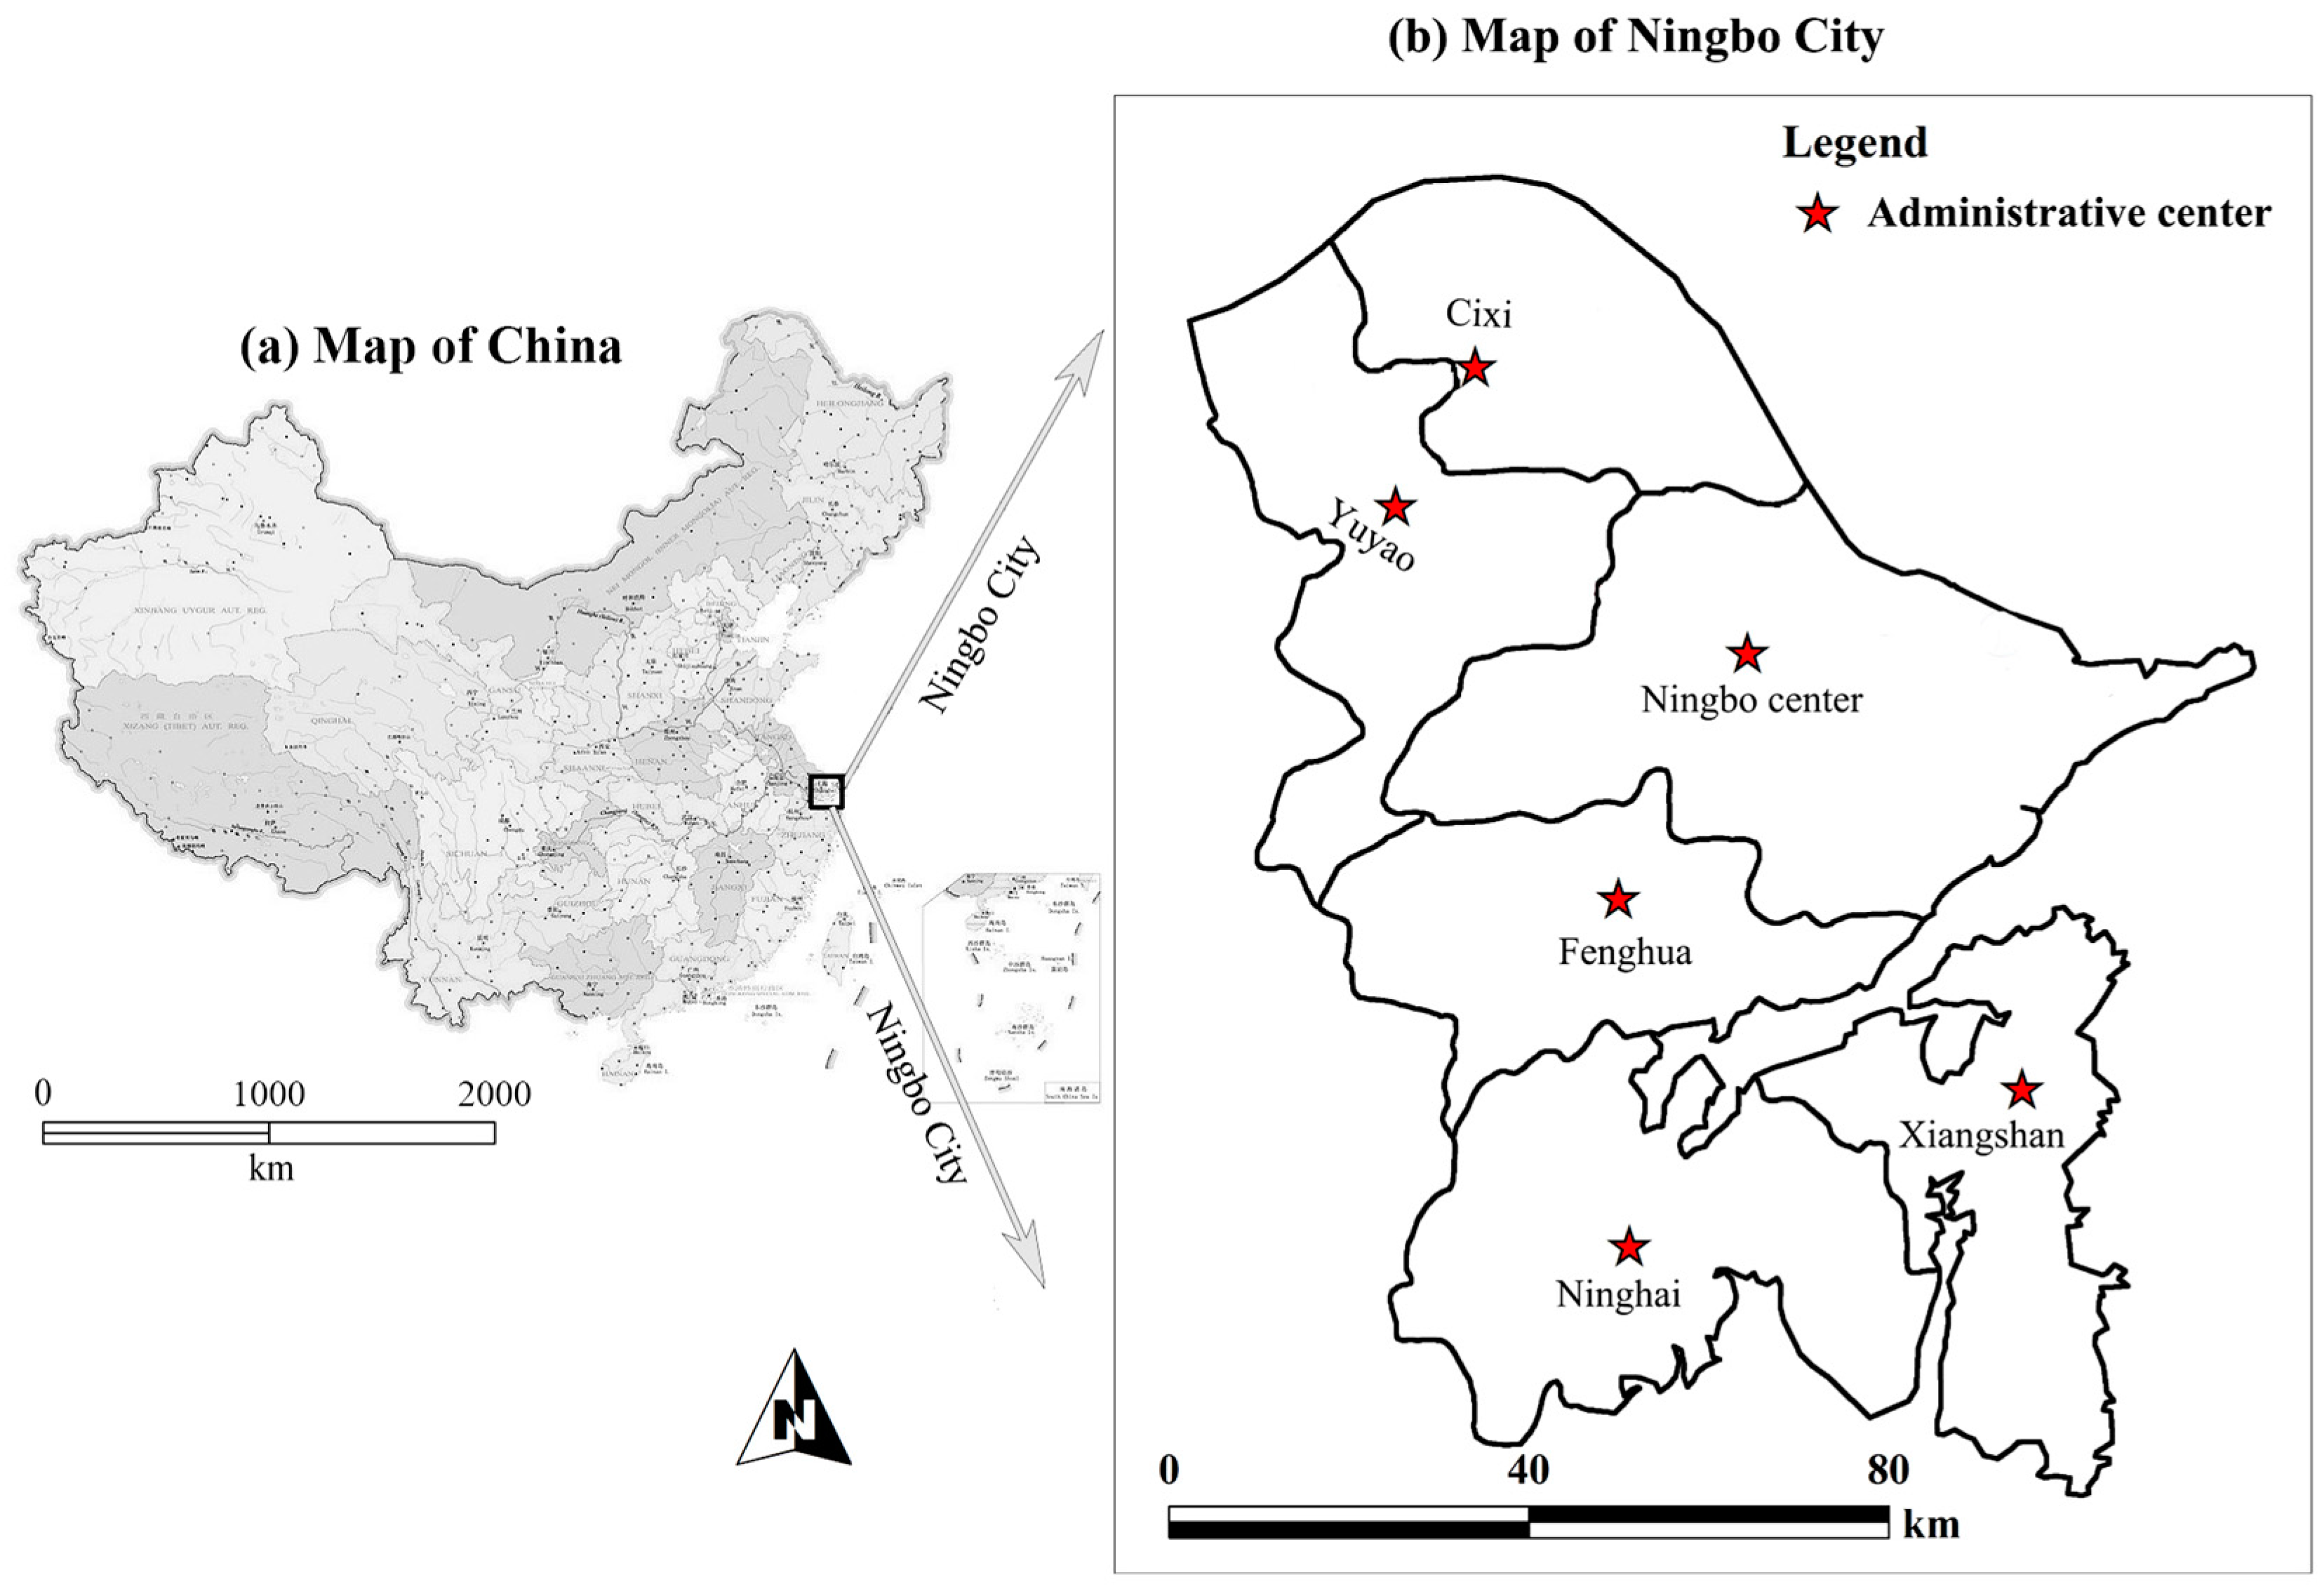
2.1. Study Area

Ningbo is a sub-provincial and port city located in Zhejiang Province, about 220 km south of Shanghai in eastern China. It has a total area of 9671 km2. The area under study is 8653 km2 which includes inland waters and coastal wetlands but exclude sea water. Ningbo comprises the Ningbo City, three satellite cities (i.e., Cixi, Yuyao, and Fenghua), and two counties (Ninghai and Xiangshan) (Figure 1). With a total population of 7.6 million, there were 3.5 million urban inhabitants in Ningbo in 2014 [42]. A beautiful port city with natural landscapes and many cultural attractions, Ningbo is also an important economic hub of Zhejiang Province and a major exporter of food, textiles, electrical products, and industrial tools [43]. In 2014, the total gross domestic product (GDP) of Ningbo was 760.2 billion RMB Yuan (approximately $117 billion USD), 80 percent of which was from the private sector located in Ningbo City and its three satellite cities [42].
Like many other Chinese cities, Ningbo has experienced rapid urban growth over the past 25 years (1990–2015). This growth has resulted in dramatic land use changes with a tenfold expansion of its urban extent, from 213 km2 in 1990 to 2163 km2 in 2015. This remarkable change has been accelerated since 1998 when property commercialization commenced. Rapid urban expansion and the boom in the housing market have threatened the natural landscape and cultural attractions in Ningbo [44]. Subsequently, there are conflicting demands for land resources by various community groups which could result in different development options and affect its future urban growth scenarios. Planners and government authorities must explore and address the question of how the city should grow in the future under different strategies.

2.2. Data

Three types of data were collected: vector data (maps), remotely sensed images and socio-economic datasets (Table 1). The vector data include the administrative boundary map of the city, the transportation map in 2000 and 2015 Ningbo Municipal Tourism Administration [45]. Although many local roads have been constructed in Ningbo after the year 2000, its major road network was constructed prior to the year 2000. Consequently, the 2000 transportation map was used to identify the main road network and quantify the spatial proximity to main roads as one of the key factors that impact urban growth. The tourism map was used to identify natural scenery sites for modeling the ecosystem protection oriented scenario. Two Landsat images, one in 1990 and one in 2015, were collected and classified using the supervised Mahalanobis distance classifier in ENVI version 5.5 to identify the past and current land use patterns. Using the region of interest (ROI) identified for training the classifier, the overall accuracies were 96.3% and 95.7% for 1990 and 2015, respectively. Digital elevation model (DEM) was assembled from the Shuttle Radar Topography Mission (SRTM) to extract land slope and measure land development suitability [46].
The socio-economic data collected from Ningbo Statistical Yearbook [42] were used to estimate the total quantity of developable land and identify the economic corridors for modeling the GDP growth oriented scenario. Three urban centers (including Ningbo City, Cixi, Yuyao), three town centers (including Zhenhai, Guangcheng and Zhouxiang), and the Port of Ningbo were identified as key areas that have contributed to GDP growth (Figure 2, left box). The five-star natural scenery sites whose environment and ecosystem status have been well maintained in the past two decades were identified and used to model the ecosystem protection oriented scenario (Figure 2, right box). All data were resampled to 60 m spatial resolution except for the SRTM DEM to construct the LogCA model.

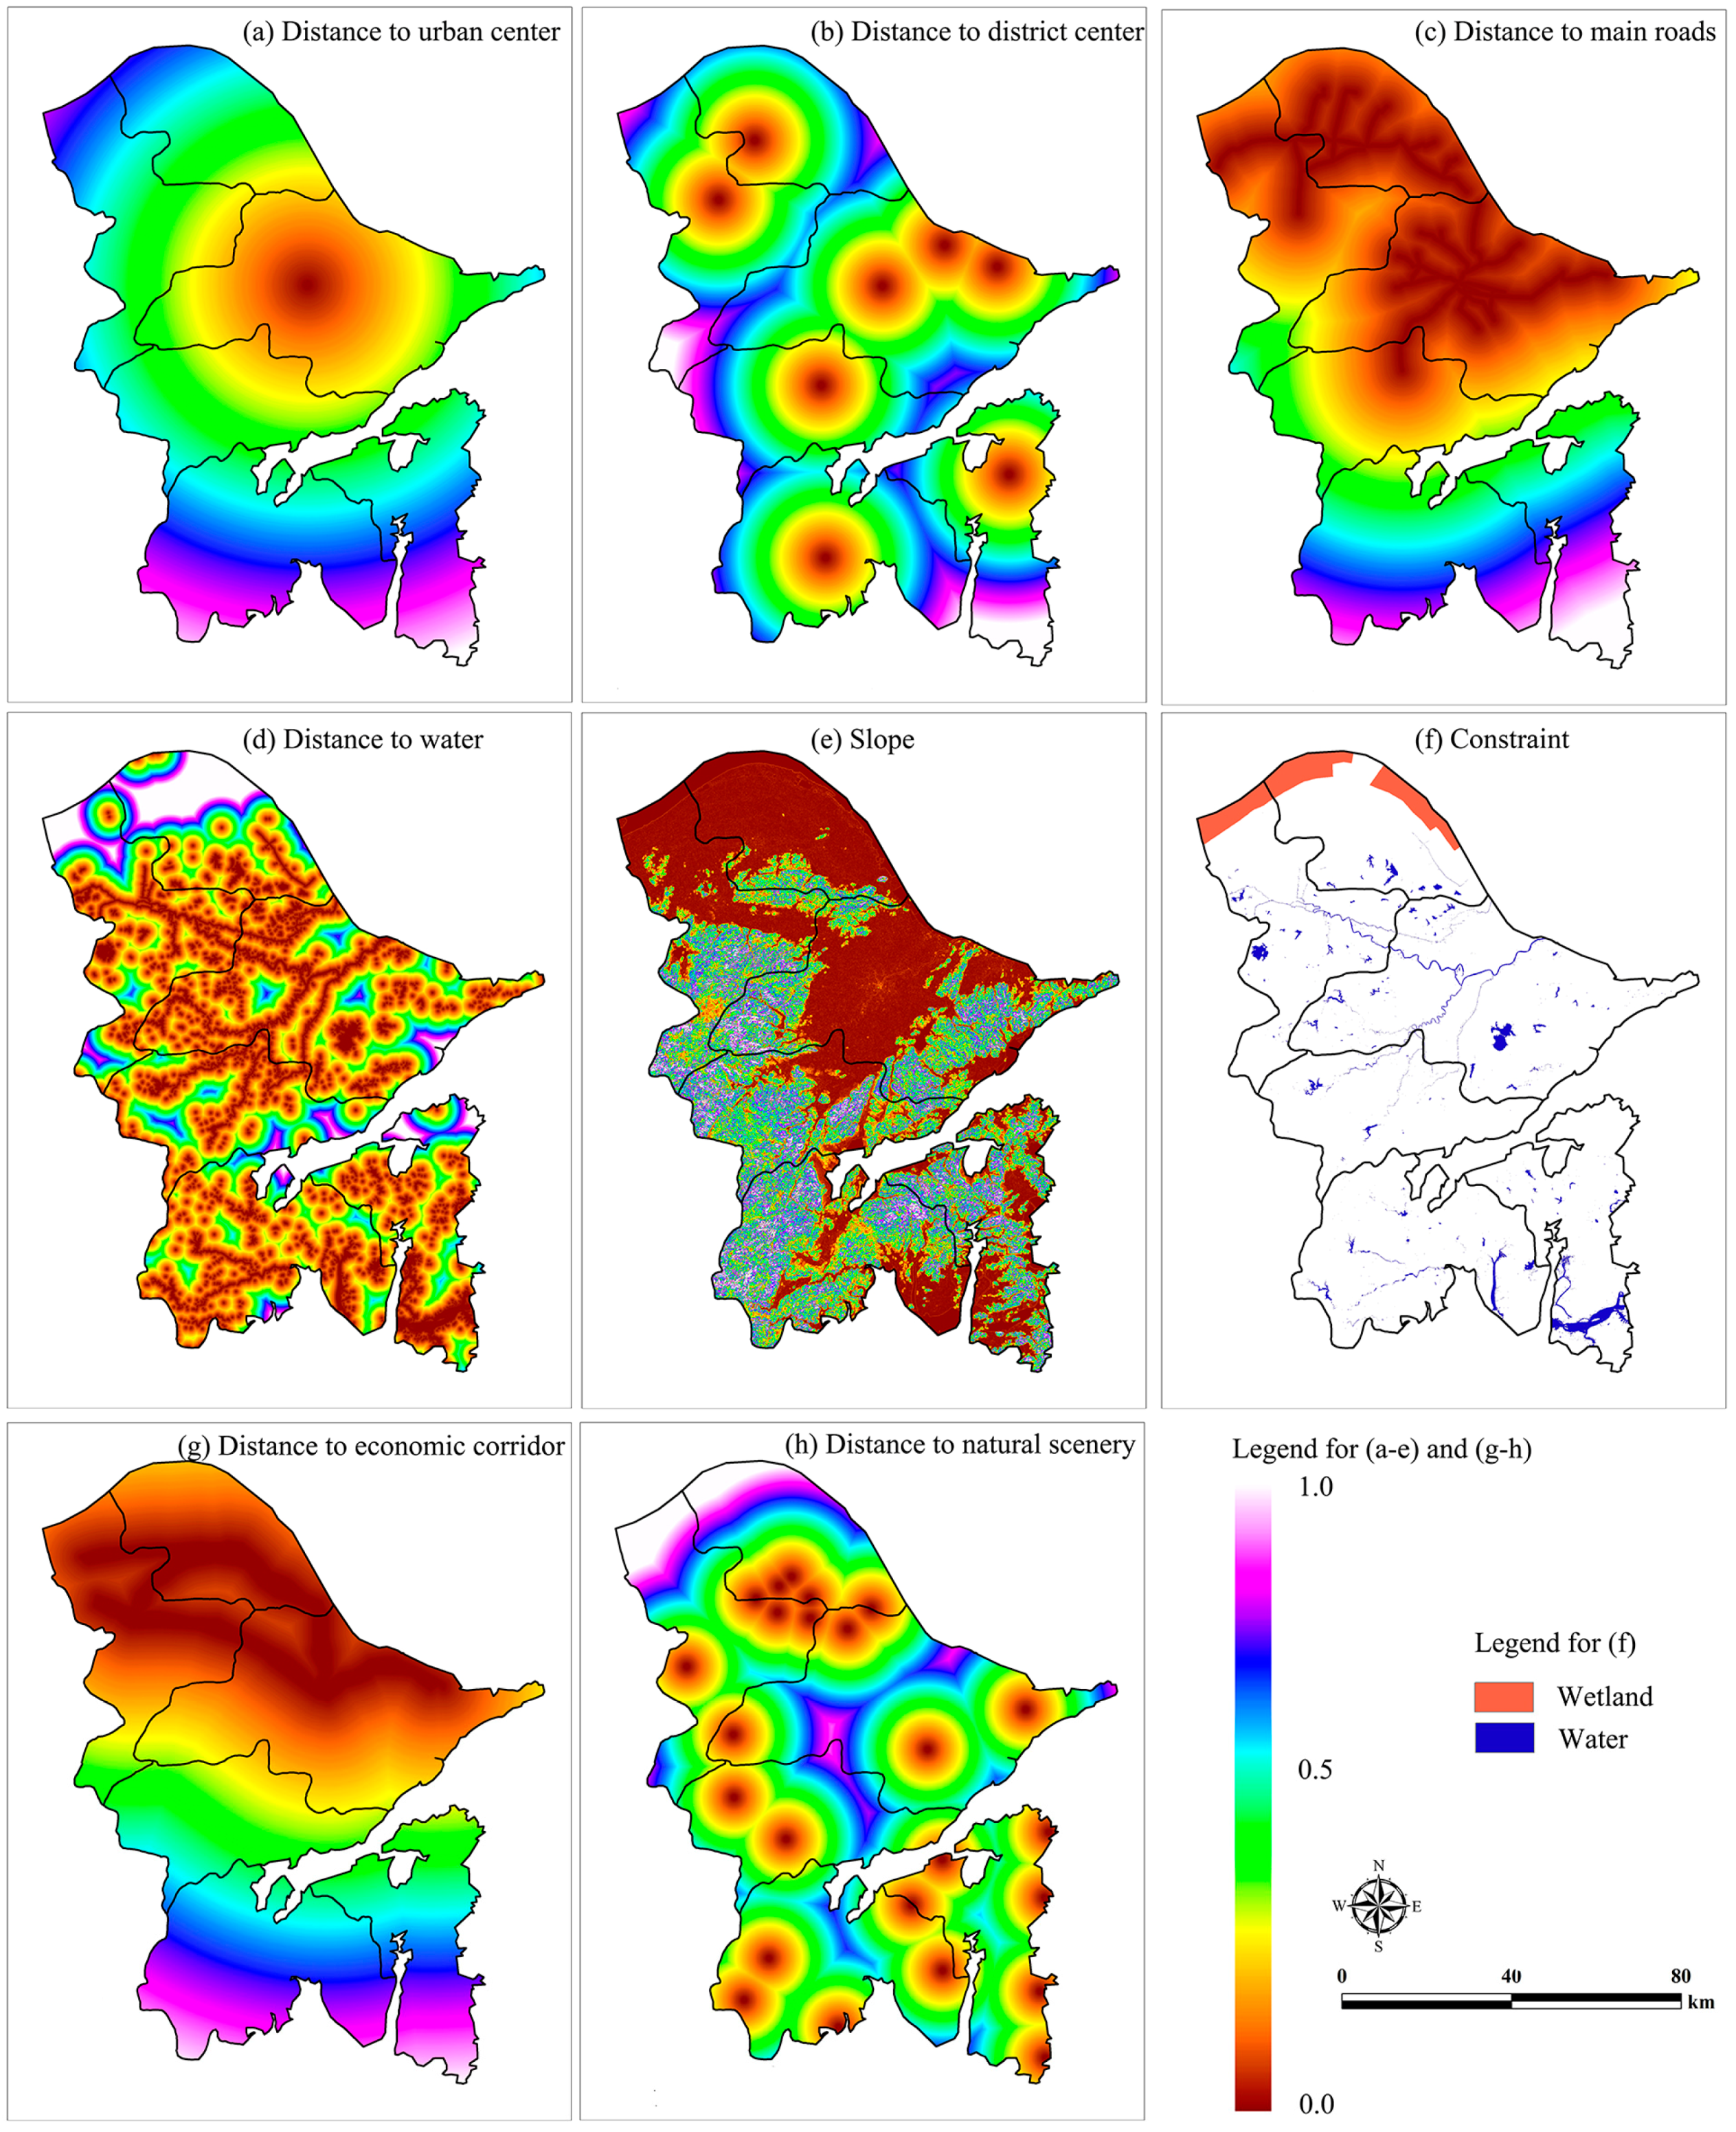
2.3. Variables Used in the LogCA Model

Ten driving factors, including accessibility and proximity-based variables, neighborhood, slope, global and local constraints, and a stochastic perturbation factor (Table 2), were identified to simulate urban growth in Ningbo from 1990 to 2015. These factors were selected considering the geographical and socio-economic conditions of Ningbo as well as by referencing factors affecting the urban growth dynamics of similar coastal cities in China, such as Shanghai [19,22,25,26].
Of the six distance-based variables, Duc, Dtc, Dmr, and Dw have been commonly used in CA models [13,19,47], while Dec and Dns were selected to reflect the economic condition and tourism attraction features in Ningbo. Specifically, Dec was used to model the GDP growth oriented scenario while Dns was used for simulating the ecosystem protection oriented scenario. A stochastic factor was included to represent the factors that might not be clear and the departure from a well-defined process of urban [13,19]. Water bodies and wetlands were considered as local constraints while the total quantity available for development was served as global constraints. Among such factors, the spatial variables and neighborhood factor represent the agglomerative effects of existing built-up areas and supports of infrastructure in contrast to the stochastic and other constraint factors [48,49,50,51]. All spatial and slope variables were normalized using the following equation [26,40]:
D n o r m = D o r i g D m a x D m i n ,
where D n o r m is the normalized value of a variable in the range of [0, 1], D o r i g is the original value, D m a x is the maximum value, and D m i n is the minimum value. To prepare the spatial variables as input layers, they were spatially visualized and mapped in ArcGIS (Figure 3).

2.4. CA Model Calibrated by Logistic Regression

A LogCA model based on logistic regression was built for modeling the spatiotemporal process of urban growth in Ningbo. The parameters of transition rules of the LogCA model were calculated using a logistic regression method [13,17,18,28,52]. In a tessellated space, CA determines the state of a non-urban cell i at time t + 1 as the integrated effects of itself and its neighboring cells at time t according to land transition rules. One-directional rural-to-urban conversion across space and over time was modeled in this study. The probability of the cell being converted into an urban land use state is defined as [22]:
P g i , t = P l i , t × P n i , t × C o n × R ,
where P g i , t is the overall probability of possible conversion of a cell at location i at time t; this is determined by the accumulated effects of its spatial distances, the neighborhood effects, local and global constraints, and the stochastic factors.
P l i , t denotes the local probability of land conversion for cell i at time t as a result of a set of local spatial factors, which can be given by:
P l i , t = 1 1 + exp ( ( a 0 + j = 1 k a j x j ) ) ,
where xj (j = 1, 2, …, k) are driving factors affecting urban growth, a0 is a constant or intercept, and aj (j = 1, 2, …, k) are CA parameters indicating the extent to which each spatial factor affects urban growth. Spatial factors commonly include the proximity of a cell to the urban center, district centers, main roads and other urban facilities. These parameters were derived using logistic regression given that this modeling approach has been proven as reliable in capturing CA parameters [17,28,53].
P n i , t in Equation (2) represents the conversion probability being affected by the state of other cells within its neighborhood. A square neighborhood within m × m cells is commonly used, and the probability of the conversion is given as [54]:
  P n i , t = j m × m ( S i , t = U r b a n ) ( j i ) m × m 1 ,
where j m × m ( S i , t = U r b a n ) indicates the sum of urbanized cells within the neighborhood, excluding the central cell i.
The conversion probability of a non-urban cell is also affected by other constraints, for example, large-scale water bodies and steep areas. These areas would be less likely to be developed due to the high development costs. Primary farmlands are another kinds of areas being constrained from development due to land use regulations. All constraint factors in Equation (2) are represented as Con and can be written as:
C o n = C e l l i ( c o n d i t i o n   = s u i t a b l e ) ,
where Con is either 0 or 1, with 0 meaning the cell i is unavailable, while 1 is available to be developed.
R in Equation (2) is a stochastic factor indicating unforeseen policy changes and other unknown errors [19,25,55]. The factor is defined as:
R = 1 + ( ln   r ) a ,
where r is a randomly generated real number between 0 and 1, and α is a control parameter between 0 and 10 to adjust the impact of R on land conversion probability.
The overall conversion probability P g i , t is compared with a pre-defined threshold value P t h d to determine whether the cell i at time t can be developed [13,56]. If the overall conversion probability is larger than P t h d , the non-urbanized cell will be developed into an urban use in the next time step; otherwise, the cell i will not change its state. The state of cell i at time t + 1, denoted as S i , t + 1 , can be written as:
S i , t + 1 = { U r b a n ,   P g i , t P t h d   N o n U r b a n ,     P g i , t < P t h d ,

3. Results

3.1. Transition Rules Defined in LogCA

Using the stratified sampling method, 8664 sample points were selected from each of the spatial distance data layers to construct the CA transition rules. The CA parameters were retrieved at a p = 0.01 significance level using R-Gui (Table 3). Six parameters were involved in Equation (3) to compute the conversion probability of each cell in the simulation process, therefore to model land use change in Ningbo.
A negative aj (j = 0, 1, …, 6) results in a larger Pgi,t, i.e., a higher potential for cell i to transit from a non-urban into an urban state. In contrast, a positive ai leads to in a lower Pgi,t and hence, a lower potential for the cell to develop further in a subsequent time step. While Duc, Dtc, Dmr, and Dec are all negative, the absolute value of Duc is the smallest, indicating that the impact of Ningbo’s city center is weaker than the other three spatial variables. This is because Ningbo is not a mono-center city like other coastal cities such as Shanghai [26]. Rather, the satellite cities of Cixi and Yuyao have experienced remarkable urban expansion from 1990 to 2015. Among the spatial variables, the distances to the economic corridors (Dec), as well as to main roads (Dmr), have the largest impact on development. Conversely, Dw and Dns are positive, meaning that a cell closer to the water body or natural scenery has a lower probability of being developed into an urban state. Dw has the smallest absolute value amongst all spatial variables, indicating that this factor is least influential on urban growth. When predicting the future urban expansion scenarios to the year 2040, the values of Dec and Dns were increased by a factor of 3 to represent the GDP and Eco-scenarios, respectively.

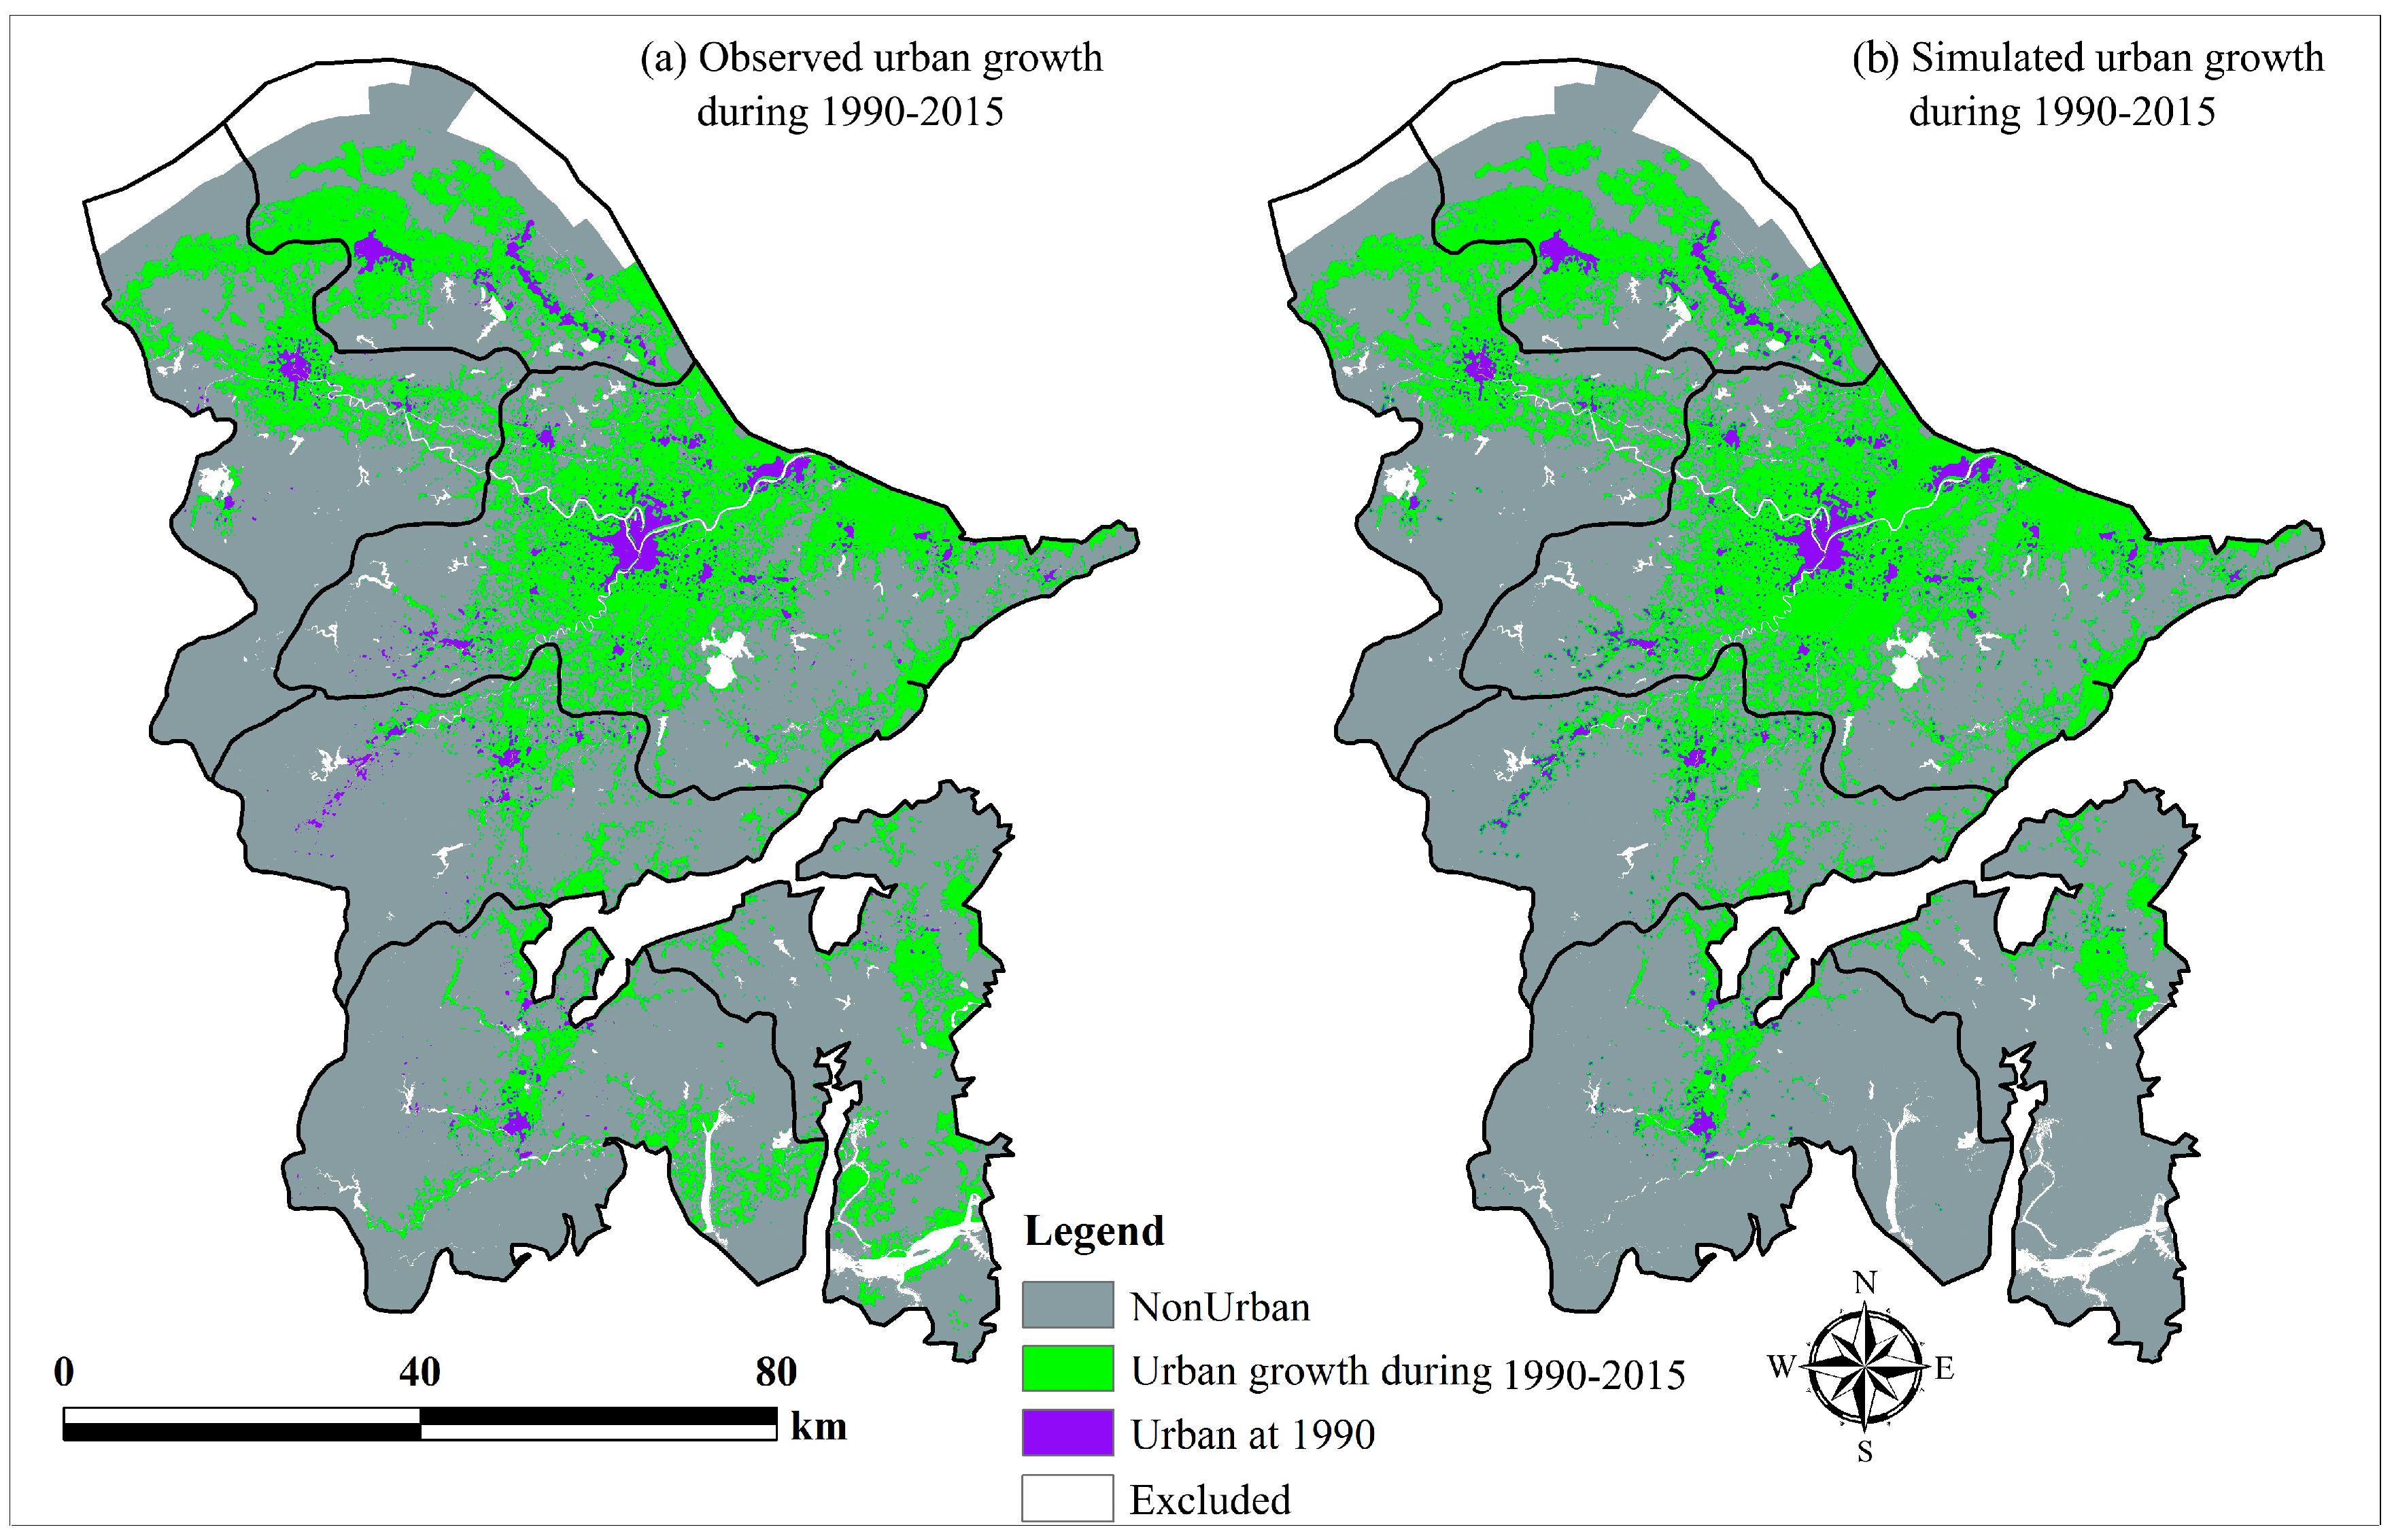
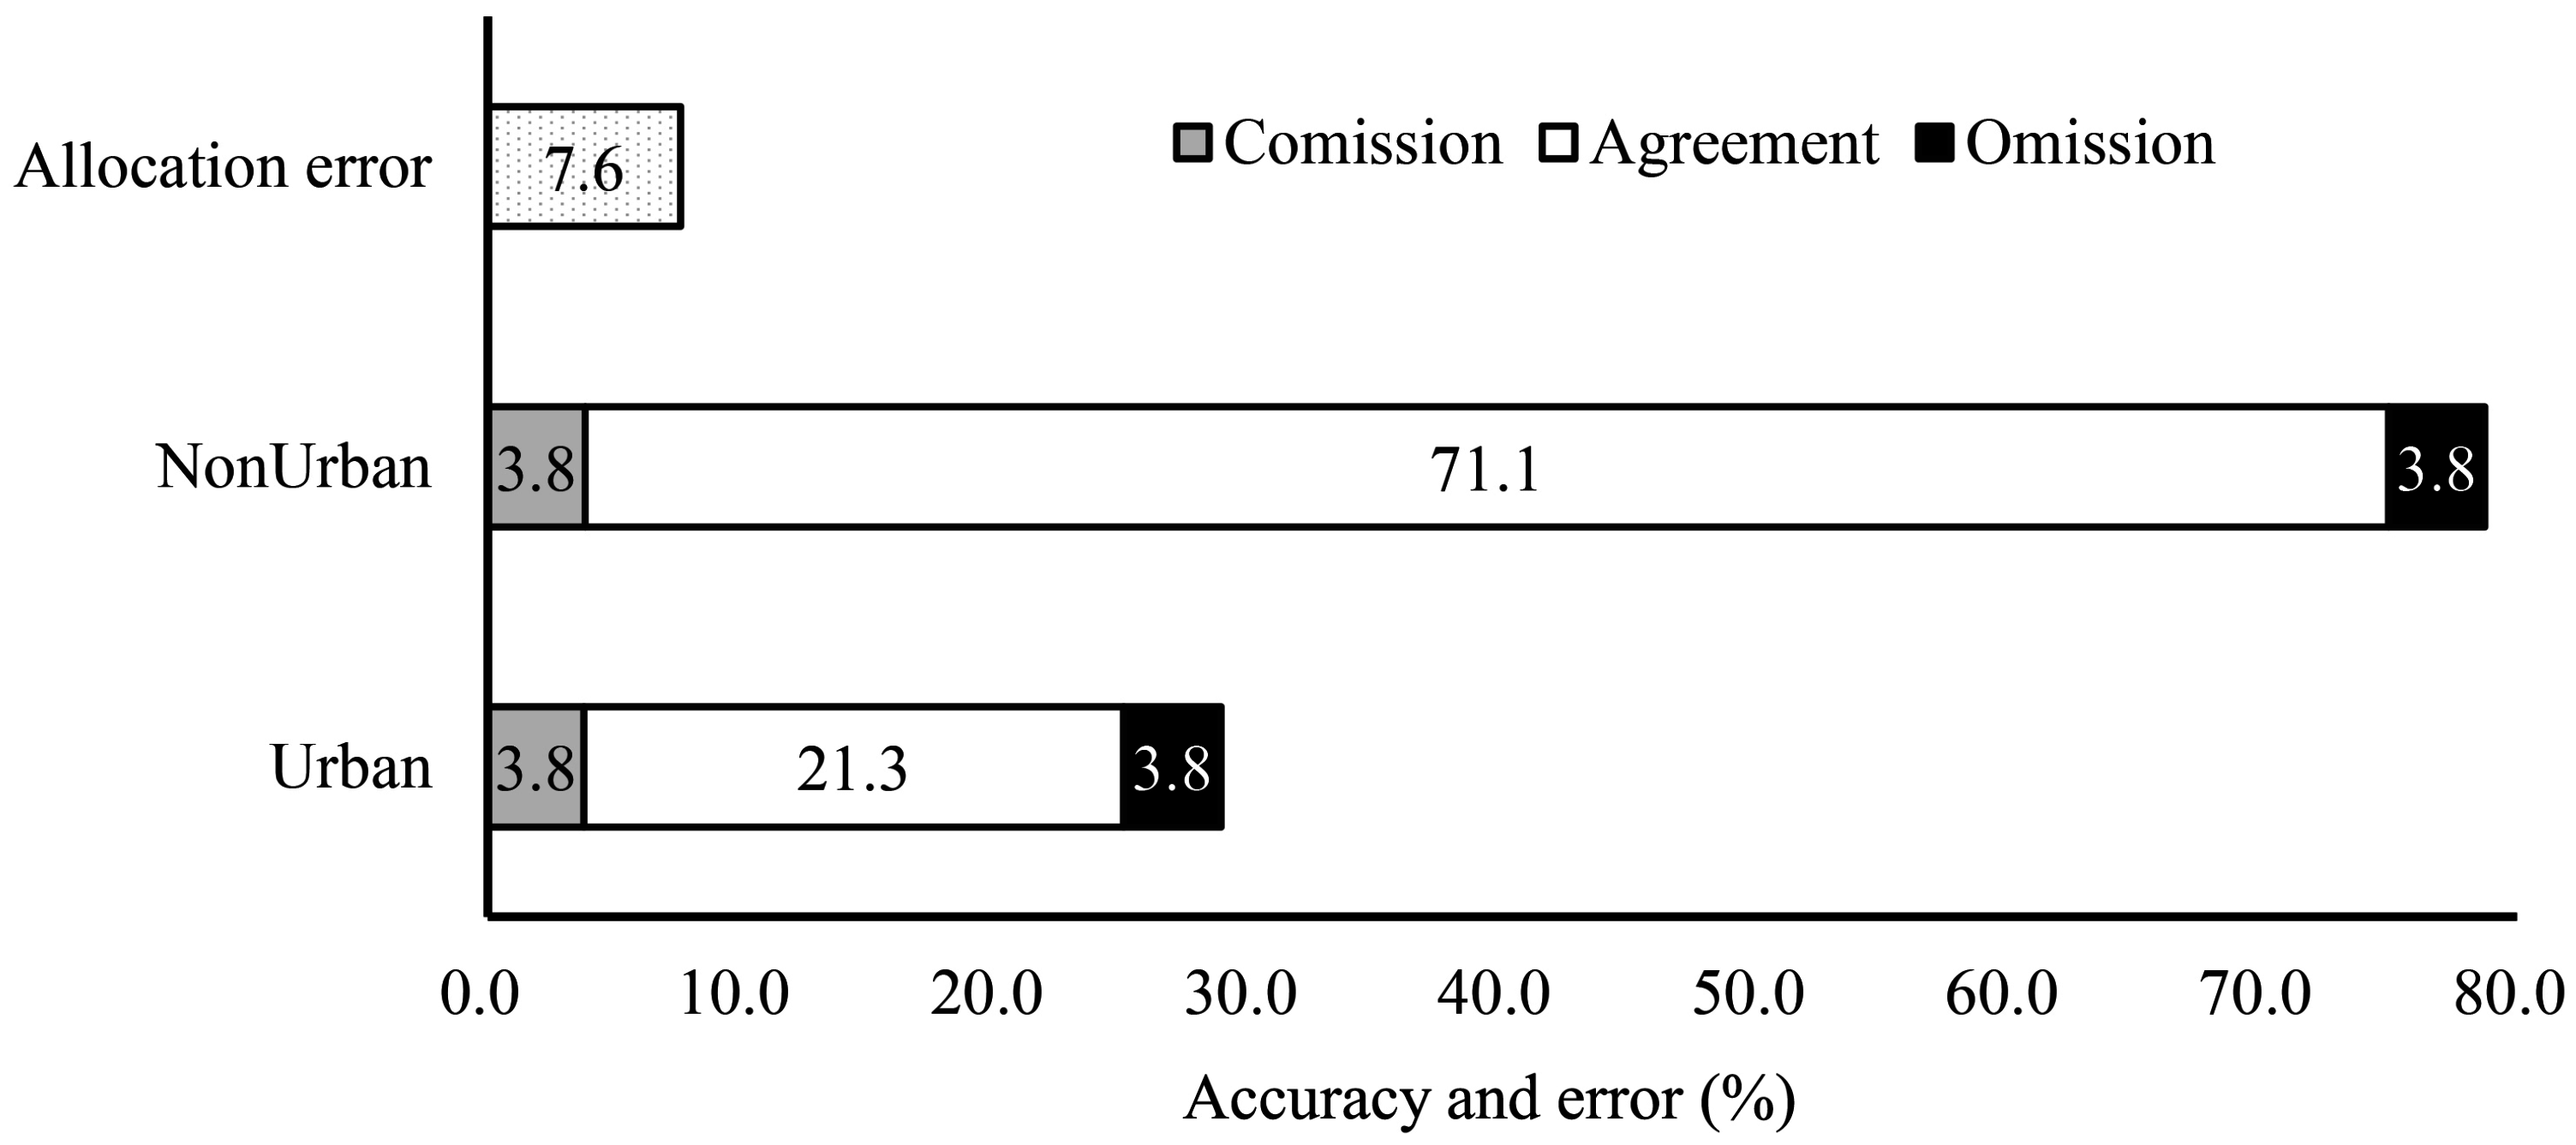
3.2. Model Calibration

For setting the threshold, we selected 16 candidate values between 0.50 and 0.80 with an interval of 0.02. The LogCA model was implemented based on each candidate threshold with 25 iterations, with each iteration representing one year from 1990 to 2015. The LogCA model therefore generated 16 replicates for Ningbo in 2015. Among all replicates, a threshold of 0.62 produced the result with the highest overall accuracy. We therefore simulated the land use pattern in 2015 with a threshold of 0.62 and 25 iterations, which was compared with the observed urban pattern in 2015. The observed urban growth from 1990 to 2015 was the overlaying map of the two classified patterns in 1990 and 2015 (Figure 4a), and the simulated urban growth was the overlaying map of the 1990 classified pattern and the 2015 simulated pattern (Figure 4b).
To assess simulation accuracy, we applied the measures of quantity and allocation agreement and disagreement developed by Pontius, et al. [57]. The results show that the model has achieved an overall agreement of 92.4% with 7.6% allocation disagreement (Figure 5). No quantity disagreement was observed, as the total land available for development was used to restrict the quantity of urban growth in the model. Of the 92.4% accuracy achieved by the LogCA model, 71.1% is due to the correct rejection of non-urban cells while 21.3% is due to the correct simulation of growth. Figure 5 also shows that both the commission and omission errors for urban and non-urban areas are 3.8%, resulting in a total of 7.6% errors. Such simulation accuracies are considered high and acceptable; hence, the model can be used for projecting future urban growth scenarios for the next 25 years under different development strategies.

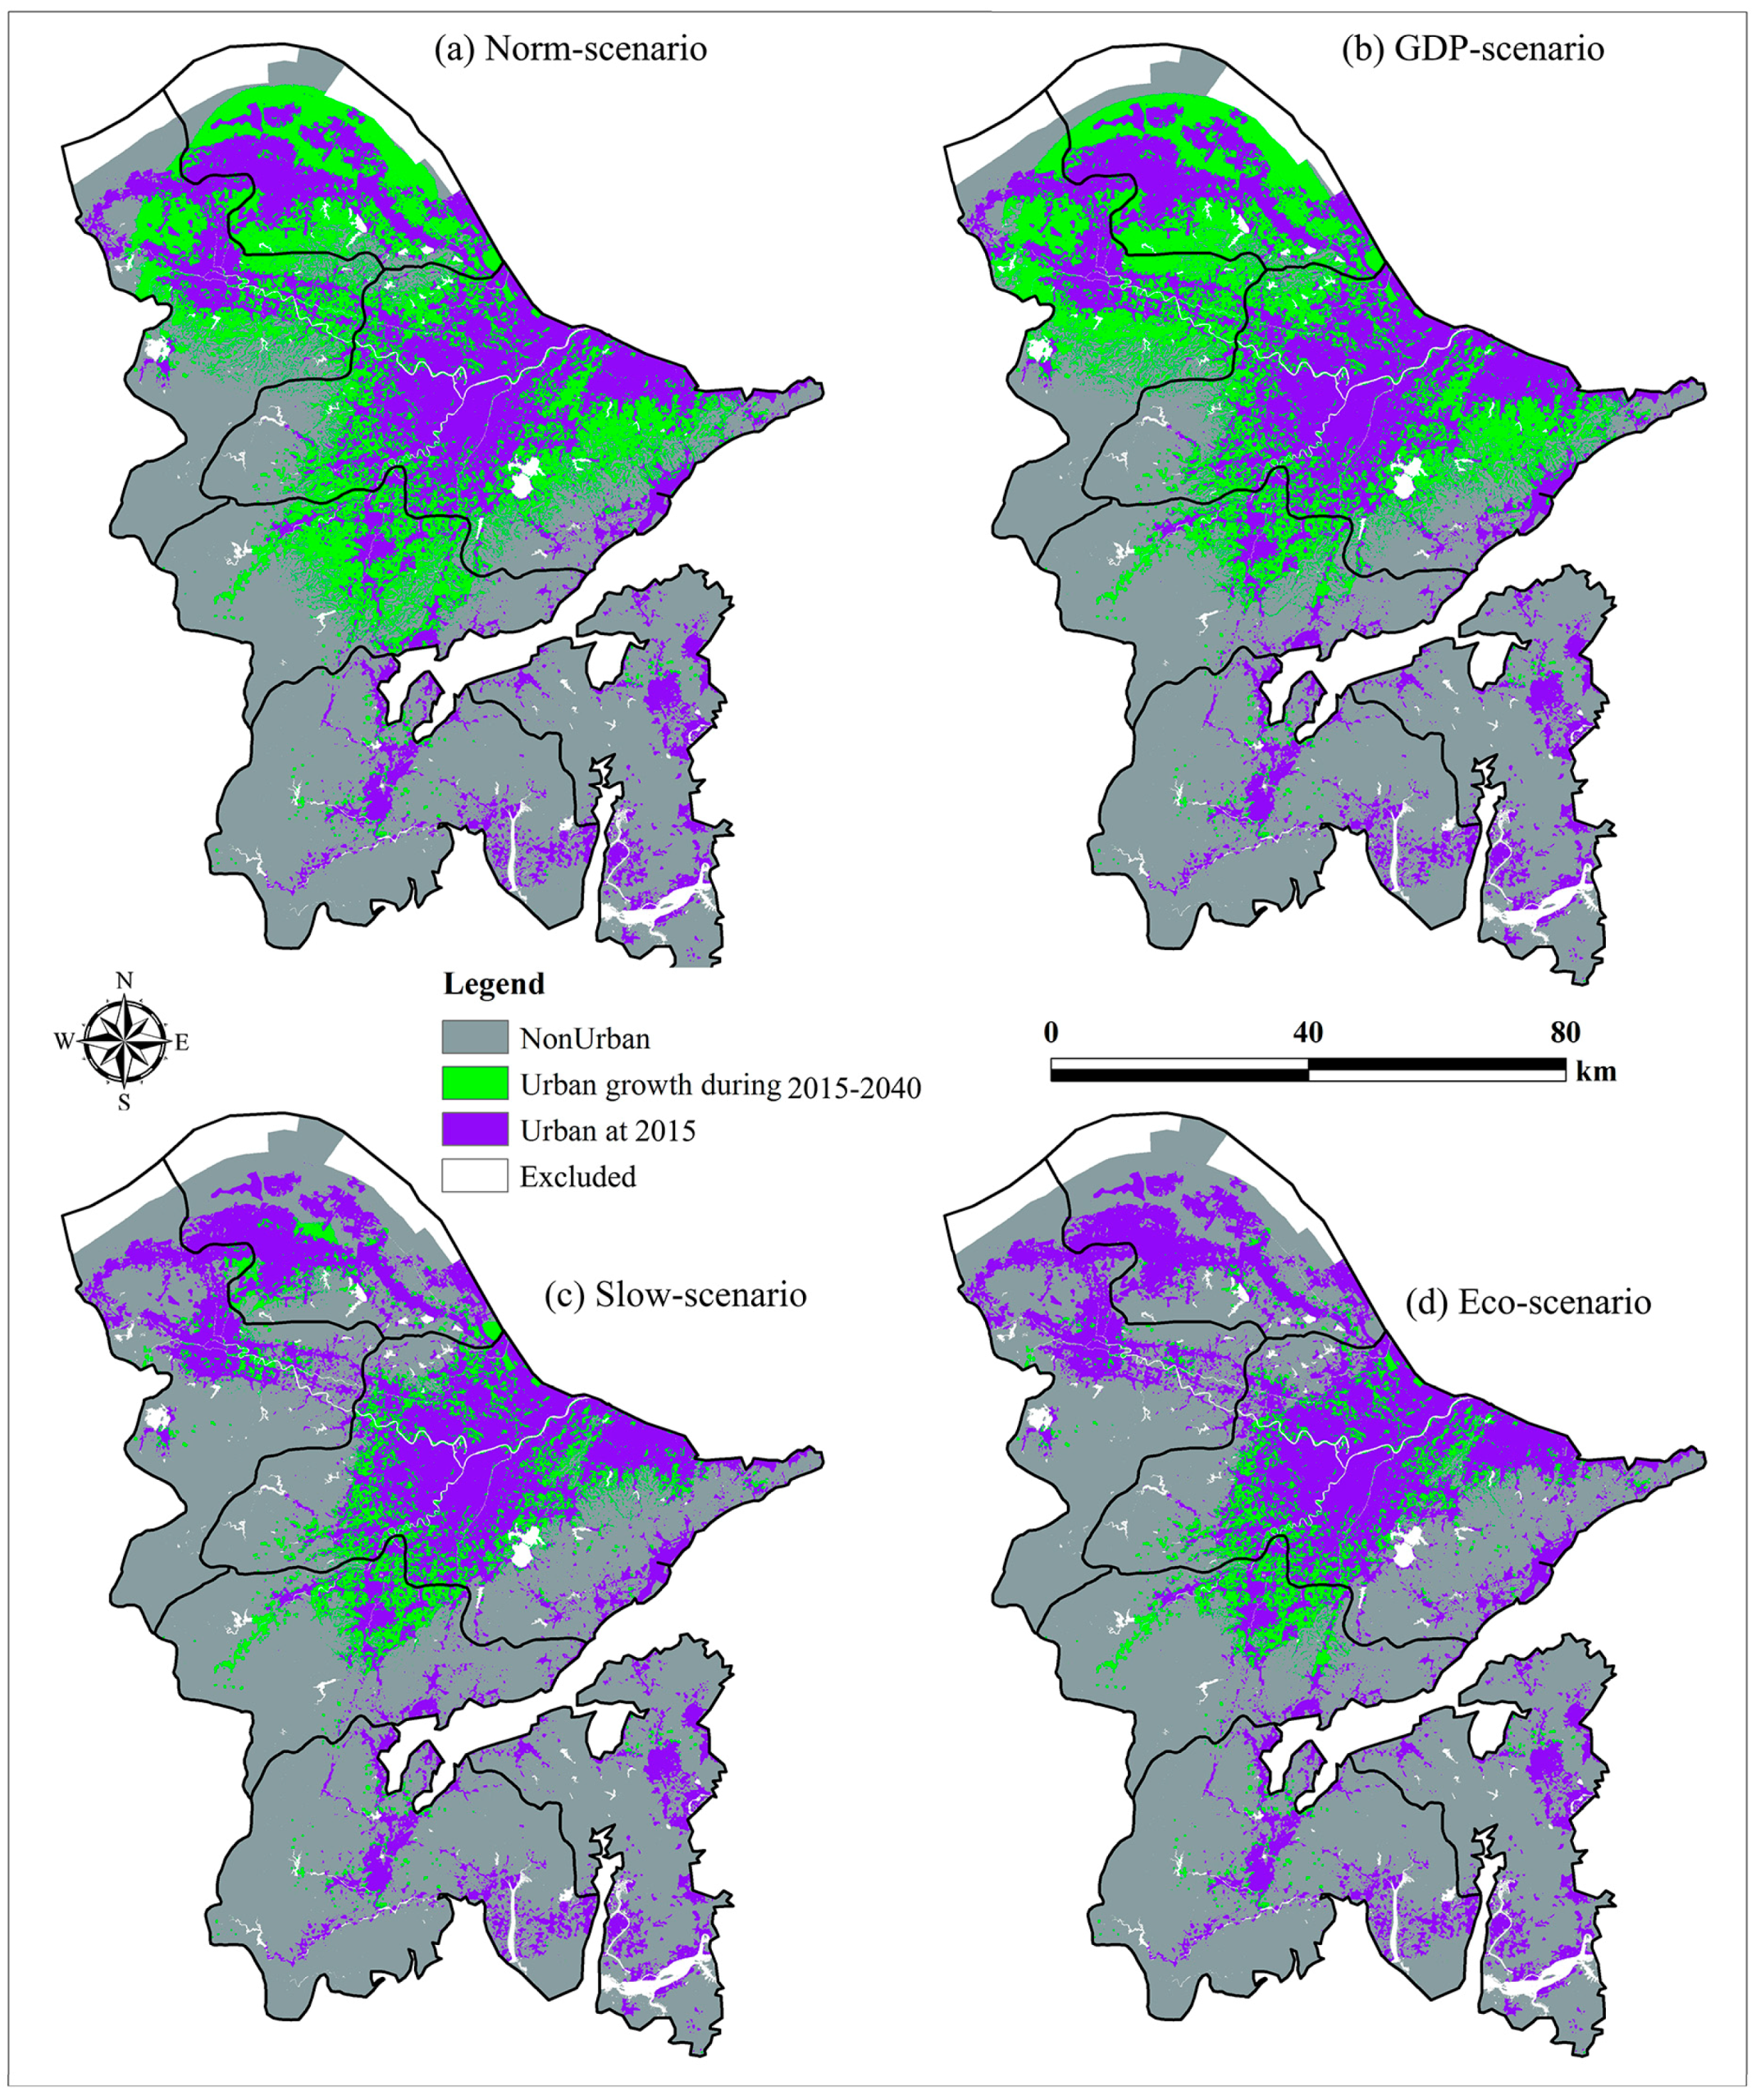
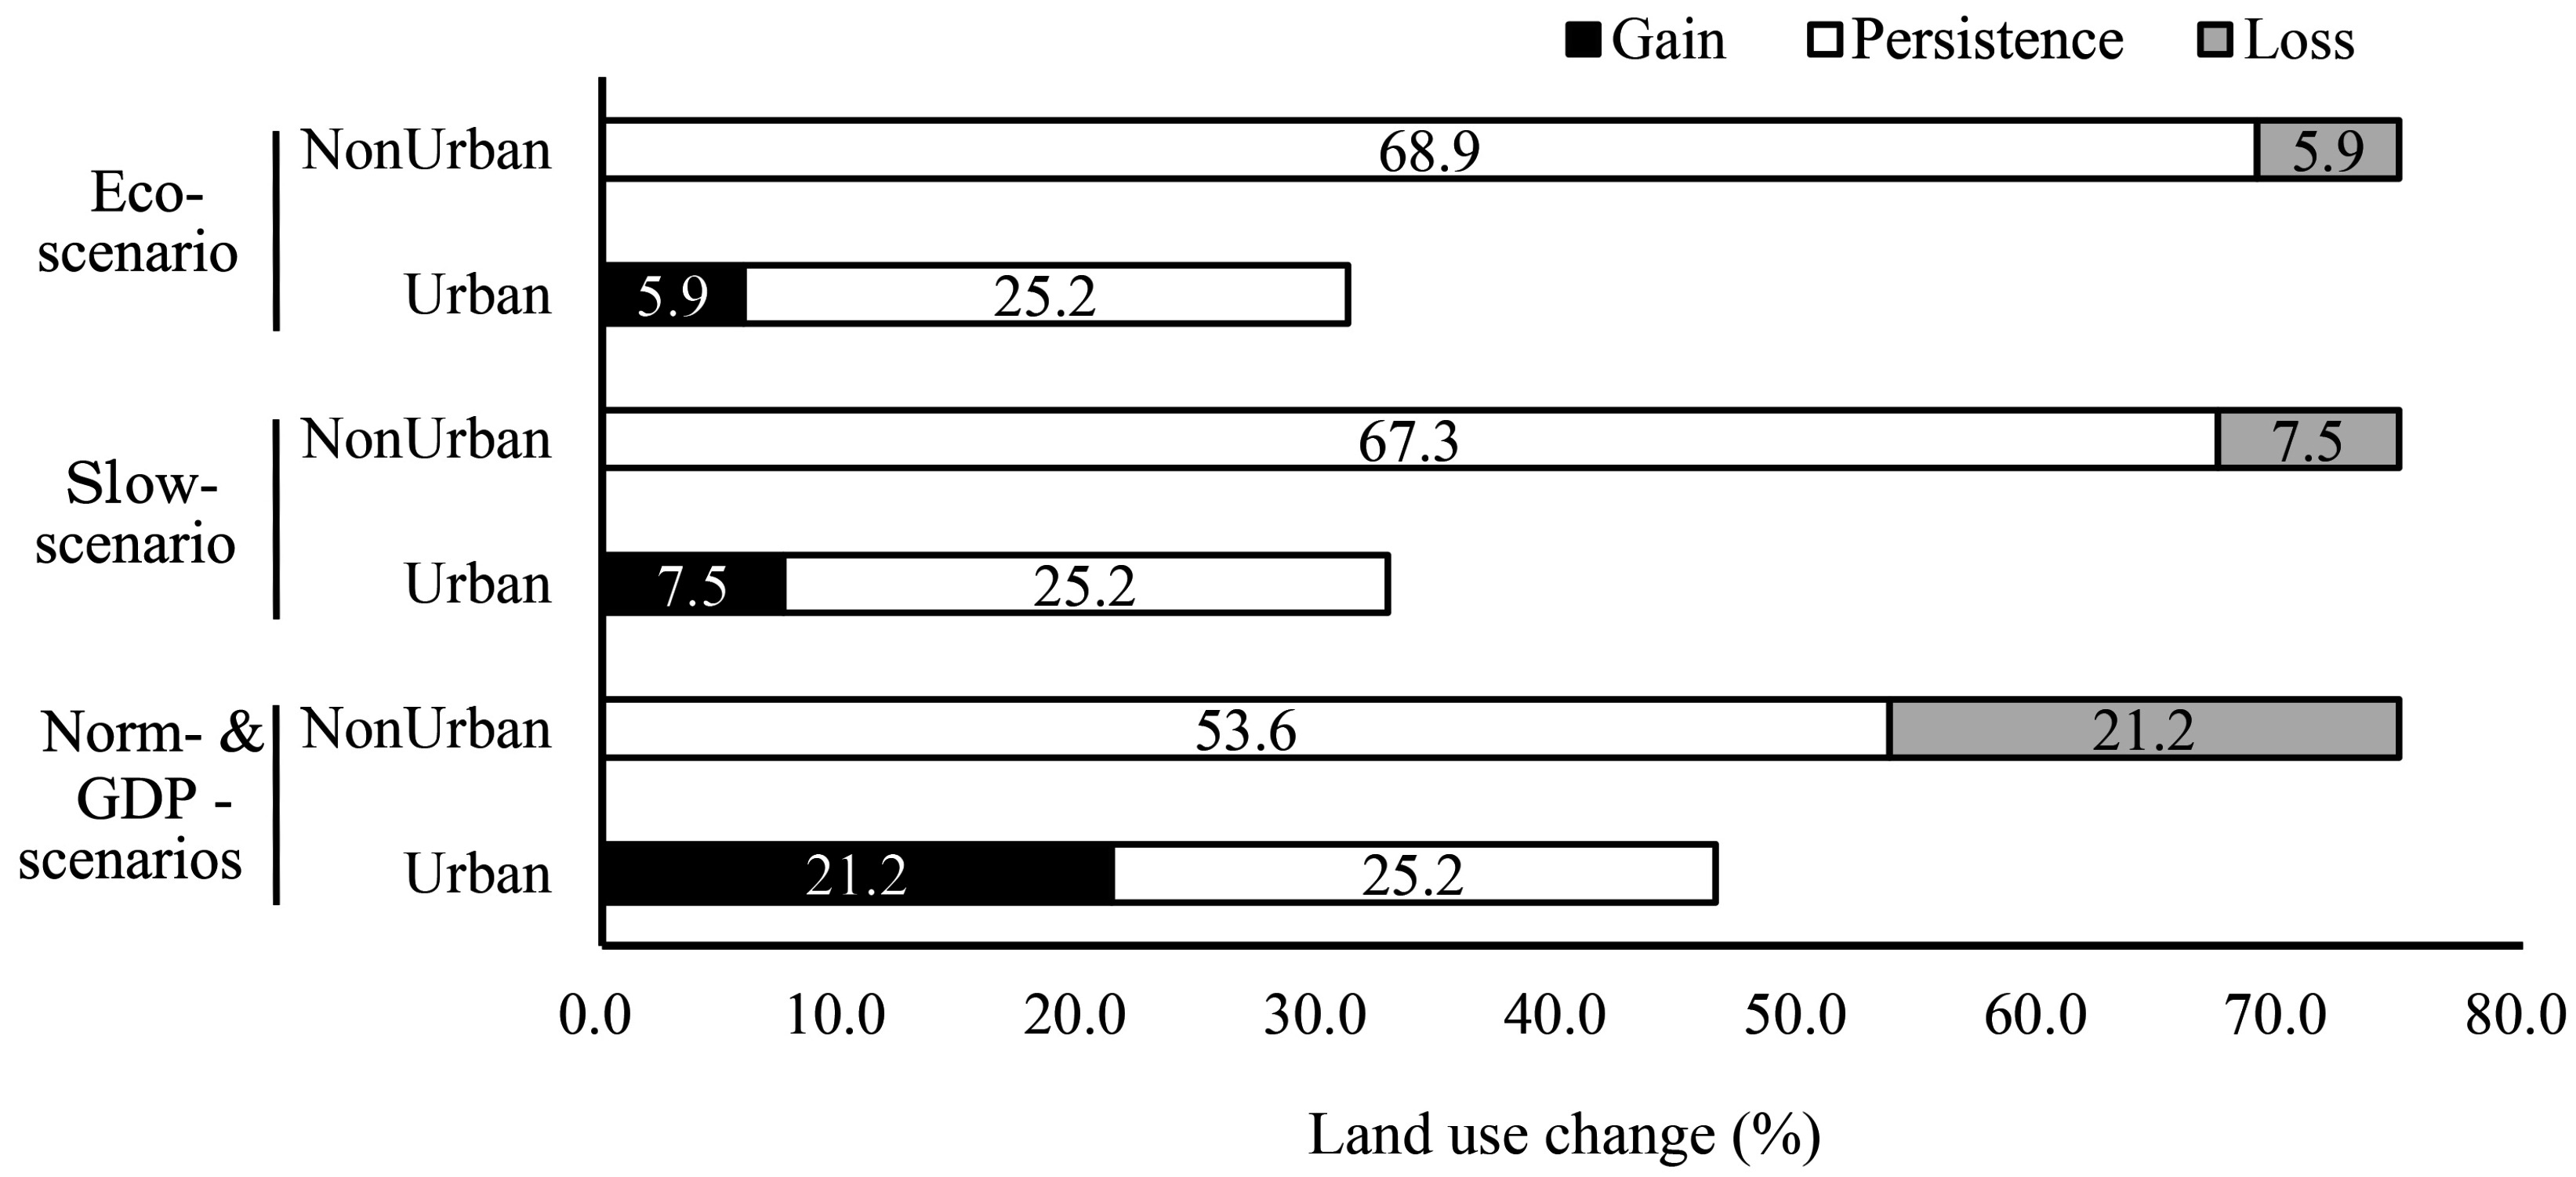
3.3. Simulated Scenarios of Ningbo for 2040

Four different development strategies for Ningbo to the year 2040 were simulated based on the calibrated CA model from 1990 to 2015. These include (a) the Norm-scenario, a baseline scenario that maintains the urban growth rate at the 1990–2015 period and assumes a continuous economic transition as from the past; (b) the GDP-scenario, a GDP growth oriented scenario considering the accelerated growth along its economic centers and corridors; (c) the Slow-scenario, where urban growth will slow down and the growth rate is much lower than in the past, considering the potential downward trend of the housing market in China; and (d) the Eco-scenario, an ecosystem and environmental protection oriented growth scenario.
The Norm- and GDP-scenarios assume that urban growth in the next 25 years (2015–2040) will continue as in the past 25 years. According to the two classified Landsat images, urban land use has increased by 1950 km2 from 1990 to 2015, hence it is assumed that another 1950 km2 of urban area will be developed in the next 25 years under the Norm- and GDP-scenarios, resulting in a total urban area of 4113 km2 in 2040. For the Norm-scenario, the same set of model parameters as defined during the model calibration process was used to run the model until the desired quantity of urban growth is achieved. However, for the GDP-scenario, the value of Dec was increased by a factor of three to reflect the assumption that strong growth will occur along the economic corridors to achieve higher GDP growth (see Table 3 under the GDP-scenario column).
The Slow- and Eco-scenarios were defined under the assumption that urban growth in the region will slow down in the next 25 years, given the booming building construction in China and some clear signals indicating that the rate of urban growth will slow down [4]. Considering the increasing tight regulation on the property market as well as the strong call for ecosystem protection, we assumed that the maximum allowable area of urban growth for the next 25 years will be limited to one-third of that during the 1990–2015 interval, i.e., about 650 km2. In the Eco-scenario, urban expansion will be tightly constrained at locations near important natural scenery sites. This scenario is reflected by increasing the Dns values by a factor of three, as compared to the calibrated value from past development (see Table 3, under Eco-scenario). The urban growth scenarios under the four development strategies are illustrated in Figure 6.

3.3.1. Norm-Scenario: A Baseline Scenario with a Growth Rate Observed during 1990–2015

The Norm-scenario assumes steady urban growth and a normal transition in the economy, resulting in the same scale of new development for the coming 25 years. Although such an assumption may not be supported by China’s current economic situation and housing market, it provides an insight to examine how the city would be if it continues at the same rate of urban growth. Under the Norm-scenario, Ningbo will gain an urban area of 1950 km2, resulting in a total urban area of 4113 km2 in 2040. Most urban development will occur near the existing Ningbo urban center and its three satellite cities: Cixi, Yuyao and Fenghua (Figure 6a). The Fenghua city center will be merged into the Ningbo city as a fringe suburb, while both Cixi and Yuyao will grow to be connected to the Ningbo city center, except for the junctions of the three regions, where the natural scenery is characterized by a steep topographic slope.

3.3.2. GDP-Scenario with Strong Growth along Its Economic Corridors

Urban centers typically contribute a much larger portion to the overall economy in most cities in China [58]. In addition, the private sector in Ningbo has been a significant player in its economic growth and is becoming increasingly important [59]. The economic corridors (city center, town centers in Zhenhai, Cixi and Yuyao) also play significant roles to its overall economic growth. Therefore, the city center, town centers and economic corridors would have a higher probability of being developed to boost higher GDP growth. The CA model was run by applying the distance to the economic corridors parameter (Dec) three times larger than the Norm-scenario to generate the same quantity of urban land in 2040, hence the model reallocates new urban growth to unconstrained areas. As in the Norm-scenario, Figure 6b shows that most urban development occurs near the existing Ningbo city center and its three satellite cities of Cixi, Yuyao and Fenghua. However, the GDP-scenario generated more urban area in the economic corridors that also contain some of the natural sceneries at the junction of Ningbo city center, Cixi and Yuyao. Gains are smaller at Fenghua as compared to the Norm-scenario. This suggests that GDP-oriented urban growth will occur at the expense of the natural environment.

3.3.3. Slow-Scenario Accommodating Lower Housing and Property Demand

China’s housing market has reached a turning point with falling housing prices and demand as well as an oversupply of commercial properties [60]. Considering the potential slowdown of the booming housing market, property development companies have lowered expectations of new residential housing demand [61]. Consequently, the Slow-scenario reduces the allowable land for urban growth to 650 km2, resulting in a total urban area of 2813 km2 in 2040. Under this scenario, urban growth will occur mainly around the existing urban area of Ningbo City and Fenghua, and a small portion of growth will occur in Cixi (Figure 6c). We anticipate that this scenario is most likely to occur, given the tightening policy on investment properties, as well as the increasing concern about environmental issues and demand for ecosystem protections.

3.3.4. Eco-Scenario: A Slow-Growth Scenario that Protects the Environment and Its Ecosystems

A total of 24 natural sceneries located in Ningbo were identified along the coast and in the mountain areas with relatively high land slope, for example, the junction of Ningbo city center, Cixi and Yuyao. These areas are of high ecological value and should be protected from urban development under the Eco-scenario. This scenario was realized by increasing the value of Dns (distance to the natural scenery sites) by a factor of three to relocate new urban growth to other unconstrained areas. As a result, this scenario only generated 522 km2 of new urban area in 2040 compared to the base year in 2015—about 128 km2 less than in the Slow-scenario. Figure 6d shows a similar pattern to the Slow-scenario, where urban growth mainly occurs around the existing urban area of Ningbo city center and Fenghua, but gains less in Cixi.

4. Discussion

Significant increases in the urban area for Ningbo by the year 2040 were predicted under each of the four urban growth scenarios. Even with the conservative strategies which led to the Eco- and Slow-scenarios, the urban areas in Ningbo will increase by 520 to 650 km2. The increase in urban land use results from increases in population in the Ningbo city core, rapid development in the private sector in Cixi, Yuyao and Fenghua, and development of the logistics service industry at the port of Ningbo.
On the other hand, the four simulations produced few changes in Ninghai and Xiangshan, where the natural ecological environment remains in good condition and the tourism industry is operating at a high level. To visualize the differences amongst the four scenarios, two comparison maps were produced based on the differences between the Norm- vs. GDP-scenarios and between the Slow- vs. Eco-scenarios (Figure 7). Percentage of urban land change is presented in Figure 8 for the four scenarios using the map comparison method proposed by Pontius and colleagues [57,62,63] and is used to assess and compare the results of CA models [24,26]. Figure 7 shows that, compared to the GDP-scenario, the Norm-scenario simulated more urban growth in Fenghua and to the north of Cixi, while there was less growth in Yuyao and at the junction of Ningbo city center, Cixi and Yuyao, where most of the private industry is located. Compared with the Eco-scenario, the Slow-scenario generated more urban growth to the northwest of Ningbo city, and the administrative centers of Cixi and Yuyao where the areas were considered as protected areas under the Eco-scenario.
Both the Norm- and GDP-scenarios predicted that nearly half (i.e., 47.5%, or 4113 km2 out of its total land areas of 8653 km2) will become urban areas by the year 2040. This includes 25.0% of existing urban areas as in 2015 (i.e., persistence) and 22.5% of new urban gains (i.e., 1950 km2). Under these two scenarios, Ningbo will become a highly urbanized area except for Ninghai and Xiangshan counties. However, this will be at the cost of deteriorating its beautiful natural scenery, the environment and ecosystem. On the other hand, urban areas will increase by 7.5% and 6.0%, or 650 km2 and 522 km2, by the year 2040 under the Slow- and Eco-scenarios, respectively. Considering the size of non-urbanized land being converted into urban use and the long-term sustainability of the region, the Slow- and Eco-scenarios are preferable given that these scenarios preserve more land from urban use and put more emphasis on environmental protection and the harmony between humans and nature. The locations where new urban growth will occur differ in the four scenarios, in response to different emphases such as the housing market, GDP growth and protection of the environment and the ecosystem. The scenarios generated by the model are useful for decision makers to assess different urban development options before any planning decision is made.

5. Conclusions

Coastal city development is being increasingly challenged in an era of rapid urbanization and intensive human activity. It is important to understand the physical processes in urban systems and the human-environment interactions to plan for long-term sustainable development of cities. China’s population increase and urban development in the coastal cities have been phenomenal and are continuously growing very rapidly, however, there are signals showing that a turning point is emerging in the housing market in China. The well-known air pollution and worsening environments in China—mainly caused by the large-scale urbanization and industrialization—have drawn public attention, resulting in a growing awareness of the protection of the environment and ecosystem. To simulate the future scenarios, CA modeling serves as a diagnosis for the urban development in China as well as assesses the impacts of economic development and environmental protection strategies on urban growth.
This paper applies a LogCA model to predict the urban scenarios of a coastal city, Ningbo, in southeast China. The LogCA model was validated based on the urban patterns of 1990 and 2015 and used to predict the scenarios in 2040. Four scenarios were considered including a normal scenario with an urban growth rate as observed 1990–2015, a GDP growth oriented scenario, a scenario with a lower expectation of urban growth rate, and an ecosystem protection oriented scenario. The Norm- and GDP-scenarios predicted 1950 km2 of urban growth for the coming 25 years, the Slow-scenario predicted 650 km2 of urban growth, and the Eco-scenario predicted less than the Slow-scenario. The locations where the new built-up cells occur are quite different for the four scenarios in response to different demands such as the housing market, the growth of the GDP and protection of the ecosystem. The Slow- and Eco-scenarios are preferable in terms of sustainability and urban planning policy could pay more attention to environmental protection and restoration and put more emphasis on the harmony between man and nature. These scenarios are helpful for decision makers who are exploring various sustainable urban development options before making any planning adjustment.

Acknowledgments

This research was supported by the National Natural Science Foundation of China (Project No. 41406146), Natural Science Foundation of Shanghai Municipality (Project No. 13ZR1419300), and Shanghai Universities First-class Disciplines Project-Fisheries (A).

Author Contributions

Yongjiu Feng conceived, designed and performed the experiments; Yongjiu Feng and Yan Liu analyzed the data and wrote the paper.

Conflicts of Interest

The authors declare no conflict of interest.

References

  1. Lin, T.; Xue, X.; Shi, L.; Gao, L. Urban spatial expansion and its impacts on island ecosystem services and landscape pattern: A case study of the island city of Xiamen, Southeast China. Ocean. Coast. Manag. 2013, 81, 90–96. [Google Scholar] [CrossRef]
  2. Grimm, N.B.; Faeth, S.H.; Golubiewski, N.E.; Redman, C.L.; Wu, J.; Bai, X.; Briggs, J.M. Global change and the ecology of cities. Science 2008, 319, 756–760. [Google Scholar] [CrossRef] [PubMed]
  3. National Bureau of statistics of China. China Statistical Yearbook; China Statistics Press: Beijing, China, 2015.
  4. Chivakul, M.; Lam, W.R.; Liu, X.; Maliszewski, W.S.; Schipke, A. Understanding Residential Real Estate in China. Available online: http://ssrn.com/abstract=2609648 (accessed on 7 October 2016).
  5. Jiang, S.; Lu, M.; Sato, H. Identity, inequality, and happiness: Evidence from urban China. World Dev. 2012, 40, 1190–1200. [Google Scholar] [CrossRef]
  6. Feng, Y.; Liu, Y.; Liu, D. Shoreline mapping with cellular automata and the shoreline progradation analysis in Shanghai, China from 1979 to 2008. Arab. J. Geosci. 2015, 8, 4337–4351. [Google Scholar] [CrossRef]
  7. Wu, H.; Hu, Y. Maintaining healthy rivers and lakes through water diversion from Yangtze River to Taihu Lake in Taihu Basin. Water Sci. Eng. 2008, 1, 36–43. [Google Scholar]
  8. Li, W.; Liu, Y.-J.; Yang, Z. Preliminary strategic environmental assessment of the great western development strategy: Safeguarding ecological security for a new Western China. Environ. Manag. 2012, 49, 483–501. [Google Scholar] [CrossRef] [PubMed]
  9. Dong, C.; Tan, Y.; Luo, M.; Zhai, Y. Spatial aggregation pattern of cancer village in China. Geogr. Res. 2014, 33, 2115–2124. [Google Scholar]
  10. He, D.; Wu, R.; Feng, Y.; Li, Y.; Ding, C.; Wang, W.; Yu, D.W. REVIEW: China’s transboundary waters: New paradigms for water and ecological security through applied ecology. J. Appl. Ecol. 2014, 51, 1159–1168. [Google Scholar] [CrossRef] [PubMed]
  11. Batty, M.; Xie, Y. From cells to cities. Environ. Plan. B Plan. Des. 1994, 21, S31–S48. [Google Scholar] [CrossRef]
  12. Clarke, K.C.; Gaydos, L.J. Loose-coupling a cellular automaton model and GIS: Long-term urban growth prediction for San Francisco and Washington/Baltimore. Int. J. Geogr. Inf. Sci. 1998, 12, 699–714. [Google Scholar] [CrossRef] [PubMed]
  13. Wu, F. Calibration of stochastic cellular automata: The application to rural-urban land conversions. Int. J. Geogr. Inf. Sci. 2002, 16, 795–818. [Google Scholar] [CrossRef]
  14. Barredo, J.I.; Kasanko, M.; McCormick, N.; Lavalle, C. Modelling dynamic spatial processes: Simulation of urban future scenarios through cellular automata. Landsc. Urban Plan. 2003, 64, 145–160. [Google Scholar] [CrossRef]
  15. Liao, J.; Tang, L.; Shao, G.; Su, X.; Chen, D.; Xu, T. Incorporation of extended neighborhood mechanisms and its impact on urban land-use cellular automata simulations. Environ. Model. Softw. 2016, 75, 163–175. [Google Scholar] [CrossRef]
  16. Zhu, Z.; Liu, L.; Chen, Z.; Zhang, J.; Verburg, P.H. Land-use change simulation and assessment of driving factors in the loess hilly region—A case study as Pengyang County. Environ. Monit. Assess. 2010, 164, 133–142. [Google Scholar] [CrossRef] [PubMed]
  17. Liu, Y.; Feng, Y. A logistic based cellular automata model for continuous urban growth simulation: A case study of the Gold Coast City, Australia. In Agent-Based Models of Geographical Systems; Springer: Berlin, Germany, 2012; pp. 643–662. [Google Scholar]
  18. Munshi, T.; Zuidgeest, M.; Brussel, M.; van Maarseveen, M. Logistic regression and cellular automata-based modelling of retail, commercial and residential development in the city of Ahmedabad, India. Cities 2014, 39, 68–86. [Google Scholar] [CrossRef]
  19. Feng, Y.; Liu, Y.; Tong, X.; Liu, M.; Deng, S. Modeling dynamic urban growth using cellular automata and particle swarm optimization rules. Landsc. Urban Plan. 2011, 102, 188–196. [Google Scholar] [CrossRef]
  20. Liu, Y.; Phinn, S.R. Modelling urban development with cellular automata incorporating fuzzy-set approaches. Comput. Environ. Urban 2003, 27, 637–658. [Google Scholar] [CrossRef]
  21. Liu, Y. Modelling sustainable urban growth in a rapidly urbanising region using a fuzzy-constrained cellular automata approach. Int. J. Geogr. Inf. Sci. 2012, 26, 151–167. [Google Scholar] [CrossRef]
  22. Feng, Y.; Liu, Y. A heuristic cellular automata approach for modelling urban land-use change based on simulated annealing. Int. J. Geogr. Inf. Sci. 2013, 27, 449–466. [Google Scholar] [CrossRef]
  23. Huang, B.; Zhang, W. Sustainable land-use planning for a downtown lake area in central China: Multiobjective optimization approach aided by urban growth modeling. J. Urban Plan. Dev. ASCE 2014, 140, 04014002. [Google Scholar] [CrossRef]
  24. Liu, Y.; Feng, Y.; Pontius, R.G. Spatially-explicit simulation of urban growth through self-adaptive genetic algorithm and cellular automata modelling. Land 2014, 3, 719–738. [Google Scholar] [CrossRef]
  25. Feng, Y.; Liu, Y. A cellular automata model based on nonlinear kernel principal component analysis for urban growth simulation. Environ. Plan. B 2013, 40, 116–134. [Google Scholar] [CrossRef]
  26. Feng, Y.; Liu, Y.; Batty, M. Modeling urban growth with GIS based cellular automata and least squares SVM rules: A case study in Qingpu–Songjiang area of Shanghai, China. Stoch. Environ. Res. Risk. Assess. 2016, 30, 1387–1400. [Google Scholar] [CrossRef]
  27. Zhou, D.; Lin, Z.; Liu, L. Regional land salinization assessment and simulation through cellular automaton-Markov modeling and spatial pattern analysis. Sci. Total Environ. 2012, 439, 260–274. [Google Scholar] [CrossRef] [PubMed]
  28. Liu, Y.B.; Dai, L.; Xiong, H. Simulation of urban expansion patterns by integrating auto-logistic regression, Markov chain and cellular automata models. J. Environ. Plan. Manag. 2015, 58, 1113–1136. [Google Scholar] [CrossRef]
  29. Losiri, C.; Nagai, M.; Ninsawat, S.; Shrestha, R.P. Modeling urban expansion in Bangkok Metropolitan region using demographic–economic data through cellular automata-Markov Chain and multi-Layer perceptron-Markov chain models. Sustainability 2016, 8, 686. [Google Scholar] [CrossRef]
  30. Han, J.; Hayashi, Y.; Cao, X.; Imura, H. Application of an integrated system dynamics and cellular automata model for urban growth assessment: A case study of Shanghai, China. Landsc. Urban Plan. 2009, 91, 133–141. [Google Scholar] [CrossRef]
  31. Dezhkam, S.; Amiri, B.J.; Darvishsefat, A.A.; Sakieh, Y. Simulating the urban growth dimensions and scenario prediction through sleuth model: A case study of Rasht County, Guilan, Iran. GeoJournal 2014, 79, 591–604. [Google Scholar] [CrossRef]
  32. Wu, B.S.; Sui, D. Modeling impacts of globalization on desakota regions: A case study of Taipei Metropolitan Area. Environ. Plan. B 2016, 43, 320–340. [Google Scholar]
  33. Aljoufie, M.; Zuidgeest, M.; Brussel, M.; van Vliet, J.; van Maarseveen, M. A cellular automata-based land use and transport interaction model applied to Jeddah, Saudi Arabia. Landsc. Urban Plan. 2013, 112, 89–99. [Google Scholar] [CrossRef]
  34. Verstegen, J.A.; Karssenberg, D.; Van Der Hilst, F.; Faaij, A.P. Identifying a land use change cellular automaton by Bayesian data assimilation. Environ. Model. Softw. 2014, 53, 121–136. [Google Scholar] [CrossRef]
  35. Liu, X.; Ma, L.; Li, X.; Ai, B.; Li, S.Y.; He, Z.J. Simulating urban growth by integrating landscape expansion index (LEI) and cellular automata. Int. J. Geogr. Inf. Sci. 2014, 28, 148–163. [Google Scholar] [CrossRef]
  36. Zhang, Z.; Tu, Y.; Li, X. Quantifying the spatiotemporal patterns of urbanization along urban-rural gradient with a roadscape transect approach: A case study in Shanghai, China. Sustainability 2016, 8, 862. [Google Scholar] [CrossRef]
  37. Batty, M. The New Science of Cities; Mit Press: Cambridge, MA, USA, 2013. [Google Scholar]
  38. Liu, Y.L.; Tang, W.; He, J.; Liu, Y.; Ai, T.; Liu, D. A land-use spatial optimization model based on genetic optimization and game theory. Comput. Environ. Urban 2015, 49, 1–14. [Google Scholar] [CrossRef]
  39. Feng, Y.; Liu, Y. An optimised cellular automata model based on adaptive genetic algorithm for urban growth simulation. In Advances in Spatial Data Handling and GIS; Springer: Berlin, Germany, 2012; pp. 27–38. [Google Scholar]
  40. Feng, Y.; Liu, Y. Scenario prediction of emerging coastal city using CA modeling under different environmental conditions: A case study of Lingang New City, China. Environ. Monit. Assess. 2016, 188, 1–15. [Google Scholar] [CrossRef] [PubMed]
  41. Feng, Y.; Liu, Y.; Liu, Y. Spatially explicit assessment of land ecological security with spatial variables and logistic regression modeling in Shanghai, China. Stoch. Environ. Res. Risk. Assess. 2016. [Google Scholar] [CrossRef]
  42. Ningbo Municipal Bureau Statistics. Ningbo Statistical Yearbook 2014; China Statistics Press: Beijing, China, 2015.
  43. Hua, X.; Chen, Y. Institutional logics and financing mechanisms: A comparative study of Ningbo and Wenzhou entrepreneurs. In Sustainable Entrepreneurship in China; Springer: Berlin, Germany, 2015; pp. 55–89. [Google Scholar]
  44. Liu, R.; Borthwick, A.G. Measurement and assessment of carrying capacity of the environment in Ningbo, China. J. Environ. Manag. 2011, 92, 2047–2053. [Google Scholar] [CrossRef] [PubMed]
  45. Ningbo Municipal Tourism Administration. Five Star Natural Scenery Sites in Ningbo City. Available online: http://www.nbtravel.gov.cn (accessed on 3 May 2016).
  46. Jarvis, A.; Reuter, H.I.; Nelson, A.; Guevara, E. Hole-Filled SRTM for the Globe, Version 4. 2008. Available online: http://srtm.csi.cgiar.org (accessed on 7 October 2016).
  47. Wu, F. SimLand: A prototype to simulate land conversion through the integrated GIS and CA with AHP-derived transition rules. Int. J. Geogr. Inf. Sci. 1998, 12, 63–82. [Google Scholar] [CrossRef]
  48. Liu, X.; Li, X.; Liu, L.; He, J.; Ai, B. A bottom-up approach to discover transition rules of cellular automata using ant intelligence. Int. J. Geogr. Inf. Sci. 2008, 22, 1247–1269. [Google Scholar] [CrossRef]
  49. Cao, M.; Tang, G.; Shen, Q.; Wang, Y. A new discovery of transition rules for cellular automata by using cuckoo search algorithm. Int. J. Geogr. Inf. Sci. 2015, 29. [Google Scholar] [CrossRef]
  50. Cao, K.; Huang, B.; Li, M.C.; Li, W.W. Calibrating a cellular automata model for understanding rural-urban land conversion: A Pareto front-based multi-objective optimization approach. Int. J. Geogr. Inf. Sci. 2014, 28, 1028–1046. [Google Scholar] [CrossRef]
  51. Liu, X.; Li, X.; Shi, X.; Huang, K.; Liu, Y. A multi-type ant colony optimization (MACO) method for optimal land use allocation in large areas. Int. J. Geogr. Inf. Sci. 2012, 26, 1325–1343. [Google Scholar] [CrossRef]
  52. Jafari, M.; Majedi, H.; Monavari, S.M.; Alesheikh, A.A.; Kheirkhah Zarkesh, M. Dynamic simulation of urban expansion based on cellular automata and logistic regression model: Case study of the Hyrcanian Region of Iran. Sustainability 2016, 8, 810. [Google Scholar] [CrossRef]
  53. Arsanjani, J.J.; Helbich, M.; Kainz, W.; Boloorani, A.D. Integration of logistic regression, Markov chain and cellular automata models to simulate urban expansion. Int. J. Appl. Earth Obs. 2013, 21, 265–275. [Google Scholar] [CrossRef]
  54. Deng, Y. The improved cellular automata and its application in delineation of urban spheres of influence. Sustainability 2014, 6, 8931–8950. [Google Scholar] [CrossRef]
  55. White, R.; Engelen, G. Cellular automata and fractal urban form: A cellular modelling approach to the evolution of urban land-use patterns. Environ. Plan. A 1993, 25, 1175–1199. [Google Scholar] [CrossRef]
  56. Wu, F.; Webster, C.J. Simulation of land development through the integration of cellular automata and multicriteria evaluation. Environ. Plan. B 1998, 25, 103–126. [Google Scholar] [CrossRef]
  57. Pontius, R.G.; Huffaker, D.; Denman, K. Useful techniques of validation for spatially explicit land-change models. Ecol. Model. 2004, 179, 445–461. [Google Scholar] [CrossRef]
  58. Sun, X.; Liu, X.; Li, F.; Tao, Y.; Song, Y. Comprehensive evaluation of different scale cities’ sustainable development for economy, society, and ecological infrastructure in China. J. Clean. Prod. 2015. [Google Scholar] [CrossRef]
  59. Zhu, S.; He, C. Geographical dynamics and industrial relocation: Spatial strategies of apparel firms in Ningbo, China. Eurasian Geogr. Econ. 2013, 54, 342–362. [Google Scholar]
  60. Cao, J.A. The Chinese Real Estate Market: Development, Regulation and Investment; Routledge: George Routledge, UK, 2015. [Google Scholar]
  61. Liu, B.; Wang, X.; Chen, C.; Ma, Z. Research into the dynamic development trend of the competitiveness of China’s regional construction industry. KSCE J. Civ. Eng. 2014, 18, 1–10. [Google Scholar] [CrossRef]
  62. Pontius, R.G.; Millones, M. Death to Kappa: Birth of quantity disagreement and allocation disagreement for accuracy assessment. Int. J. Remote Sens. 2011, 32, 4407–4429. [Google Scholar] [CrossRef]
  63. Aldwaik, S.Z.; Pontius, R.G. Intensity analysis to unify measurements of size and stationarity of land changes by interval, category, and transition. Landsc. Urban Plan. 2012, 106, 103–114. [Google Scholar] [CrossRef]
Figure 1. The study area: Ningbo city of Zhejiang Province, China. (a) Map of China and (b) Map of Ningbo City.
Sustainability 08 01045 g001
Figure 2. Economic corridors and natural scenery sites in Ningbo. Left: administrative centers and economic corridor; right: sites of natural scenery.
Sustainability 08 01045 g002
Figure 3. Spatial variables used in the LogCA model for Ningbo. (a) Duc; (b) Ddc; (c) Dmr; (d) Dw; (e) Slope; (f) Constraint; (g) Dec; and (h) Dns.
Sustainability 08 01045 g003
Figure 4. Comparison of urban growth observed from remote sensing and simulated using LogCA, from 1990 to 2015. (a) The observed urban growth derived from the two classified Landsat images; and (b) The simulated urban growth using the LogCA model.
Sustainability 08 01045 g004
Figure 5. Accuracies and errors in the LogCA model.
Sustainability 08 01045 g005
Figure 6. Predicted scenarios of urban growth under four different development strategies. (a) Norm-scenario; (b) GDP-scenario; (c) Slow-scenario and (d) Eco-scenario.
Sustainability 08 01045 g006
Figure 7. Comparison of urban growth scenarios: (a) Norm- vs. GDP- and (b) Slow- vs. Eco-scenarios.
Sustainability 08 01045 g007
Figure 8. Percentage of land use change under four urban growth strategies from 2015 to 2040.
Sustainability 08 01045 g008
Table 1. Spatial and socio-economic datasets used to produce land use patterns and variables.
TypeSourceDateSignificance
Vector datasetsAdministrative map2000Defines the urban center, town centers and boundaries
Transportation map2000Defines main roads
Scenery site map2014Defines natural scenery locations
Remote sensing imageryLandsat-5 TM (30 m)
Landsat-8 OLI (30 m)
11 June 1990Identifies areas as urban, non-urban, water body, and wetland
3 August 2015
SRTM 90 m DEM V425 November 2008Calculates land slope
Socio-economic dataEconomic corridors2014Defines the distance to economic corridors
Property development expectations2014Estimates the total developable area
Table 2. Dependent and independent variables extracted to retrieve CA transition rules.
VariableMeaningData Extraction
yConversion labelDependent variable y is assigned to 1 if a land cell is converted from non-urban to urban; otherwise, y is assigned to 0.
DucDistance to urban centersMeasured in ArcGIS from administrative map
DtcDistance to town centers
DmrDistance to main roadsMeasured in ArcGIS from road networks map
DwDistance to water bodyMeasured in ArcGIS and ENVI from remote sensing imagery
DecDistance to economic corridorsMeasured in ArcGIS from the map of economic corridors
DnsDistance to natural scenery sitesMeasured in ArcGIS from the map of natural scenery sites
SlopeDeveloping suitability based on DEMComputed based on SRTM 90 m DEM V4
P n i , t Cumulative effects of square neighborhood on the central land cell iComputed using focal function in ArcGIS, where P n i , t = j 5 × 5 ( S i , t = U r b a n ) ( j i ) 5 × 5 1
RStochastic perturbation due to unexpected errors and policy changeReturned randomly using R = 1 + ( ln   r ) a , where r is a random number in the range from 0 to 1 and α = 4
ConstraintConstraints for urban developmentComputed in ENVI from remote sensing imagery
Table 3. Parameters generated using the logistic regression method for Ningbo.
VariablesCalibrated Parameters (1990–2015)Parameters for Generating Future Growth Scenarios
Norm- and Slow-ScenarioGDP-ScenarioEco-Scenario
constant0.3990.3990.3990.399
Duc−1.588−1.588−1.588−1.588
Dtc−3.801−3.801−3.801−3.801
Dmr−4.183−4.183−4.183−4.183
Dw0.0450.0450.0450.045
Dec−4.392−4.392−13.176 1−4.392
Dns2.0892.0892.0896.267 1
1 The parameter is increased by a factor of 3 as the calibrated value to reflect different scenarios.

