
Adjustment and Optimization of the Cropping Systems under Water Constraint

Abstract
:1. Introduction
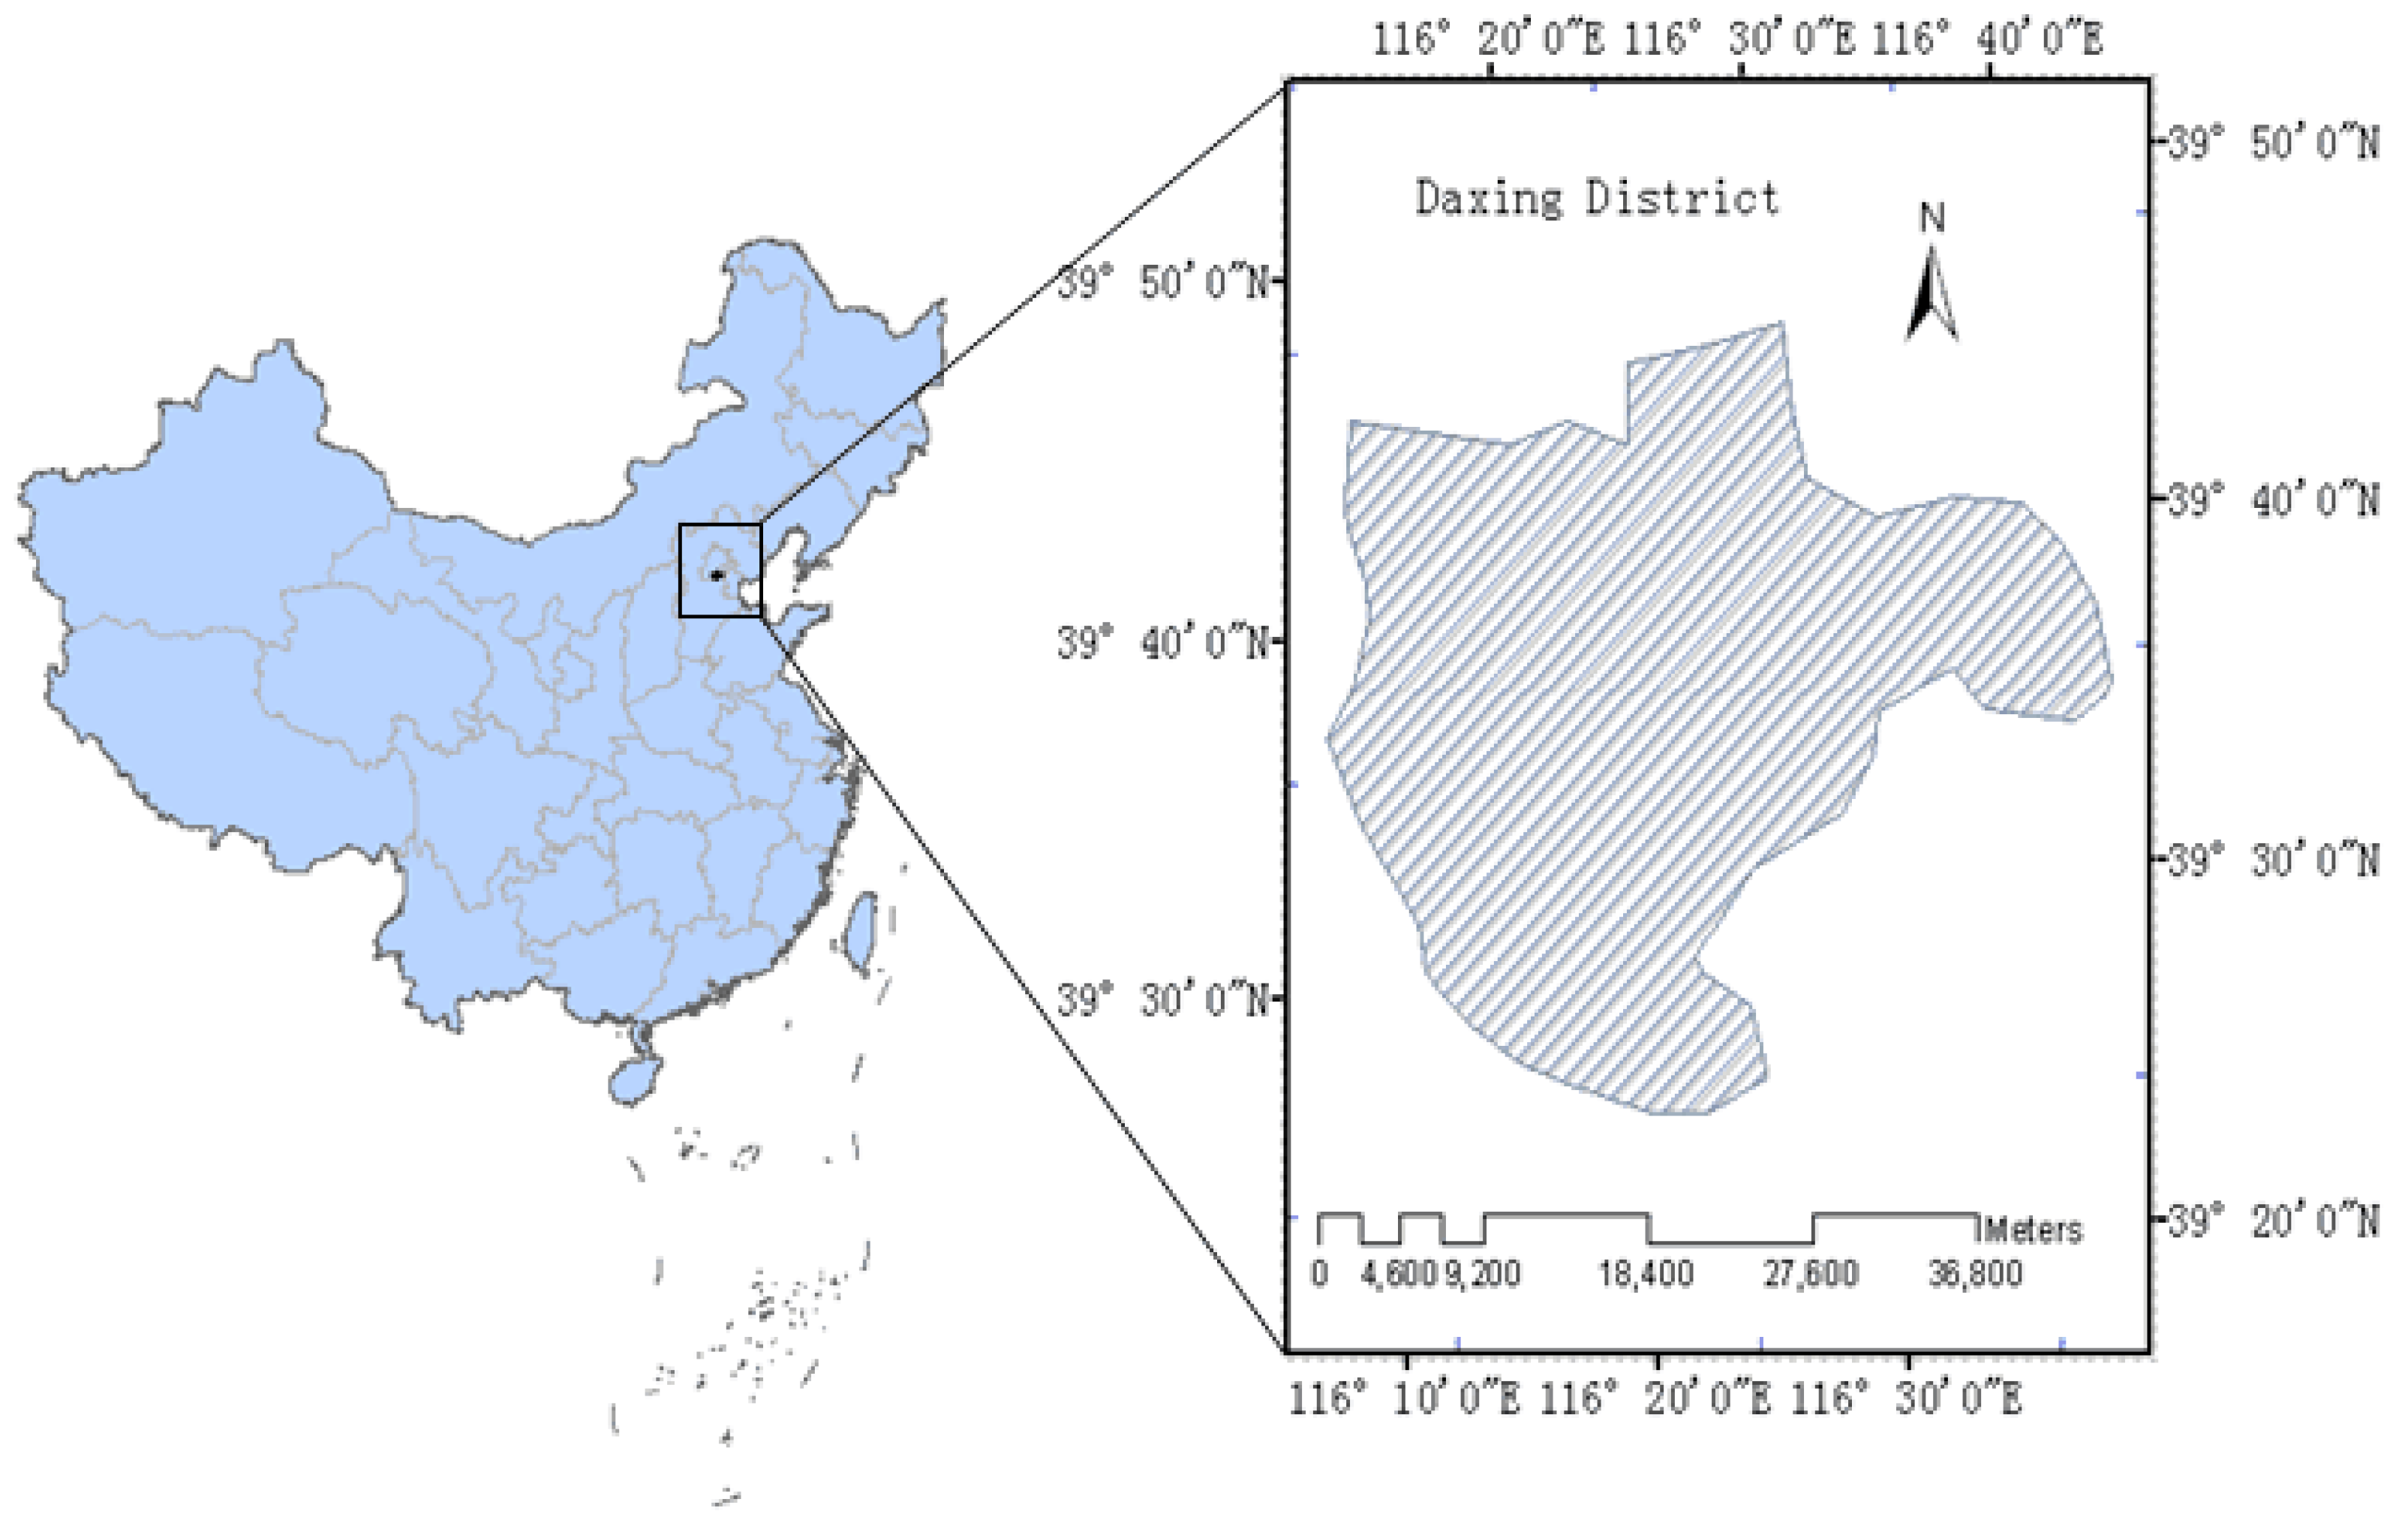
2. Study Area
3. Data and Methods
3.1. Data
3.2. Water Constraint Risk of Cropping Systems
3.3. Calculation of the Water Constraint Risk
3.4. Water Constraint Risk Assessment for the Adjustment and Optimization of Cropping Systems
4. Results
4.1. Analysis of Crop Water Requirements
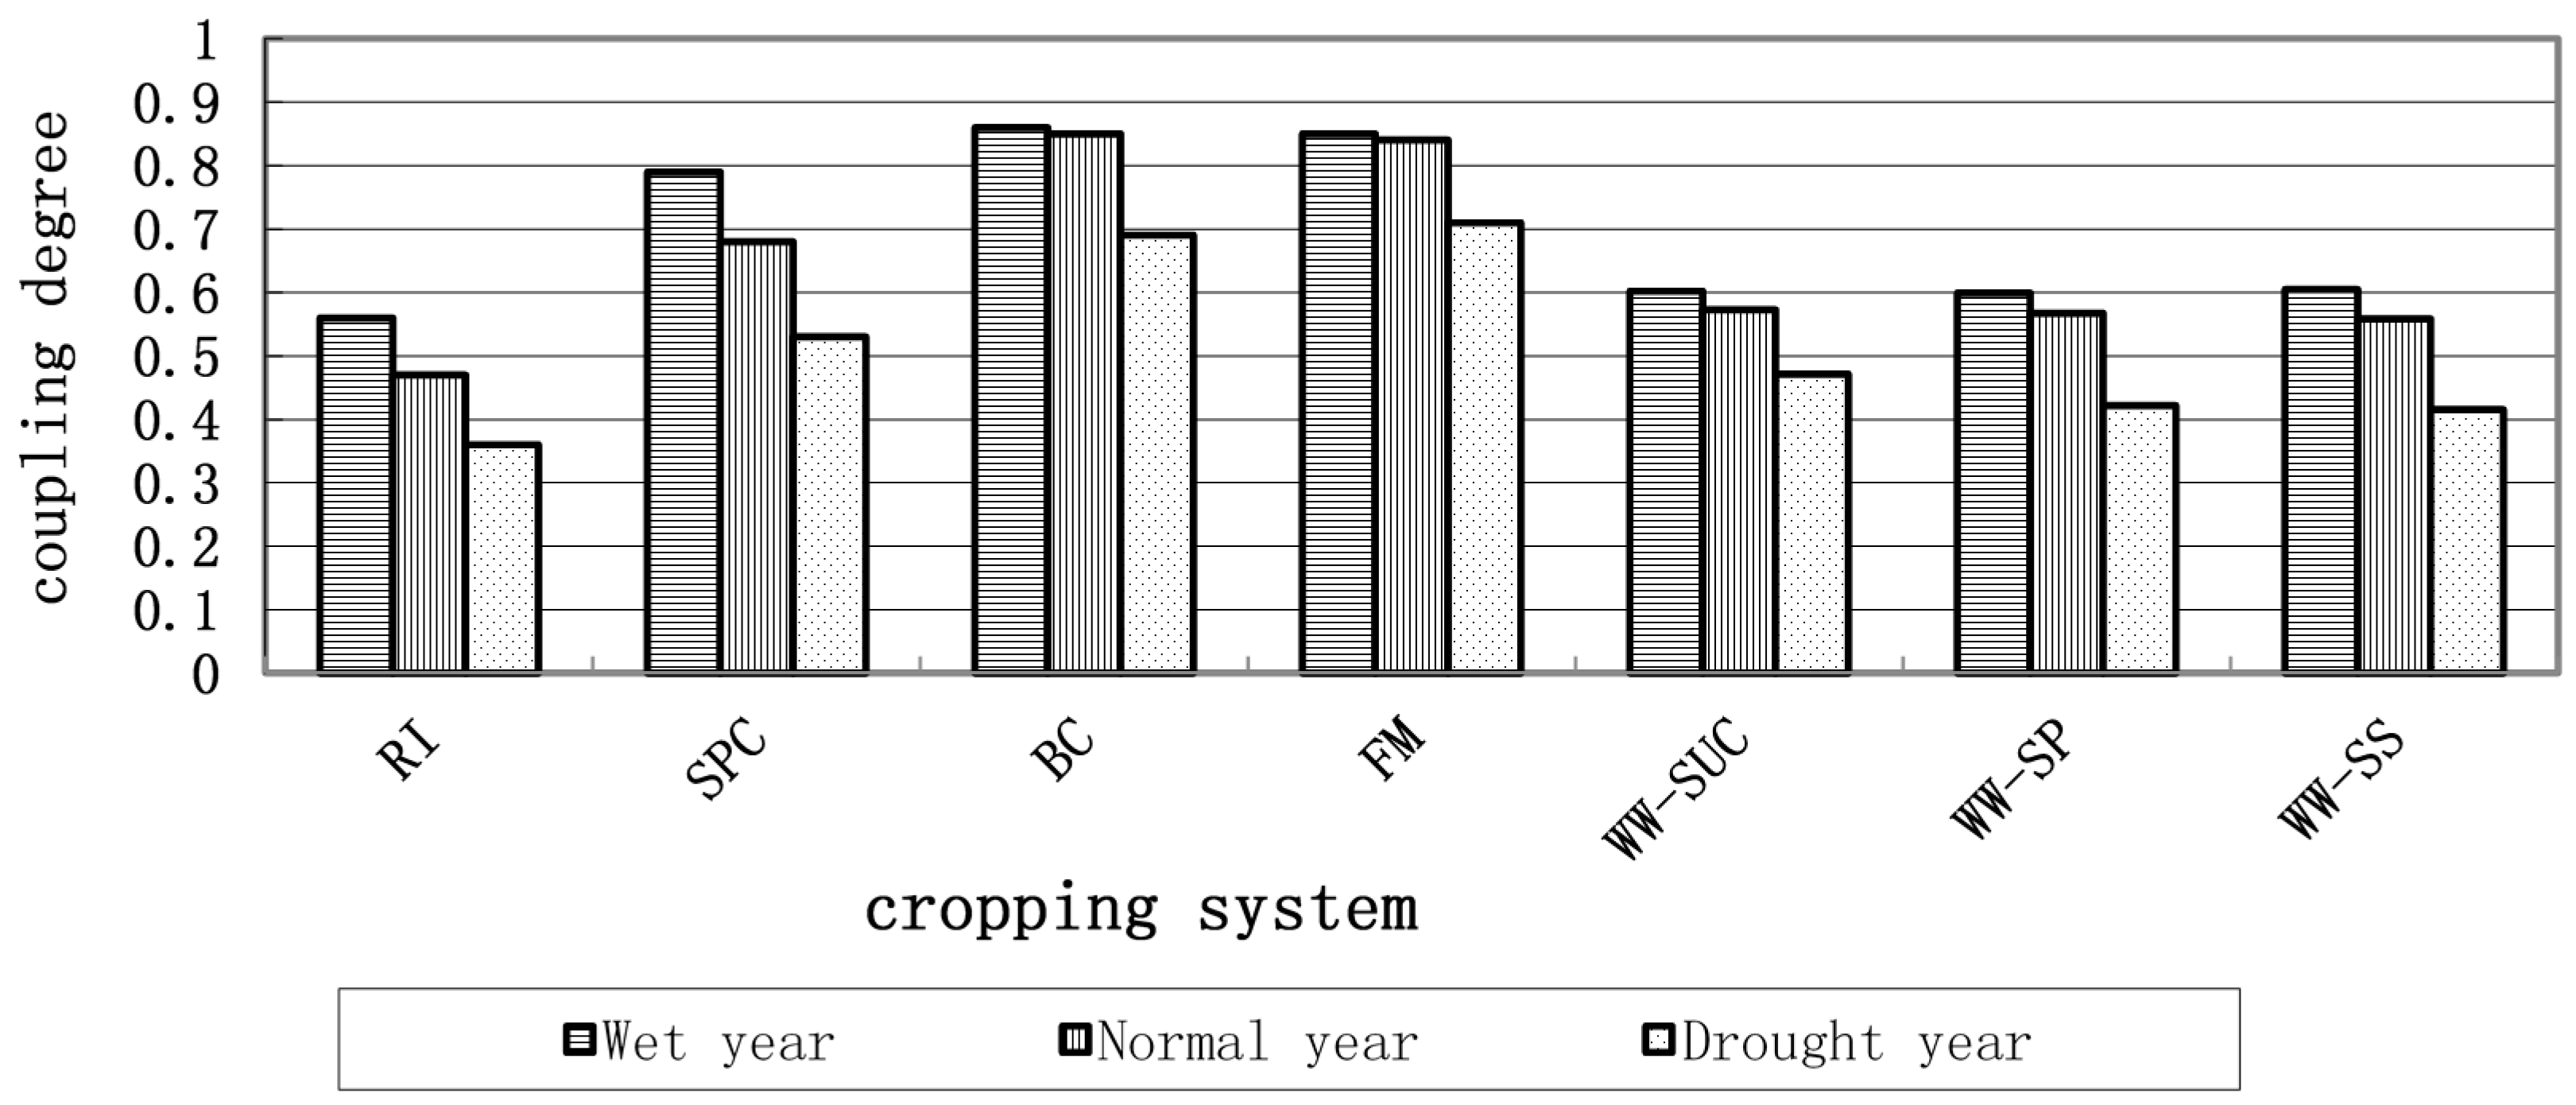
4.2. Analysis of Coupling Degree of Water Supply with Water Demand of Cropping Systems
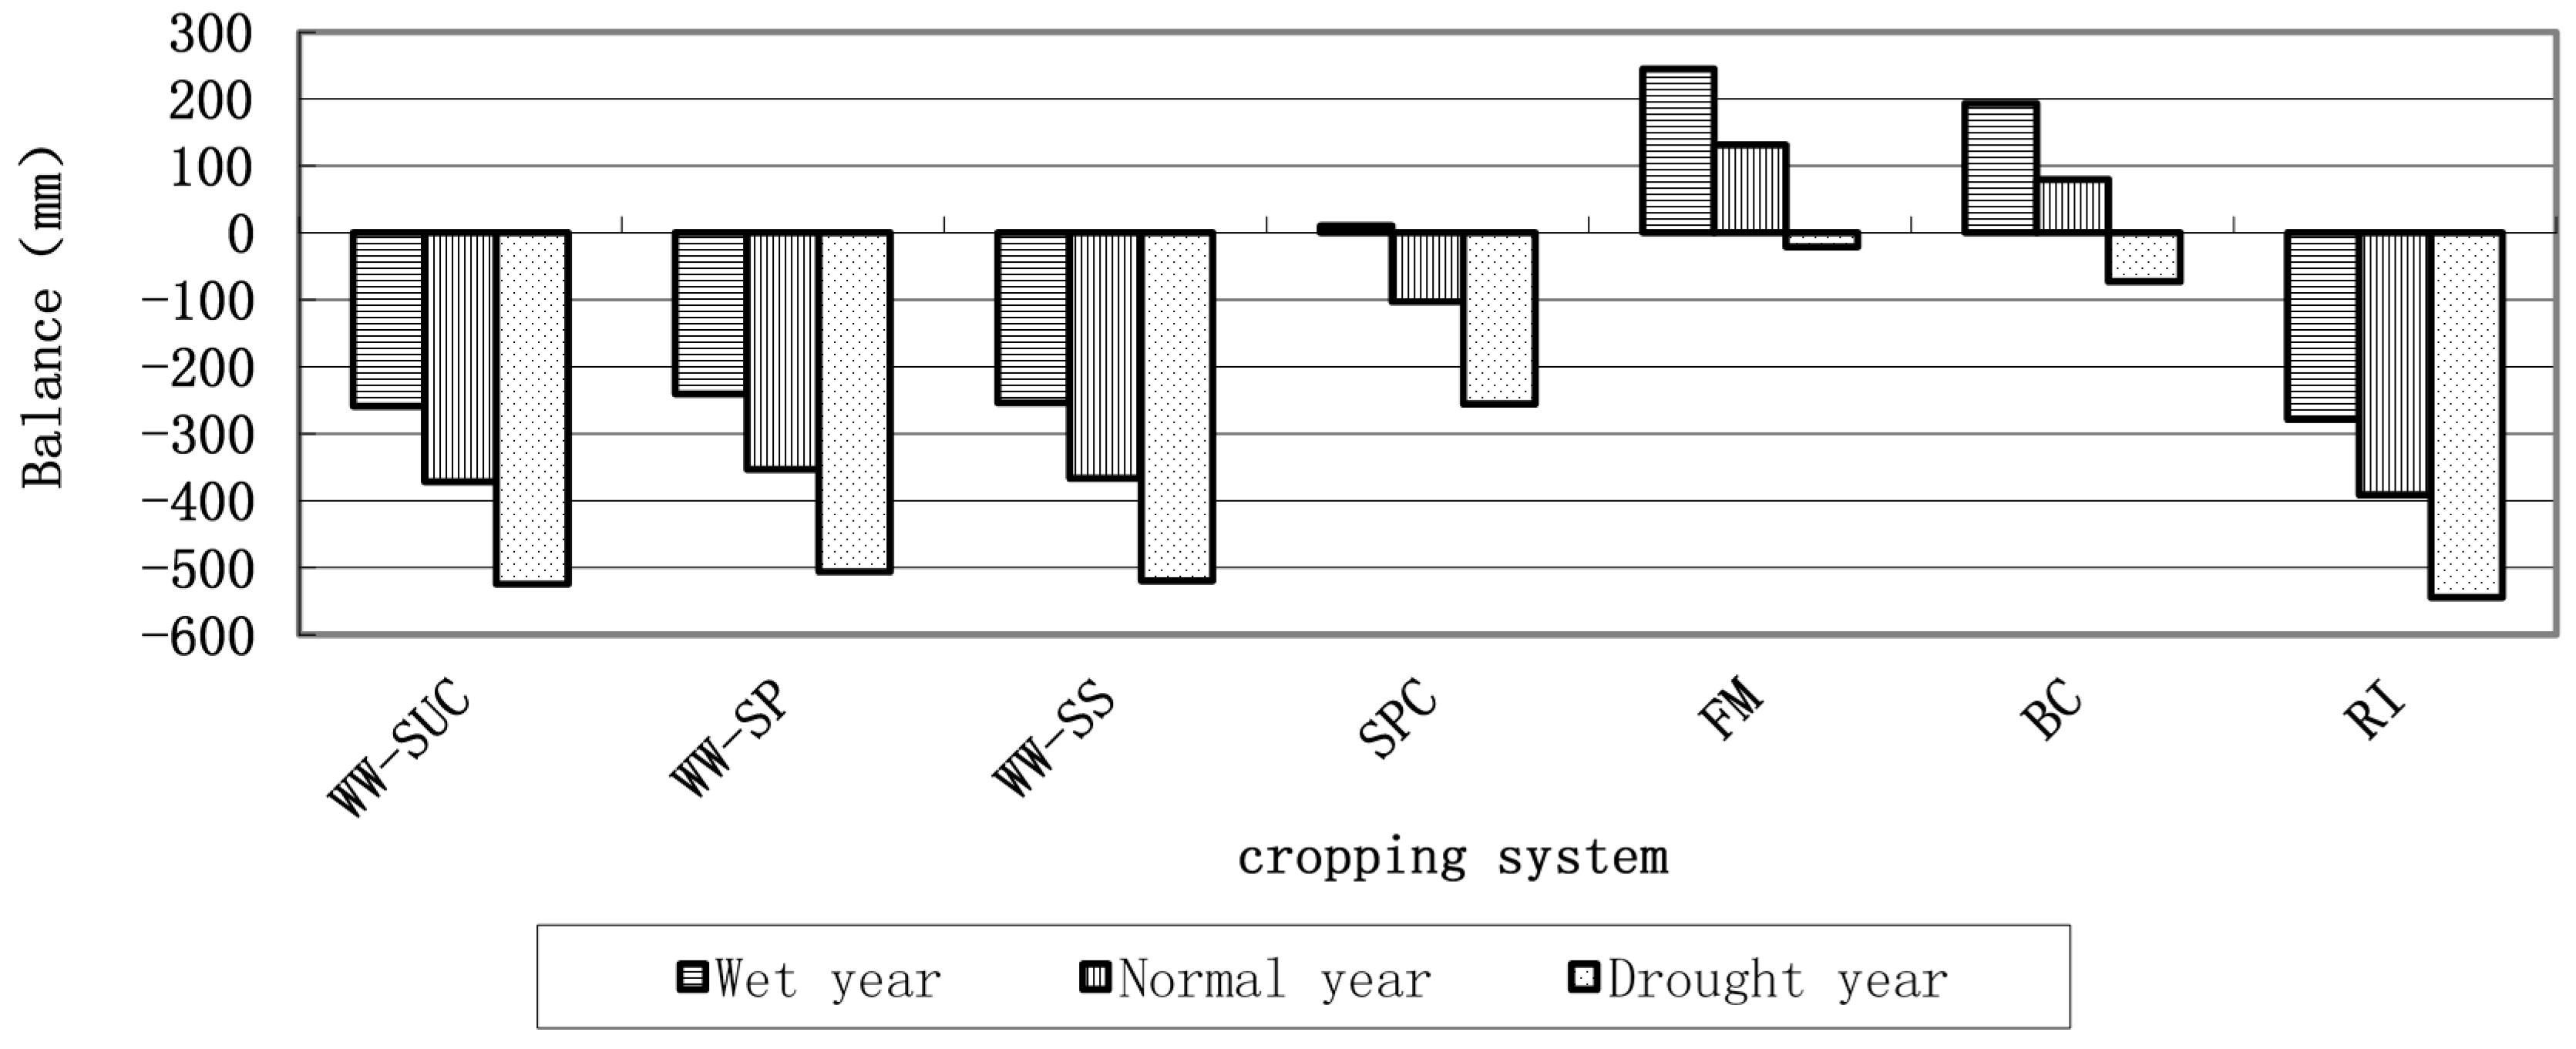
4.3. Assessment of Water Constraint Risk and Adjustment and Optimization of Cropping Systems
5. Discussion and Conclusions
Acknowledgments
Author Contributions
Conflicts of Interest
References
- Nafziger, E. Cropping System. Available online: http://extension.cropsciences.illinois.edu/handbook/ (accessed on 16 November 2016).
- Tumer, N.C. Further progress in crop water relations. Adv. Agron. 1997, 58, 293–337. [Google Scholar]
- Marvin, E.J. Water productivity: Science and practice beyond irrigation efficiency. Irrig. Sci. 2007, 25, 213–245. [Google Scholar]
- Ericksen, P.J.; Ingram, J.S.I.; Liverman, D. Food security and global environmental change: Emerging Challenges. Environ. Sci. Policy 2009, 12, 373–377. [Google Scholar] [CrossRef]
- De Fraiture, C.; Molden, D.; Wichelns, D. Investing in water for food, ecosystems, and livelihoods: An overview of the comprehensive assessment of water management in agriculture. Agric. Water Manag. 2010, 97, 495–501. [Google Scholar] [CrossRef]
- De Fraiture, C.; Wichelns, D. Satisfying future water demands for agriculture. Agric. Water Manag. 2010, 97, 502–511. [Google Scholar] [CrossRef]
- Gordon, L.J.; Finlayson, C.M.; Falkenmark, M. Managing water in agriculture for food production and other ecosystem services. Agric. Water Manag. 2010, 97, 512–519. [Google Scholar] [CrossRef]
- Liu, Y.L.; Pan, Z.H.; Zhuang, Q.L.; Miralles, D.G.; Teuling, A.J.; Zhang, T.L.; An, P.L.; Dong, Z.Q.; Zhang, J.T.; He, D.; et al. Agriculture intensifies soil moisture decline in Northern China. Sci. Rep. 2015, 5. [Google Scholar] [CrossRef] [PubMed] [Green Version]
- Liu, D.; Feng, Z.; Fang, Y. Agricultural restructuring considering crop water requirement cost in Beijing-Tianjin-Hebei region. Trans. CSAE 2007, 7, 58–63, (In Chinese with English Abstract). [Google Scholar]
- Gao, R.; Wang, W.; Song, L. Planting Planning in Beijing Region Based on Spatial Analysis of Crop Water Requirment. South-North Water Transf. Water Sci. Technol. 2009, 4, 109–112. (In Chinese) [Google Scholar]
- Seckler, D.; Molden, D.; Amarasinghe, U.; De Fraiture, C. Water Issues for 2025: A Research Perspective; International Water Management Institute: Colombo, Sri Lanka, 2000. [Google Scholar]
- Li, X. Countermeasure Study on Sustainable Exploitation of Agricultural Water Resources in Northwest China. Ph.D. Thesis, Huazhong Agricultural University, Wuhan, China, 2001. [Google Scholar]
- Yang, X.; Yao, X.; Pu, J. Changes of Arid Climate in Tianshui and Adjustment of Planting Structure of Summer and Autumn Crops. Adv. Clim. Chang. Res. 2009, 3, 179–184, (In Chinese with English Abstract). [Google Scholar]
- Zhang, G.; Liu, Z.; Fei, Y. The relationship between the distribution of irrigated crops and the supply capability of regional water resources in North China Plain. Acta Geosci. Sin. 2010, 1, 17–22, (In Chinese with English Abstract). [Google Scholar]
- Mowbray, A.H.; Blanchard, R.H. Insurance, Its Theory and Practice in the United States, 4th ed.; McGraw-Hill: New York, NY, USA, 1955. [Google Scholar]
- Crane, F.G. Insurance Principles and Practices, 2nd ed.; Wiley: New York, NY, USA, 1984. [Google Scholar]
- International Standards Organization (ISO). ISO Guide 73-2009; International Standards Organization: Geneva, Switzerland, 2009. [Google Scholar]
- Luko, S.N. Risk Management Terminology. Qual. Eng. 2013, 25, 292–297. [Google Scholar] [CrossRef]
- Intergovernmental Panel on Climate Change (IPCC). Climate Change 2014: Impacts, Adaptation and Vulnerability. Part A: Global and Sectoral Aspects. Contribution of Working Group II to the Fifth Assessment Report of the Intergovernmental Panel on Climate Change; Field, C.B., Barros, V.R., Dokken, D.J., Mach, K.J., Mastrandrea, M.D., Bilir, T.E., Chatterjee, M., Ebi, K.L., Estrada, Y.O., Genova, R.C., et al., Eds.; Cambridge University Press: Cambridge, UK, 2014. [Google Scholar]
- Food and Agriculture Organization of the United Nations (FAO). Crop Evapotranspiration—Guidelines for Computing Crop Water Requirements—FAO Irrigation and Drainage Paper 56; FAO: Rome, Italy, 1998; pp. 89–95. [Google Scholar]
- Wang, Y.; Wang, X.; Zhao, S. Relationship between Corn Yield and Soil Water in Different Growing Stages. Agric. Res. Arid Areas 1998, 1, 100–105, (In Chinese with English Abstract). [Google Scholar]
- Wang, M. Effects of Drought Stress in Different Development Stages on Wheat Yield. J. Anhui Agric. Sci. 2010, 5, 600–610, (In Chinese with English Abstract). [Google Scholar]


| Time | Typical Cropping System | Staple Crops | Area Proportion | Planting Pattern |
|---|---|---|---|---|
| Early to mid-1980s | Winter wheat–summer grain crops | Winter wheat–summer corn | 27.8% | Coexistence of flat cropping and intercropping |
| Winter wheat–summer peanut | 5.5% | |||
| Winter wheat–summer soybean | 3.1% | |||
| Single cropping of rice | Rice | 18.2% | ||
| Late 1980s to 1990s | Winter wheat–summer grain crops | Winter wheat–summer corn | 46.6% | Main flat cropping |
| Winter wheat–summer peanut | 10.0% | |||
| Winter wheat–summer soybean | 6.1% | |||
| After 2000 | Winter wheat–summer grain crops | Winter wheat–summer corn | 28.4% | Main flat cropping |
| Winter wheat–summer peanut | 8.5% | |||
| Winter wheat–summer soybean | 1.5% | |||
| Single cropping of spring corn | Spring corn | 26.6% |
| Cropping System | March | April | May | June | July | August | September | October | November | The Whole Period |
|---|---|---|---|---|---|---|---|---|---|---|
| Rice | 0.0 | 126.1 | 200.2 | 189.5 | 173.9 | 126.2 | 97.2 | 0.0 | 0.0 | 913.2 |
| Broomcorn | 0.0 | 45.8 | 77.0 | 86.9 | 101.4 | 82.0 | 48.6 | 0.0 | 0.0 | 441.8 |
| Foxtail millet | 0.0 | 45.8 | 77.0 | 83.7 | 101.4 | 82.0 | 0.0 | 0.0 | 0.0 | 390.0 |
| Spring corn | 0.0 | 45.8 | 92.4 | 126.3 | 166.6 | 121.2 | 72.0 | 0.0 | 0.0 | 624.4 |
| Winter wheat–summer corn | 70.9 | 160.4 | 169.4 | 102.7 | 121.7 | 138.8 | 92.4 | 24.1 | 13.0 | 893.4 |
| Winter wheat–summer peanut | 70.9 | 160.4 | 169.4 | 79.0 | 130.4 | 145.2 | 82.7 | 24.1 | 13.0 | 875.0 |
| Winter wheat–summer soybean | 70.9 | 160.4 | 169.4 | 94.8 | 137.7 | 145.2 | 72.9 | 24.1 | 13.0 | 888.3 |
| Cropping System | Precipitation Year Type | April | May | June | July | August | September | Whole Period | Mean Value |
|---|---|---|---|---|---|---|---|---|---|
| Rice | Wet year | 0.16 | 0.22 | 0.44 | 1.00 | 1.00 | 0.62 | 0.56 | 0.46 |
| Normal year | 0.28 | 0.19 | 0.4 | 0.55 | 1.00 | 0.56 | 0.47 | ||
| Drought year | 0.16 | 0.14 | 0.28 | 0.75 | 0.57 | 0.29 | 0.36 | ||
| Broomcorn | Wet year | 0.45 | 0.58 | 0.97 | 1.00 | 1.00 | 1.00 | 0.86 | 0.80 |
| Normal year | 0.76 | 0.51 | 0.88 | 0.95 | 1.00 | 1.00 | 0.85 | ||
| Drought year | 0.43 | 0.37 | 0.62 | 1.00 | 0.88 | 0.58 | 0.69 | ||
| Foxtail millet | Wet year | 0.45 | 0.58 | 1.00 | 1.00 | 1.00 | - | 0.85 | 0.80 |
| Normal year | 0.76 | 0.51 | 0.91 | 0.95 | 1.00 | - | 0.84 | ||
| Drought year | 0.43 | 0.37 | 0.64 | 1.00 | 0.88 | - | 0.71 | ||
| Spring corn | Wet year | 0.45 | 0.47 | 0.67 | 1.00 | 1.00 | 0.83 | 0.79 | 0.67 |
| Normal year | 0.76 | 0.44 | 0.6 | 0.58 | 1.00 | 0.76 | 0.68 | ||
| Drought year | 0.43 | 0.28 | 0.42 | 0.78 | 0.6 | 0.39 | 0.53 |
| Cropping System | Precipitation Year Type | March | April | May | June | July | August | September | October | November | Annual | Mean Values |
|---|---|---|---|---|---|---|---|---|---|---|---|---|
| Winter wheat–summer corn | Wet year | 0.18 | 0.13 | 0.26 | 0.82 | 1.00 | 1.00 | 0.65 | 1.00 | 0.62 | 0.60 | 0.55 |
| Normal year | 0.21 | 0.22 | 0.23 | 0.74 | 0.79 | 1.00 | 0.59 | 0.97 | 0.88 | 0.57 | ||
| Drought year | 0.07 | 0.12 | 0.17 | 0.52 | 1.00 | 0.52 | 0.31 | 0.89 | 0.77 | 0.47 | ||
| Winter wheat–summer soybean | Wet year | 0.18 | 0.13 | 0.26 | 1.00 | 1.00 | 1.00 | 0.72 | 1.00 | 0.62 | 0.60 | 0.53 |
| Normal year | 0.21 | 0.22 | 0.23 | 0.97 | 0.74 | 1.00 | 0.66 | 0.97 | 0.88 | 0.57 | ||
| Drought year | 0.07 | 0.12 | 0.17 | 0.68 | 1.00 | 0.50 | 0.34 | 0.89 | 0.77 | 0.42 | ||
| Winter wheat–summer peanut | Wet year | 0.18 | 0.13 | 0.26 | 0.89 | 1.00 | 1.00 | 0.82 | 1.00 | 0.62 | 0.60 | 0.53 |
| Normal year | 0.21 | 0.22 | 0.23 | 0.81 | 0.70 | 1.00 | 0.75 | 0.97 | 0.88 | 0.56 | ||
| Drought year | 0.07 | 0.12 | 0.17 | 0.56 | 0.95 | 0.50 | 0.39 | 0.89 | 0.77 | 0.42 |
| Crop | Rice | Wheat | Summer Corn | Broomcorn | Foxtail Millet | Summer Soybean | Summer Peanut | Spring Corn |
|---|---|---|---|---|---|---|---|---|
| Wet year | 270.47 | 435.59 | 1.20 | 221.20 | 217.50 | 40.07 | 8.34 | 2.29 |
| Normal year | 325.79 | 462.39 | 2.18 | 237.00 | 232.00 | 136.24 | 25.03 | 3.49 |
| Drought year | 393.40 | 469.09 | 4.36 | 489.80 | 420.50 | 296.52 | 58.40 | 5.13 |
| Mean | 332.33 | 455.47 | 2.68 | 329.25 | 299.82 | 164.16 | 32.03 | 3.70 |
© 2016 by the authors; licensee MDPI, Basel, Switzerland. This article is an open access article distributed under the terms and conditions of the Creative Commons Attribution (CC-BY) license (http://creativecommons.org/licenses/by/4.0/).
Share and Cite
An, P.; Ren, W.; Liu, X.; Song, M.; Li, X. Adjustment and Optimization of the Cropping Systems under Water Constraint. Sustainability 2016, 8, 1207. https://doi.org/10.3390/su8121207
An P, Ren W, Liu X, Song M, Li X. Adjustment and Optimization of the Cropping Systems under Water Constraint. Sustainability. 2016; 8(12):1207. https://doi.org/10.3390/su8121207
Chicago/Turabian StyleAn, Pingli, Wei Ren, Xilin Liu, Mengmei Song, and Xuemin Li. 2016. "Adjustment and Optimization of the Cropping Systems under Water Constraint" Sustainability 8, no. 12: 1207. https://doi.org/10.3390/su8121207